Article

Monitored and Predicted Data for a Diesel Fuel Hydrotreating Reactor

by
Laura Elisabeta Petraş
1,2,
Tănase Dobre
1,3,*,
Nela Şerbănescu
2,
Florian Daniel Pop
2 and
Oana Cristina Pârvulescu
1,*
1
Chemical and Biochemical Department, National University of Science and Technology POLITEHNICA Bucharest, 1-7 Gheorghe Polizu, 011061 Bucharest, Romania
2
Petromidia Refinery, 214 Năvodari Bld., 905700 Năvodari, Romania
3
Technical Sciences Academy of Romania, 26 Dacia Bld., 030167 Bucharest, Romania
*
Authors to whom correspondence should be addressed.
Materials 2025, 18(11), 2481; https://doi.org/10.3390/ma18112481
Submission received: 9 April 2025 / Revised: 15 May 2025 / Accepted: 23 May 2025 / Published: 25 May 2025
(This article belongs to the Section Energy Materials)

Abstract

:
A mathematical model based on power law kinetics was selected to simulate the hydrotreating process of diesel fuel (also called diesel oil or diesel), assuming hydrogenation reactions of sulfur compounds, nitrogen compounds, aromatic compounds, and olefins. The process efficiency depended on the diesel flow rate, catalyst volume, hydrogenation reaction rate constants, and reaction orders. The reaction rate constants were expressed as functions of the mean temperature in the catalyst bed using the Arrhenius equation. The parameters of the Arrhenius equation for the hydrogenation of sulfur and nitrogen compounds, i.e., the pre-exponential factors (6.515–15.62·104 h−1) and activation energies (47.24–66.13 kJ/mol), were estimated based on monitoring data obtained in an industrial plant. The results obtained suggested that the catalyst used in the industrial reactor had almost equal specificity for the hydrogenation of sulfur and nitrogen compounds.

1. Introduction

Hydrotreating (HT) of oil products is a catalytic process in which the products are stabilized by hydrogenation of unsaturated hydrocarbons and/or removal of contaminants such as sulfur, nitrogen, oxygen, and metals (Ni, V) from feedstock by reacting them with hydrogen (H2), under relatively high temperature and pressure [1,2]. Several hydrogenation reactions occur simultaneously in the HT process, i.e., hydrodesulfurization (HDS), hydrodenitrogenation (HDN), hydrodearomatization (HDA), hydrodemetallization (HDM), hydrodeoxygenation (HDO), and olefin saturation (OS) [1,2,3]. Most crude oils contain low levels of oxygen, and consequently HDO is less of a concern. The HT process occurs as follows: a mixture of hydrocarbon feedstock and H2 is heated to a designed inlet temperature and then introduced into the catalytic reactor, loaded with a suitable catalyst, where the H2 reacts with the oil to produce mainly saturated hydrocarbons, hydrogen sulphide (H2S), and ammonia (NH3).
For the first time, HT was established as a process in the preprocessing of petroleum products for catalytic cracking in order to avoid the degradation of catalysts. Starting with the 1990s, HT turned into advanced HT, the goal being to have the content of sulfur compounds in fuels at the pump extremely low (below 10 ppm, according to the USA and EU regulations [4,5]). Advanced HT is essential for meeting strict air pollutant emission regulations.
Five cases of HT, of which four are advanced HT, are reported in the crude oil processing technology presented in Figure 1, where the chemical processing of products from crude oil atmosphere distillation (AD) and vacuum distillation (VD) is marked [6]. The reactor effluent enters high-pressure and low-pressure separators where the liquid and gaseous products are separated. Depending on the case, the liquid product is sent to the fractionation units for further separation. Unreacted H2 is usually recovered from the gaseous product and recycled to the reactor with a small purge, which eliminates the possibility of accumulation of undesired compounds in the recycled H2 [7]. At most refineries, the mixture entering the HT reactor consists of diesel from the AD, light diesel from the VD, and kerosene from the AD (Figure 1). The concentrations of sulfur and nitrogen compounds in this mixture are generally 0.6–1 wt% and 0.1–0.3 wt%, respectively, those of aromatic compounds and olefins 26–35 wt%, and the mixture density typically ranges from 830 kg/m3 to 850 kg/m3.
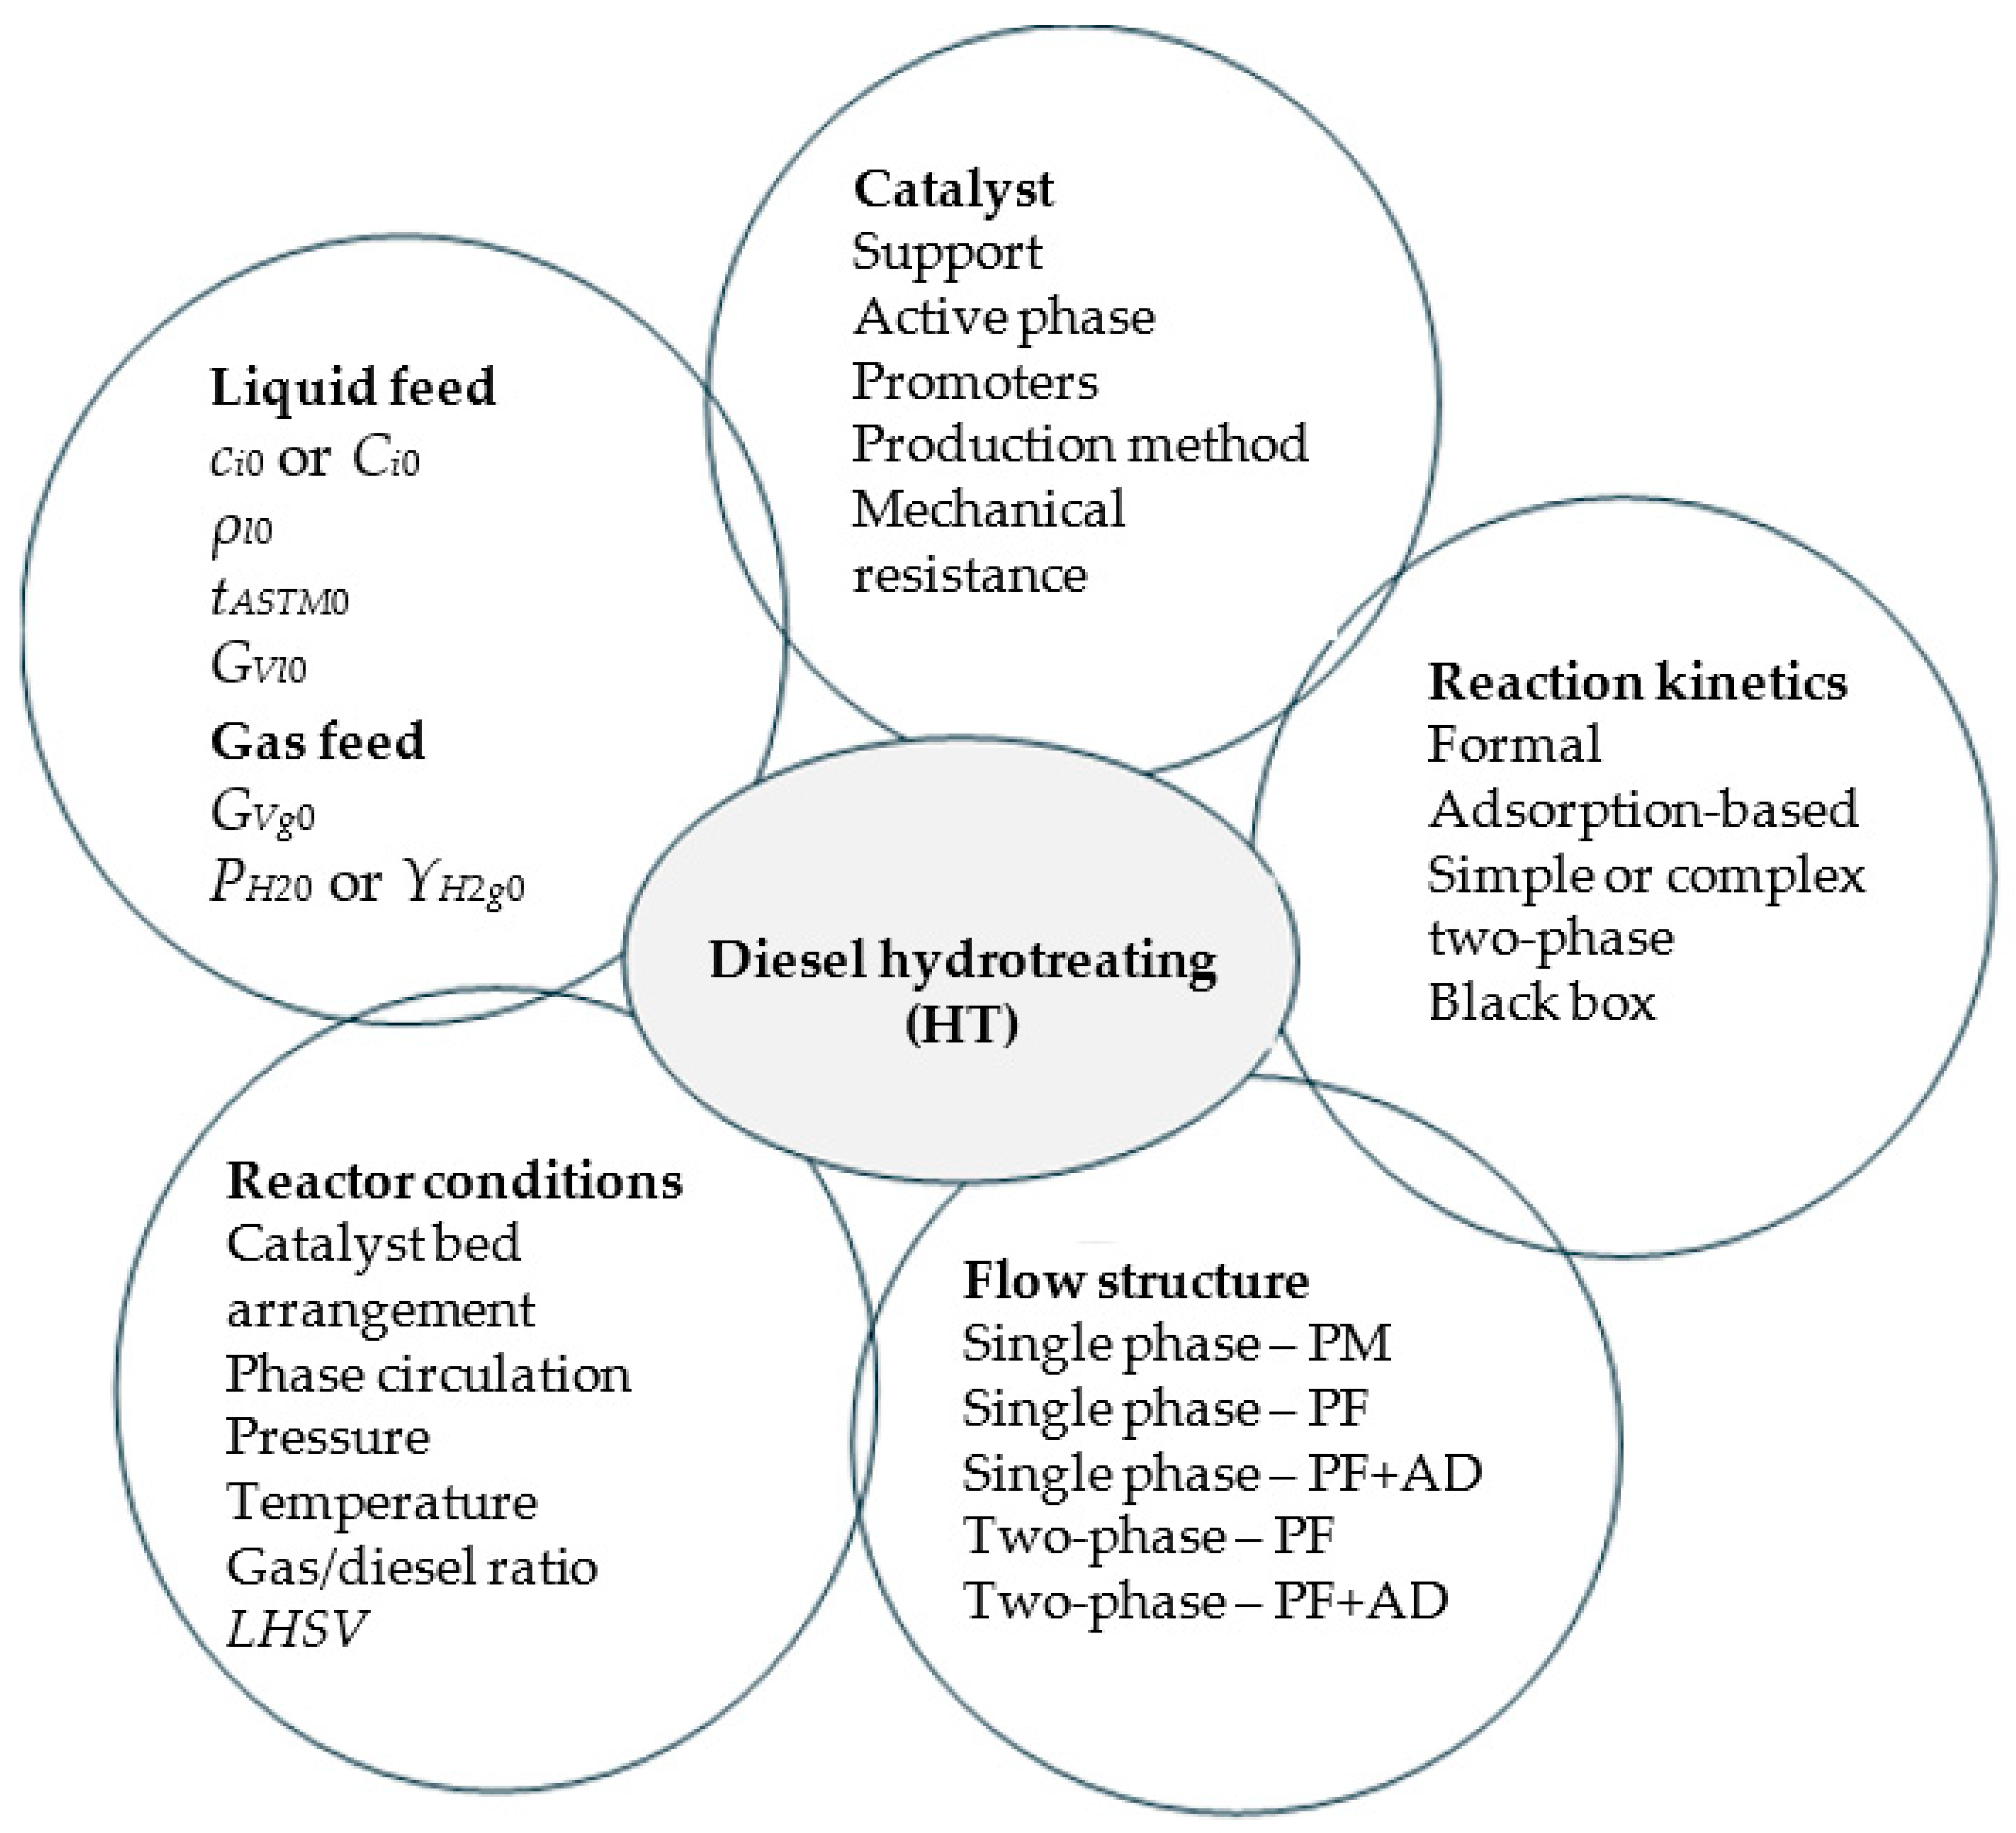
The main factors affecting the HT process of diesel fuel are listed in Figure 2 [1,2,3,8,9]. Pressure (P), temperature (t), partial pressures of H2 in the gas feed (PH20) or molar percentage of H2 (H2 purity) in the gas feed (YH2g0 = 100PH20/P), gas/diesel volumetric ratio (rgl), and liquid hourly space velocity (LHSV), i.e., the ratio of diesel volumetric flow rate to catalyst volume, are usually selected as quantitative independent variables (factors) of the HT process. The values of process factors depend on the type of the feedstock and the desired product specifications. The data summarized in Table 1 highlight that for low-boiling petroleum feedstock, e.g., naphtha, the levels of P and t in the ranges of 1.5–3.5 MPa and 260–340 °C, respectively, are sufficient for HT. However, for high-boiling petroleum feedstock, more severe conditions are required, i.e., 3.1–6.2 MPa and 330–410 °C, respectively.
A high pressure increases the solubility of H2 in the liquid phase, thus determining its better accessibility to the active centers of the catalyst. The levels of t are determined by the mechanism of catalytic processes specific to active catalytic centers, whose activation is also linked to t. The levels of PH20 and rgl are related, i.e., a low level of PH20 requires a high level of rgl. If the value of rgl is too low, a rapid deactivation of the catalyst occurs. As a rule, the minimum level of rgl should be at least five times the amount of H2 consumed in the characteristic chemical reactions of the HT process [15]. For HDS and HDN, there is an optimal value for rgl, which depends on the nature of the feedstock and operating conditions [16]. Unreacted H2 is recovered from the reactor effluent and recycled to the hydrotreater. Purging a small part of the gas effluent, enriching it in H2 through a suitable technological solution (e.g., membrane separation), and supplementing H2 as pure as possible, lead to maintaining the purity of H2 entering the reactor at over 90 mol%. At H2 purities lower than those specified in Table 1, achieving advanced HT requires an increase in t, resulting in a faster deactivation of the catalyst.
Regarding the effect of H2 purity on HDS, HDN, and HDA, a study on the HT of a vacuum gas oil (VGO) Arabian Light (with the following levels of sulfur, nitrogen, and aromatic compound contents at the reactor inlet: CS0 = 2.430 wt% = 24,300 ppm, CN0 = 0.065 wt% = 650 ppm, and CA0 = 47 wt%) reported that the sulfur, nitrogen, and aromatic compound contents of the hydrotreated VGO (CSe, CNe, and CAe) decreased as PH20 increased from 70 to 140 bar, i.e., CSe decreased from 200 to 40 ppm, CNe from 10 to 1 ppm, and CAe from 31 to 9.6 wt% [17]. This indicates that HDN was more sensitive than HDS and HDA to the partial pressure of H2.
The type of catalyst is a qualitative factor that can significantly improve the process performance [18,19,20,21]. The catalysts widely used in the HT process are synthesized in the form of oxide on Al2O3 support and then activated by converting them into sulfide form through a sulfidation procedure [18]. The active phase for the HT catalysts used in industrial reactors is usually CoMoS or NiMoS [18]. The key element for the catalyst activity is the concept of vacancy [19,21]. When H2 reacts with a surface sulfide group, H2S is released and an S vacancy is created. The size and shape of the catalyst as well as its wettability by the processed liquid are of great interest because they determine the phase flow structure and the value of the solid–liquid or gas–liquid specific surface area. Moreover, the catalyst particles should have a good mechanical resistance.
Modelling is a valuable tool in the design, control, and optimization of chemical processes [22,23]. A dynamic or stationary mathematical model for a HT reactor should contain the equations for [23,24,25,26,27,28,29,30]: (i) species mass balance in the liquid and gas phases (depending on flow structure); (ii) catalytic process kinetics for all species; (iii) interphase equilibrium for the species that perform interphase transfer; (iv) species transfer kinetics at the solid–liquid and gas–liquid interfaces.
Global kinetic (GK) models, including the power law (PL), Langmuir–Hinshelwood (L–H), and multi-parameter (MP) kinetic models, are widely used to predict the hydrogenation reaction rates [31,32,33,34,35,36,37,38,39,40,41,42,43,44,45,46]. GK models for a HT reactor are based on the following simplifying assumptions: (i) stationary state; (ii) plug flow of the gas phase; (iii) a large excess of H2 in the gas phase compared to the stoichiometry of the chemical reactions; (iv) perfectly mixed liquid phase; (v) the pressure and purity of H2 in the gas phase are high enough so that its concentration in the liquid phase is close to the saturation concentration; and (vi) the interphase transfer of any species is much faster compared to the chemical reactions.
In a PL model, the rates of catalytic chemical reactions are expressed by power law relationships. L–H models are characterized by the fact that the expression for the reaction rate contains, in order to take into account the catalyst inhibition, the species adsorption on the catalyst surface [32,33,34,36,39]. MP models are similar to PL models but take into account the effects of more variables on the hydrotreating process, e.g., PH2, rgl [32].
In our previous paper [41], a simple model based on PL kinetics and reaction order (ni) of 1 for the hydrogenation of Si species (sulfur compounds, nitrogen compounds, aromatic compounds, and olefins) was used to predict the performance of diesel HT. The model parameters, namely the activation energies for hydrogenation reactions and pre-exponential factors in the Arrhenius equation (Ehi and khi0), were selected from data reported in the literature. In this paper, the previous model was developed, and its adjustable parameters, i.e., Ehi, khi0, and ni, were estimated based on monitoring data obtained in an industrial plant. The model could be useful for industrial process control and optimization of relevant factors.

2. Materials and Methods

2.1. Modelling

PL kinetic models assume that the hydrogenation mechanism of Si species is described by an equilibrium reaction expressed by Equation (1), where khi (h−1) is the hydrogenation reaction rate constant and kdhi (h−1) the dehydrogenation reaction rate constant.
S i + a i H 2 k d h i k h i S i H 2 a i Products
Assuming khi >> kdhi and an excess of H2, then the chemical reaction rate of Si species (vri) can be described by Equation (2), where ci (kg/m3) represents the mass concentration of Si species in the liquid phase, τ (h) the time, and ni the reaction order. For HDS and HDN, this assumption is valid at t > 360 °C.
v r i = d c i d τ = k h i c i n i
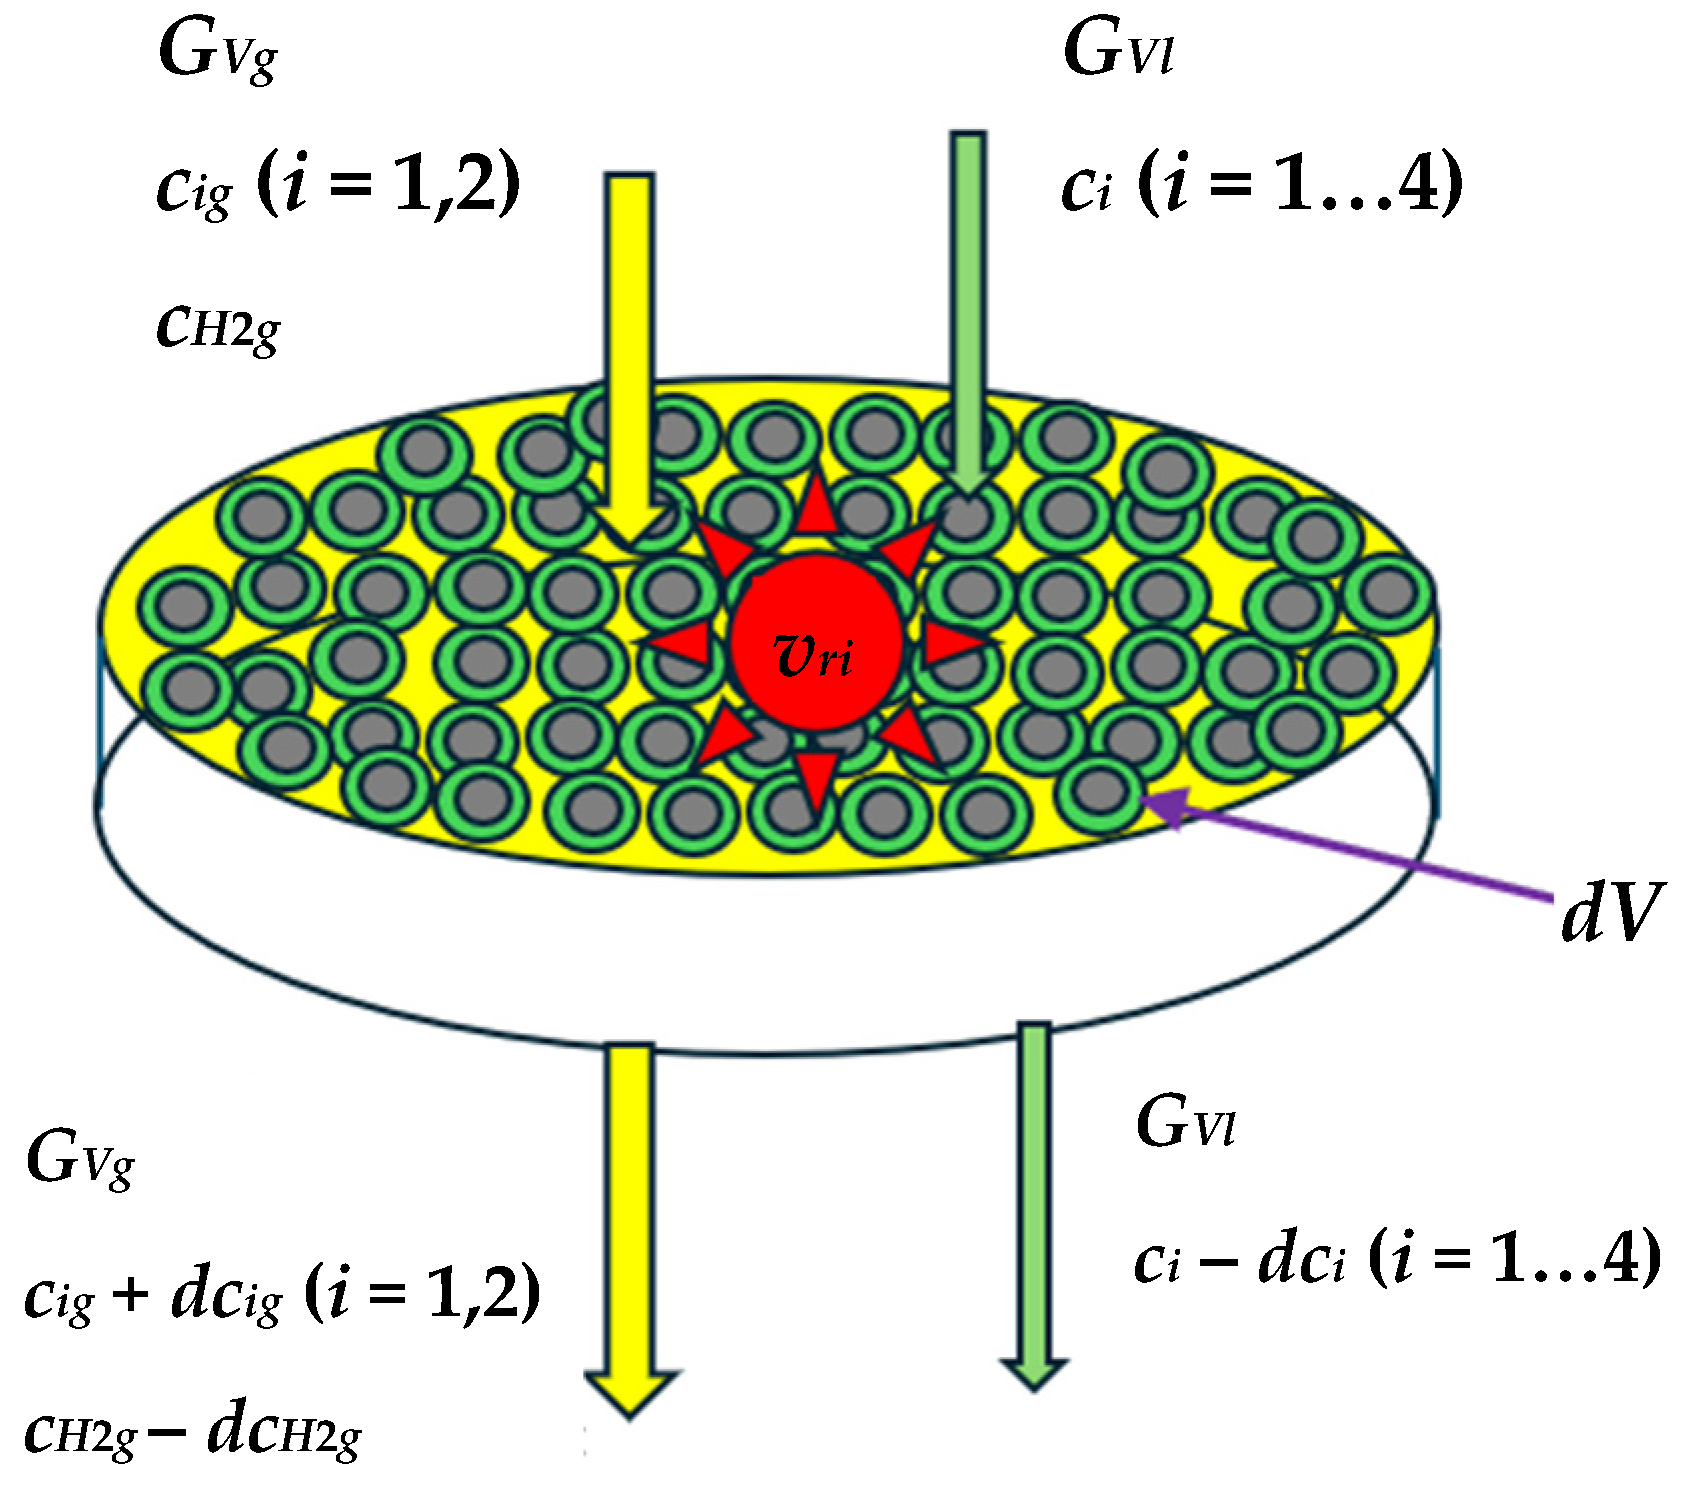
The mass balances of Si species in the liquid and gas phases are given by Equations (3) and (4), where cig (kg/m3) represents the mass concentration of Si species in the gas phase, dV (m3) is the elementary volume of the catalyst (Figure 3), GVl and GVg are the volumetric flow rates (m3/h) of liquid and gas phases, α1 is the stoichiometric ratio between hydrogen sulfide (H2S) and sulfur compounds, and α2 the stoichiometric ratio between ammonia (NH3) and nitrogen compounds.
G V l d c i = k h i c i n i d V , i = 1 4
G V g d c i g = α i k h i c i n i d V , i = 1 , 2
Differential Equations (5) and (6) were obtained by rearranging the terms in Equations (3) and (4). The mass balance of H2 in the gas phase is expressed by Equation (7), where cH2g (kg/m3) is the mass concentration of H2 in the gas phase and βi (i = 1…4) represent the stoichiometric ratios between H2 and different species, i.e., sulfur compounds (β1), nitrogen compounds (β2), aromatic compounds (β3), and olefins (β4).
d c i d V = k h i G V l c i n i , i = 1 4
d c i g d V = α i k h i G V g c i n i , i = 1 , 2
d c H 2 g d V = i = 1 4 β i k h i G V g c i n i
For a perfectly mixed liquid phase and low concentrations of the target compounds in the hydrogenation process, i.e., sulfur compounds, nitrogen compounds, aromatic compounds, and olefins, Equation (5) can be integrated analytically. Accordingly, taking into account the boundary condition expressed by Equation (8), the solutions of Equation (5) are given by Equations (9) and (10) for ni = 1 and ni ≠ 1, respectively, where τLHSV = 1/LHSV (h) represents the residence time of the liquid phase in the catalyst bed, V (m3) is the catalyst volume, and ci0, cig0, and cH2g0 are the mass concentrations (kg/m3) of Si species and H2 at V = 0.
V = 0 , c i = c i 0 i = 1...4 , c i g = c i g 0 = 0 i = 1 , 2 , c H 2 g = c H 2 g 0
c i c i 0 = exp k h i G V l V = exp k h i τ L H S V , i = 1 4 , n i = 1
c i c i 0 = 1 1 + c i n i 1 n i 1 k h i G V l V 1 n i 1 = 1 1 + c i n i 1 n i 1 k h i τ L H S V 1 n i 1 , i = 1 4 , n i 1
Hydrogenation degrees of Si species (ηi) are expressed depending on the ci/ci0 ratio using Equations (11) and (12) for ni = 1 and ni ≠ 1, respectively.
η i = 1 c i c i 0 = 1 exp k h i τ L H S V , i = 1 4 , n i = 1
η i = 1 c i c i 0 = 1 1 1 + c i n i 1 n i 1 k h i τ L H S V 1 n i 1 , i = 1 4 , n i 1
The hydrogenation reaction rate constant of Si species (khi) can be expressed depending on the mean absolute temperature in the catalyst bed (Tm.bed) using the Arrhenius Equation (13), where Ehi (kJ/mol) represents the activation energy for the hydrogenation reaction, khi0 (h−1) the pre-exponential factor, and R (kJ/molK) the universal gas constant. Equations (14) and (15) were obtained by substituting Equation (13) into Equations (9) and (10).
k h i = k h i 0 exp E h i R T m , b e d
c i c i 0 = exp V k h i 0 exp E h i R T m , b e d G V l , i = 1 4 , n i = 1
c i c i 0 = 1 1 + c i n i 1 n i 1 V k h i 0 exp E h i R T m , b e d G V l 1 n i 1 , i = 1 4 , n i 1

2.2. Experimental

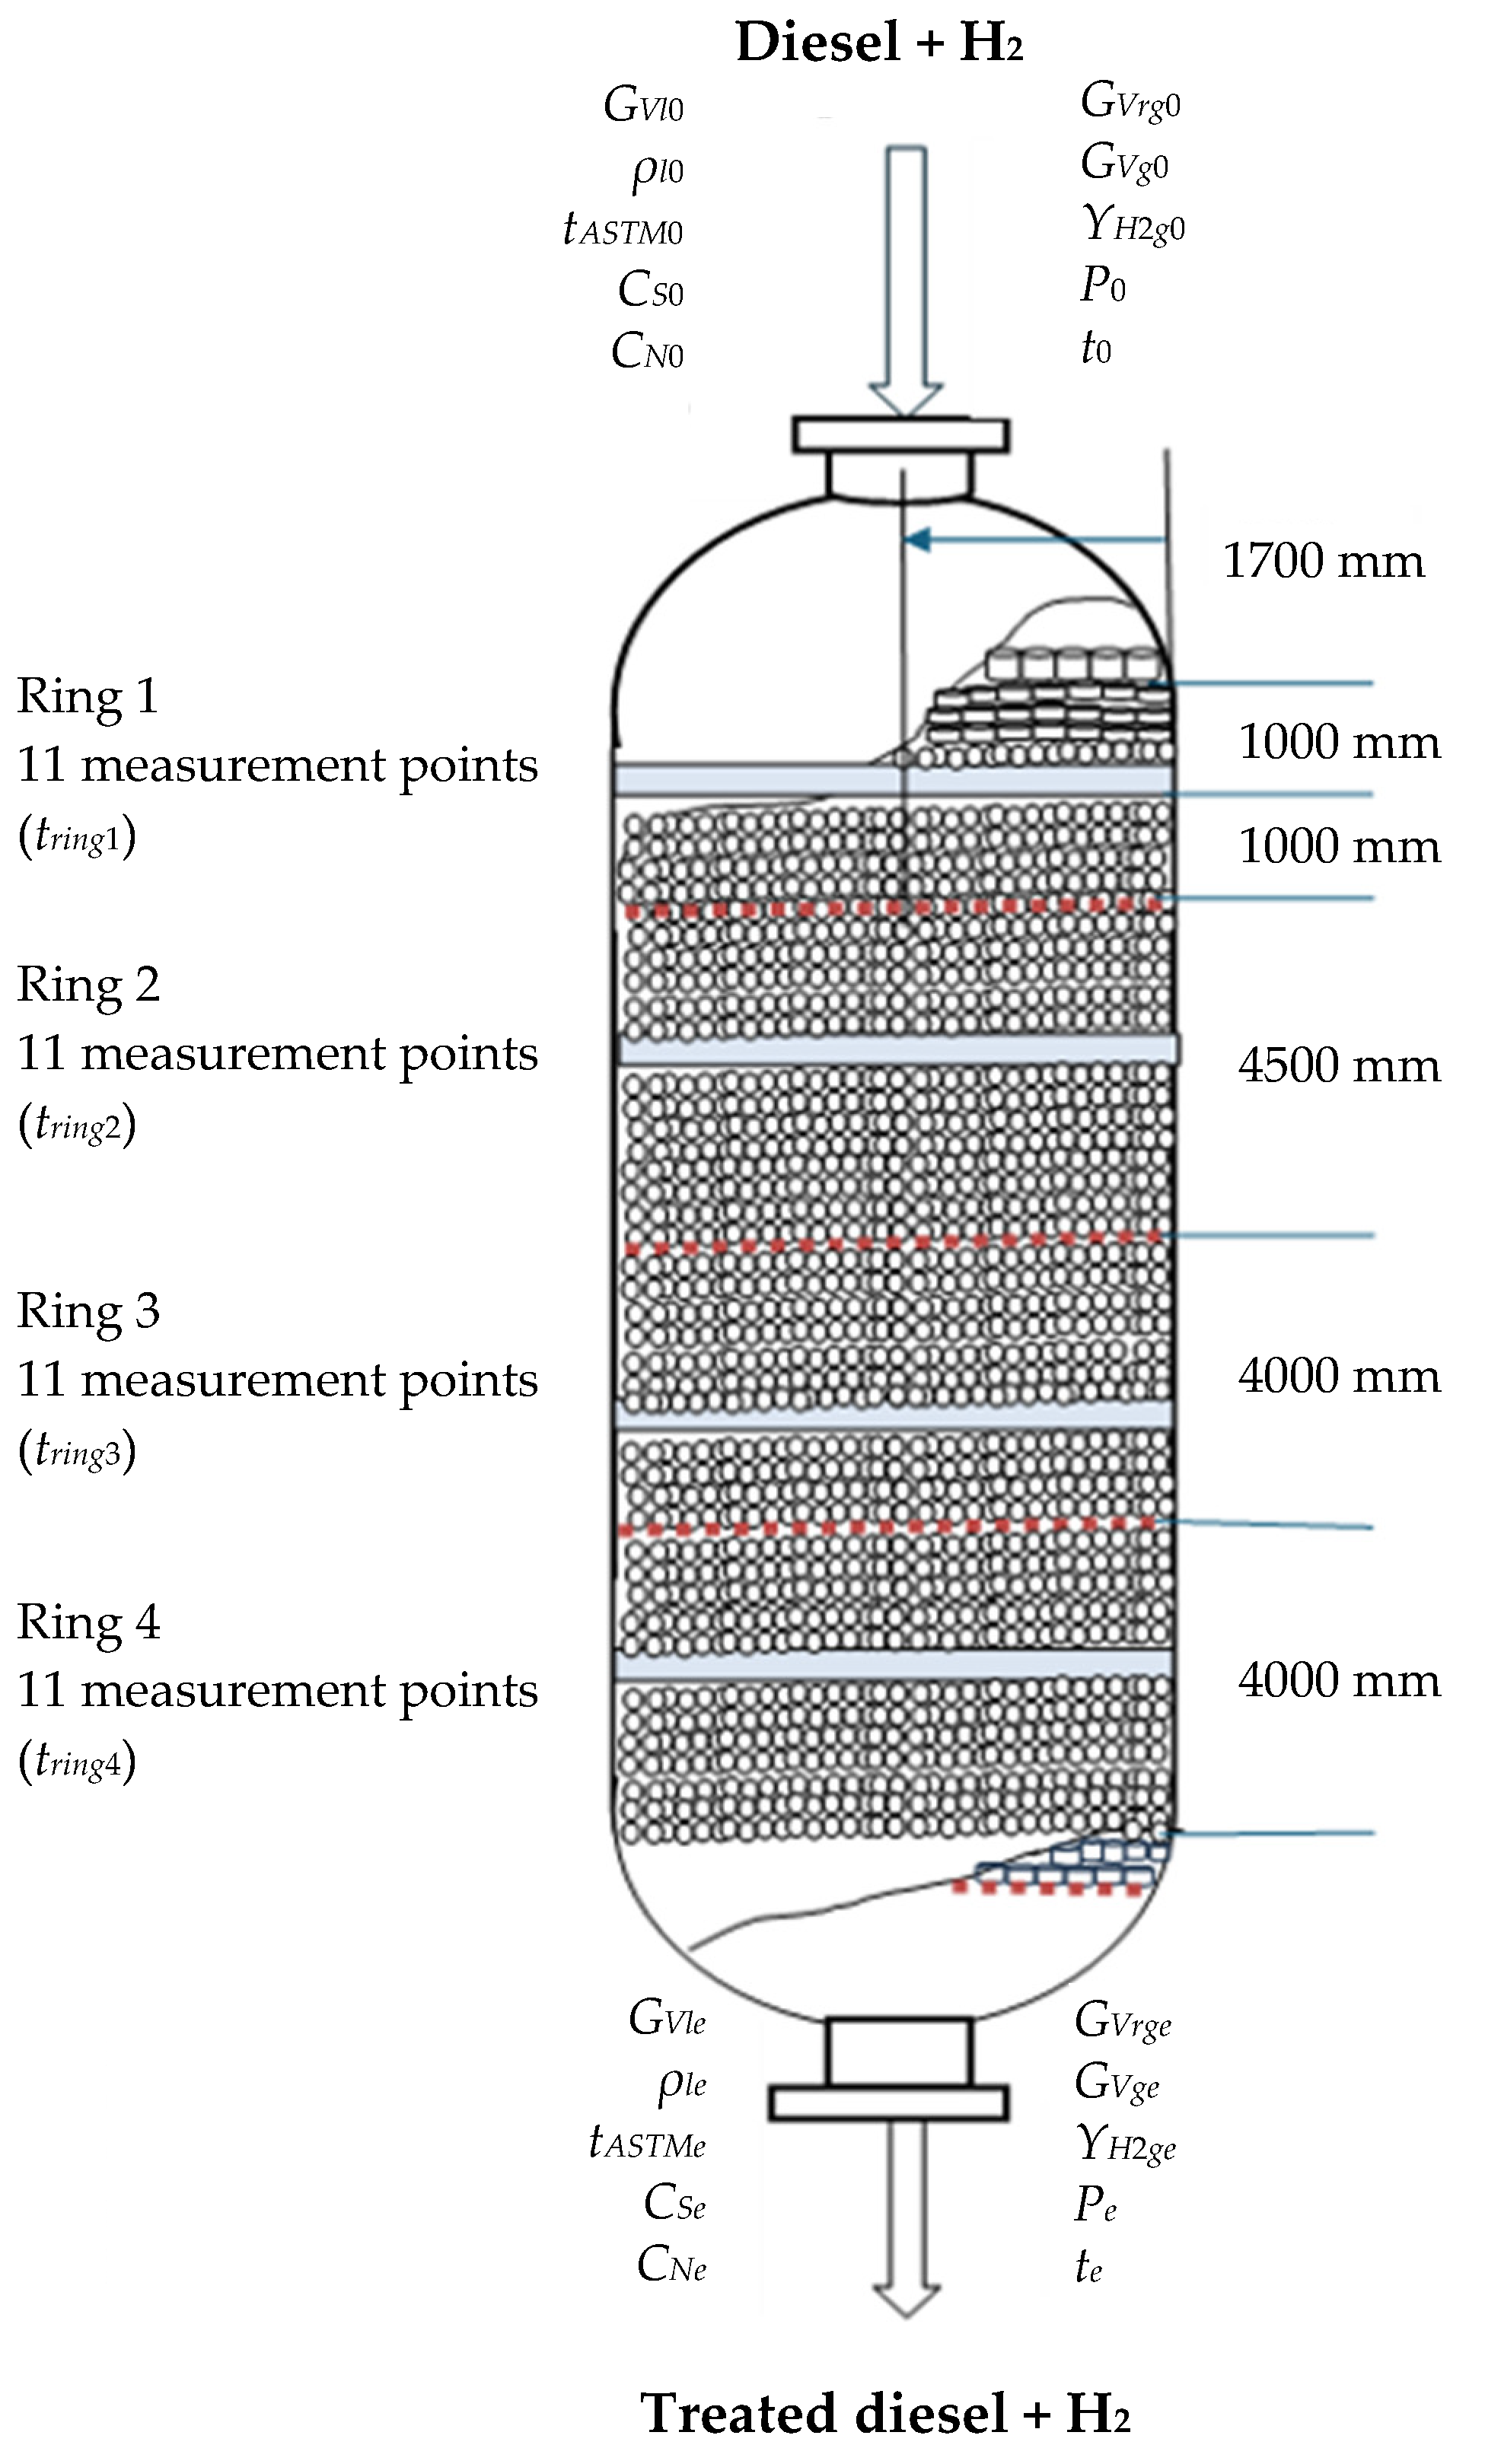
Data from a 50-day monitoring set of a reactor in a diesel HT plant with a mean capacity of 100 m3/h diesel were provided by Petromidia Refinery (Năvodari, Romania). A schema of the HT reactor, including some geometric dimensions and monitored process variables, is shown in Figure 4. The following variables were measured at the inlet (0) and outlet (e) of the reactor: diesel volumetric flow rate (GVl), diesel density (ρl), diesel ASTM 50% distillation temperature (tASTM), diesel sulfur and nitrogen mass percentages (CS = 100cS/ρl and CN = 100cN/ρl), volumetric flow rate of recycled gas (GVrg), total volumetric flow rate of gas phase (GVg), H2 purity in the gas phase (YH2g = 100PH2/P), pressure (P), and temperature (t). Moreover, temperatures in the areas of rings 1–4 (11 measurements points for each ring), i.e., tring1, tring2, tring3, and tring4, were monitored.

2.3. Data Processing

The data were processed using Mathcad 14 (PTC, Boston, MA, USA).

3. Results and Discussion

3.1. Monitored and Predicted Dynamics of Sulfur and Nitrogen Compound Concentrations in Diesel Fuel at the Reactor Outlet

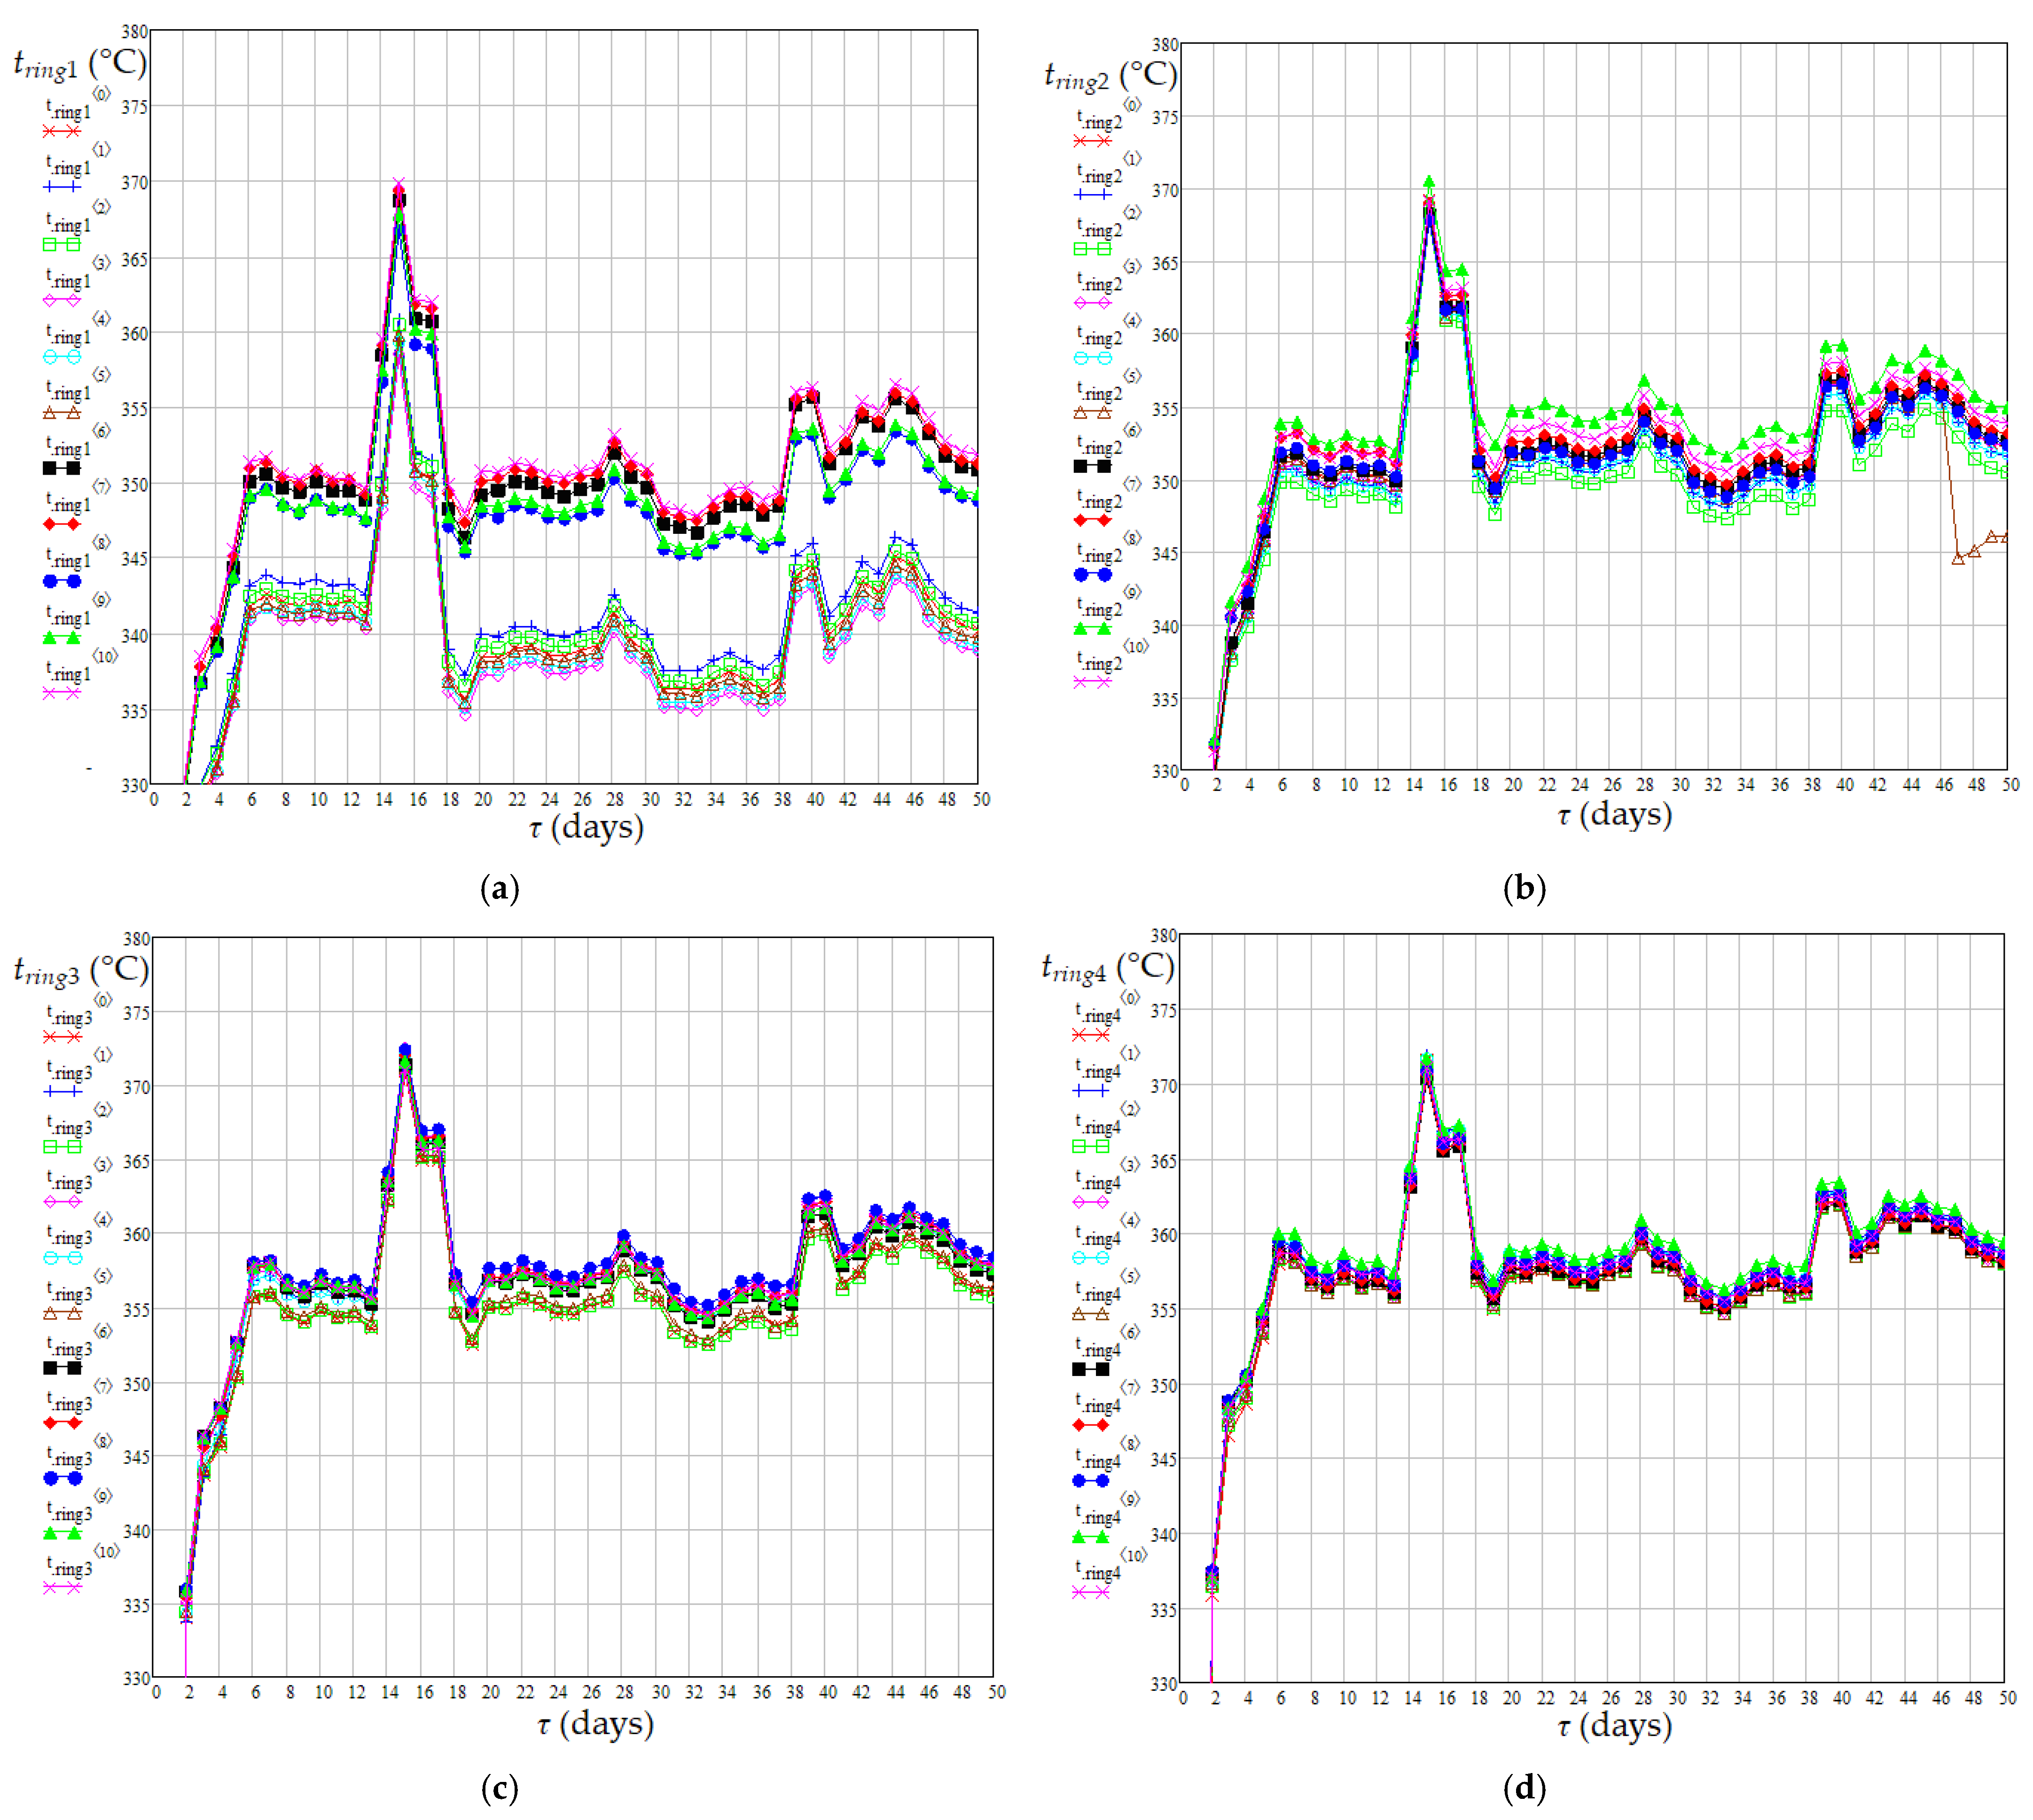
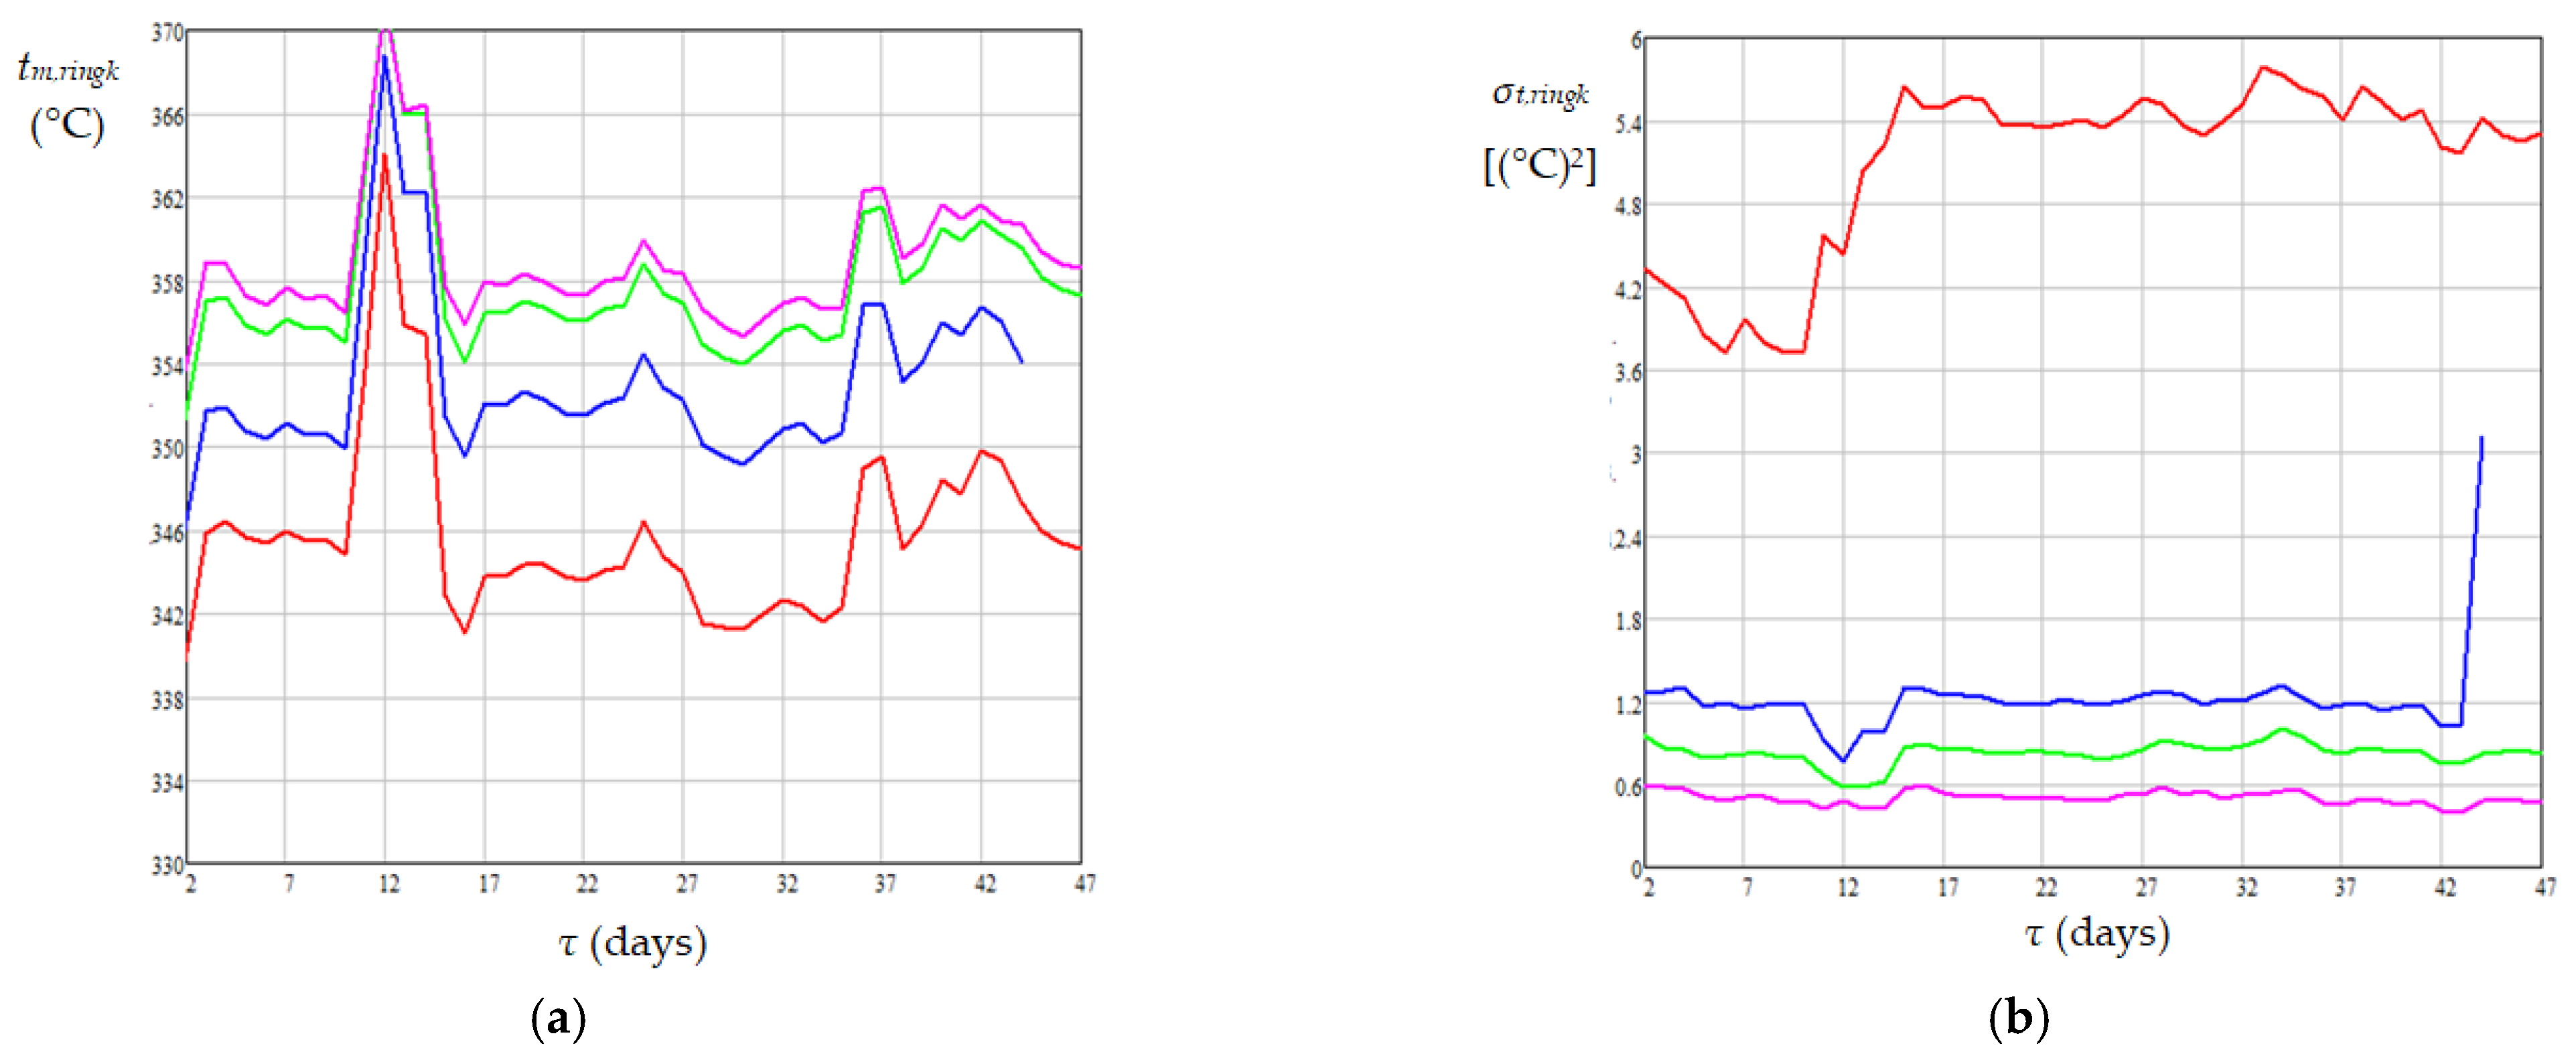
The results of temperature monitoring for 50 days at 11 measurement points in the areas of rings 1–4 are shown in Figure 5. Mean values of daily temperatures obtained from 11 measurements for each ring and related dispersions of temperature values around the mean values are shown in Figure 6.
For a model with ni = 1 (i = 1,2), the identification of the adjustable parameters (khi0 and Ehi) is based on the minimization of the objective functions F(khi0, Ehi) and G(khi0, Ehi) given by Equations (16) and (17), where GVl = GVl0 = GVle. These objective functions represent the sum of squares of the residuals, i.e., differences between the monitored and predicted values of the concentrations of sulfur and nitrogen compounds at the reactor outlet. For a model with ni ≠ 1 (i = 1,2), the objective functions F(ni, khi0, Ehi) and G(ni, khi0, Ehi) are expressed by Equations (18) and (19).
F k h S 0 , E h S = j = 1 50 c S e j c S 0 j exp k h S 0 V exp E h S R T j , m , b e d G V l j 2 , n S 1
G k h N 0 , E h N = j = 1 50 c N e j c N 0 j exp k h N 0 V exp E h N R T j , m , b e d G V l j 2 , n N = 1
F n S , k h S 0 , E h S = j = 1 50 c S e j c S 0 j 1 + c S e j n S 1 n S 1 k h S 0 V exp E h S R T j , m , b e d G V l j 1 n S 1 2 , n S 1
G n N , k h N 0 , E h N = j = 1 50 c N e j c N 0 j 1 + c N e j n N 1 n N 1 k h N 0 V exp E h N R T j , m , b e d G V l j 1 n N 1 2 , n N 1
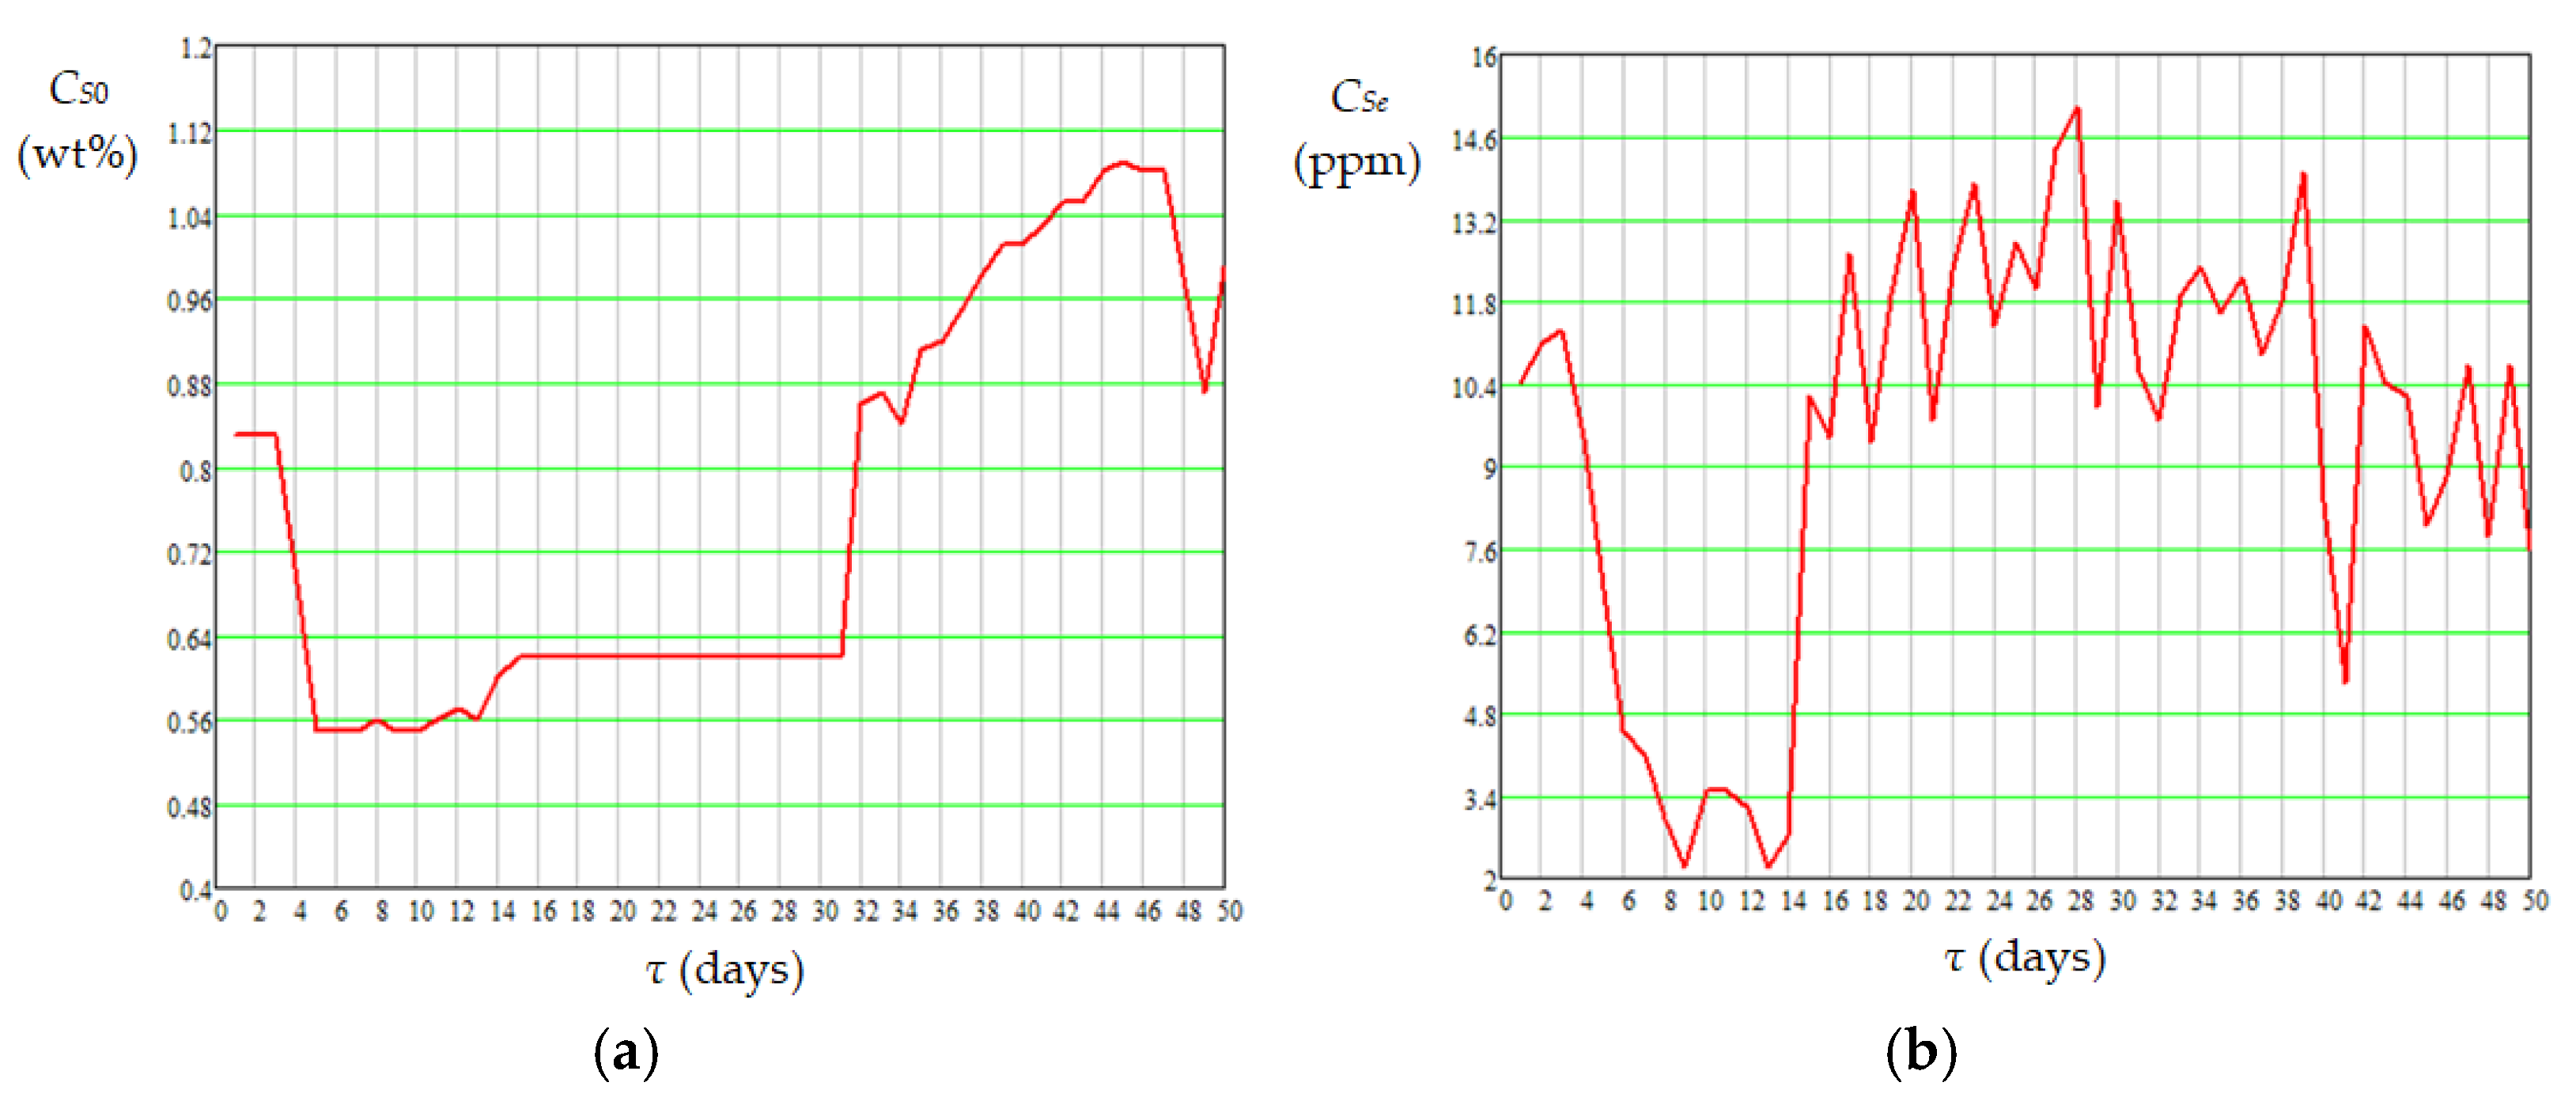
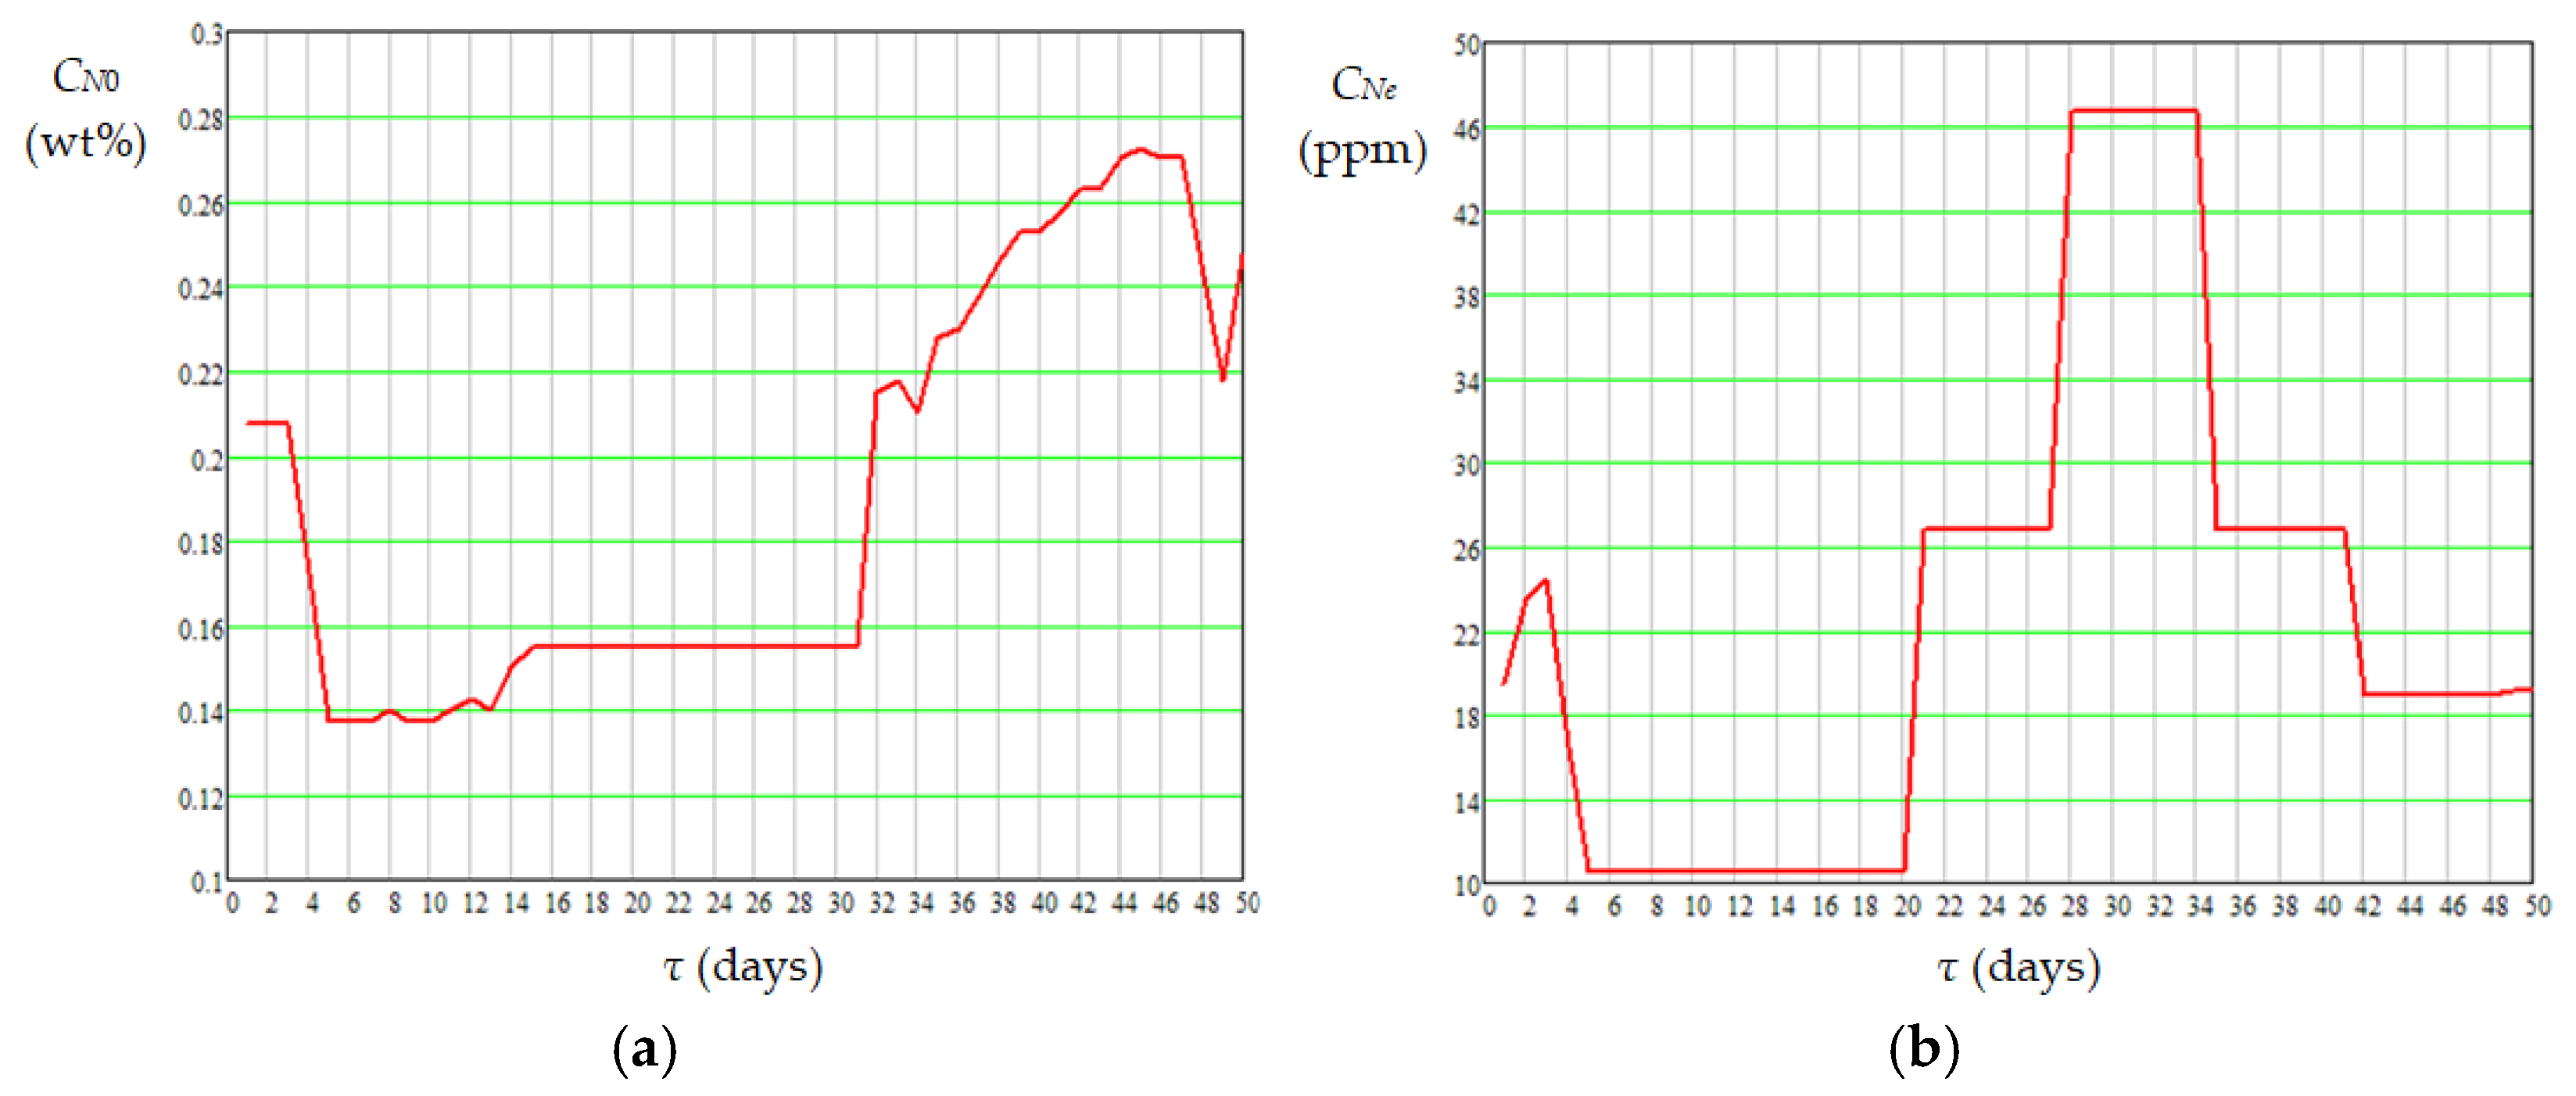
The mean values of absolute daily temperature in the catalyst bed appearing in Equations (16)–(19), i.e., Tj,m,bed (K), were calculated using Equation (20). Dynamics of mean temperature in the catalyst bed (tm,bed), diesel flow rate at the reactor inlet (GVl), mass percentages of sulfur and nitrogen compounds in diesel fuel at the reactor inlet (CS0 and CN0) and outlet (CSe and CNe) are shown in Figure 7, Figure 8 and Figure 9. Data presented in Figure 5, Figure 6, Figure 7, Figure 8 and Figure 9 highlight the following: (i) the approach to the steady state of the HT installation took several days and consisted in bringing the catalyst into the thermal operating regime (Figure 5, Figure 6, and Figure 7a) simultaneously with the increase in GVl to around 100 m3/h (Figure 7b); (ii) variations in the independent variables, including tm,bed (Figure 7), CS0 (Figure 8a), and CN0 (Figure 9a), led to variations in the mass percentages of sulfur and nitrogen compounds in the diesel fuel at the reactor outlet, i.e., CSe (Figure 8b) and CNe (Figure 9b); (iii) GVl increased significantly on days 13–15, this increase being imposed by a significant increase in tm,bed on days 10–12 (Figure 7); (iv) the mean temperature measured in the area of ring 4 (near the reactor exit) was higher than that measured in the area of ring 1 (near the reactor entrance), the mean difference between them being of about 14 °C (Figure 6a); (v) the mean temperature measured in the area of ring 1 had a much higher dispersion than those measured in the areas of rings 2–4 (Figure 6b); (vi) the dynamics of nitrogen compound concentration in the diesel fuel at the reactor inlet (Figure 9a) and outlet (Figure 9b) suggest that between days 20 and 42 the catalyst activity for nitrogen compound hydrogenation decreased.
T j , m , b e d = 273.15 + t j , m , b e d = 273.15 + k = 1 4 t j , m , r i n g k 4 , j = 1 50
For sulfur compounds, the data were processed using Mathcad 14 in the following order: (i) import of the file with the monitored data (Table 2); (ii) the choice based on literature data [34,35,41,42,47,48,49] of the ranges of variation of the parameters of the Arrhenius Equation (13), i.e., 3.6–5.0·105 h−1 for khS0 and 52–64 kJ/mol for EhS; (iii) determining the values of the objective function F(khS0,EhS) given by Equation (16) at different levels of khS0 and EhS (specified in Table 3), and identifying the parameter levels that lead to a minimum value of the objective function, i.e., khS0,min,I = 4.0·105 h−1 and EhS,min,I = 56 kJ/mol, for which Fmin,I = 1.702·103 kg2/m6 (Table 3); (iv) identifying the parameter levels to obtain the minimum value of the objective function by solving the system of Equations (21), where khS0,min,I and EhS,min,I were used as initial values, i.e., khS0,min,II = 8.189·104 h−1 and EhS,min,II = 47.75 kJ/mol, for which Fmin,II = 1.641·103 kg2/m6. The same procedure was applied for data processing for nitrogen compounds. The values of adjustable parameters for HDS and HDN identified from monitoring data using Equations (16)–(19), including khS0,min,II = khS0, EhS,min,II = EhS, khN0,min,II = khN0, EhN,min,II = EhN, nS, and nN, are summarized in Table 4. Tabulated data indicate the following aspects: (i) the values of khS0, EhS, khN0, and EhN are quite close to other data reported in the literature [34,35,41,42,47,48,49]; (ii) the values of khS0 and khN0 and those of EhS and EhN for ni = 1 were extremely close, suggesting that the type of catalyst used in the reactor had almost equal specificity for the hydrogenation of sulfur and nitrogen compounds; (iii) the results obtained for ni ≠ 1, i.e., very close values of nS and nN, khS0 and khS0, and EhS and EhN, respectively, also support the hypothesis of equal specificity of the catalyst towards sulfur and nitrogen compounds.
F k h S 0 , E h S k h S 0 = 0 F k h S 0 , E h S E h S = 0
In addition, the values of the Arrhenius equation parameters can provide valuable information about the reduction in catalyst activity over time. For example, if the values of EhS and EhN are determined from monitoring data with a certain frequency (e.g., monthly, every two months), the degree of catalyst deactivation can be assessed based on the variation over time of these parameter values (the lower the values, the greater the catalyst deactivation).
Dynamics of experimental (monitored) and predicted concentrations of sulfur and nitrogen compounds in diesel fuel at the reactor outlet, which are shown in Figure 10, highlight that the data predicted by Equations (14) and (15) cover the experimental data quite well. Moreover, a significant increase in the predicted concentrations of sulfur and nitrogen compounds for ni = 1 is observed on days 13–15, this increase also occurring during this period for the diesel flow rate (Figure 7).
Many other monitoring data, showing the dynamics of other independent and dependent variables, may be of interest for models that take into account a more complex phenomenology of HT. Accordingly, the monitoring data can be supplemented with the dynamics of: (i) volumetric flow rate of recirculated gas at the reactor inlet (GVrg0) (Figure S1a) and H2 purity of recirculated gas (YH2rg0) (Figure S1b), (ii) volumetric flow rate of fresh gas at the reactor inlet (GVfg0) (Figure S2a) and H2 purity of fresh gas (YH2fg0) (Figure S2b), (iii) diesel density at the reactor inlet and outlet (ρl0 and ρle) (Figure S3a), and (iv) diesel ASTM 50% distillation temperature at the reactor inlet and outlet (tASTM0 and tASTMe) (Figure S3b).

3.2. Predicted Dynamics of Compound Concentrations in Diesel Fuel at Different Levels of Process Factors

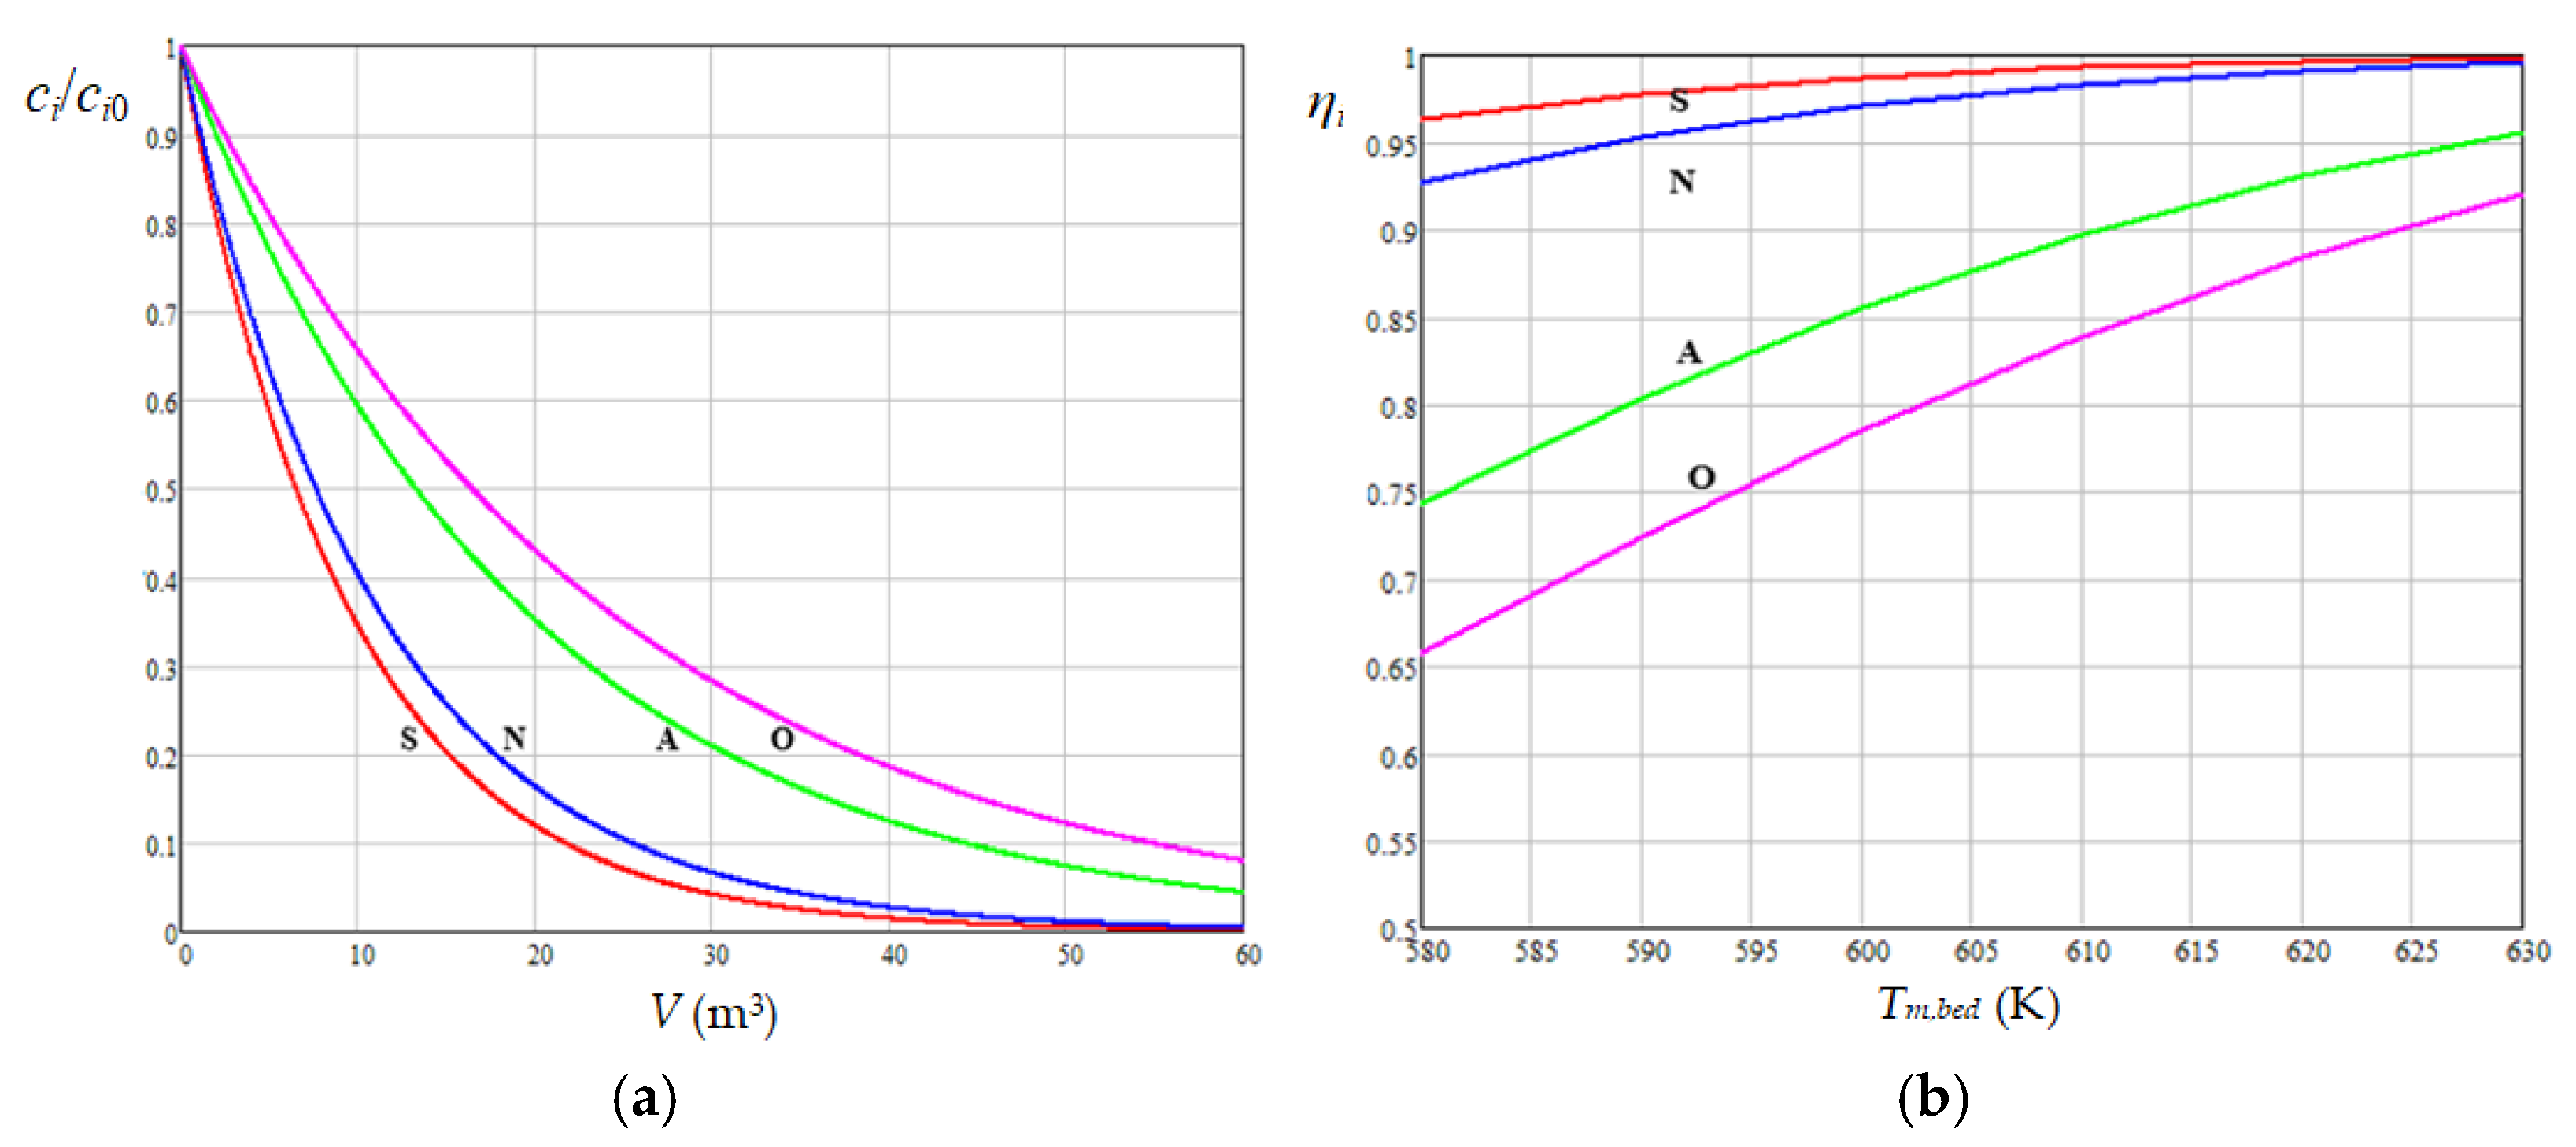
Predicted curves of dimensionless species concentrations (ci/ci0Ci/Ci0, i = 1…4) depending on catalyst volume (V) at Tm,bed = 600 K are shown in Figure 11a. The curves were predicted using the model with first-order kinetics (ni = 1) described by Equation (14), where GVl = 100 m3/h and the kinetic parameters of the Arrhenius equation (khi0 and Ehi) were selected based on data reported in the related literature [34,35,41,42,47,48,49]. The results presented in Figure 11a indicate that to reduce the sulfur concentration of diesel fuel from 6000 ppm to 6 ppm, a catalyst volume of 60 m3 is required, which is in agreement with the values of V corresponding to an industrial reactor. Predicted curves of species hydrogenation degrees (ηi = 1 − ci/ci0, i = 1…4) depending on Tm,bed at V = 60 m3 (LHSV = 1.67 h−1) (Figure 11b) highlight a higher sensitivity to Tm,bed of the hydrogenation of olefins, aromatic and nitrogen compounds compared to that of sulfur compounds. Equation (14) indicates an increase in ci/ci0 with an increase in GVl and a decrease in V and Tm,bed, consistent with the variations of ci/ci0 and ηi with the process factors that are presented in Figure 11.

4. Conclusions

Assuming that the HT process of diesel fuel is controlled by the kinetics of hydrogenation reactions of sulfur compounds, nitrogen compounds, aromatic compounds, and olefins, a PL kinetic model was selected to predict the hydrogenation reaction rates. According to this model, the species dimensionless mass concentrations (ci/ci0, i = 1…4) were functions of diesel flow rate (GVl), catalyst volume (V), hydrogenation reaction rate constants (khi), and reaction orders (ni). The Arrhenius equation was used to express the dependence between khi and mean absolute temperature in the catalyst bed (Tm,bed).
Predicted curves of ci/ci0 depending on V at Tm,bed = 600 K, where GVl = 100 m3/h, ni = 1, and the kinetic parameters of the Arrhenius equation (khi0 and Ehi) were selected based on data from the literature, indicated a catalyst volume of 60 m3 (LHSV = 1.67 h−1) required to reduce the sulfur concentration of diesel fuel from 6000 ppm to 6 ppm. This value of V is in agreement with those corresponding to an industrial reactor. Predicted curves of species hydrogenation degrees (ηi = 1 − ci/ci0) depending on Tm,bed at V = 60 m3 revealed a higher sensitivity to Tm,bed of the hydrogenation of olefins, aromatic and nitrogen compounds compared to that of sulfur compounds.
Data measured over 50 days in an industrial plant were provided. The model adjustable parameters in terms of kinetic parameters of the Arrhenius equation were estimated by minimizing the sum of squares of the differences between the monitored and predicted values of the concentrations of sulfur and nitrogen compounds at the reactor outlet. The results obtained, i.e., very close values of the kinetic parameters, suggested that the catalyst had almost equal specificity for the hydrogenation of sulfur and nitrogen compounds.
Consequently, a simple model based on PL kinetics was used to predict the performance of the diesel HT process under various operating conditions. An optimization study could be performed for the levels of process factors used in an industrial reactor, typically GVl = 80–120 m3/h, V = 50–150 m3, and Tm,bed = 603–653 K (tm,bed = 330–380 °C). In addition, it is necessary to consider how the activation energies for hydrogenation reactions of Si species evolve so that the reduction in catalyst activity can be correctly assessed. These aspects will be addressed in future work.

Supplementary Materials

The following supporting information can be downloaded at: https://www.mdpi.com/article/10.3390/ma18112481/s1, Figure S1: Dynamics of volumetric flow rate of recirculated gas at the reactor inlet (a) and hydrogen purity of recirculated gas (b); Figure S2: Dynamics of volumetric flow rate of fresh gas at the reactor inlet (a) and hydrogen purity of fresh gas (b); Figure S3: Dynamics of diesel density (a) at the reactor inlet (in red) and outlet (in blue) and ASTM 50% distillation temperature (b) at the reactor inlet (in red) and outlet (in blue).

Author Contributions

Conceptualization, L.E.P., T.D. and O.C.P.; methodology, L.E.P., T.D., N.Ş., F.D.P. and O.C.P.; software, T.D. and O.C.P.; validation, T.D. and O.C.P.; formal analysis, T.D. and O.C.P.; investigation, L.E.P., N.Ş. and F.D.P.; resources, N.Ş. and F.D.P.; writing—original draft preparation, L.E.P., T.D. and O.C.P.; writing—review and editing, L.E.P., T.D. and O.C.P.; supervision, N.Ş. and F.D.P. All authors have read and agreed to the published version of the manuscript.

Funding

This research received no funding.

Institutional Review Board Statement

Not applicable.

Informed Consent Statement

Not applicable.

Data Availability Statement

The original contributions presented in this study are included in the article and Supplementary Materials. Further inquiries can be directed to the corresponding authors.

Acknowledgments

The authors acknowledge the support of colleagues at the Petromidia Refinery (Năvodari, Romania) who provided monitored data for a reactor in a diesel hydrotreating plant.

Conflicts of Interest

Authors Nela Şerbănescu and Florian Daniel Pop were employed by the company Petromidia Refinery. The remaining authors declare that the research was conducted in the absence of any commercial or financial relationships that could be construed as a potential conflict of interest.

Abbreviations

cimass concentration of Si species in the liquid phase, kg/m3
cH2gmass concentration of hydrogen in the gas phase, kg/m3
cigmass concentration of Si species in the gas phase, kg/m3
Cimass percentage of Si species in the liquid phase, wt%
Ehiactivation energy for hydrogenation reaction of Si species, kJ/mol
GVgvolumetric flow rate of gas phase, m3/h
GVlvolumetric flow rate of liquid phase, m3/h
GVrgvolumetric flow rate of recycled gas phase, m3/h
kdhidehydrogenation reaction rate constant of Si species, h−1
khihydrogenation reaction rate constant of Si species, h−1
khi0pre-exponential factor of Si species in the Arrhenius Equation (13), h−1
LHSVliquid hourly space velocity, h−1
nireaction order of Si species
Ppressure, Pa
PH2partial pressure of hydrogen in the gas phase, Pa
rglgas/diesel volumetric ratio
Runiversal gas constant, kJ/(molK)
ttemperature, °C
tASTMdiesel ASTM 50% distillation temperature, °C
Tabsolute temperature, K
vrireaction rate of Si species, kg/(m3h)
Vcatalyst volume, m3
YH2gmolar percentage of hydrogen in the gas phase (H2 purity), mol%
α1stoichiometric ratio between H2S and sulfur compounds
α2stoichiometric ratio between NH3 and nitrogen compounds
β1stoichiometric ratio between H2 and sulfur compounds
β2stoichiometric ratio between H2 and nitrogen compounds
β3stoichiometric ratio between H2 and aromatic compounds
β4stoichiometric ratio between H2 and olefins
ηihydrogenation degree of Si species
ρldensity of liquid phase, kg/m3
τtime, h
τLHSVresidence time of the liquid phase in the catalyst bed (1/LHSV), h
Subscripts
eexit from the reactor
ggas
icompound species; i = 1 (or S) for sulfur compounds; i = 2 (or N) for nitrogen compounds; i = 3 (or A) for aromatic compounds; i = 4 (or O) for olefins
lliquid
mmean
rgrecycled gas
0reactor inlet (V = 0)

References

  1. Ancheyta, J.; Speight, J.G. Hydroprocessing of Heavy Oils and Residual; CRC Press: Boca Raton, FL, USA, 2007. [Google Scholar]
  2. Gary, H.J.; Handwerk, H.J.; Kaiser, M.J.; Geddes, D. Petroleum Refining: Technology and Economics, 5th ed.; CRC Press: Boca Raton, FL, USA, 2007. [Google Scholar]
  3. Mochida, I.; Choi, K.H. An Overview of Hydrodesulfurization and Hydrodenitrogenation. J. Jpn. Pet. Inst. 2004, 47, 145–163. [Google Scholar] [CrossRef]
  4. Directorate-General Environment. The Costs and Benefits of Lowering the Sulphur Content of Petrol & Diesel to Less than 10 ppm; European Commission: Brussels, Belgium, 2001. [Google Scholar]
  5. ASTM D975-22a; Standard Specification for Diesel Fuel. ASTM International: West Conshohocken, PA, USA, 2022.
  6. Fahim, M.A.; Al-Sahhaf, T.A.; Elkilani, A. Fundamentals of Petroleum Refining, 1st ed.; Elsevier: Amsterdam, The Netherlands, 2010. [Google Scholar]
  7. Speight, J.G. Hydrotreating and Hydrocracking Processes in Refining Technology, 1st ed.; CRC Press: Boca Raton, FL, USA, 2023. [Google Scholar]
  8. Babich, I.V.; Moulijn, J.A. Science and Technology of Novel Processes for Deep Desulfurization of Oil Refinery Streams: A Review. Fuel 2003, 82, 607–631. [Google Scholar] [CrossRef]
  9. Moonen, R.; Alles, J.; Ras, E.J.; Harvey, C.; Moulijn, J.A. Performance Testing of Hydrodesulfurization Catalysts Using a Single-Pellet-String Reactor. Chem. Eng. Technol. 2017, 40, 2025–2034. [Google Scholar] [CrossRef]
  10. Froment, G.F.; Depauw, G.A.; Vanrysselberghe, V. Kinetic Modelling and Reactor Simulation in Hydrodesulfurization of Oil Fractions. Ind. Eng. Chem. Res. 1994, 33, 2975–2988. [Google Scholar] [CrossRef]
  11. Song, C. An Overview of New Approaches to Deep Desulfurization for Ultra-Clean Gasoline, Diesel Fuel and Jet Fuel. Catal. Today 2003, 86, 211–263. [Google Scholar] [CrossRef]
  12. Whitehurst, D.D.; Isoda, T.; Mochida, I. Present State of the Art and Future Challenges in the Hydrodesulfurization of Sulfur Compounds. Adv. Catal. 1998, 42, 345–471. [Google Scholar]
  13. McKetta, J.J. (Ed.) Petroleum Processing Handbook, 1st ed.; CRC Press: Boca Raton, FL, USA, 1992. [Google Scholar]
  14. Stanislaus, A.; Marafi, A.; Rana, M.S. Recent Advances in the Science and Technology of Ultra Low Sulfur Diesel (ULSD) Production. Catal. Today 2010, 153, 1–68. [Google Scholar]
  15. Mapiour, M.; Sundaramurthy, V.; Dalai, A.K.; Adjaye, J. Effects of the Operating Variables on Hydrotreating of Heavy Gas Oil: Experimental, Modeling, and Kinetic Studies. Fuel 2010, 89, 2536–2543. [Google Scholar] [CrossRef]
  16. Bej, S.K.; Dalai, A.K.; Adjaye, J. Comparison of Hydrodenitrogenation of Basic and Nonbasic Nitrogen compounds Present in Oil Sands Derived Heavy Gas Oil. Energy Fuels 2001, 15, 377–383. [Google Scholar] [CrossRef]
  17. Dufresne, P.; Bigeard, P.H.; Billon, A. New Developments in Hydrocracking: Low Pressure High-Conversion Hydrocracking. Catal. Today 1987, 1, 367–384. [Google Scholar] [CrossRef]
  18. Topsøe, H. The role of Co–Mo–S Type Structures in Hydrotreating Catalysts. Appl. Catal. A Gen. 2007, 322, 3–8. [Google Scholar] [CrossRef]
  19. Vasudevan, P.T.; Fierro, J.L.G. A Review of Deep Hydrodesulfurization Catalysis. Catal. Rev.-Sci. Eng. 1996, 38, 161–188. [Google Scholar] [CrossRef]
  20. Wang, Y.; Zhang, Y.; Xie, B.; Wang, J.; Yu, Y. Insights into the High Activity of Hydrotreating Catalysts for Heavy Gas Oil. Catalysts 2025, 15, 90. [Google Scholar] [CrossRef]
  21. Weng, X.; Cao, L.; Zhang, G.; Chen, F.; Zhao, L.; Zhang, Y.; Gao, J.; Xu, C. Ultradeep Hydrodesulfurization of Diesel: Mechanisms, Catalyst Design Strategies, and Challenges. Ind. Eng. Chem. Res. 2020, 59, 21261–21274. [Google Scholar] [CrossRef]
  22. Dobre, T.; Pârvulescu, O.C.; Stoica-Guzun, A.; Stroescu, M.; Jipa, I.; Al Janabi, A.A. Heat and Mass Transfer in Fixed Bed Drying of Non-Deformable Porous Particles. Int. J. Heat Mass Transf. 2016, 103, 478–485. [Google Scholar] [CrossRef]
  23. Dobre, T.; Sanchez-Marcano, J. Chemical Engineering: Modelling, Simulation and Similitude; Wiley VCH: Weinheim, Germany, 2007. [Google Scholar]
  24. Chowdhury, R.; Pedernera, E.; Reimert, R. Trickle-Bed Reactor Model for Desulfurization and Dearomatization of Diesel. AIChE J. 2002, 48, 126–135. [Google Scholar] [CrossRef]
  25. Da Rocha Novaes, L.; de Resende, N.S.; Salim, V.M.M.; Secchi, A.R. Modeling, Simulation and Kinetic Parameter Estimation for Diesel Hydrotreating. Fuel 2017, 209, 184–193. [Google Scholar] [CrossRef]
  26. Da Silva, J.I.S.; Secchi, A.R. An Approach to Optimize Costs During Ultra-Low Hydrodesulfurization of a Blend Consisting of Different Oil Streams. Braz. J. Chem. Eng. 2018, 35, 1293–1304. [Google Scholar] [CrossRef]
  27. Liu, Z.; Zheng, Y.; Wang, W.; Zhang, Q.; Jia, L. Simulation of Hydrotreating of Light Cycle Oil with a System Dynamics Model. Appl. Catal. A Gen. 2008, 339, 209–220. [Google Scholar] [CrossRef]
  28. Mederos, F.S.; Ancheyta, J. Mathematical Modeling and Simulation of Hydrotreating Reactors: Cocurrent versus Countercurrent Operations. Appl. Cat. A Gen. 2007, 332, 8–21. [Google Scholar] [CrossRef]
  29. Mederos, F.S.; Ancheyta, J.; Elizalde, I. Dynamic Modeling and Simulation of Hydrotreating of Gas Oil Obtained from Heavy Crude Oil. Appl. Cat. A Gen. 2012, 425–426, 13–27. [Google Scholar] [CrossRef]
  30. Murali, C.; Voolapalli, R.K.; Ravichander, N.; Gokak, D.T.; Choudary, N.V. Trickle Bed Reactor Model to Simulate the Performance of Commercial Diesel Hydrotreating Unit. Fuel 2007, 86, 1176–1184. [Google Scholar] [CrossRef]
  31. Ancheyta, J.; Angeles, M.J.; Macías, M.J.; Marroquin, G.; Morales, R. Changes in Apparent Reaction Order and Activation Energy in the Hydrodesulfurization of Real Feedstocks. Energy Fuels 2002, 16, 189–193. [Google Scholar] [CrossRef]
  32. Boahene, P.E.; Soni, K.K.; Dalai, A.K.; Adjaye, J. Hydroprocessing of Heavy Gas Oils Using FeW/SBA-15 Catalysts: Experimentals, Optimization of Metals Loading, and Kinetics Study. Catal. Today 2013, 207, 101–111. [Google Scholar] [CrossRef]
  33. Botchewey, C.; Dalai, A.K.; Adjaye, J. Two-Stage Hydrotreating of Athabasca Heavy gas Oil with Interstage Hydrogen Sulphide Removal: Effect of Process Conditions and Kinetic Analysis. Ind. Eng. Chem. Res. 2004, 43, 5854–5861. [Google Scholar] [CrossRef]
  34. Ferdous, D.; Dalai, A.K.; Adjaye, J. Hydrodenitrogenation and Hydrodesulfurization of Heavy Gas Oil Using NiMo/Al2O3 Catalyst Containing Boron: Experimental and Kinetic Studies. Ind. Eng. Chem. Res. 2006, 45, 544–552. [Google Scholar] [CrossRef]
  35. Girgis, M.J.; Gates, B.C. Reactivities, Reaction Networks, and Kinetics in High-Pressure Catalytic Hydroprocessing. Ind. Eng. Chem. Res. 1991, 30, 2021–2058. [Google Scholar] [CrossRef]
  36. Glišiæ, S.B.; Orloviæ, A.M. The Influence of Hydrodearomatisation Reaction Kinetics on the Modelling of Sulphur and Aromatics Removal from Diesel Fuel in an Industrial Hydrotreating Process. Energies 2021, 14, 4616. [Google Scholar] [CrossRef]
  37. Krivtcova, N.I.; Tataurshikov, A.A.; Ivanchina, E.D.; Krivtsov, E.B. Mathematical Modelling of Diesel Fuel Hydrodesulfurization Kinetics. Procedia Chem. 2015, 15, 180–186. [Google Scholar] [CrossRef]
  38. Marín, C.; Escobar, J.; Galván, E.; Murrieta, F.; Zárate, R.; Cortés, V. NiMo Supported on Faujasite-modified Al2O3 as Catalysts for the Hydrotreatment of a Light Cycle Oil/Straight Run Gas Oil Mixture. Can. J. Chem. Eng. 2002, 80, 903–910. [Google Scholar] [CrossRef]
  39. Owusu-Boakye, A.; Dalai, A.K.; Ferdous, D.; Adjaye, J. Experimental and Kinetics Studies of Aromatic Hydrogenation in a Two-Stage Hydrotreating Process using NiMo/Al2O3 and NiW/Al2O3 Catalysts. Can. J. Chem. Eng. 2006, 84, 572–580. [Google Scholar] [CrossRef]
  40. Pătrășcioiu, C.; Bohaltea, I. Modelling and Simulation of Gasoline Hydrofining Process. Chem. Bull. Politeh. Univ. Timiş. 2006, 51, 39–42. [Google Scholar]
  41. Petraş, L.; Koncsag, C.; Pârvulescu, O.; Deleanu, I.; Răducanu, C.; Dobre, T. A Simple Model for Gasoline Hydrofining. Bull. Rom. Chem. Eng. Soc. 2022, 9, 134–139. [Google Scholar]
  42. Petrova, D.; Lyubimenko, V.; Ivanov, E.; Gushchin, P.; Kolesnikov, I. Energy Basics of Catalytic Hydrodesulfurization of Diesel Fuels. Catalysts 2022, 12, 1301. [Google Scholar] [CrossRef]
  43. Ríos, J.J.; Leal, E.; Trejo, F.; Ancheyta, J. Kinetic Models of Deep Hydrotreating Reactions to Produce Ultralow Sulfur Diesel. Energy Fuels 2023, 37, 11216–11247. [Google Scholar] [CrossRef]
  44. Samoilov, N.A. Mathematical Modeling and Optimization of Diesel-Fuel Hydrotreatment. Theor. Found. Chem. Eng. 2021, 55, 91–100. [Google Scholar] [CrossRef]
  45. Tataurshikov, A.; Ivanchina, E.; Krivtcova, N.; Krivtsov, E.; Syskina, A. Mathematical Modeling of Diesel Fuel Hydrotreating. IOP Conf. Ser. Earth Environ. Sci. 2015, 27, 012046. [Google Scholar] [CrossRef]
  46. Yin, Y.; Chen, W.; Wu, G.; Xin, F.; Qin, K.; Lu, Y.; Zhang, L.; Li, M. Kinetics toward Mechanism and Real Operation for Ultra-Deep Hydrodesulfurization and Hydrodenitrogenation of Diesel. AIChE J. 2021, 67, 17188. [Google Scholar] [CrossRef]
  47. Da Rocha Novaes, L.; Secchi, A.R.; Salim, V.M.M.; Resende, N.S. Enhancement of Hydrotreating Process Evaluation: Correlation between Feedstock Properties, In-Line Monitoring and Catalyst Deactivation. Catal. Today 2022, 394–396, 390–402. [Google Scholar] [CrossRef]
  48. Li, L.; Min, Y.C.; Weiyu, D.; Jin, S.; Yunhai, Y.; Shicai, L.; Rong, G. Reaction Kinetics of MoCo/Al2O3-Meso-ZSM-5 Catalyst for Ultra-Deep Hydrodesulfurization of Diesel Fuel. J. Pet. Sci. Technol. 2020, 10, 2–11. [Google Scholar]
  49. Tang, X.; Li, S.; Yue, C.; He, J.; Hou, J. Lumping Kinetics of Hydrodesulfurization and Hydrodenitrogenation of the Middle Distillate from Chinese Shale Oil. Oil Shale 2013, 30, 517–535. [Google Scholar] [CrossRef]
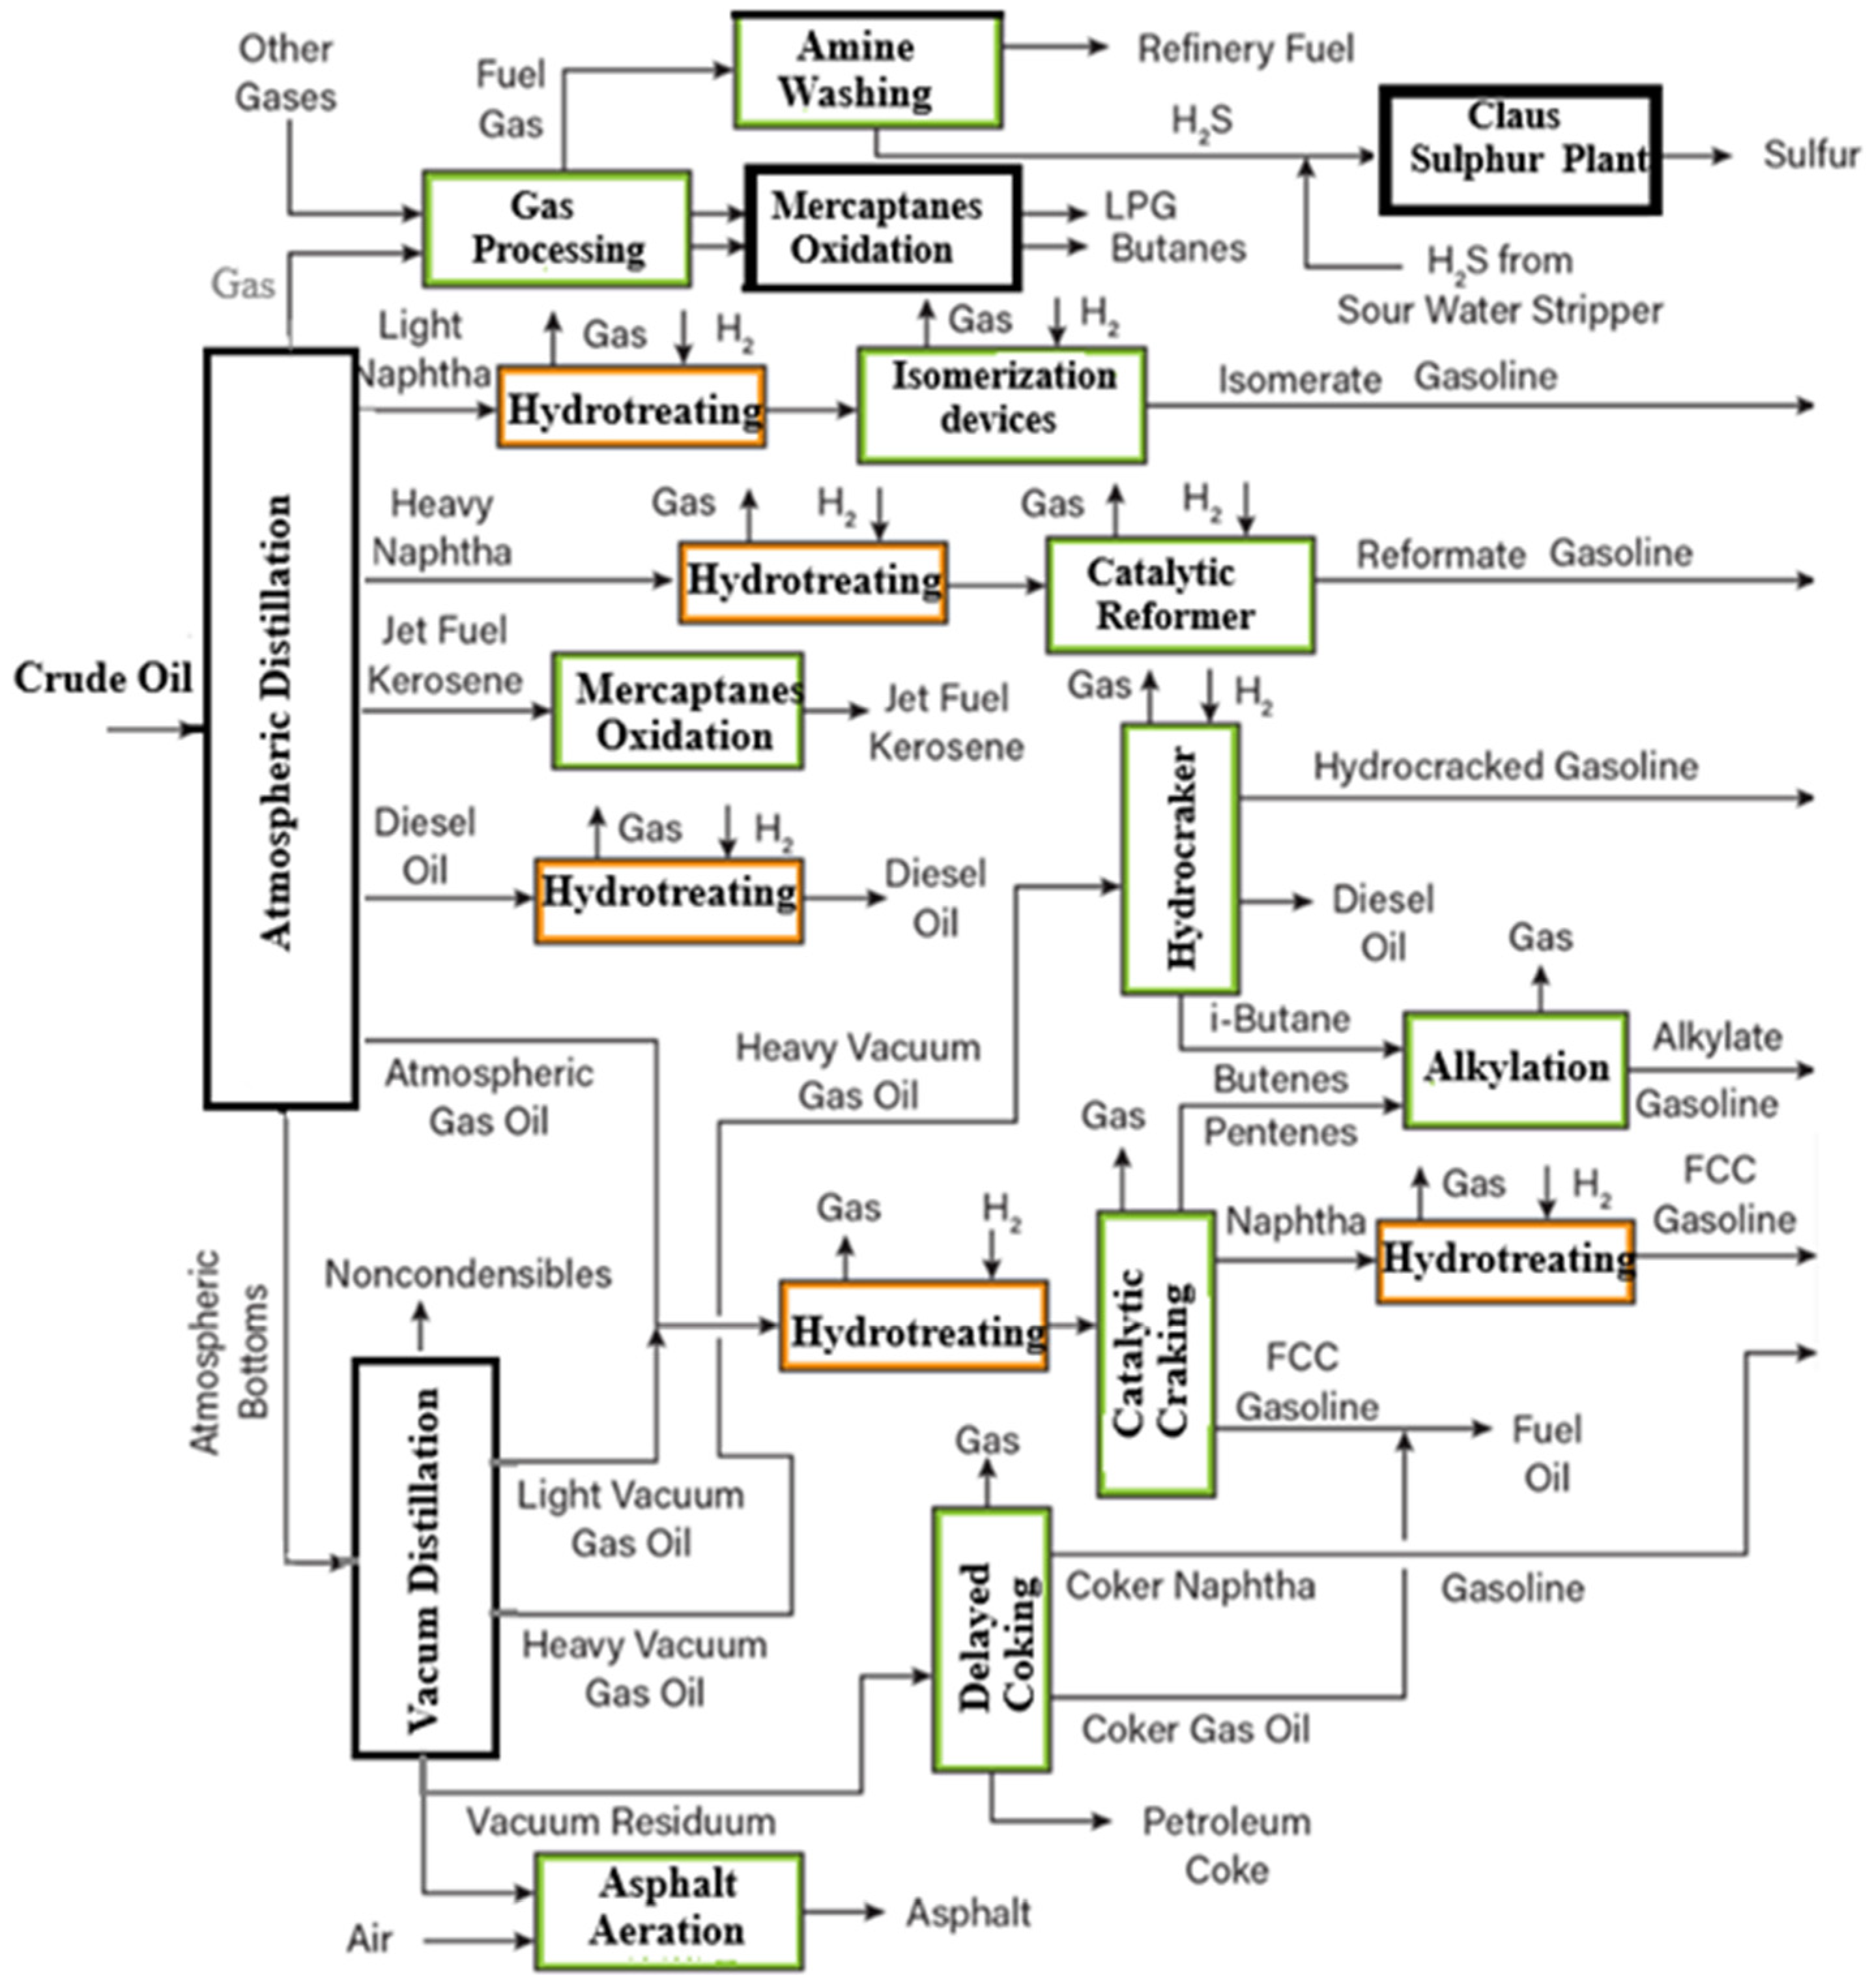
Figure 1. Process flow diagram of an oil refinery (adapted from [6]).
Materials 18 02481 g001
Figure 2. Main factors affecting the catalytic HT process of diesel fuel; ci0 or Ci0, mass concentration or mass percentage of Si species (sulfur compounds, nitrogen compounds, aromatic compounds, and olefins) in the liquid feed (kg/m3 or wt%); GVg0, volumetric flow rate of gas feed (m3/h); GVl0, volumetric flow rate of liquid feed (m3/h); LHSV, liquid hourly space velocity (h−1); PH20, partial pressure of H2 in the gas feed (Pa); tASTM0, ASTM 50% distillation temperature of liquid feed (°C); YH2g0, molar percentage of H2 (H2 purity) in the gas feed (mol%); ρl0, density of liquid feed (kg/m3); AD, axial dispersion; PF, plug flow; PM, perfect mixing.
Materials 18 02481 g002
Figure 3. Schema for species mass balance for a control volume in the HT reactor.
Materials 18 02481 g003
Figure 4. Dimensional schema of the industrial reactor and monitored variables.
Materials 18 02481 g004
Figure 5. Dynamics of catalyst bed temperature (°C) at 11 measurement points in the area of: ring 1 (a); ring 2 (b); ring 3 (c); ring 4 (d).
Materials 18 02481 g005
Figure 6. Dynamics of mean temperatures (a) and related dispersions (b) for ring k (k = 1 in red; k = 2 in blue; k = 3 in green; k = 4 in pink).
Materials 18 02481 g006
Figure 7. Dynamics of mean temperature in the catalyst bed (a) and diesel flow rate through the industrial HT reactor (b).
Materials 18 02481 g007
Figure 8. Dynamics of sulfur compound concentration in diesel fuel at the reactor inlet (a) and outlet (b).
Materials 18 02481 g008
Figure 9. Dynamics of nitrogen compound concentration in diesel fuel at the reactor inlet (a) and outlet (b).
Materials 18 02481 g009
Figure 10. Dynamics of sulfur compound concentrations (a) and nitrogen compound concentrations (b) in diesel fuel at the reactor outlet: monitored values in red; predicted values in blue (ni = 1) and green (ni ≠ 1), respectively (based on data summarized in Table 4).
Materials 18 02481 g010
Figure 11. Dimensionless species concentrations vs. catalyst volume at 600 K (a) and species hydrogenation degrees vs. mean temperature in the catalyst bed at V = 60 m3 (LHSV = 1.67 h−1) (b); S, sulfur compounds; N, nitrogen compounds; A, aromatic compounds; O, olefins; GVl = 100 m3/h; nS = nN = nA = nO = 1; khS0 = 2.085·104 h−1; khN0 = 4.285·104 h−1; khA0 = 8.061·104 h−1; khO0 = 8.842·104 h−1; EhS = 39.70 kJ/mol; EhN = 44.30 kJ/mol; EhA = 50.50 kJ/mol; EhO = 52.10 kJ/mol.
Materials 18 02481 g011
Table 1. Ranges of values of HT factors.
CasePressure
(MPa)
Temperature
(°C)
H2 Purity
(mol%)
Gas/Diesel Ratio (m3/m3)Catalyst TypeRef.
Light diesel1.5–3.5260–34086–96350–1000CoMoS or NiMoS[10,11,12]
Heavy diesel3.1–6.2330–41088–96400–1100CoMoS or NiMoS[13,14]
Table 2. Sequence from the file containing the monitoring data.
DayGVl (m3/h)tm,bed (°C)CS0 (wt%)CSe (wt%)
120.13350.831.04·10−3
265.33480.831.11·10−3
390.93530.691.13·10−3
484.63540.550.93·10−3
..................................................
47101.83550.980.78·10−3
4899.63540.871.07·10−3
4998.63520.990.76·10−3
5084.73550.961.44·10−3
Table 3. Values of F(khS0,EhS) calculated using Equation (16) at different levels of khS0 and EhS.
EhS (kJ/mol)52545658606264
khS0 (h−1)
3.6·1054.272·1033.669·1034.076·1033.871·1056.235·1064.066·1071.470·108
3.8·1054.278·1033.891·1032.140·1032.354·1054.499·1063.254·1071.261·108
4.0·1054.282·1034.035·1031.702·1031.419·1053.245·1062.604·1071.082·108
4.2·1054.283·1034.127·1031.881·1038.464·1042.340·1062.084·1079.291·107
4.4·1054.284·1034.185·1032.267·1034.983·1041.686·1061.669·1077.977·107
4.6·1054.285·1034.222·1032.678·1032.887·1041.214·1061.336·1076.849·107
4.8·1054.285·1034.245·1033.045·1031.645·1048.725·1051.070·1075.881·107
5.0·1054.285·1034.260·1033.346·1039.253·1036.262·1058.568·1065.051·107
Table 4. Model parameters for HDS and HDN identified from monitoring data using Equations (16)–(19).
nSkhS0 (h−1)EhS (kJ/mol)nNkhN0 (h−1)EhN (kJ/mol)
18.189·10447.7516.515·10447.24
0.9141.192·10562.910.9081.562·10566.13
Disclaimer/Publisher’s Note: The statements, opinions and data contained in all publications are solely those of the individual author(s) and contributor(s) and not of MDPI and/or the editor(s). MDPI and/or the editor(s) disclaim responsibility for any injury to people or property resulting from any ideas, methods, instructions or products referred to in the content.