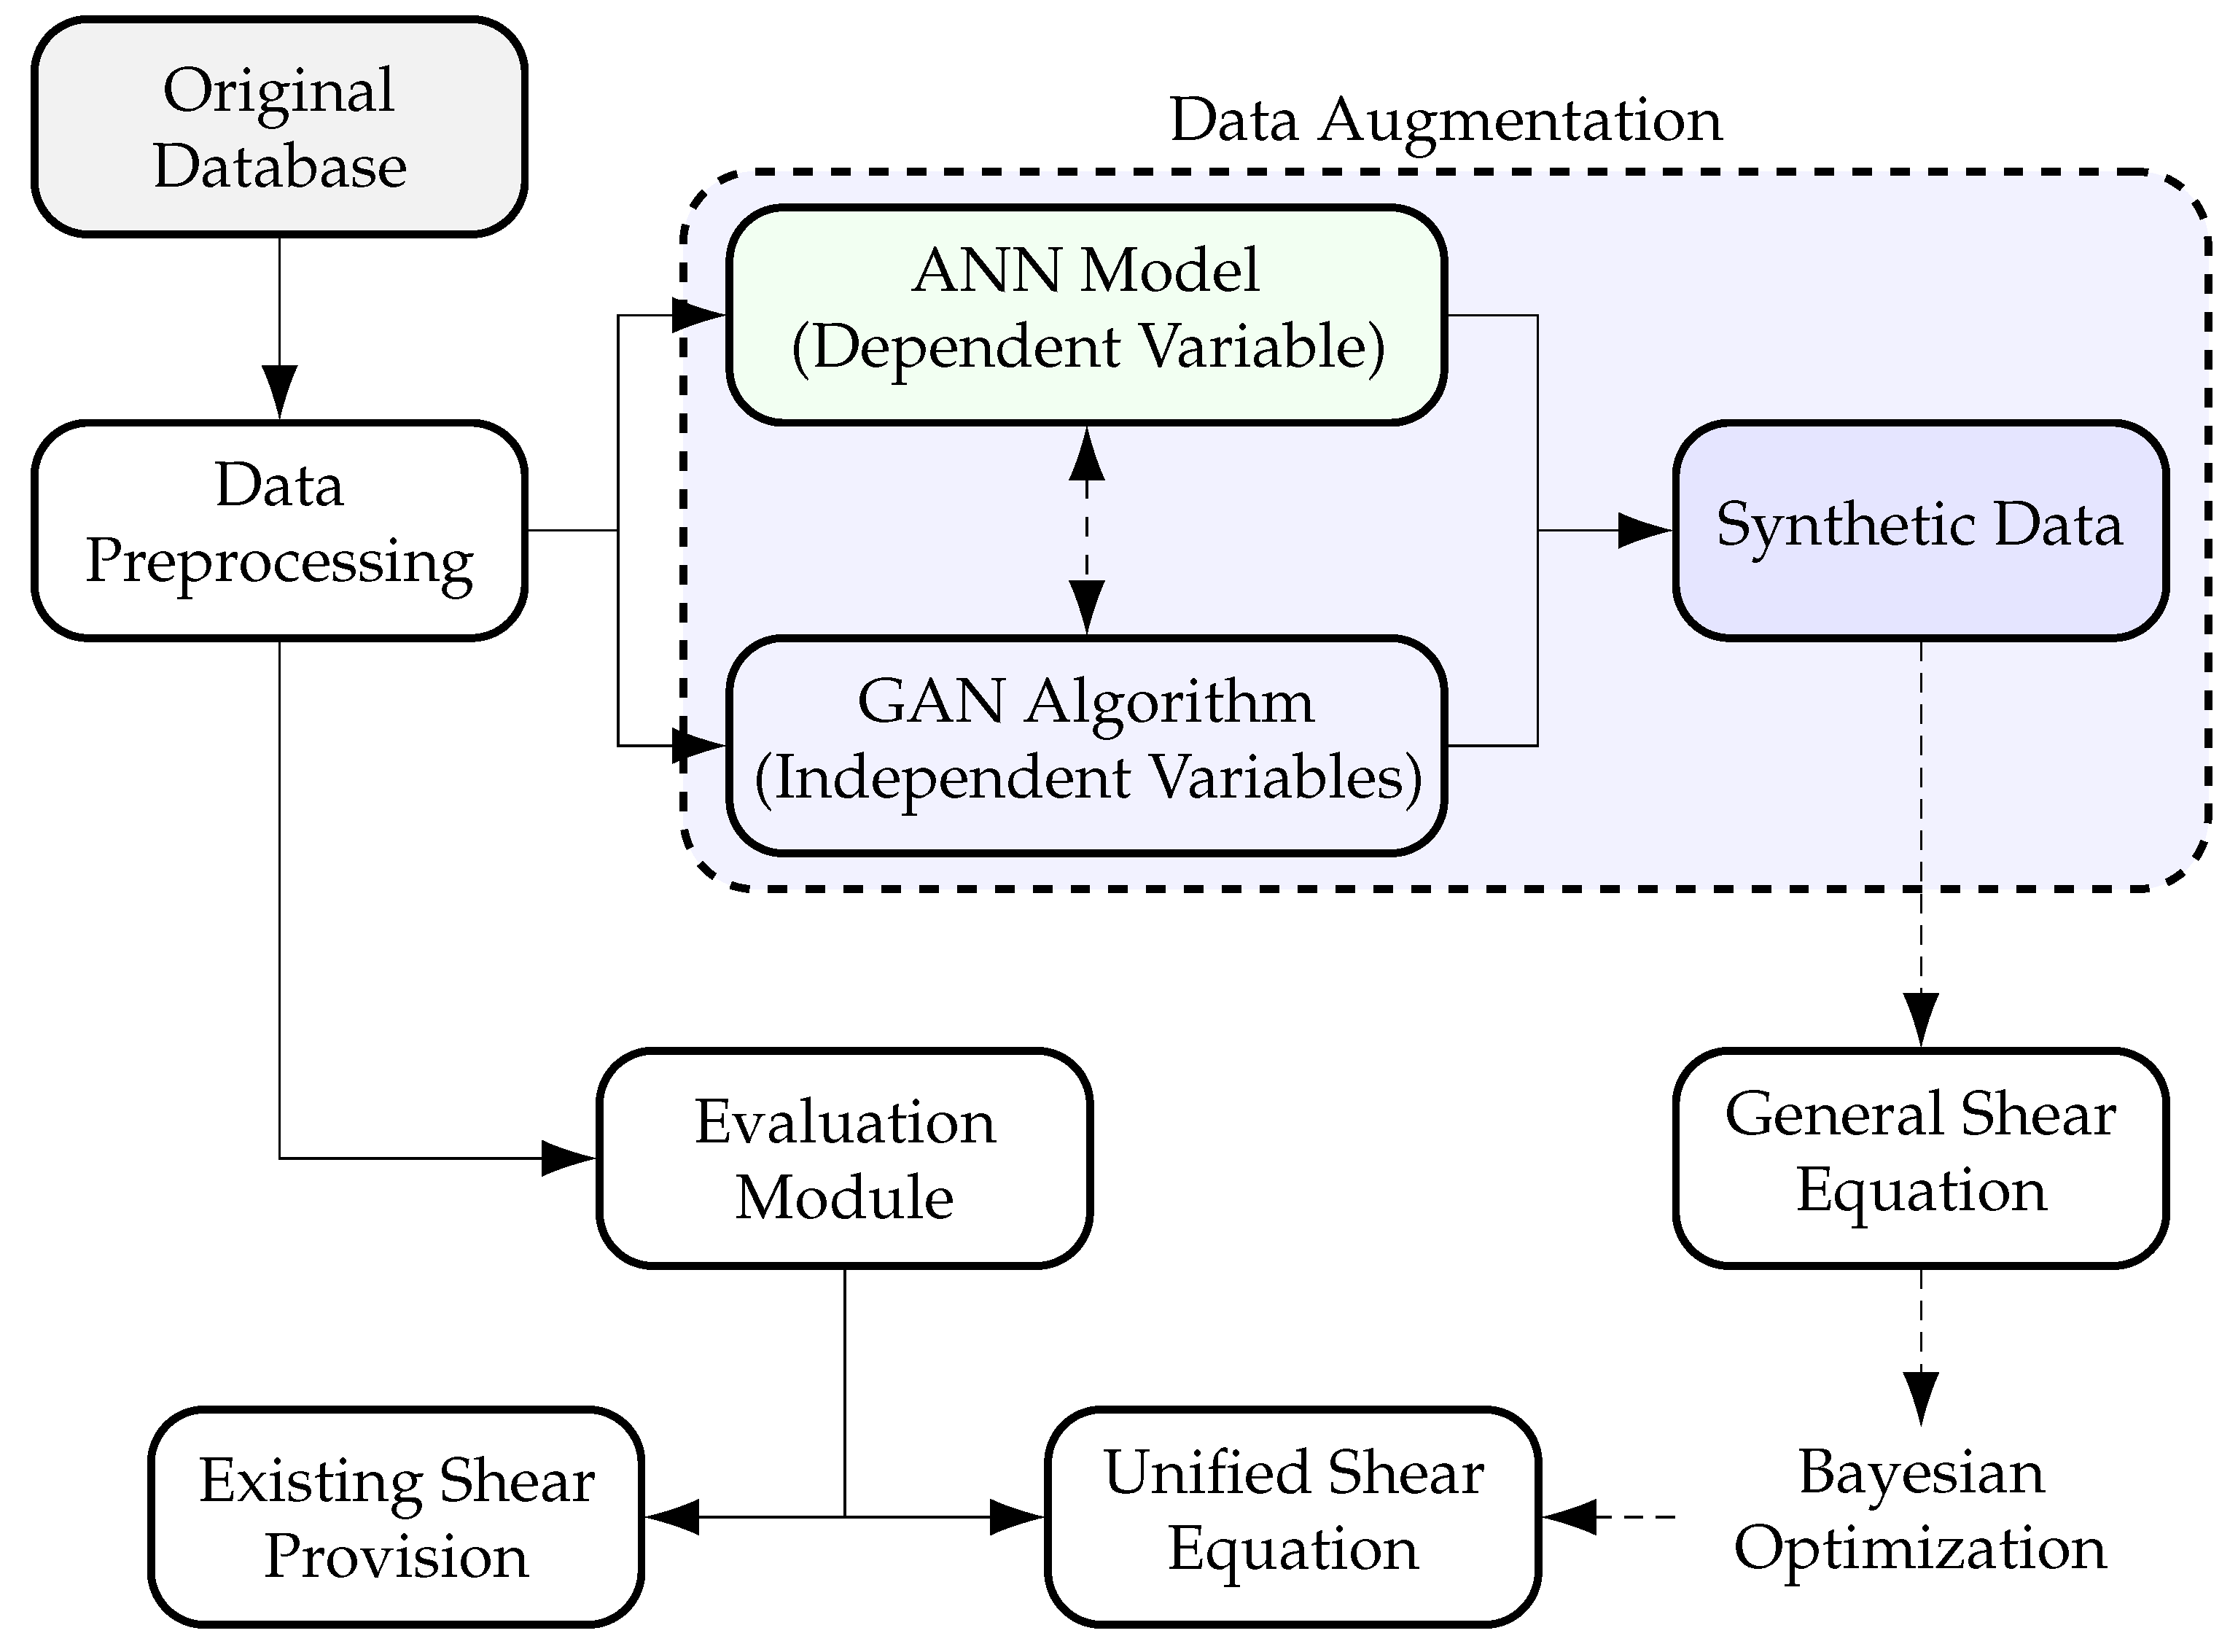
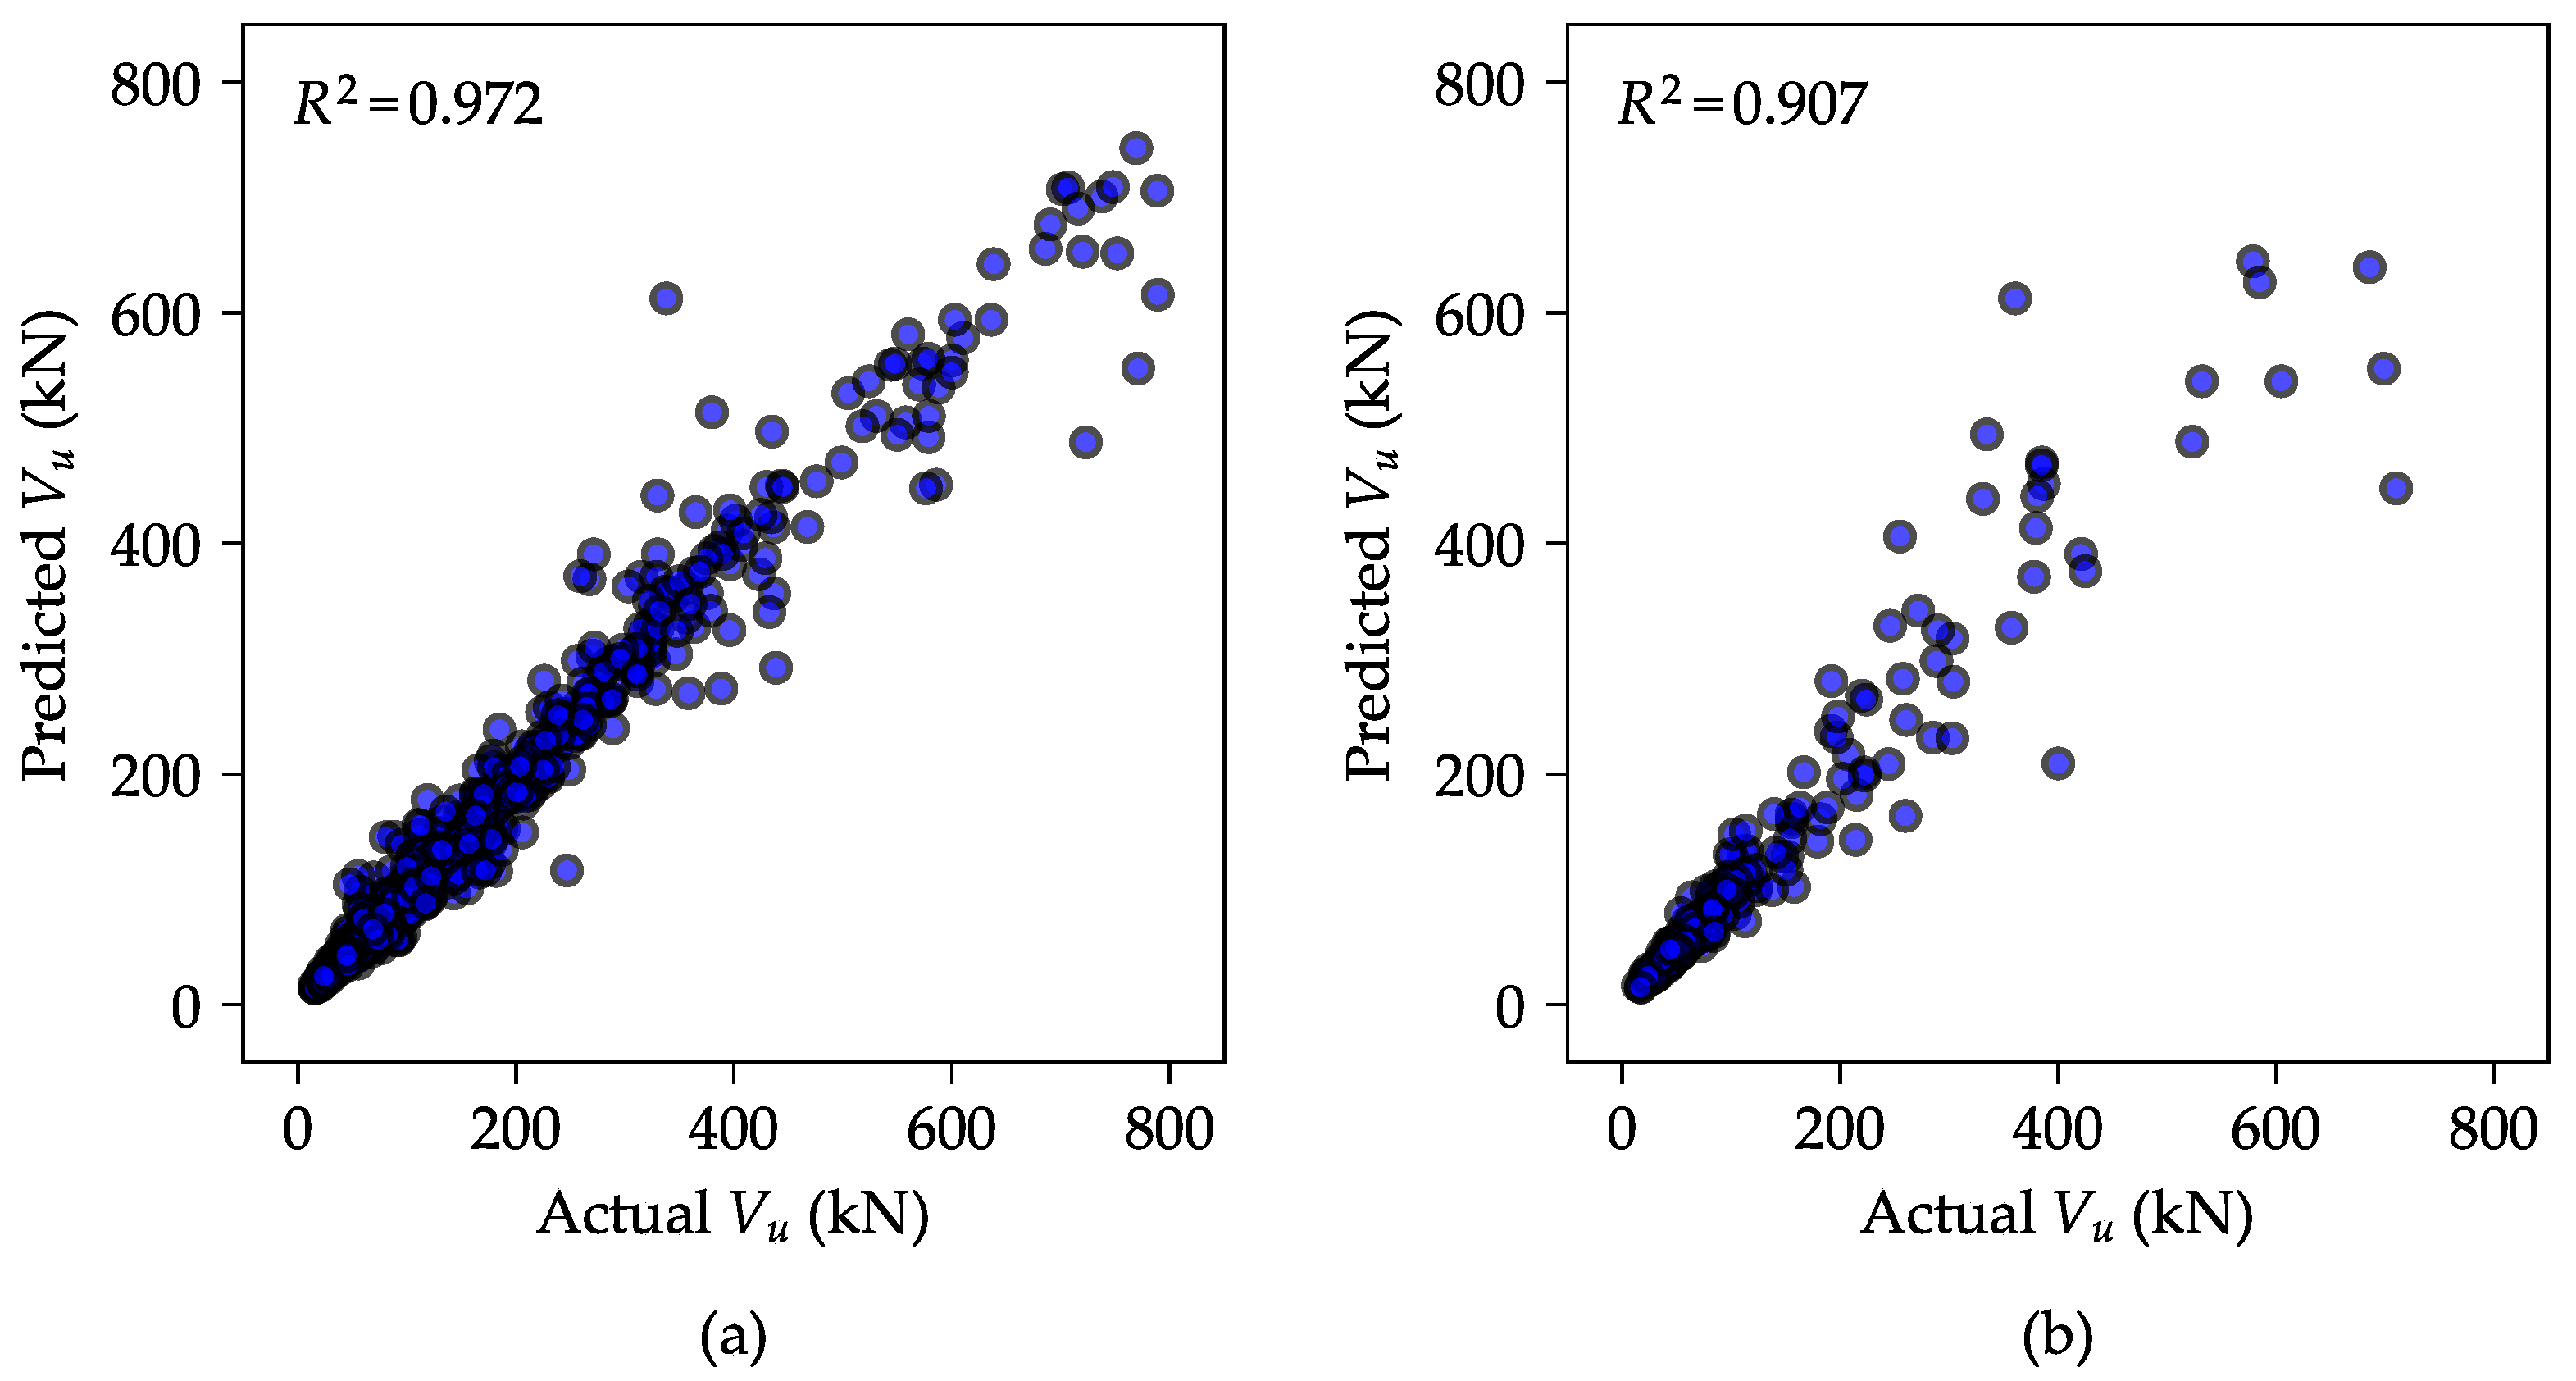
4.2. Synthetic Data: Generation via Integration of the GAN Algorithm and ANN Model
After multiple iterations and trials, the CTGANSynthesizer reached its final design, which includes two-layer neural networks with 256 neurons per layer for both discriminator () and generator (). A learning rate of 0.002 and a weight decay rate of 0.0001 are applied to both networks ( and ) during training which uses a batch size of 50. The generator features an extra embedding dimension of 128. The networks undergo synchronized updates during training to achieve stable convergence.
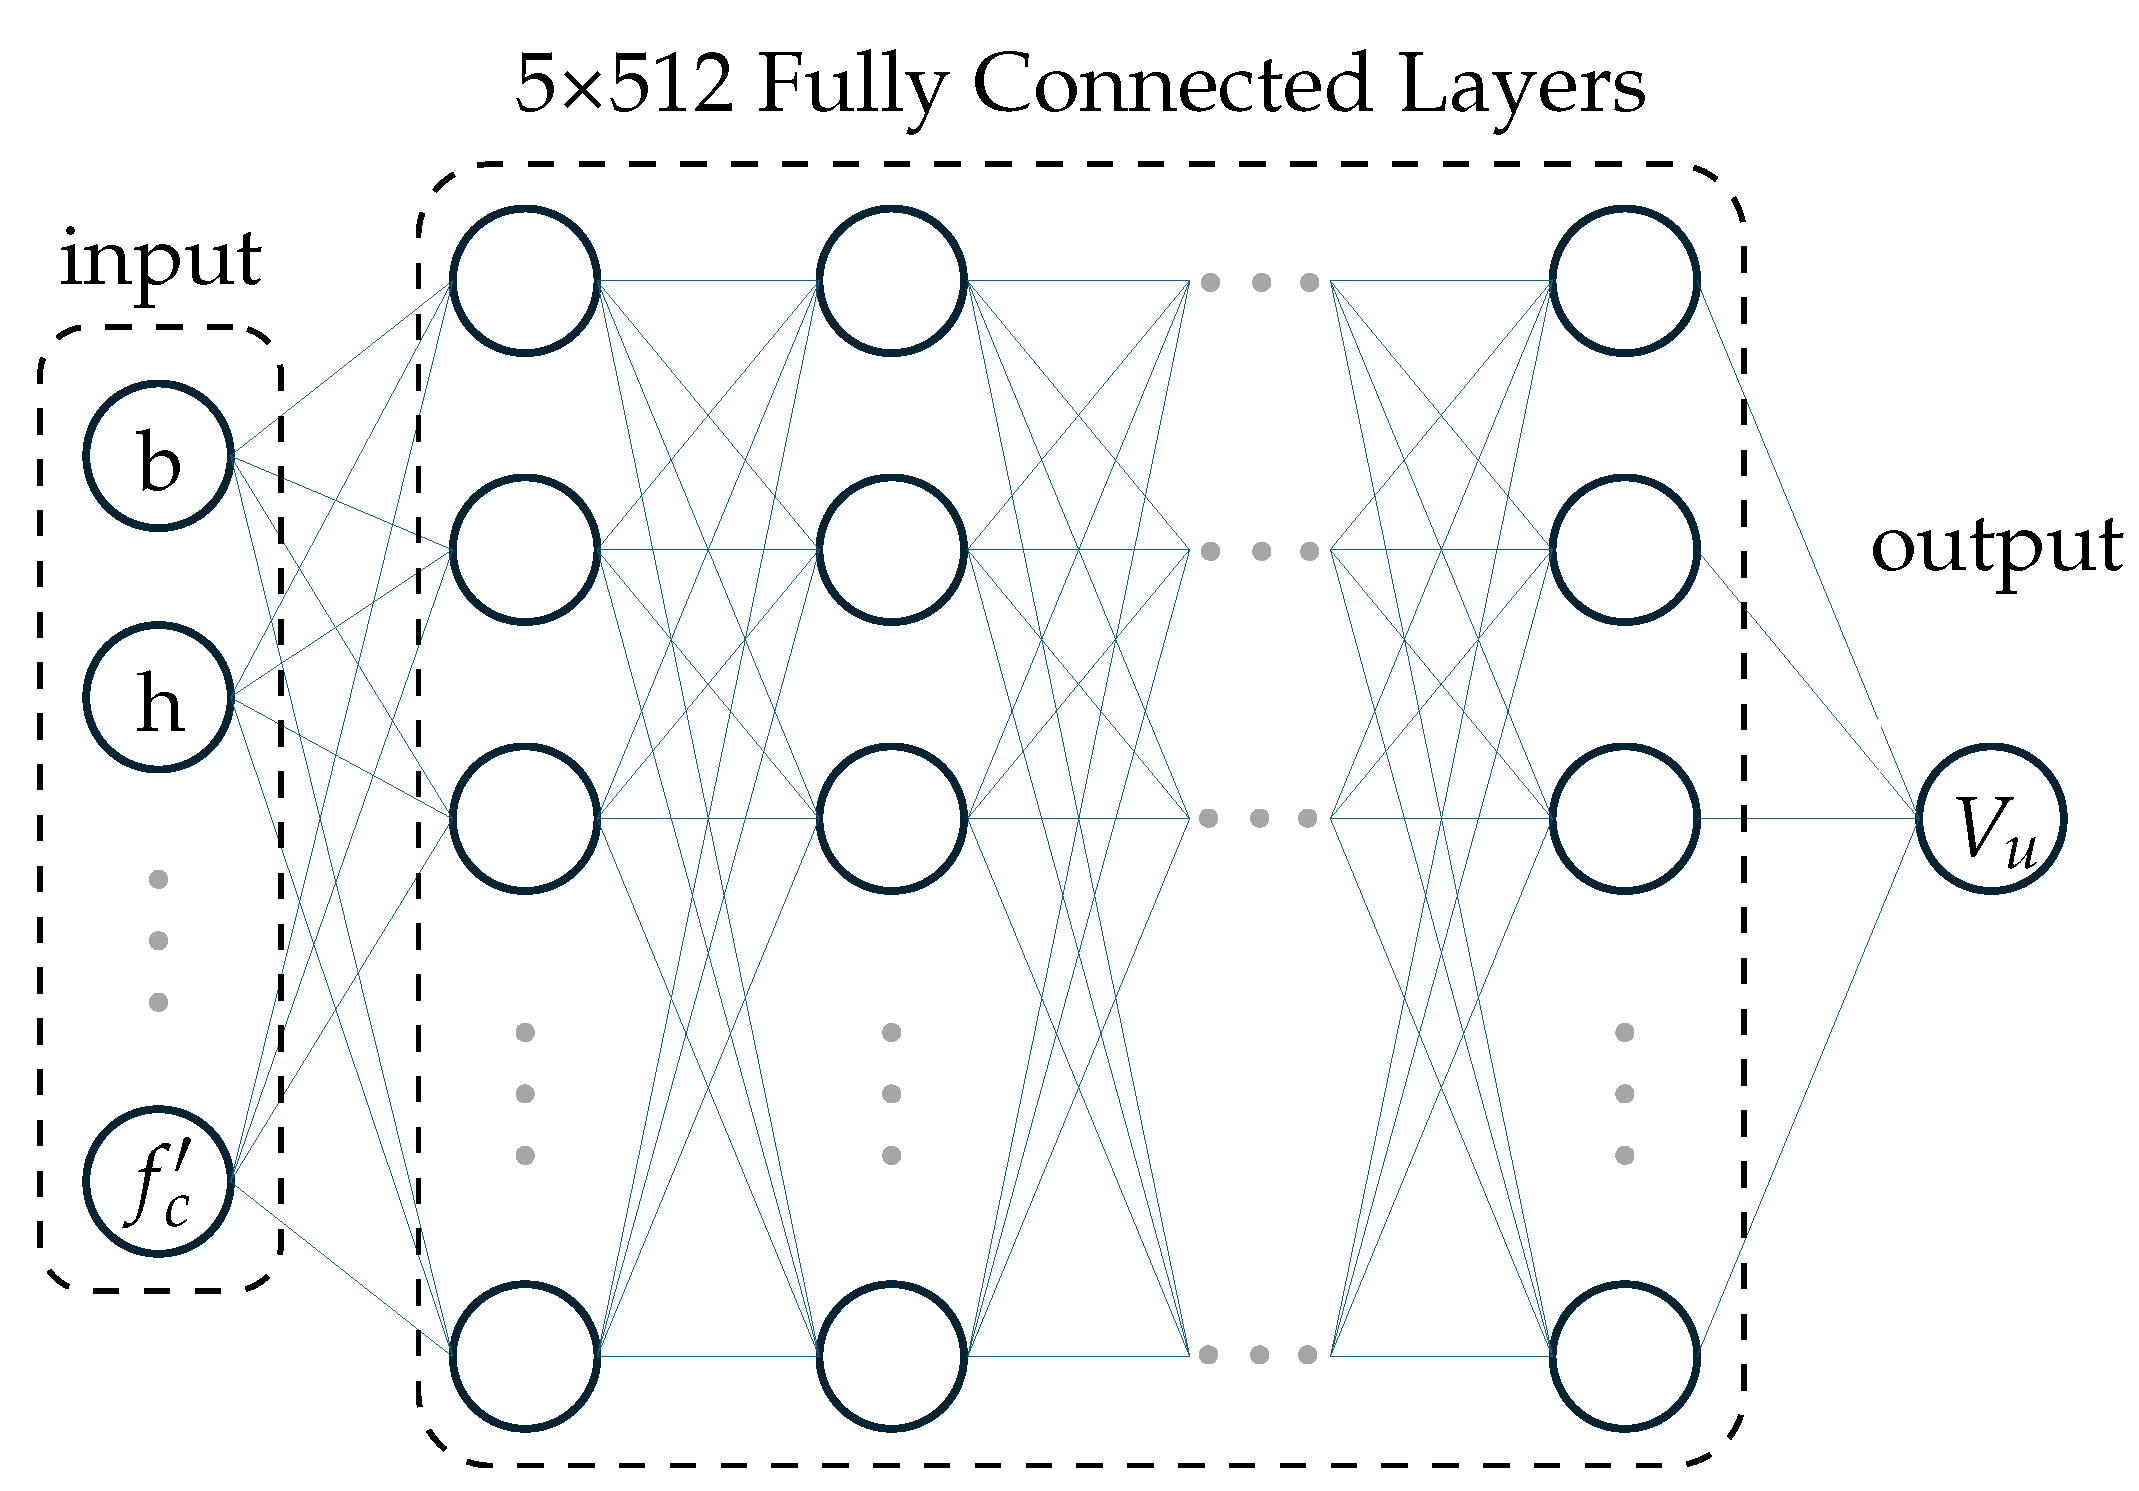
Following this configuration, the synthesizer was used to generate three datasets of varying sizes—10,000, 100,000, and 1,000,000 instances of independent variables (input features). Each dataset was then fed into the trained ANN model to estimate the ultimate shear strength. The predicted shear strength values, along with their corresponding input parameters, formed three synthetic datasets of different scales.
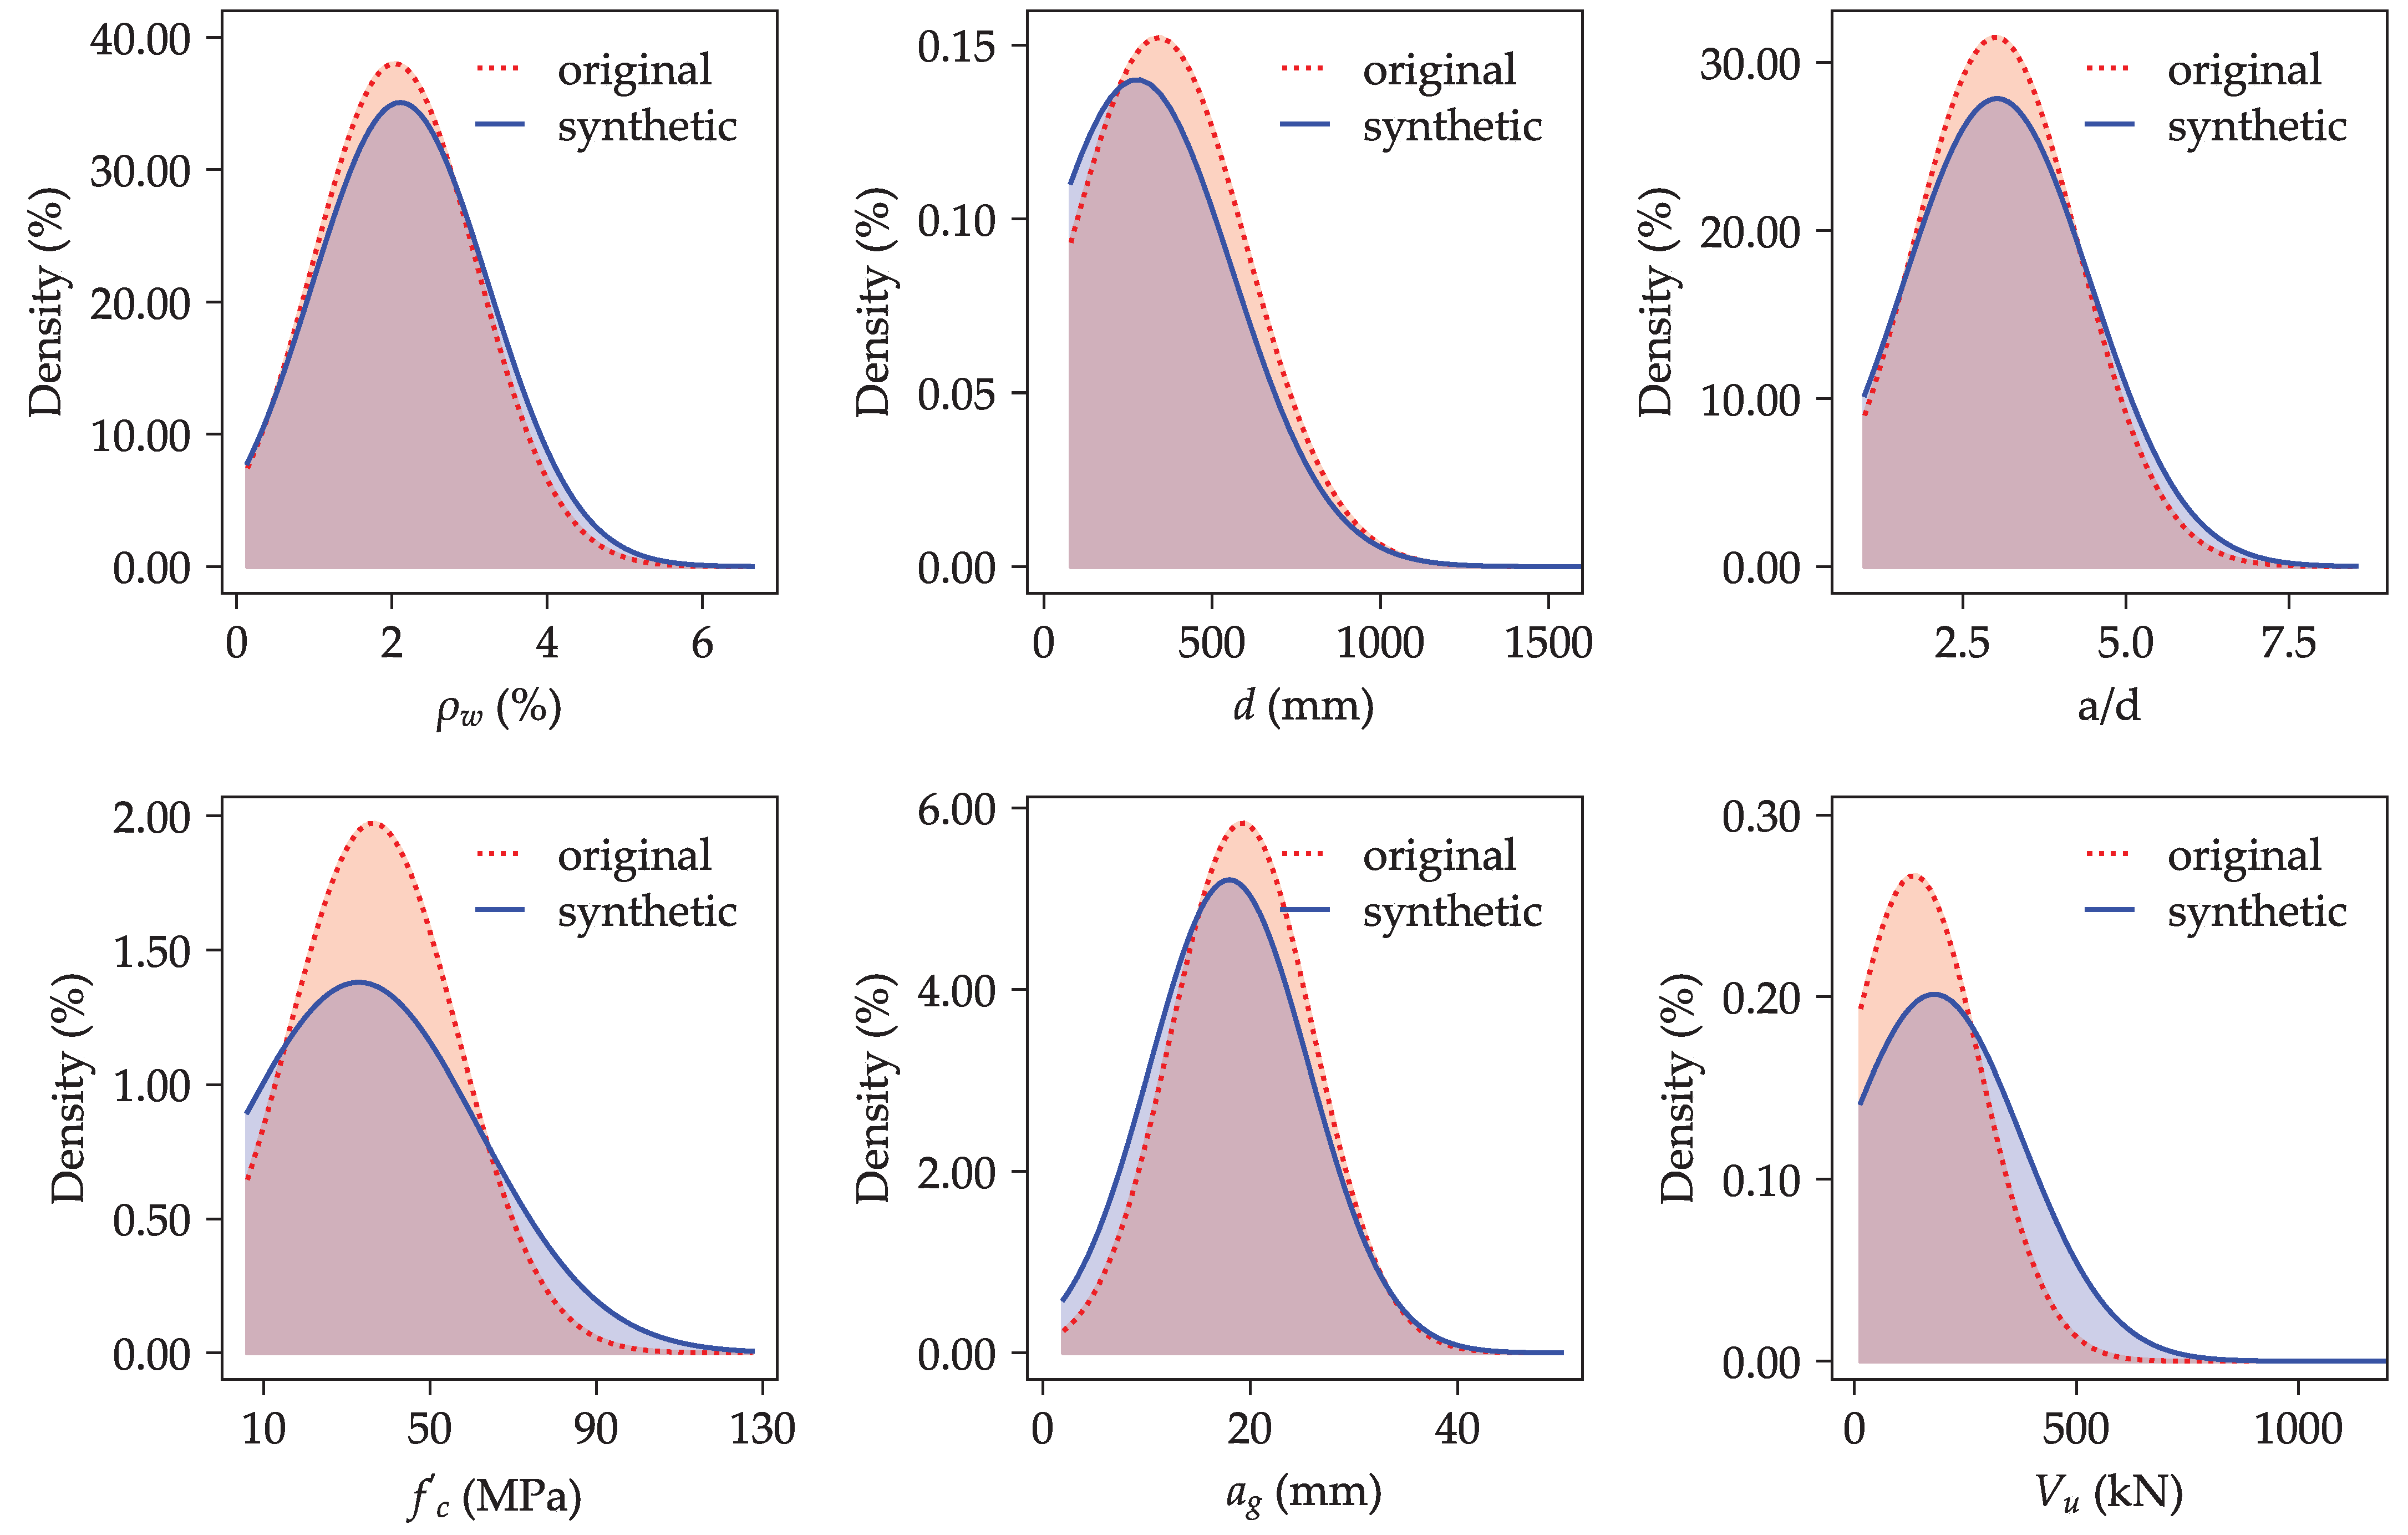
Figure 8 presents density plots comparing the distributions of key variables in the original and synthetic datasets, corresponding to the parameters included in the shear strength model in Equation (
6). The synthetic data, represented by solid blue curves, exhibit broader distributions across all variables. This broader coverage, particularly at the tails of the distributions, leads to a more uniform representation of the input space. Accordingly, the enriched synthetic dataset provides a robust basis for refining the empirical shear strength model expressed in Equation (
6) by capturing a wider range of input scenarios, which could mitigate overfitting to specific data points and enhance the model’s ability to generalize.
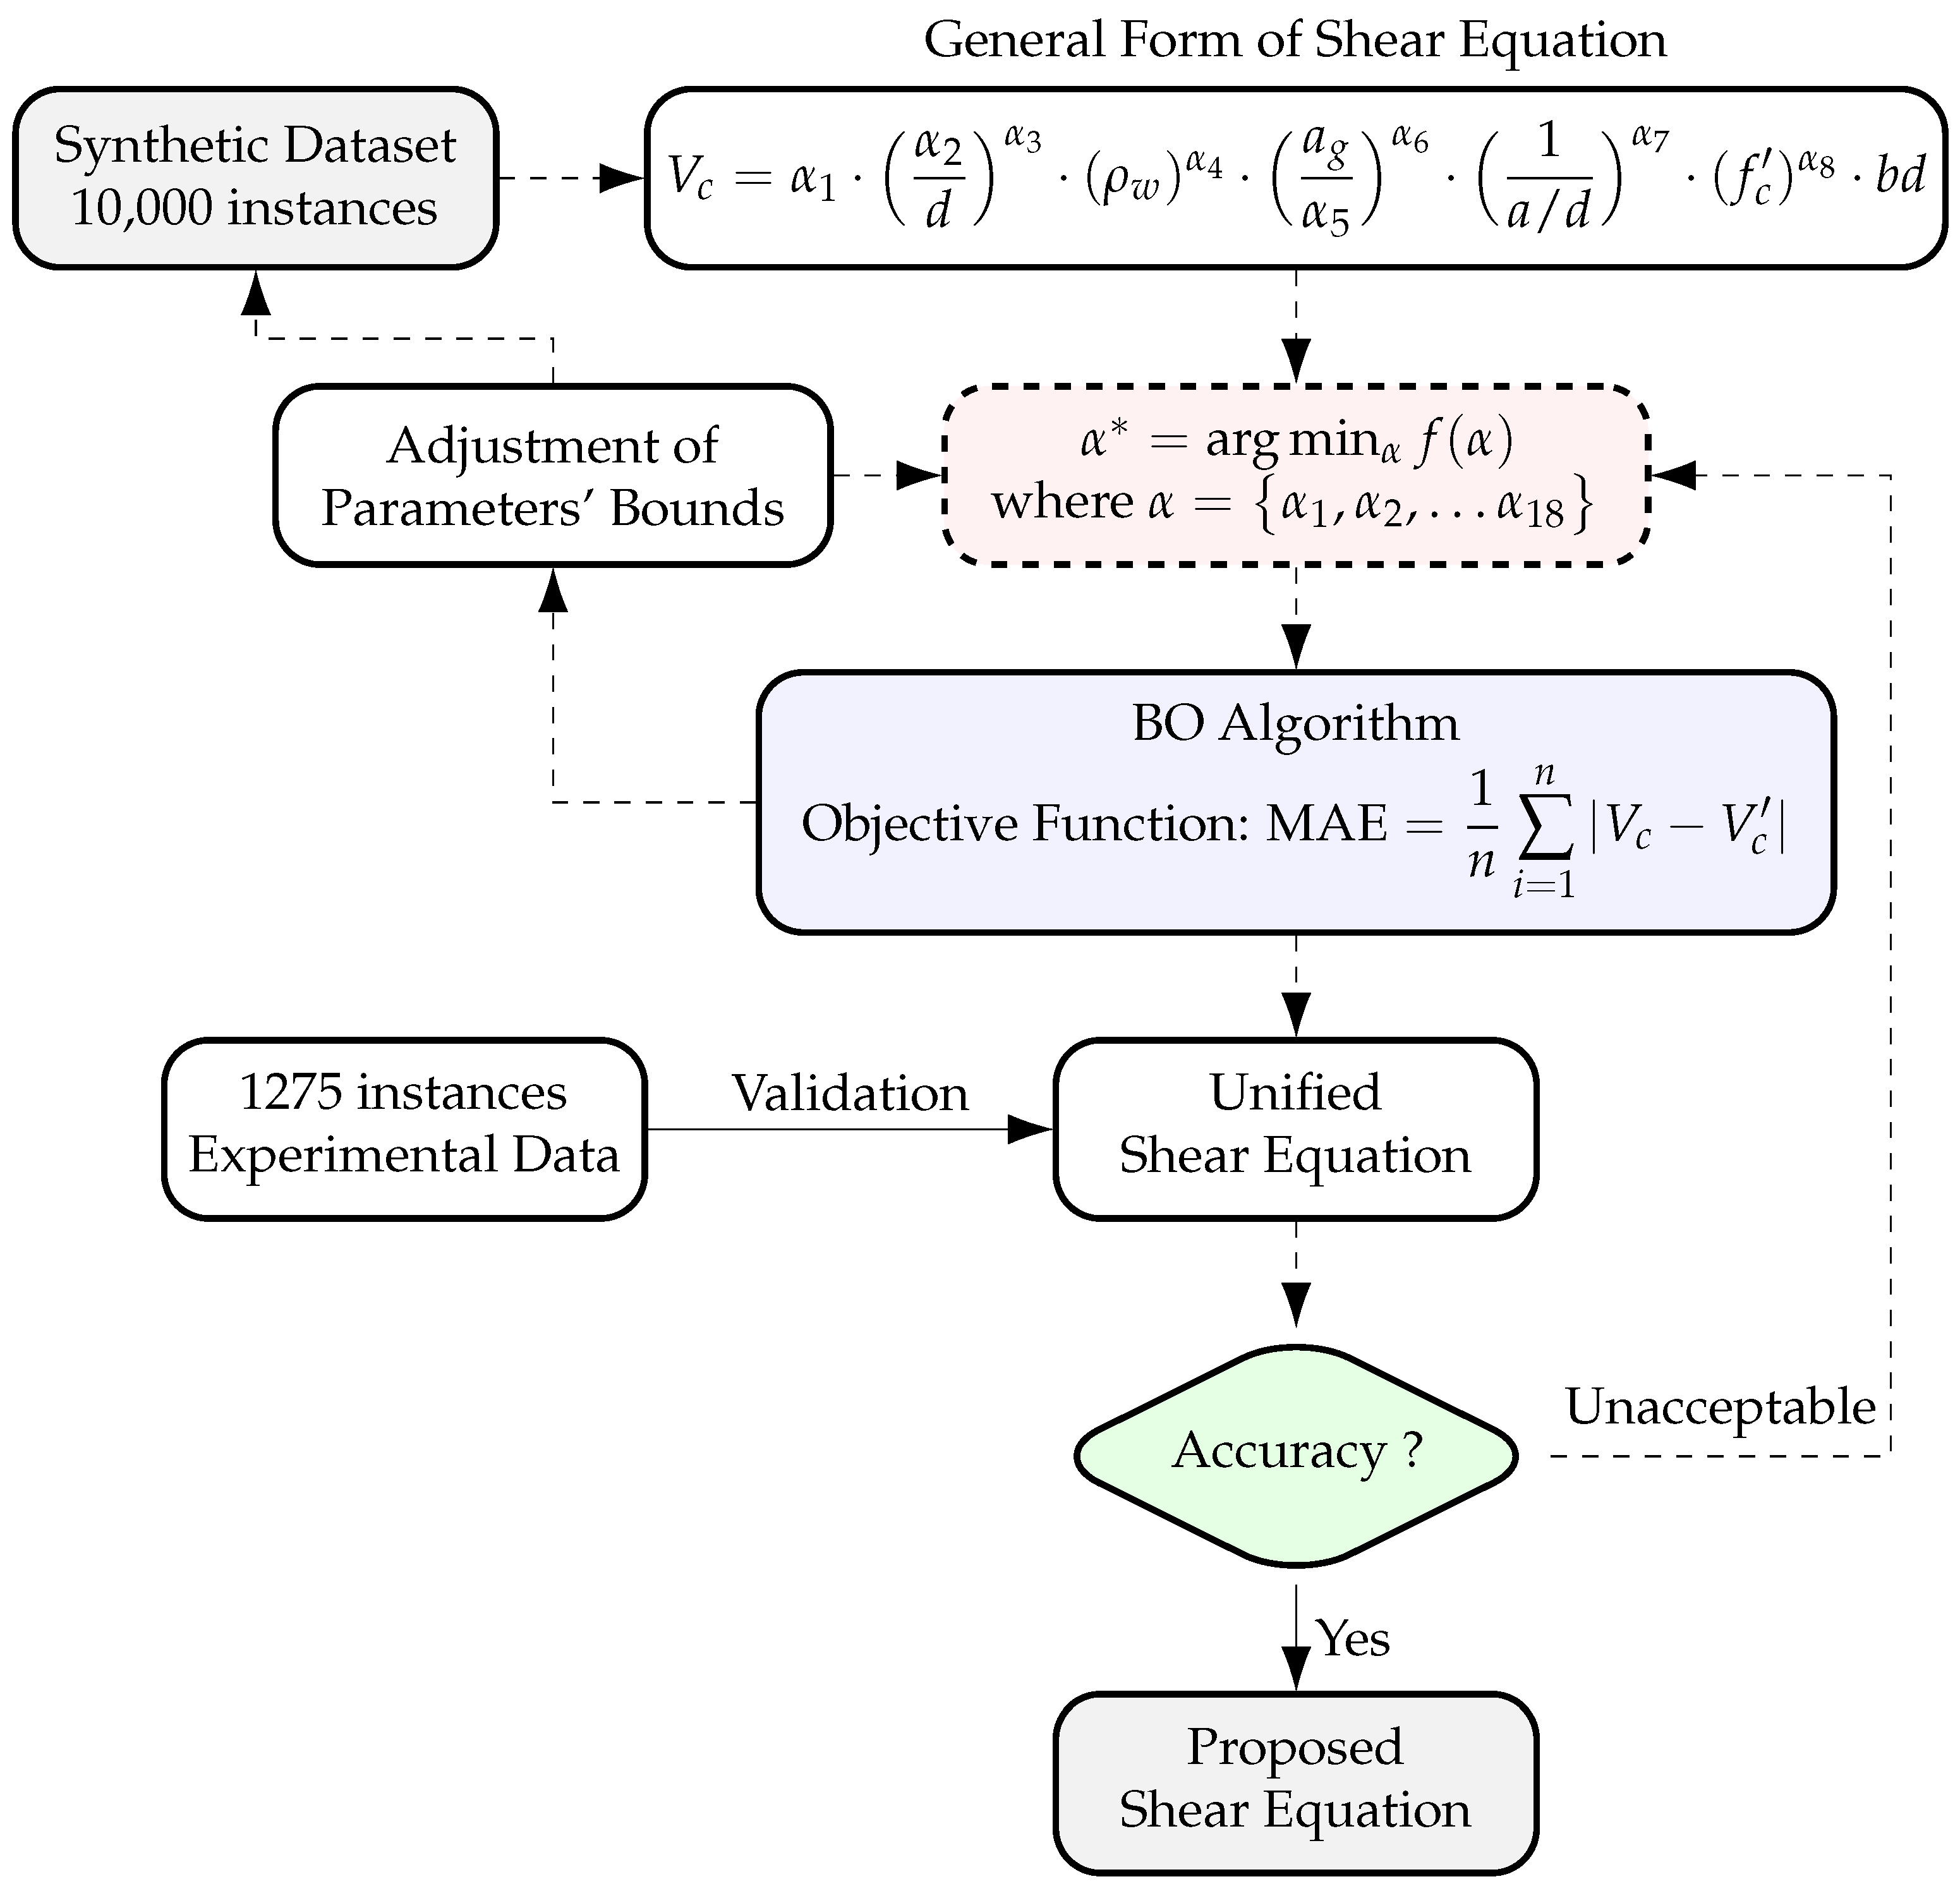
4.3. Derivation of the Shear Equation: A Data-Centric Bayesian Refinement
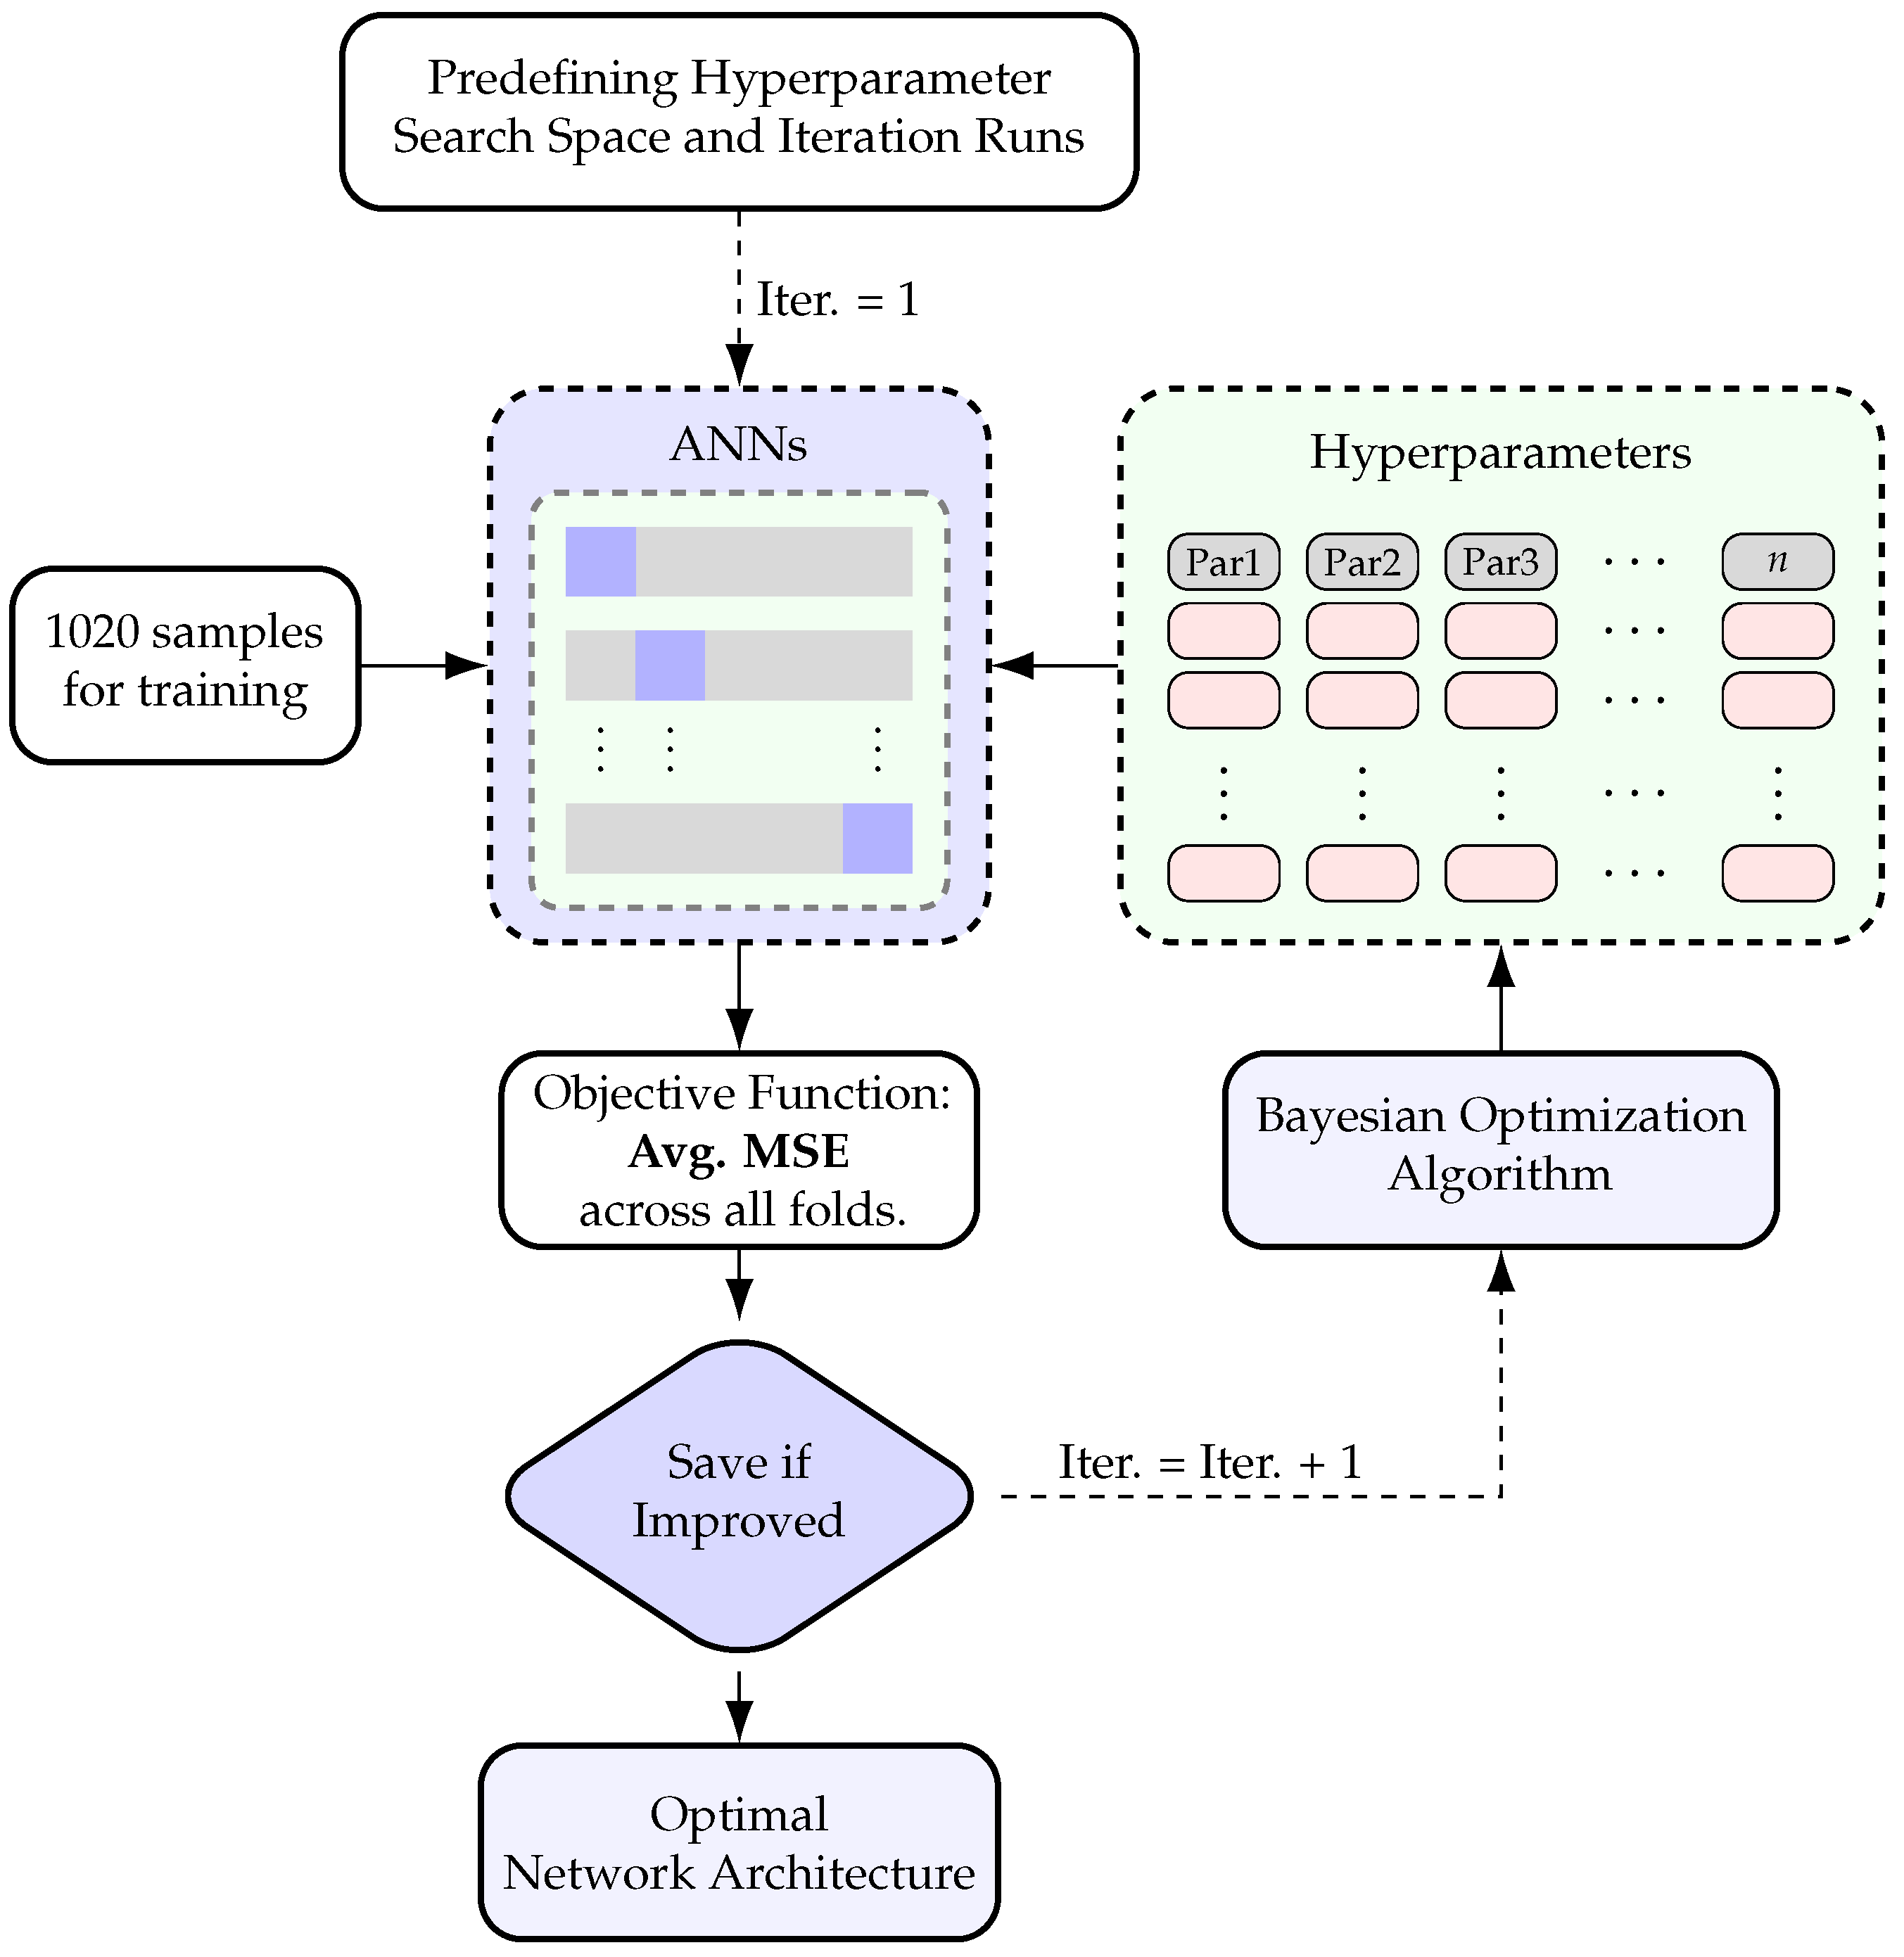
Following the procedure outlined in
Section 3.5.2, the iterative refinement process was implemented, and the number of iterations in the Bayesian optimization (BO) algorithm was adjusted until convergence was attained. The objective was to maximize the performance of Equation (
6) using expanded synthetic datasets of varying sizes—10,000, 100,000, and 1,000,000 instances. Initially, the BO algorithm was executed with
realizations for each dataset. However, no significant improvement was observed across the three dataset sizes. Accordingly, the smallest dataset (10,000 instances) was selected for further analysis, and the BO algorithm was rerun with
and
realizations to investigate the effect of more extensive exploration. Each configuration was repeated twice to ensure the consistency and reliability of the results.
This comprehensive optimization yielded an optimal set of parameters, forming the basis of the proposed unified equation presented in Equation (
11) for estimating the shear strength of rectangular RC beams without stirrups. The bounds of each term in the equation were translated into corresponding physical property limits. The equation incorporates both lower and upper bounds for each term, determined through the BO procedure, as detailed below:
Therein, the size effect factor
and shear-span-to-depth ratio factor
are expressed as
As shown in Equation (
11), the proposed shear strength equation differs from the provisions in ACI 318-25 [
6] and CSA A23.3-24 [
7] by introducing an updated expression for the size effect term (
) and explicitly incorporating the shear-span-to-depth ratio (
).
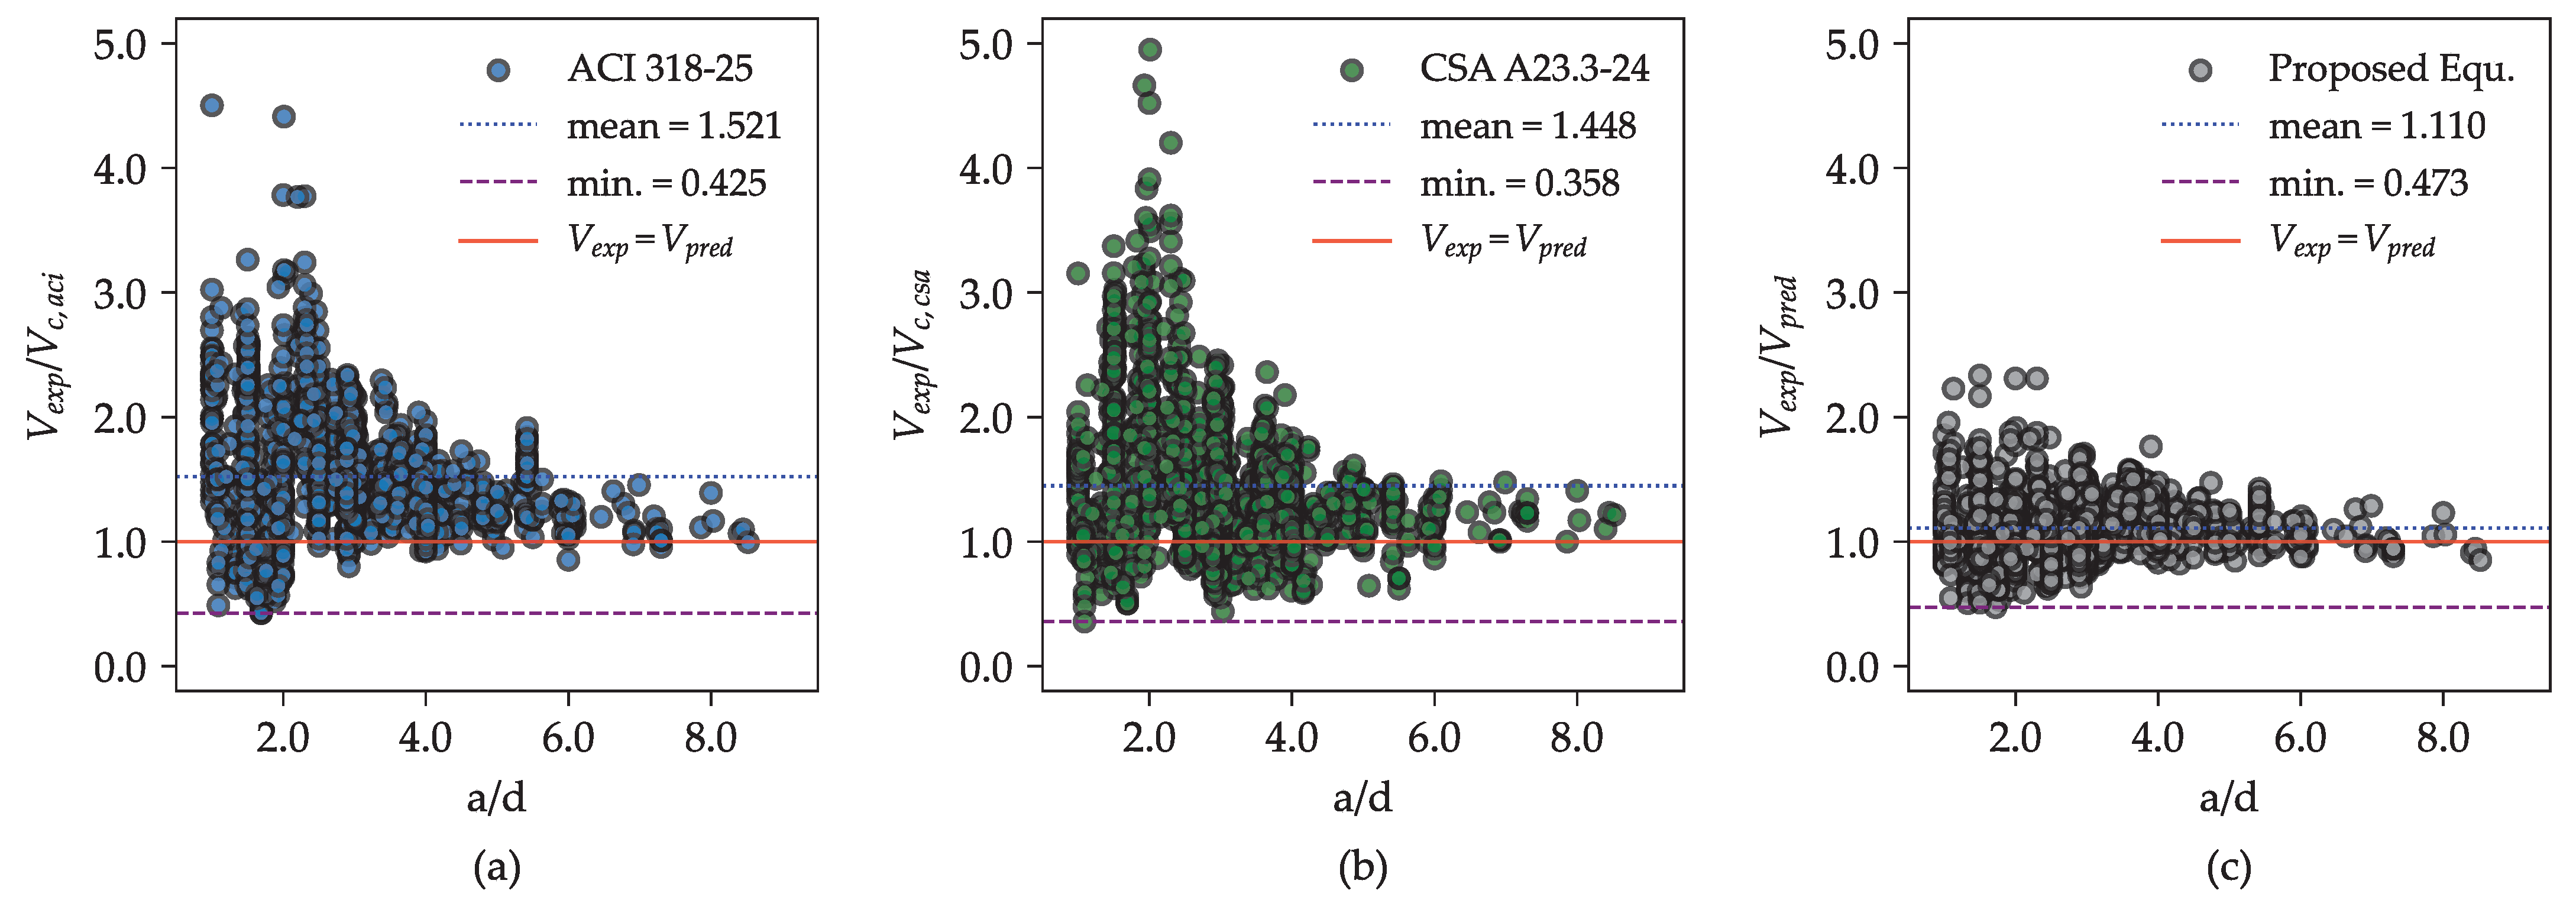
Figure 9 illustrates the resulting models based on the proposed equation, highlighting how the size effect term
contributes to the total shear strength with varying effective depths (
d), and how the shear-span-to-depth ratio term
influences the total shear strength across different
ratios. The figure also includes scatter plots of the experimental data for comparison.
As depicted in
Figure 9, the forms of
and
in the proposed model capture the general trends observed experimentally. Although some extreme data points are not fully matched, the model demonstrates consistent agreement with the overall dataset.
In the plot in
Figure 9, the parameter
, defined as
was introduced specifically to improve the clarity and readability of the plot caption.
In terms of concrete’s compressive strength (
), the maximum limit for
is 68.9 MPa (implied by
) according to ACI 318-25 [
6], and 64 MPa (implied by
) according to CSA A23.3-24 [
7]. However, the BO algorithm identified a limit for the term
, which corresponds to
MPa. This value is slightly higher than those prescribed by both provisions but closely aligns with the findings of Pendyala et al. [
15], who observed that the shear strength of RC beams increases with
up to approximately 90 MPa. This highlights the capability of BO framework to detect realistic physical limits that are consistent with experimental observations.
It is important to note that existing design codes adopt conservative limits on
due to limited test data and practical experience with concretes exceeding 70 MPa, as explained in the ACI 318-25 [
6] commentary. Furthermore, these codes incorporate safety margins and partial factors that vary across standards to address uncertainties in material behavior, construction quality, and loading conditions. Due to this variability and the safety philosophies embedded in different codes, the present data-driven study does not directly specify or replace code-adopted safety criteria.
4.6. Robustness of Proposed Shear Equation
To evaluate the robustness of the proposed equation, it is tested against experimental results from rectangular RC beams without stirrups using new datasets that are entirely independent of the original data used during model development. These include (1) a dataset compiled by Ahmad and Bhargava [
3] for flexural beams with shear-span-to-depth ratios (
) ranging from 2.50 to 6.00; (2) a dataset by Chetchotisak et al. [
35] for deep beams with
ratios between 0.83 and 2.28; and (3) recent test results reported by Daluga et al. [
11], covering
values from 2.33 to 2.90. The first two datasets were filtered to include only specimens tested after 2007, in order to avoid any overlap with the original dataset used for developing Equation (as detailed in
Section 3.2). This filtering ensures a clear separation between development and validation data. The resulting three distinct datasets are summarized in
Table 5.
The purpose of this validation is to determine whether the proposed equation maintains consistent and reliable performance when applied to previously unseen experimental data. A statistical summary of the
ratios for the proposed equation and selected existing provisions, based on the new datasets, is presented in
Table 6 and the scatter plot is illustrated in
Figure 12.
As shown in
Table 5, for flexural beams (i.e., beams with an
ratio between 2.50 and 6.00), the proposed equation yields an average
ratio of approximately 1.043. Despite this slight overestimation, it outperforms existing design provisions, including ACI 318-25 [
6] and CSA A23.3-24 [
7], by providing the closest average ratio to one and the lowest coefficient of variation (COV), reported at 30.49%.
For deep beams ( ratio between 0.83 and 2.28), the proposed equation similarly demonstrates superior predictive accuracy compared to both provisions based on the strut-and-tie method. It achieves the closest ratio to one and the lowest COV among the models evaluated. Overall, across the new dataset comprising 375 test results, the proposed equation achieves a mean ratio of 1.121 with a COV of 30.97%. These results confirm the robustness and generalization capability of the proposed model in predicting the shear strength of RC beams without stirrups, even when applied to data beyond the original calibration set.


