
Contact Load on the Current-Carrying Tribological Performance of Copper–Graphite Composites


Abstract
1. Introduction
2. Experimental
2.1. Composites
2.2. Counterpart Materials
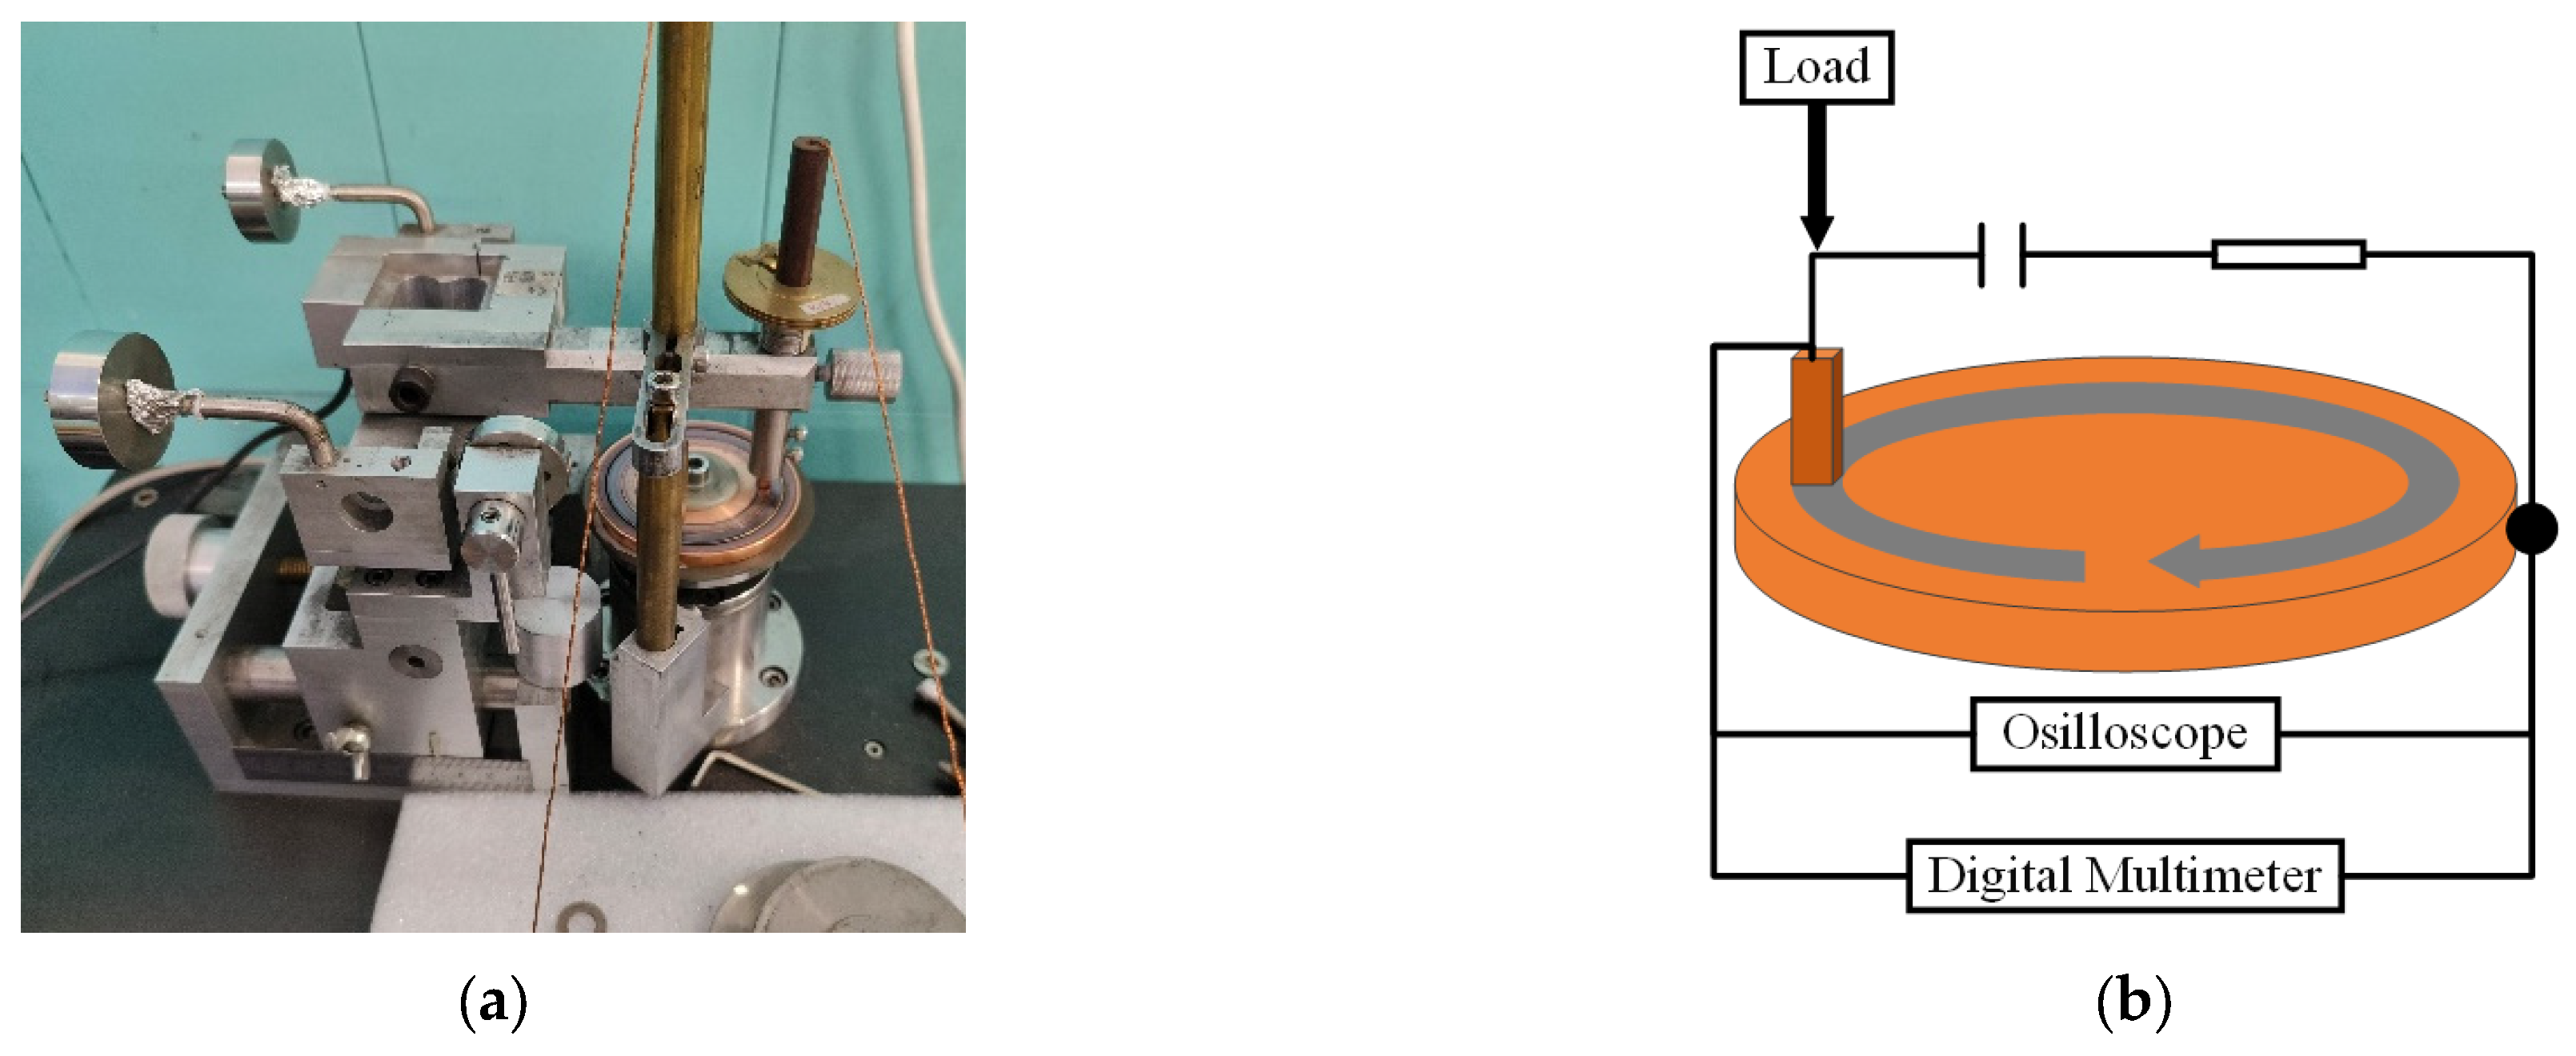
3. Testing
4. Results
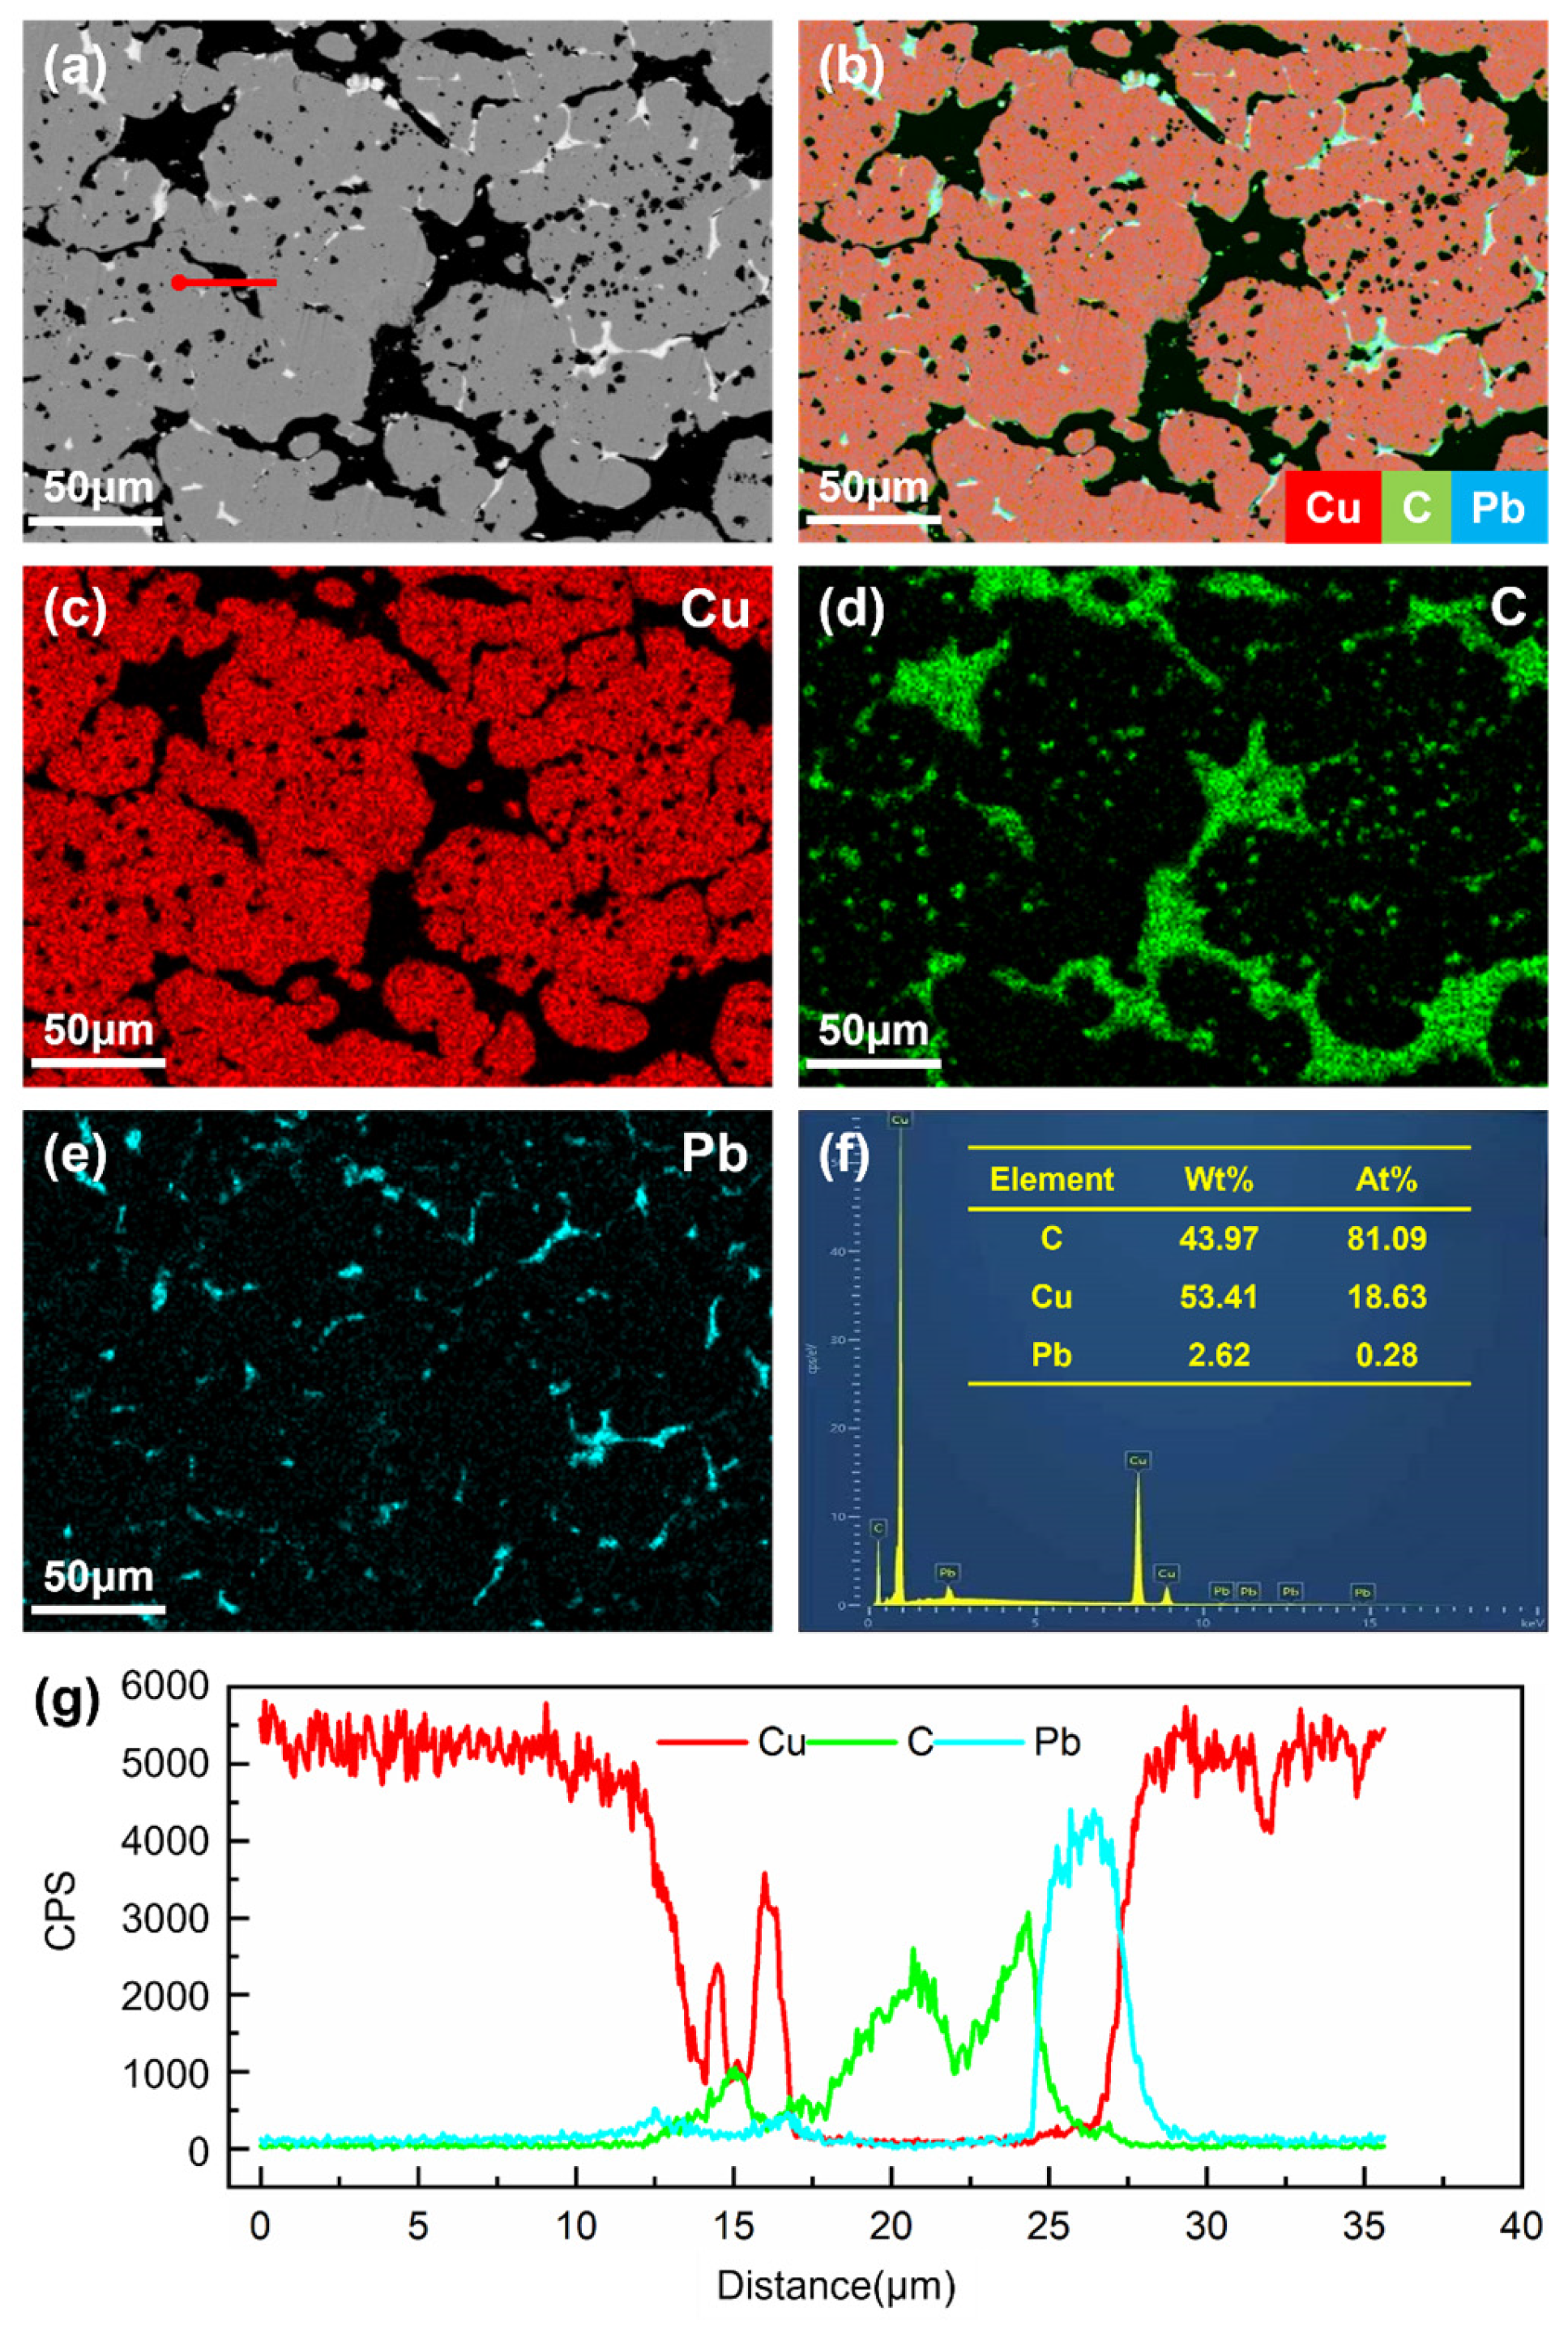
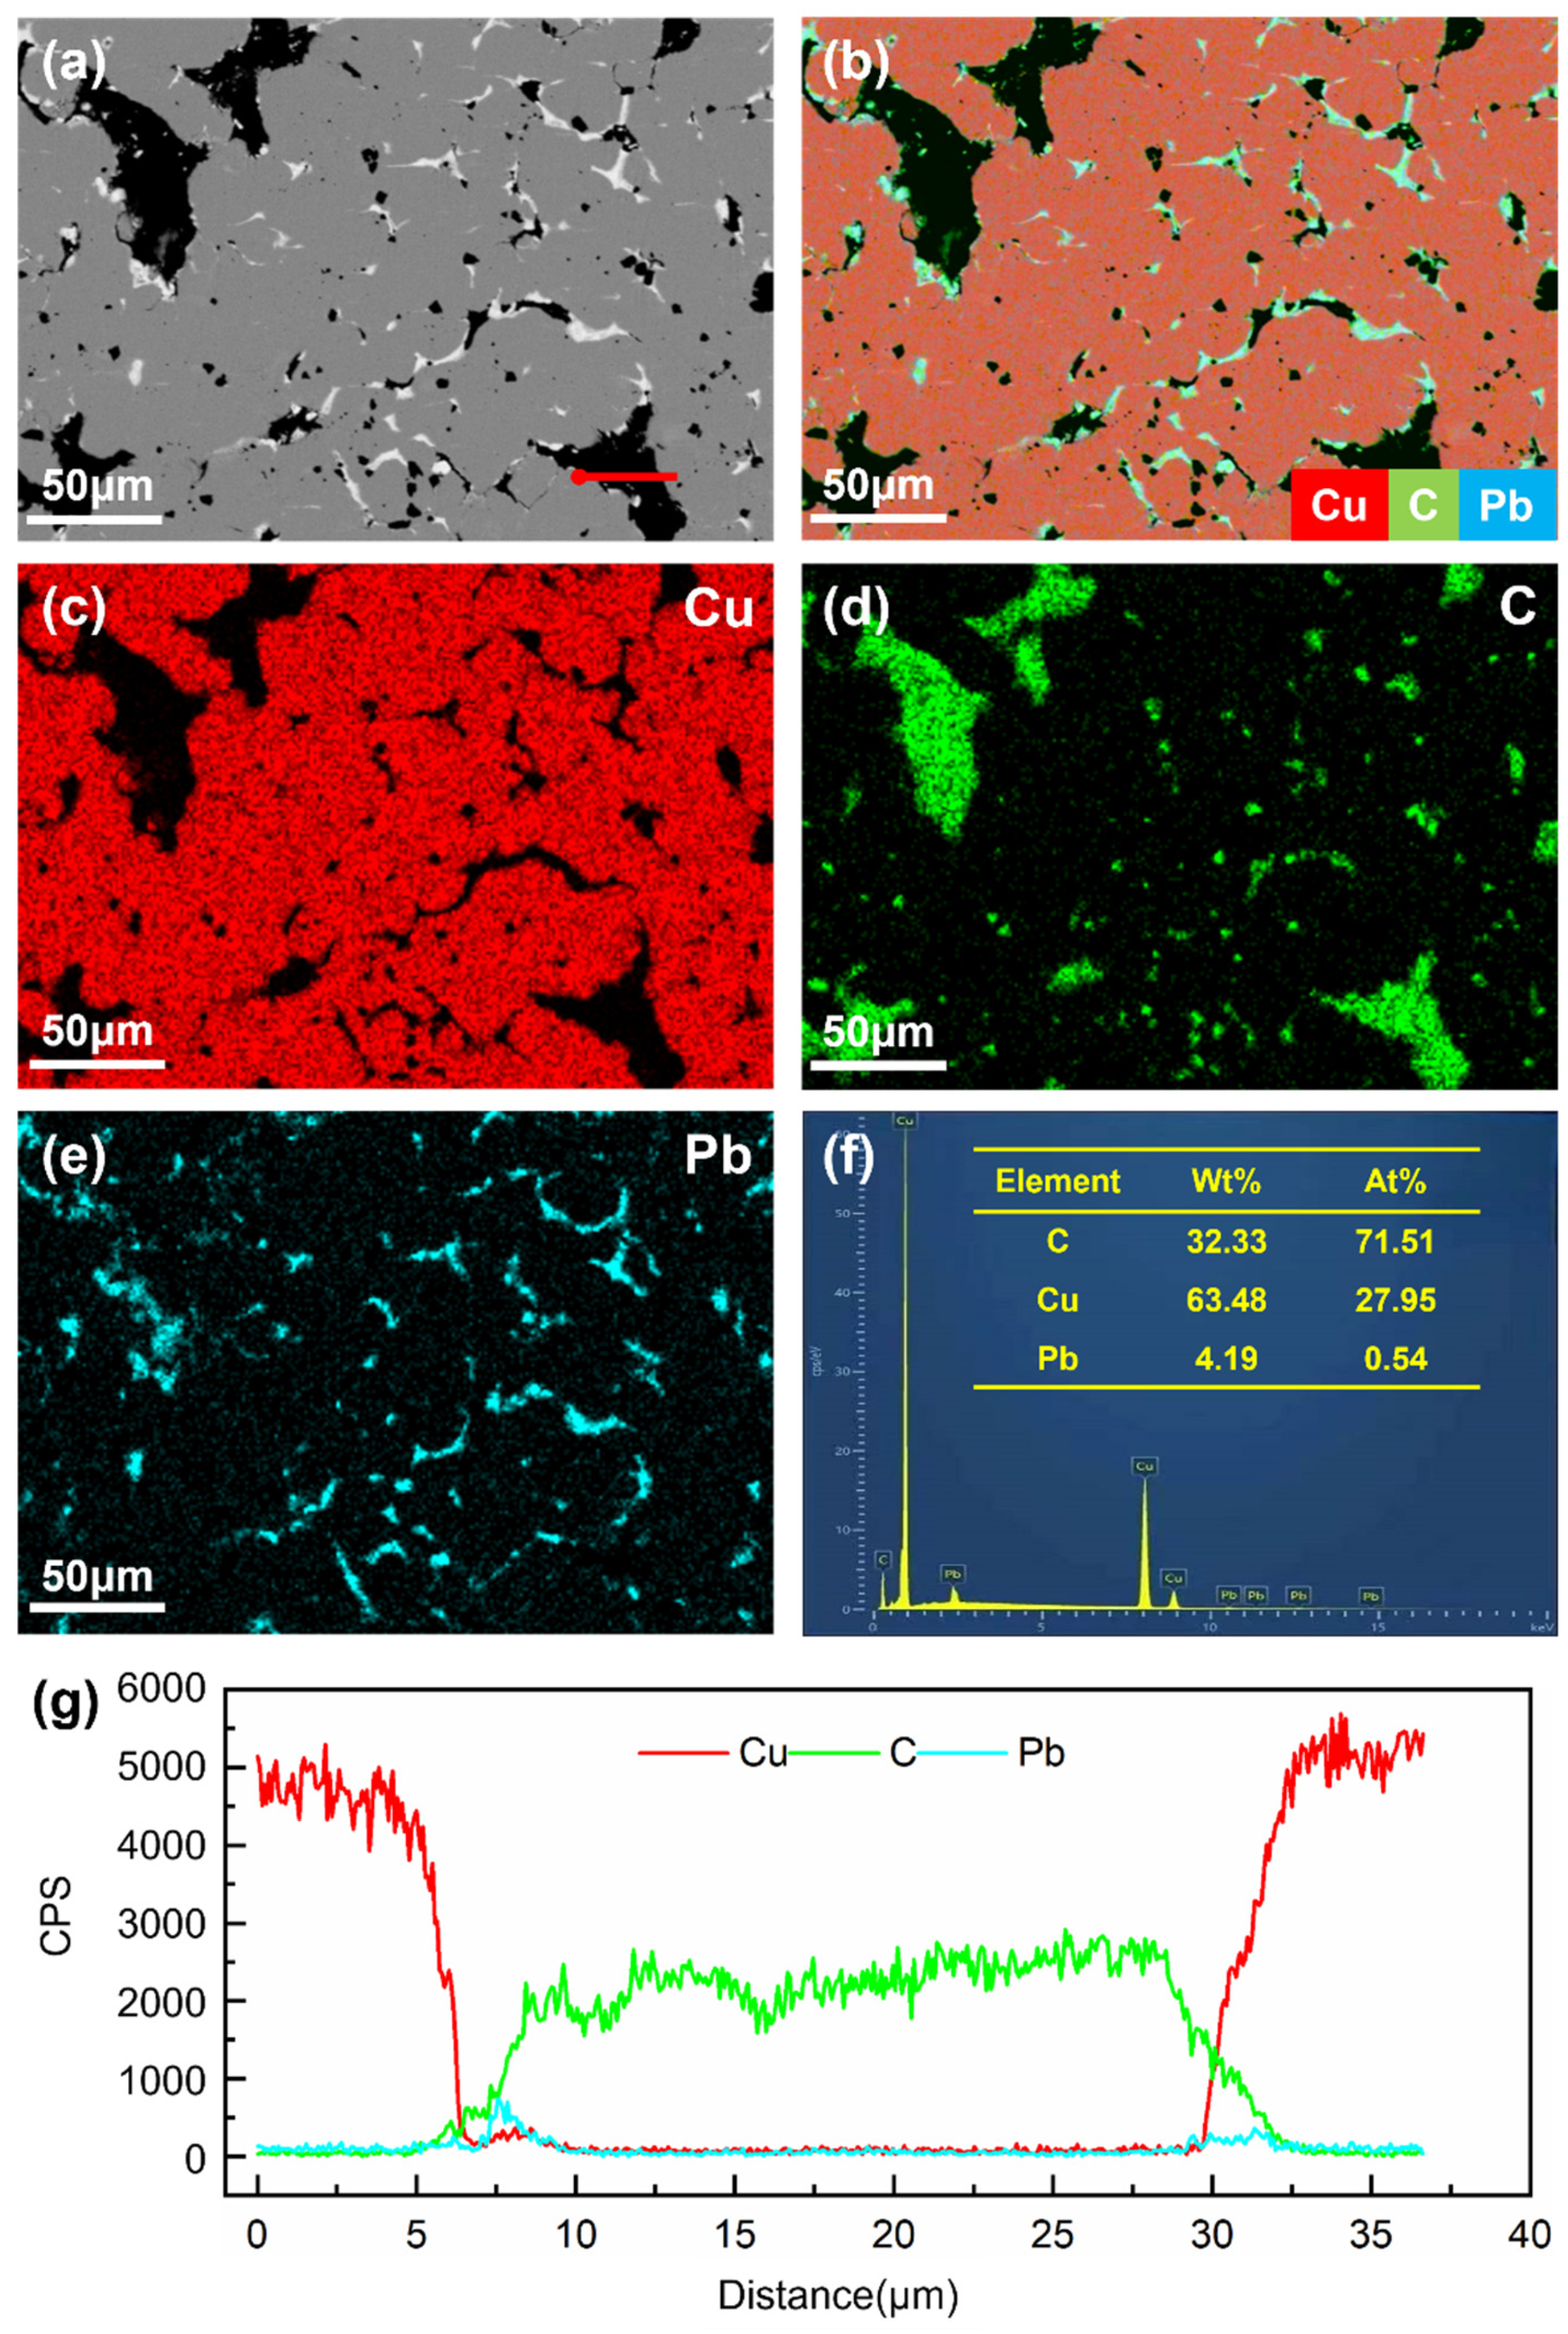
4.1. Microstructure
4.2. Basic Properties
4.3. Current-Carrying Tribological Properties
4.4. Wear Characteristics
5. Conclusions
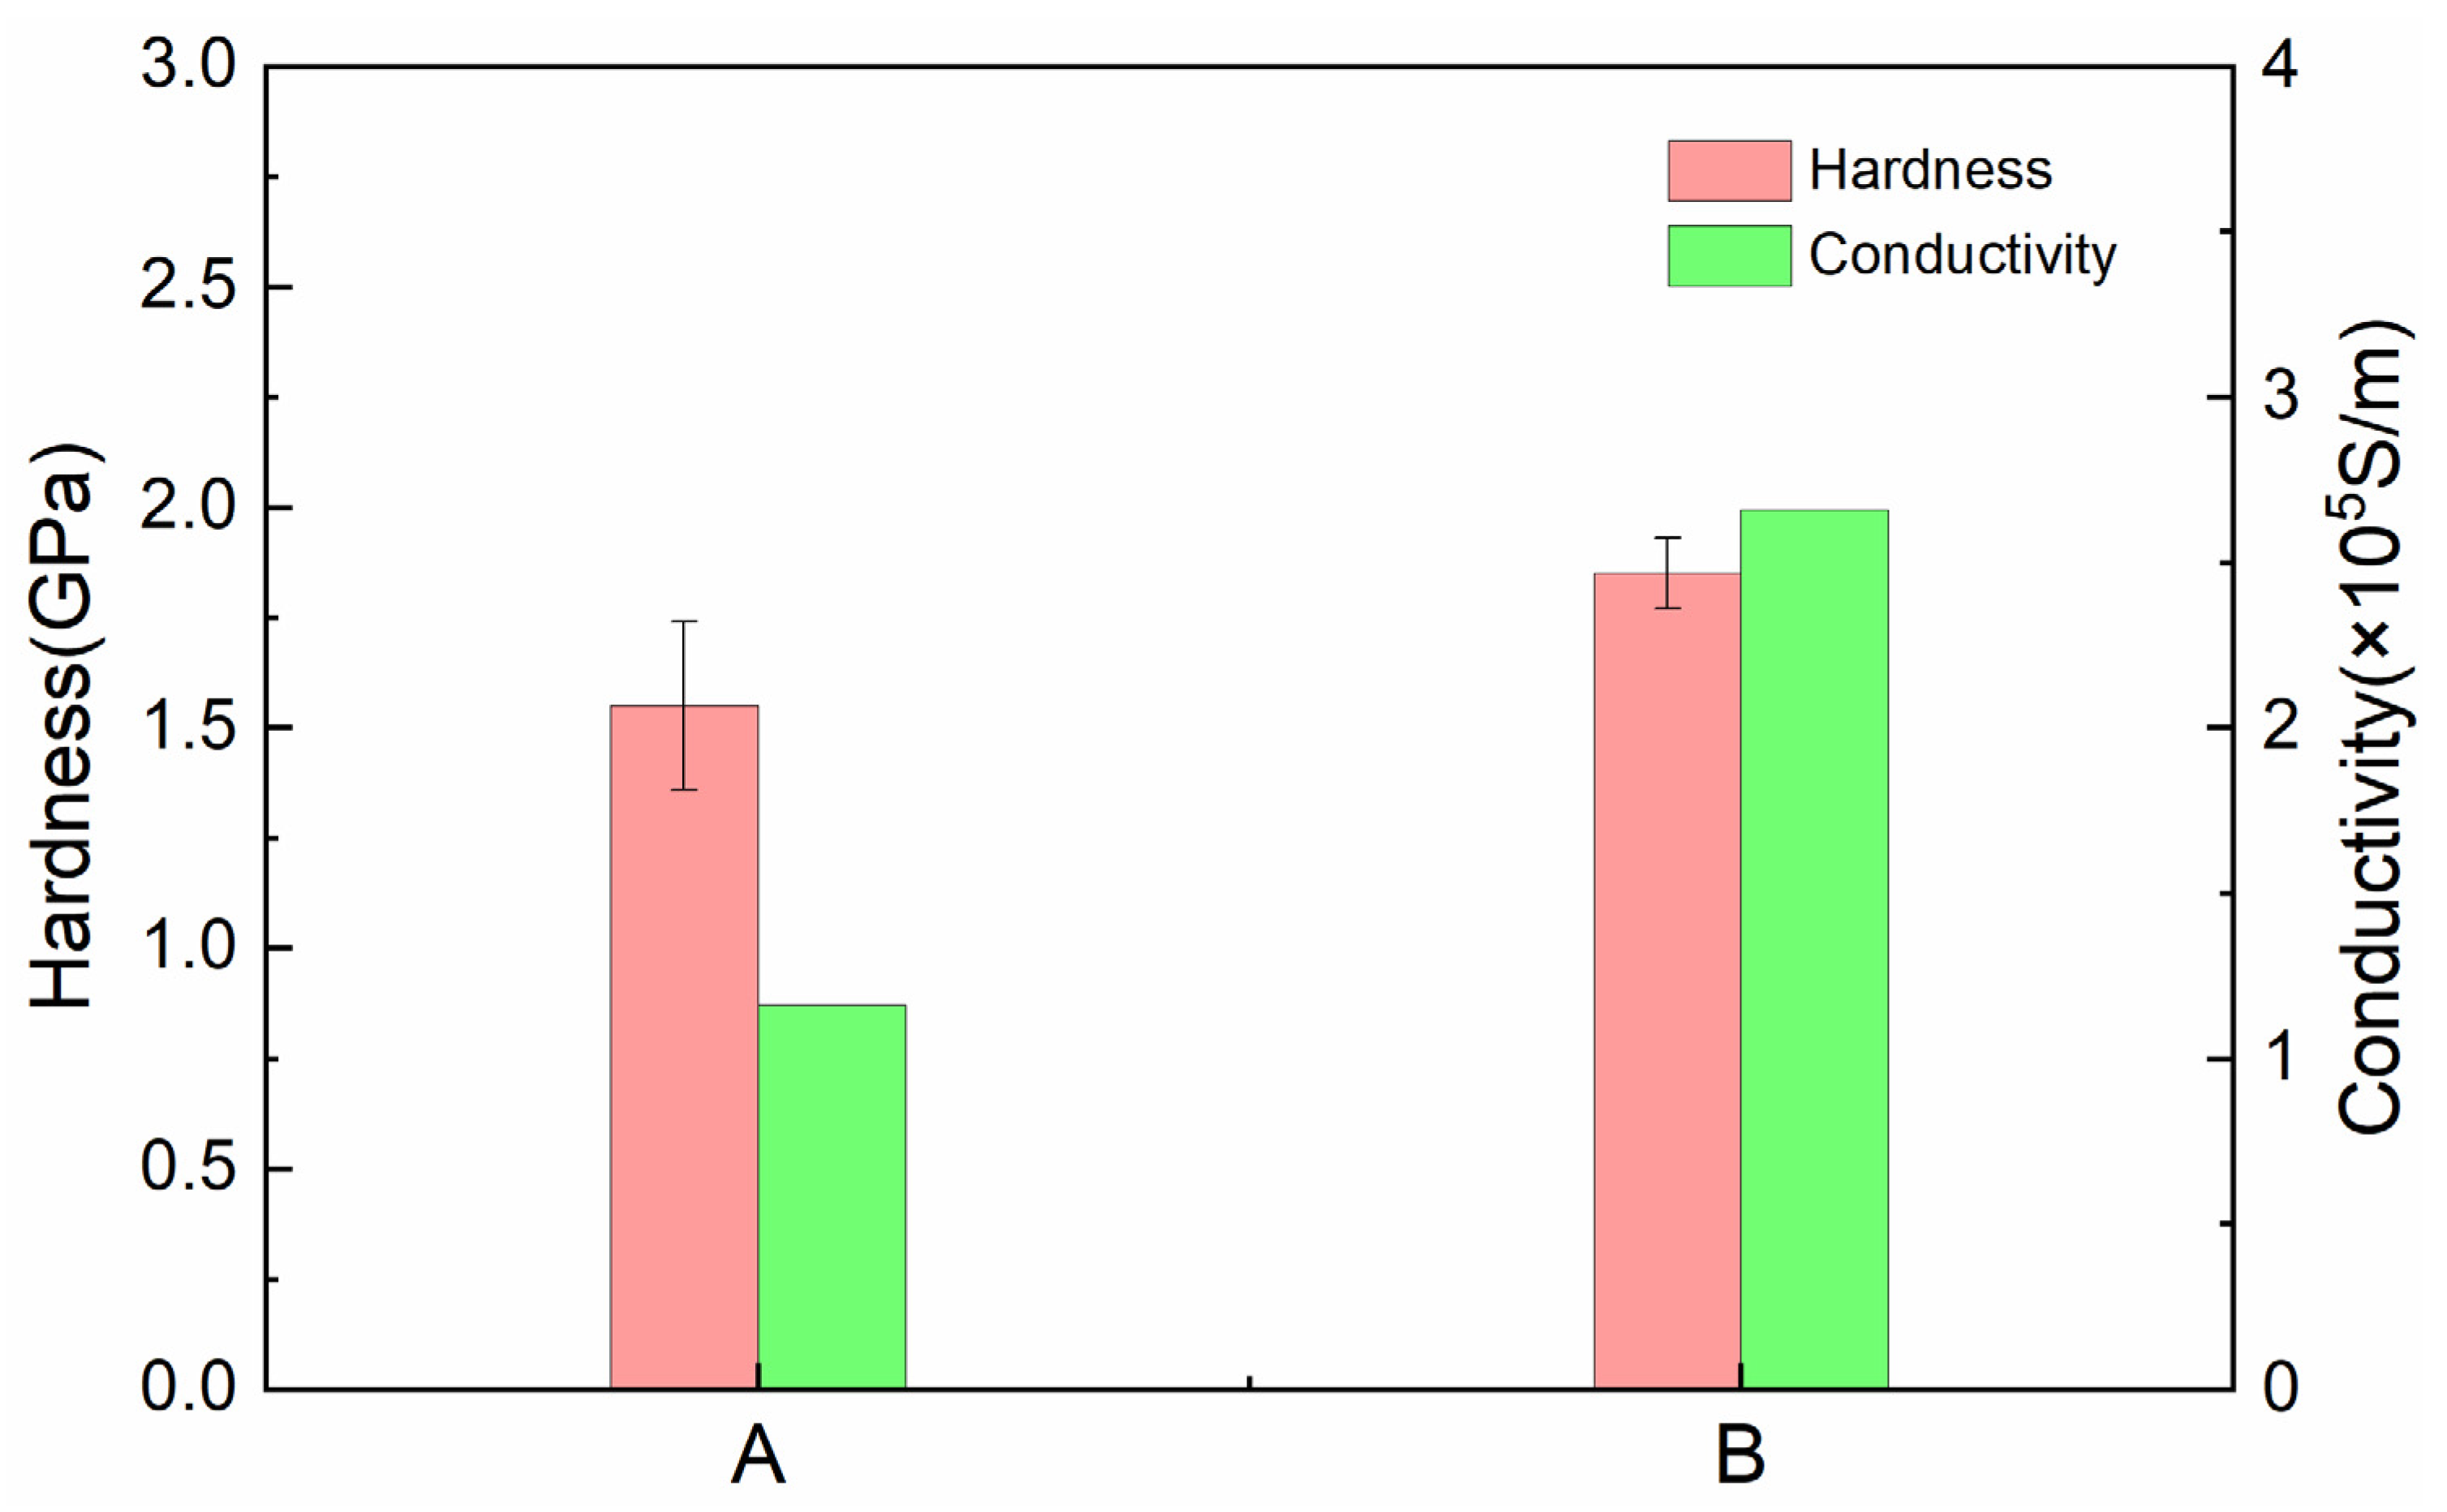
- Composite A, with a higher graphite content, demonstrates enhanced lubrication performance, enabling the formation of stable lubrication films under lower contact loads. However, the increased graphite content also results in reductions in material hardness, electrical conductivity, and relative density. In contrast, composite B exhibits superior performance in terms of hardness and electrical conductivity, rendering it more suitable for electric brush applications.
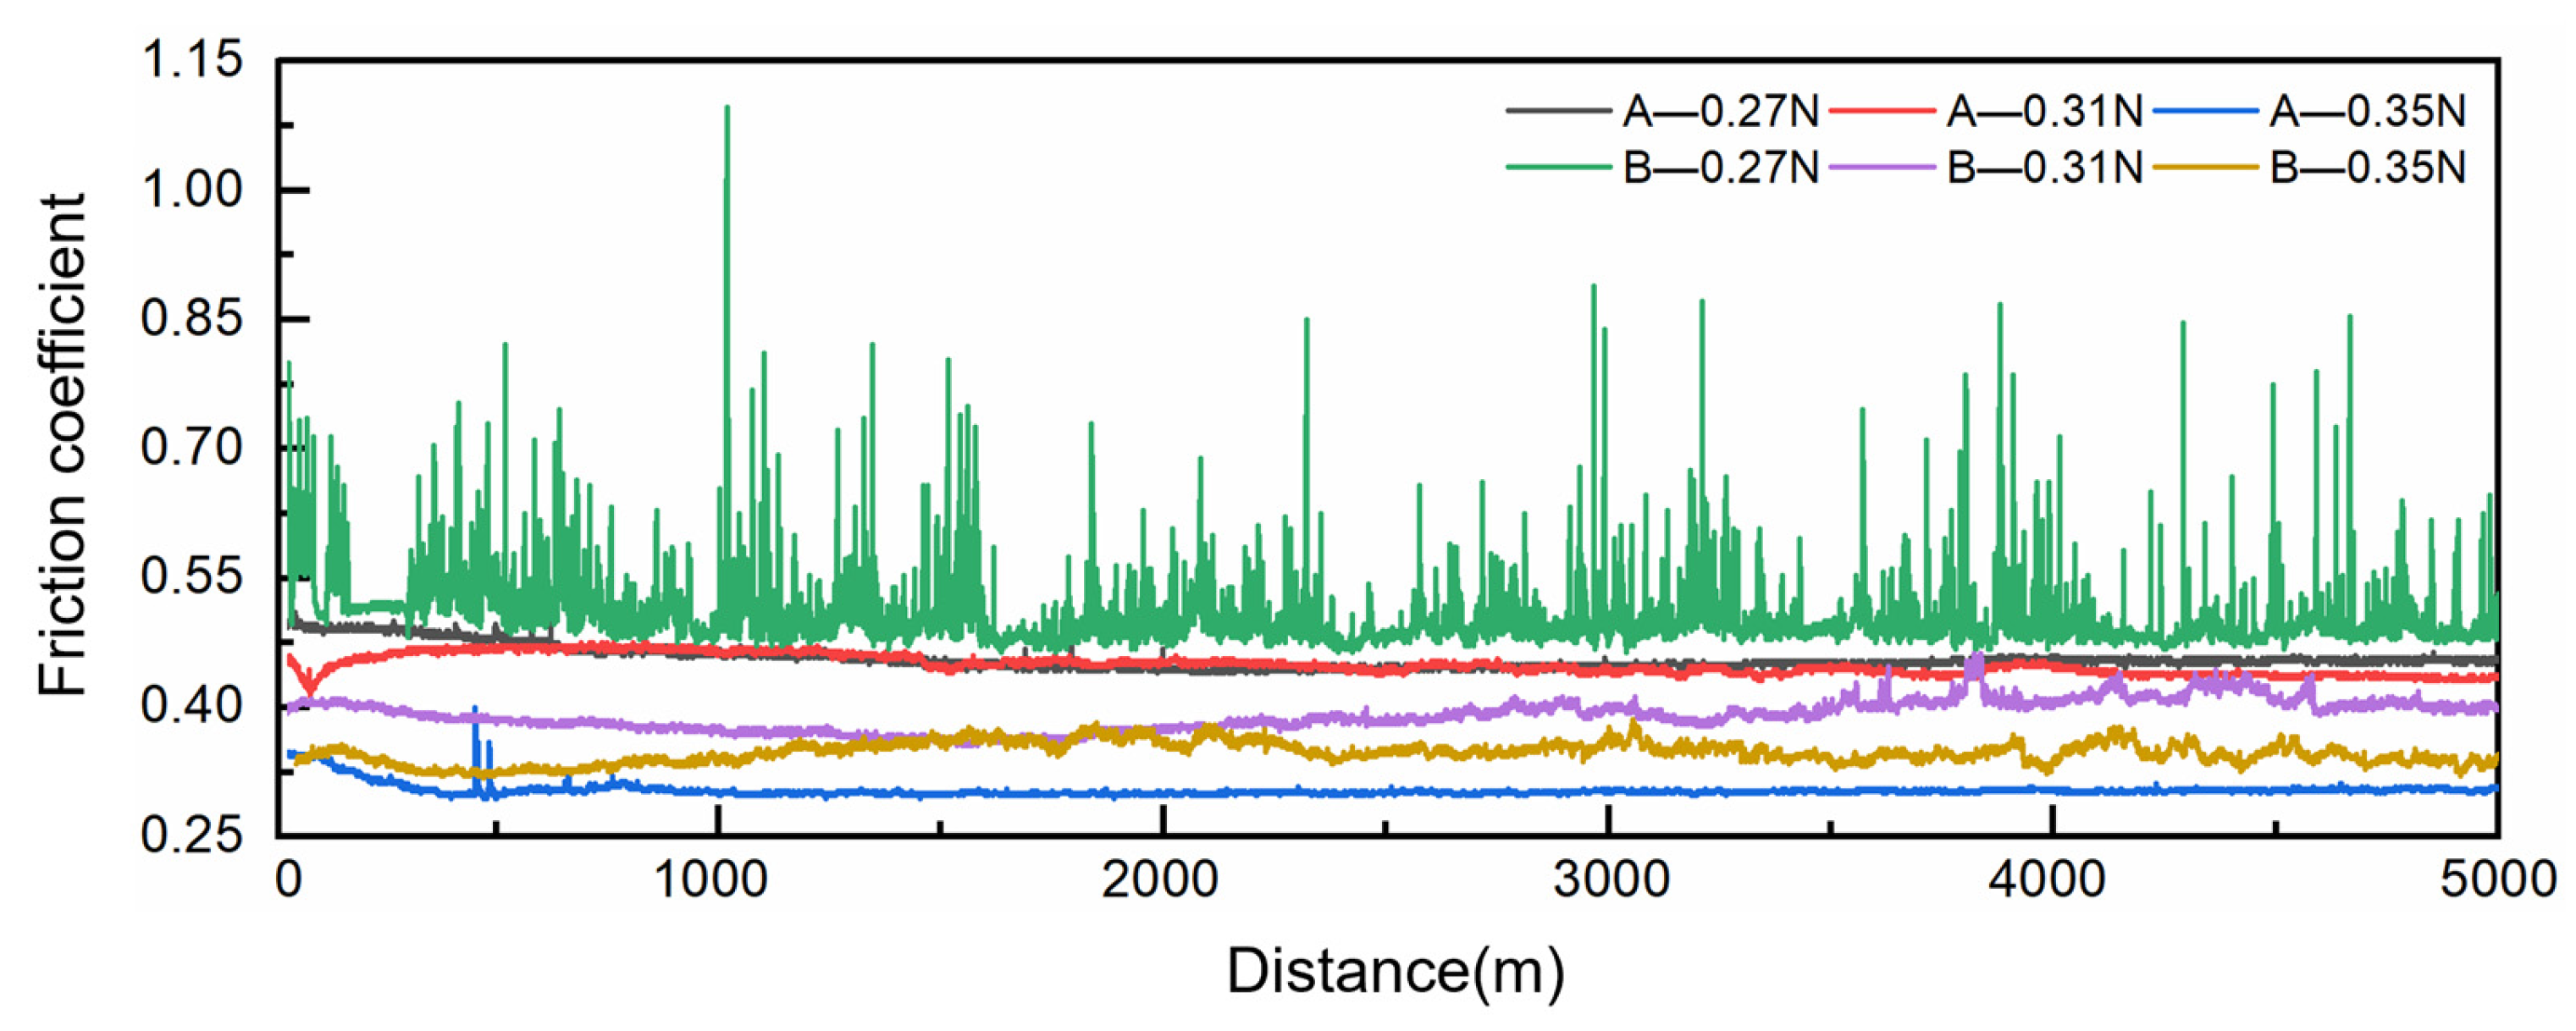
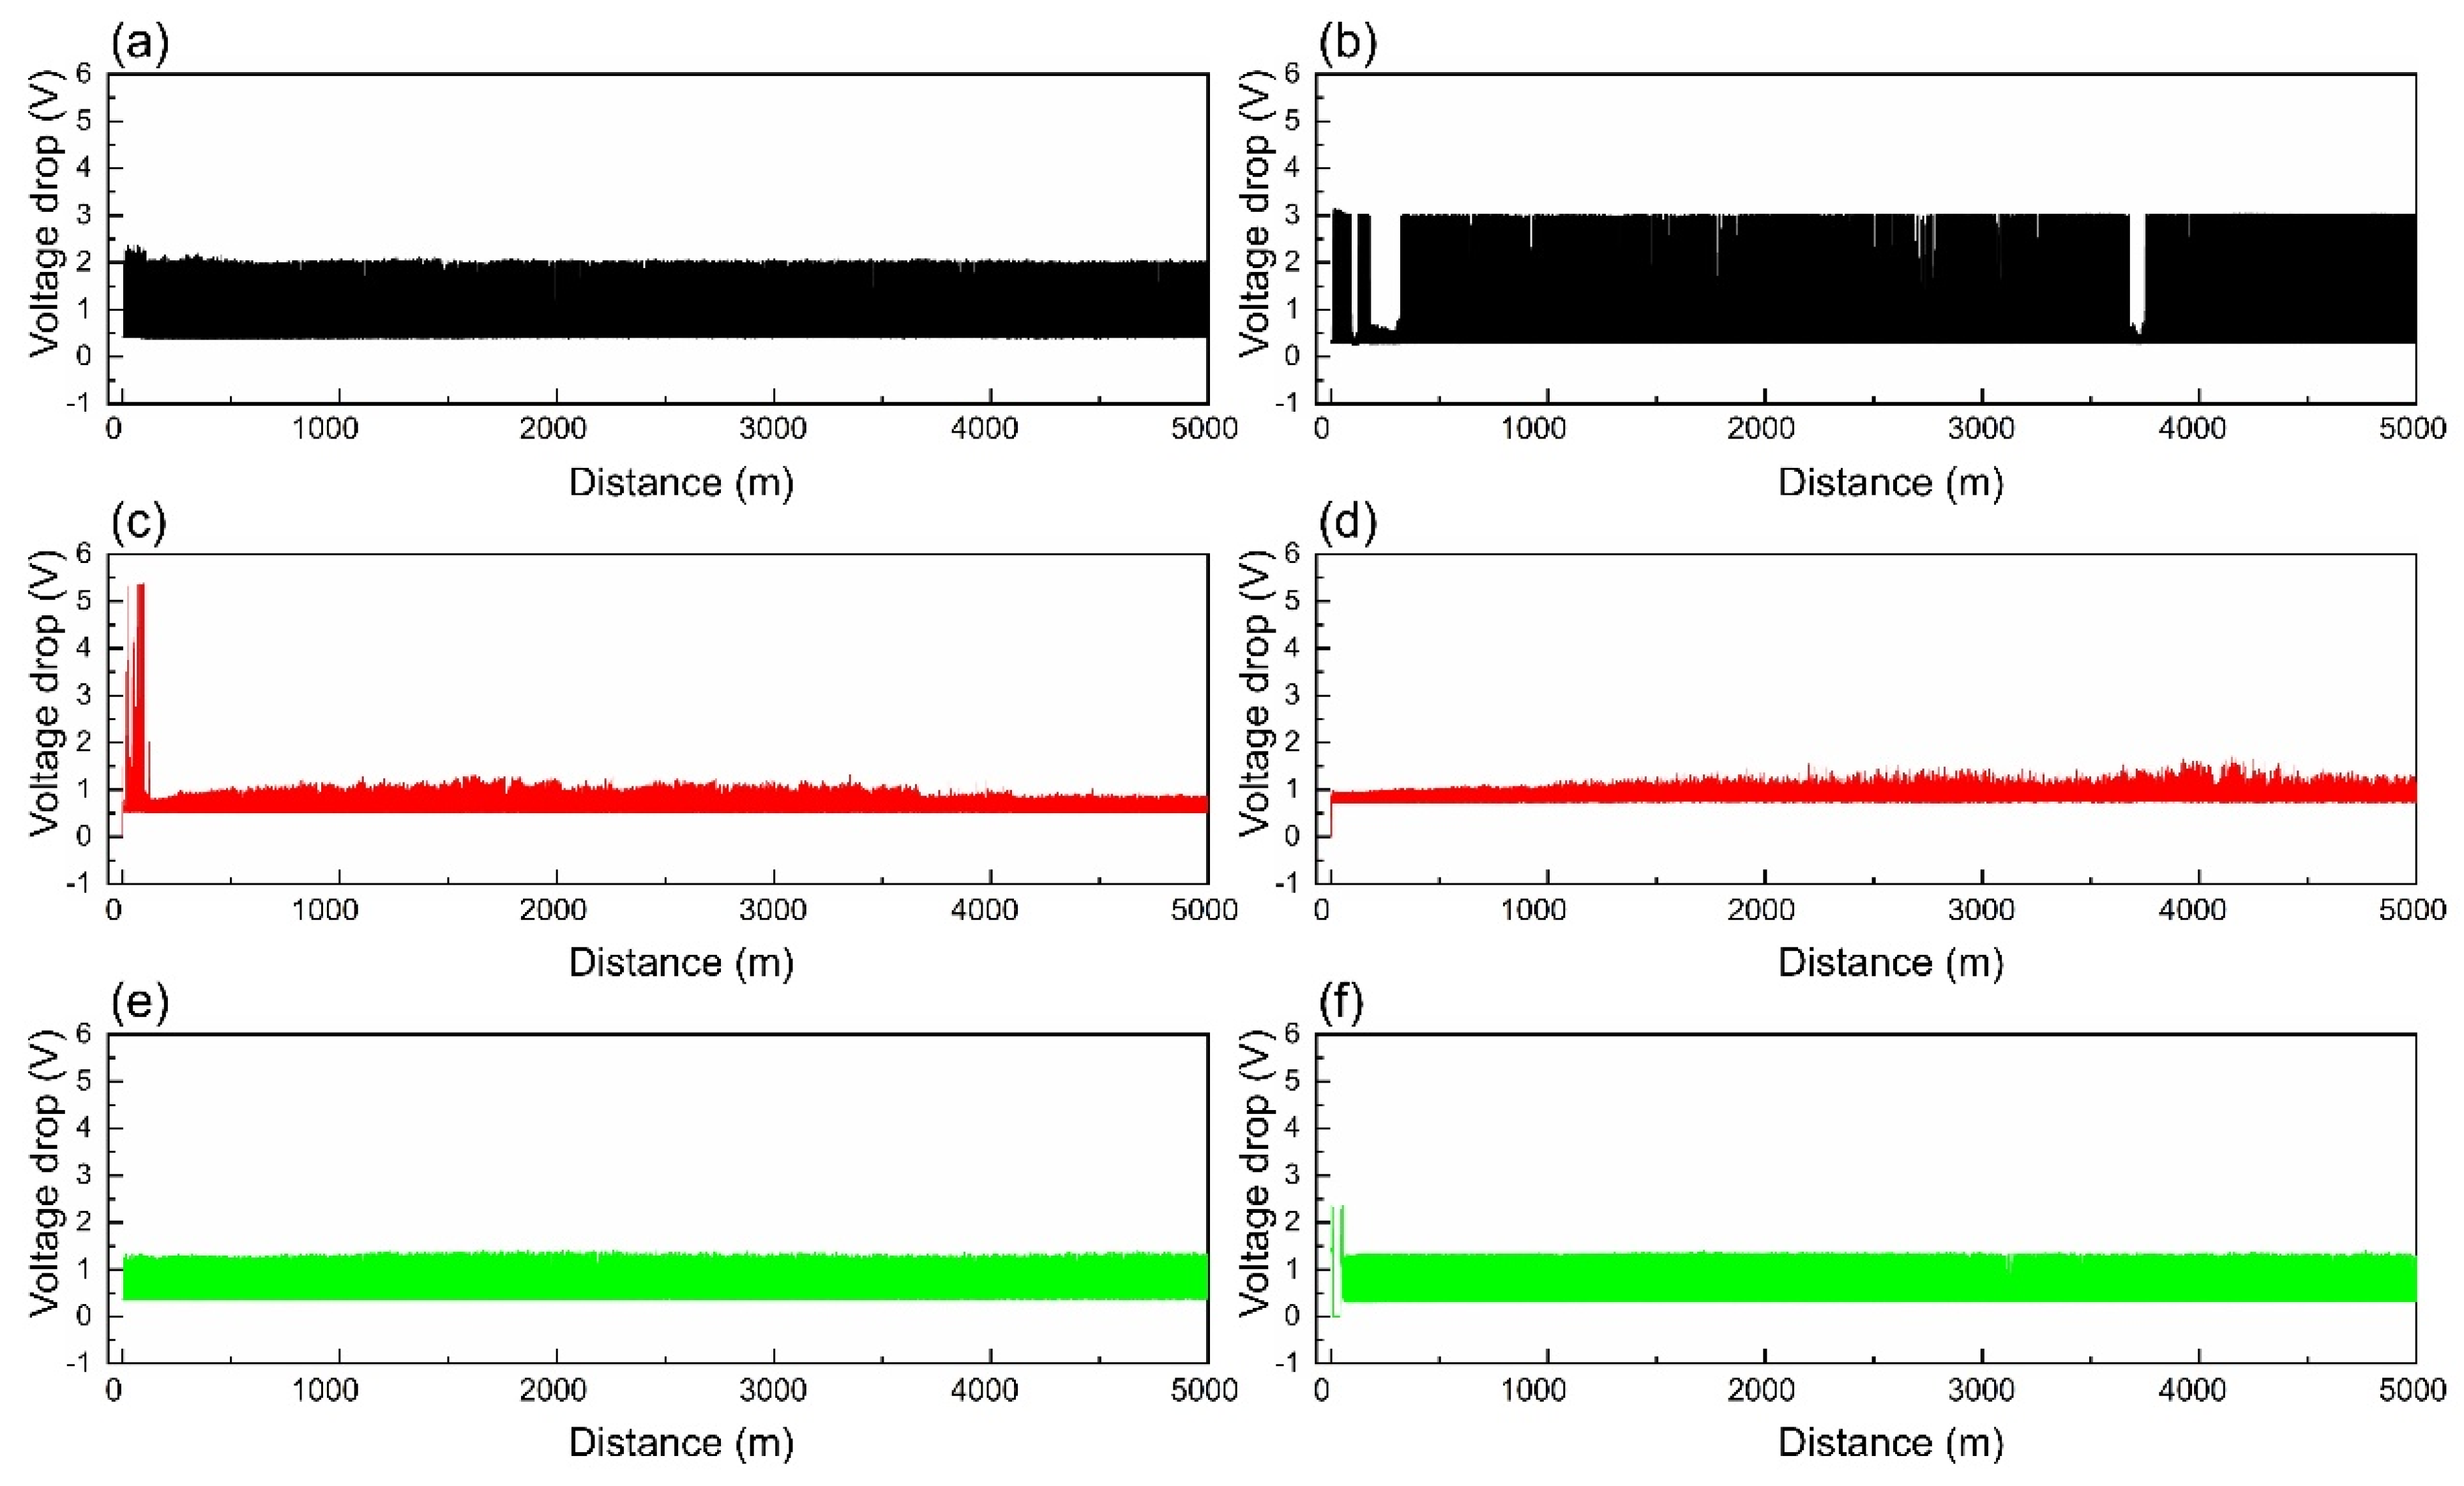
- Under a contact load of 0.31 N, both composite materials exhibited optimal electrical contact stability, with minimized voltage drop and electrical noise fluctuations. While the friction coefficient tended to decrease with increasing load, excessively high loads led to exacerbated wear.
- At a contact load of 0.31 N, the copper–graphite brushes exhibited the best current-carrying friction and wear performance, with the lowest wear rate, voltage drop, and electrical noise. Specifically, for brush B, the average friction coefficient, wear rate, average voltage drop, and average electrical noise were 0.406, 1.09 × 10⁻¹³ m3/(N·m), 0.943 V, and 0.234 mV, respectively.
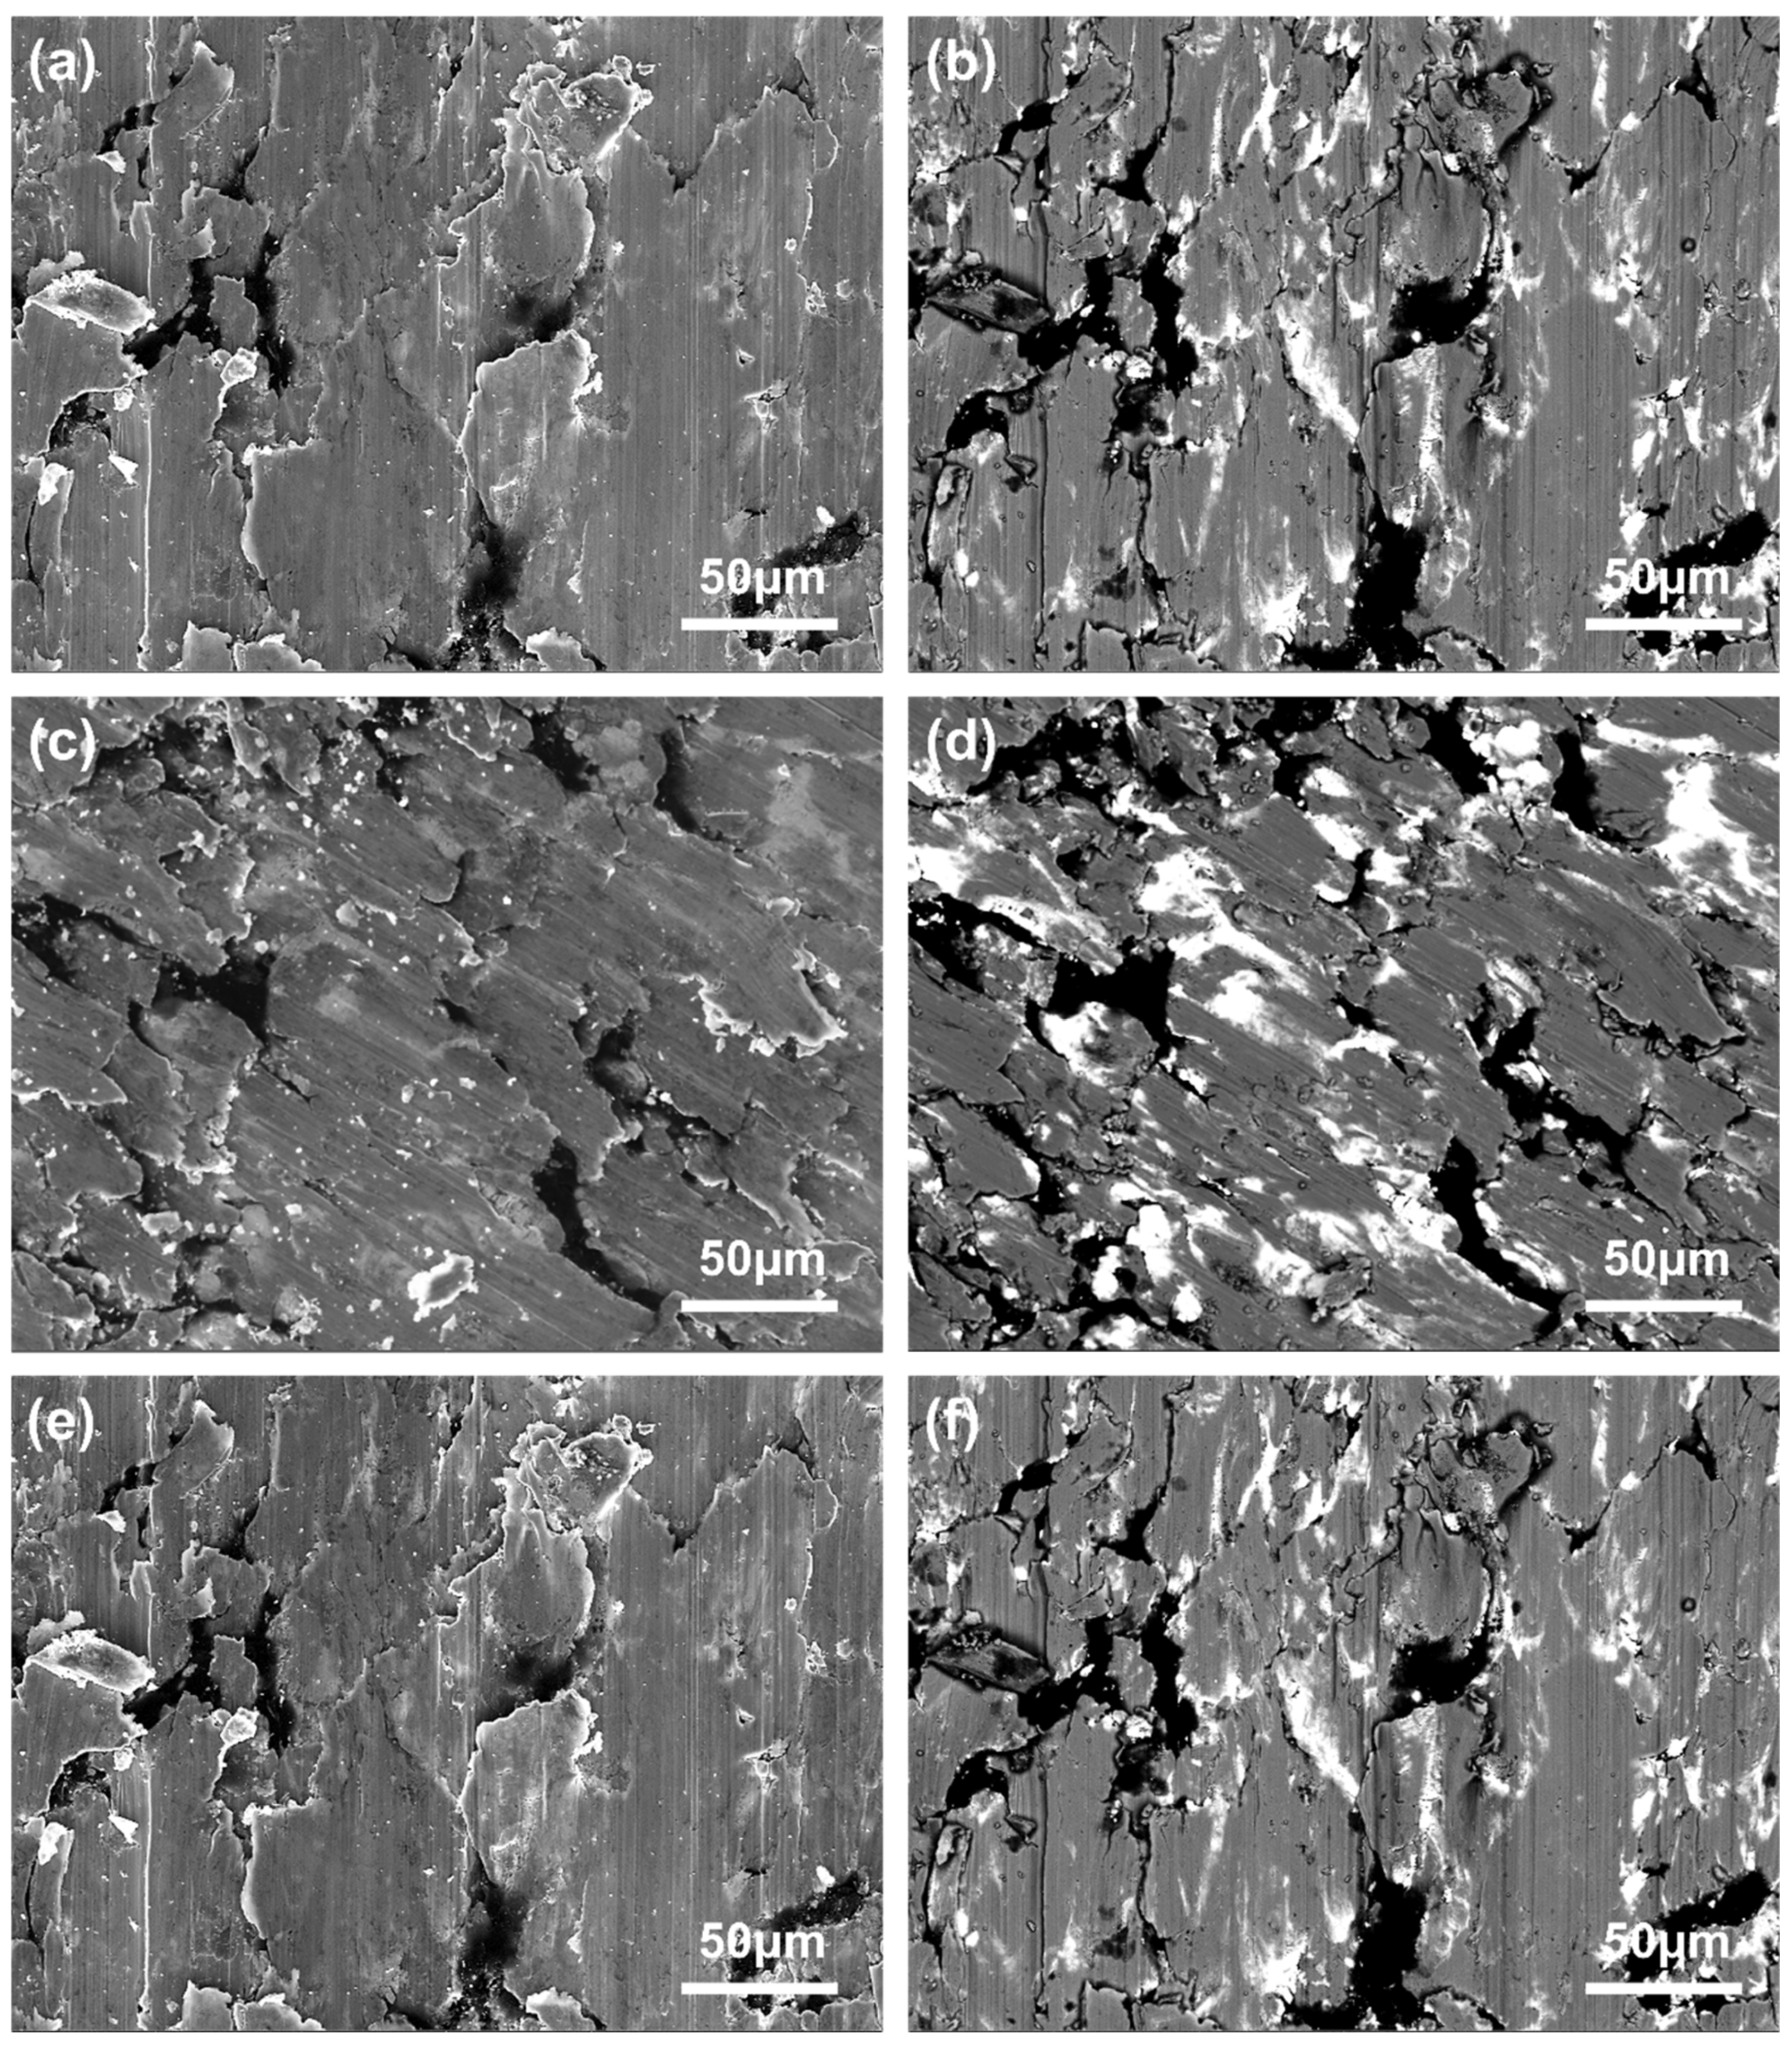
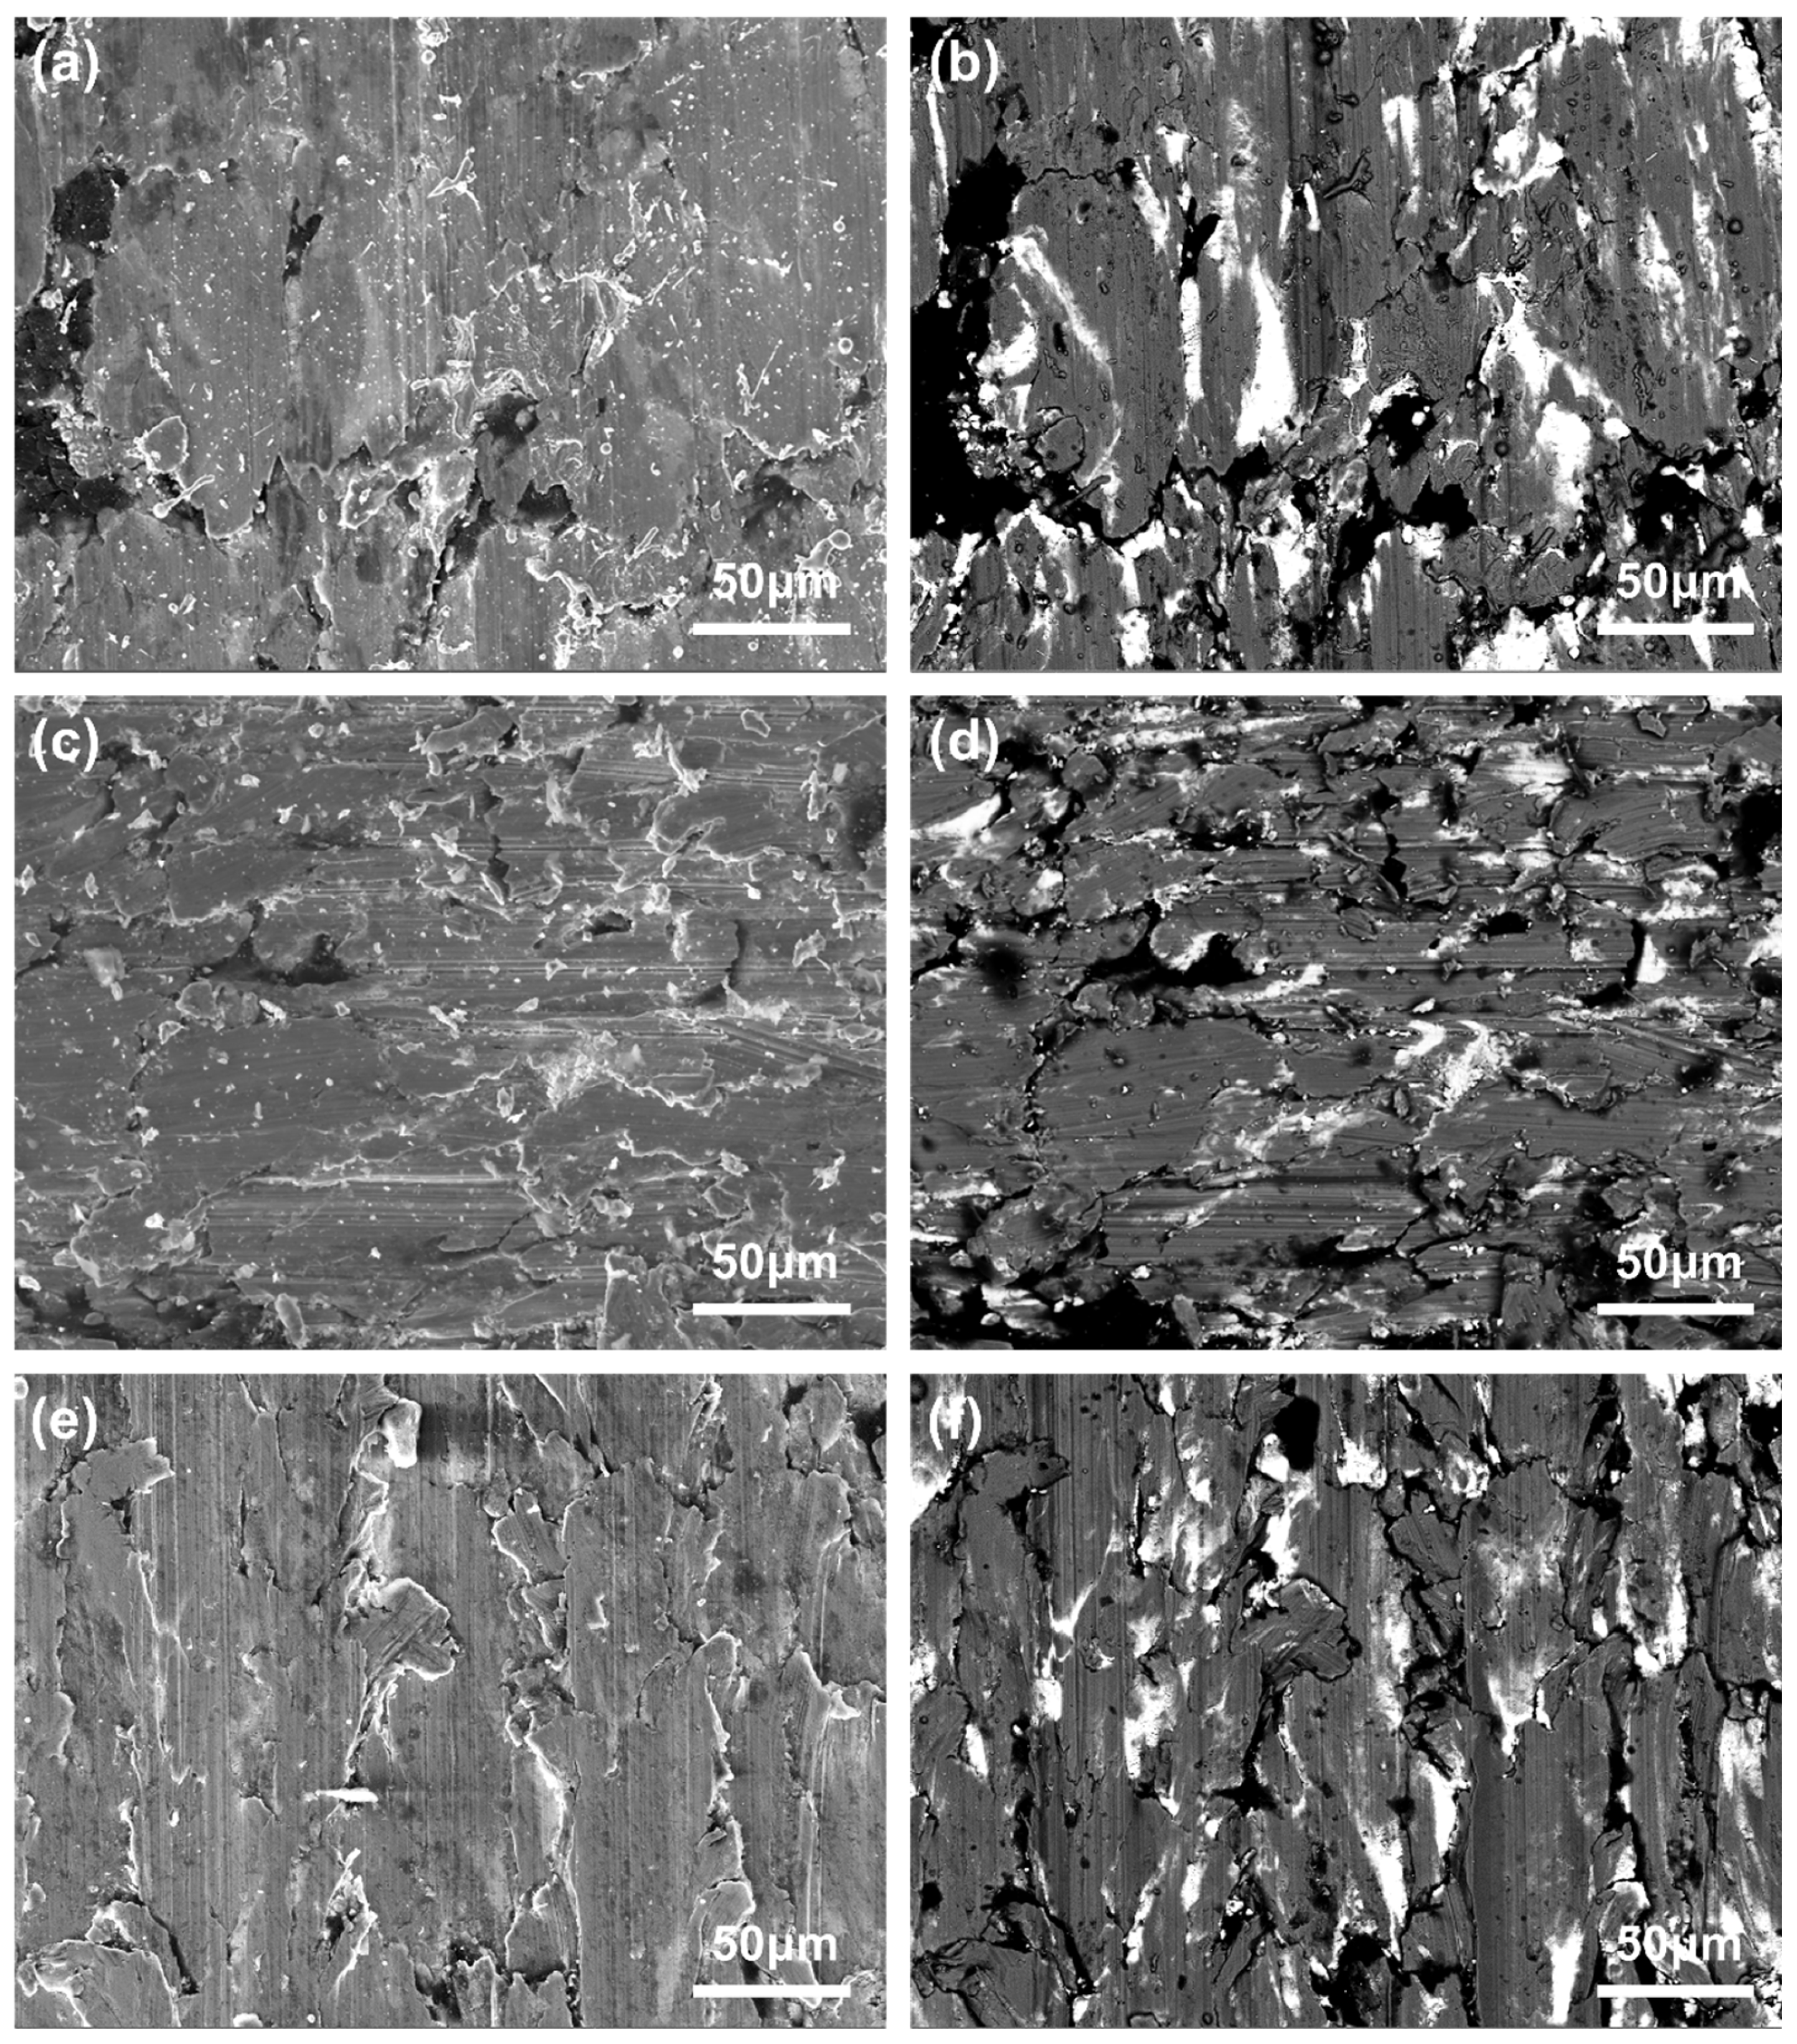
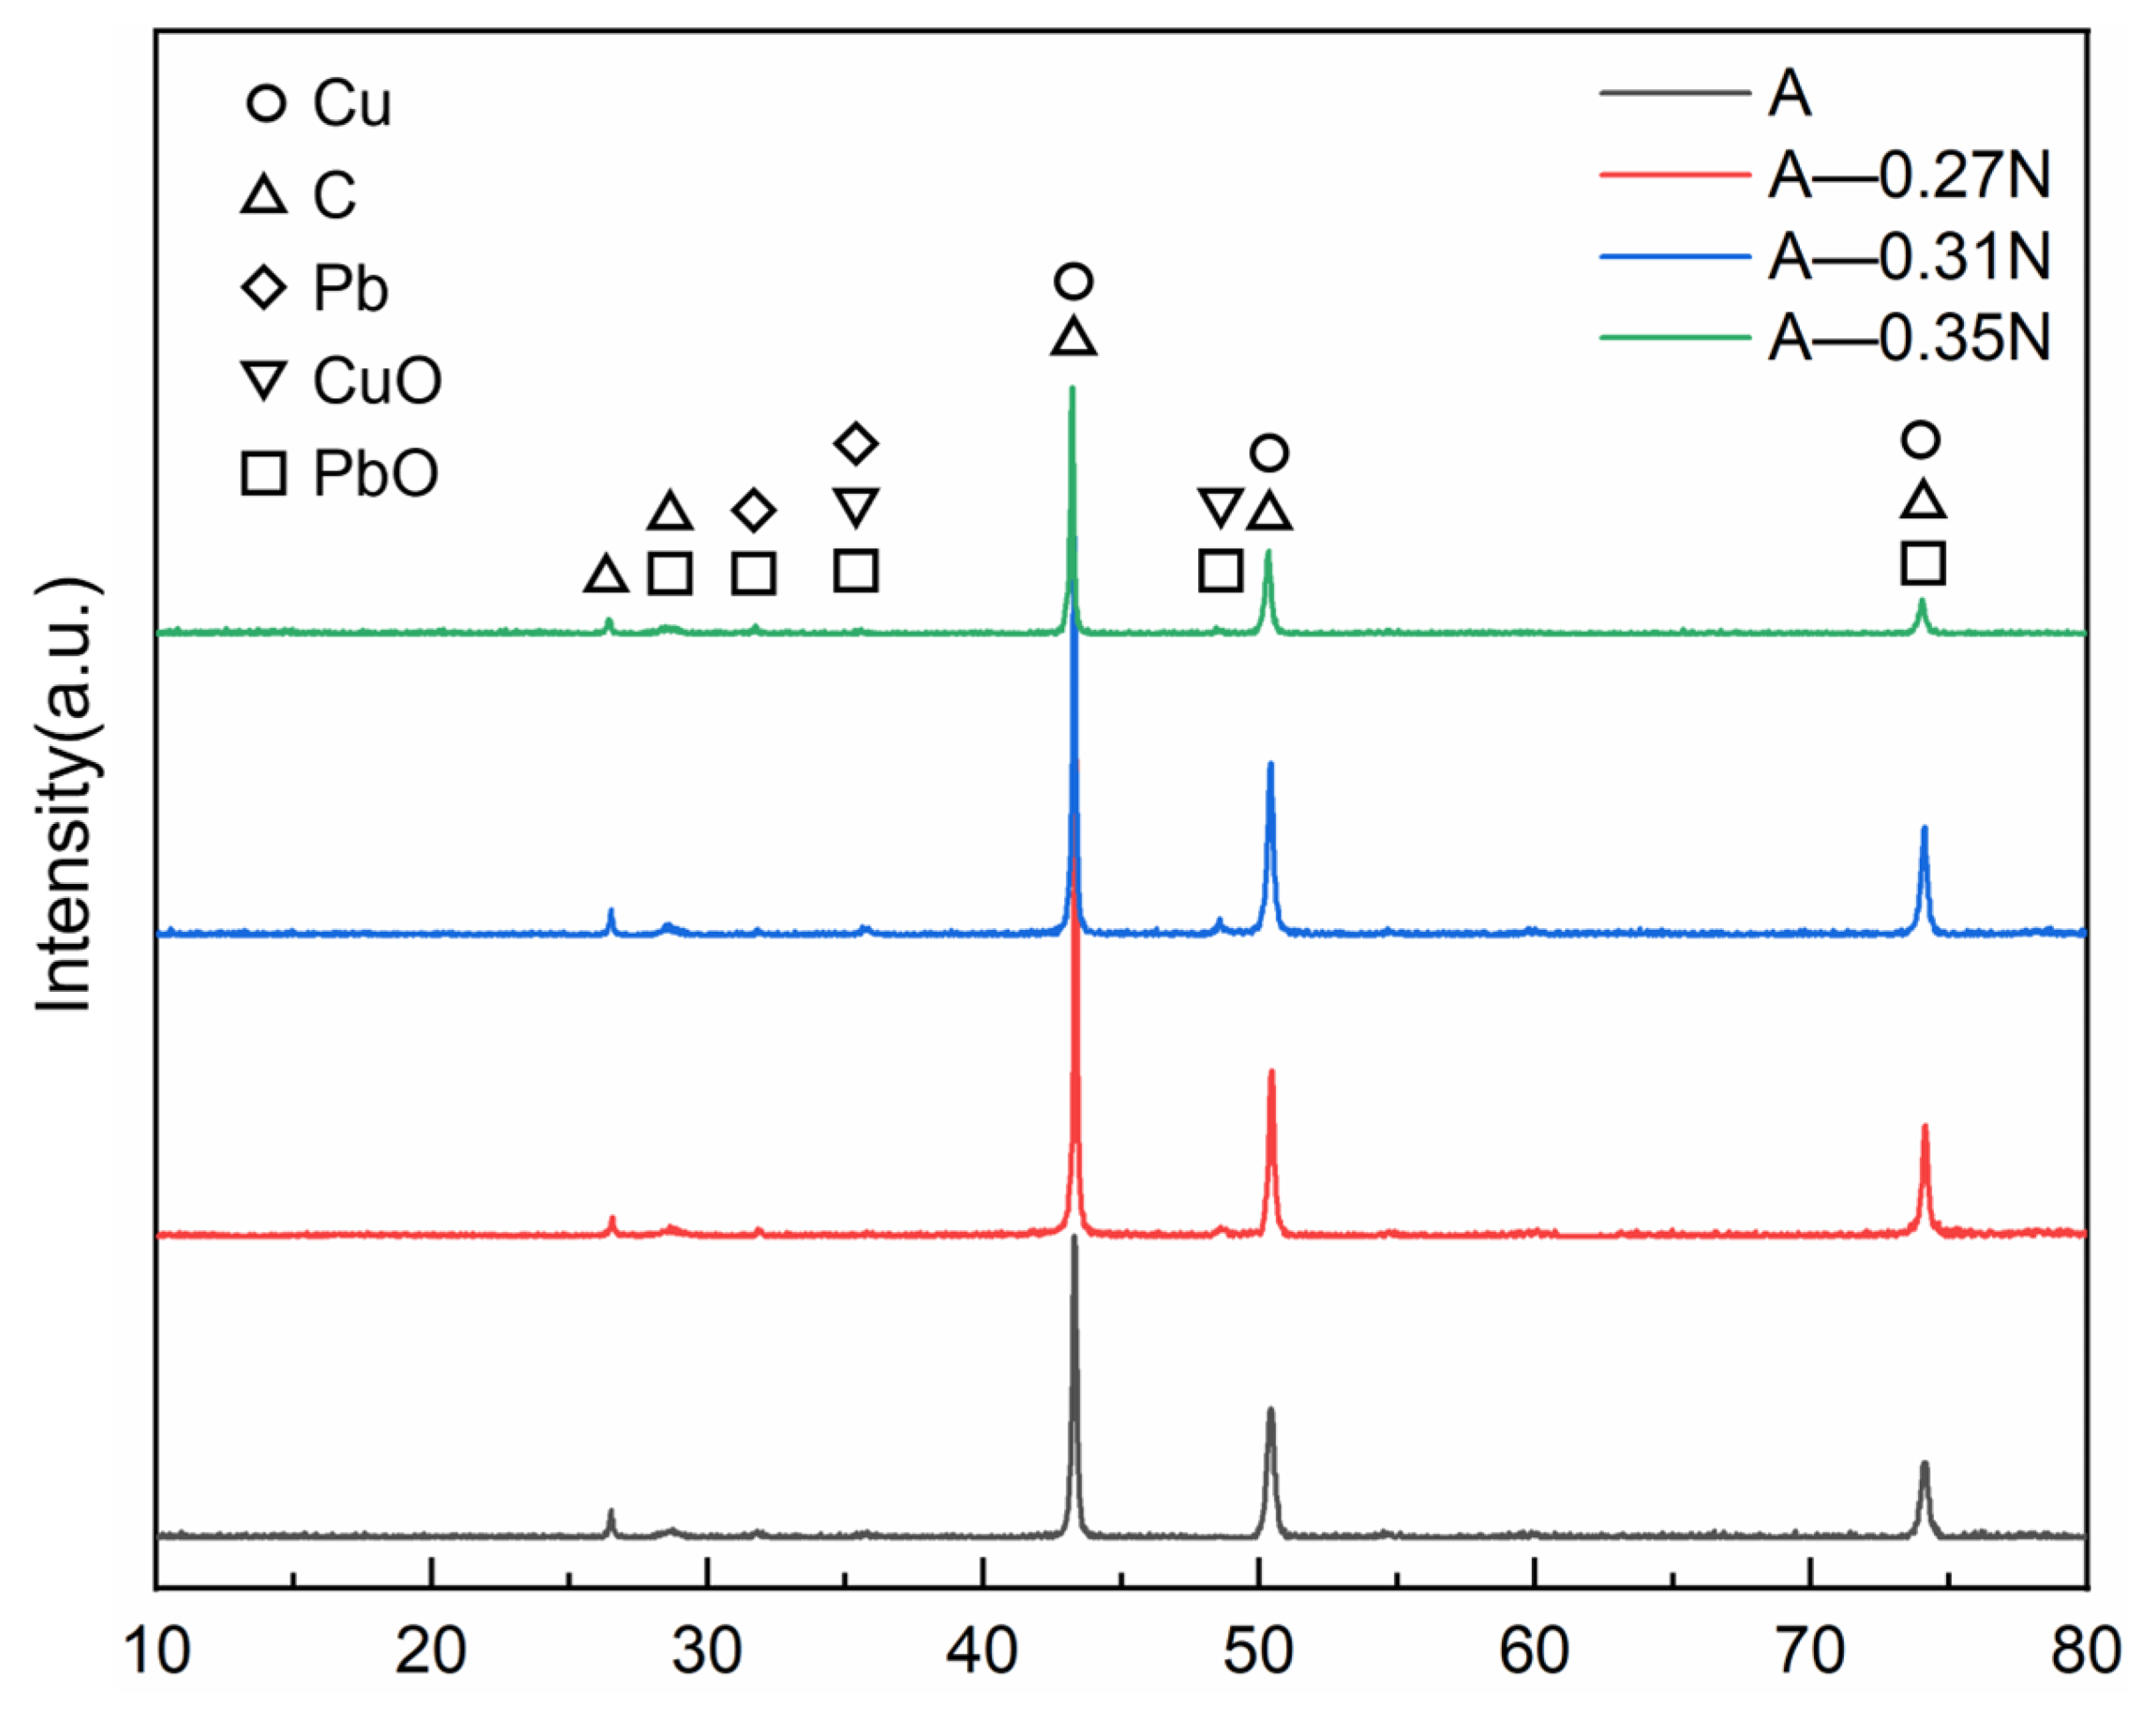
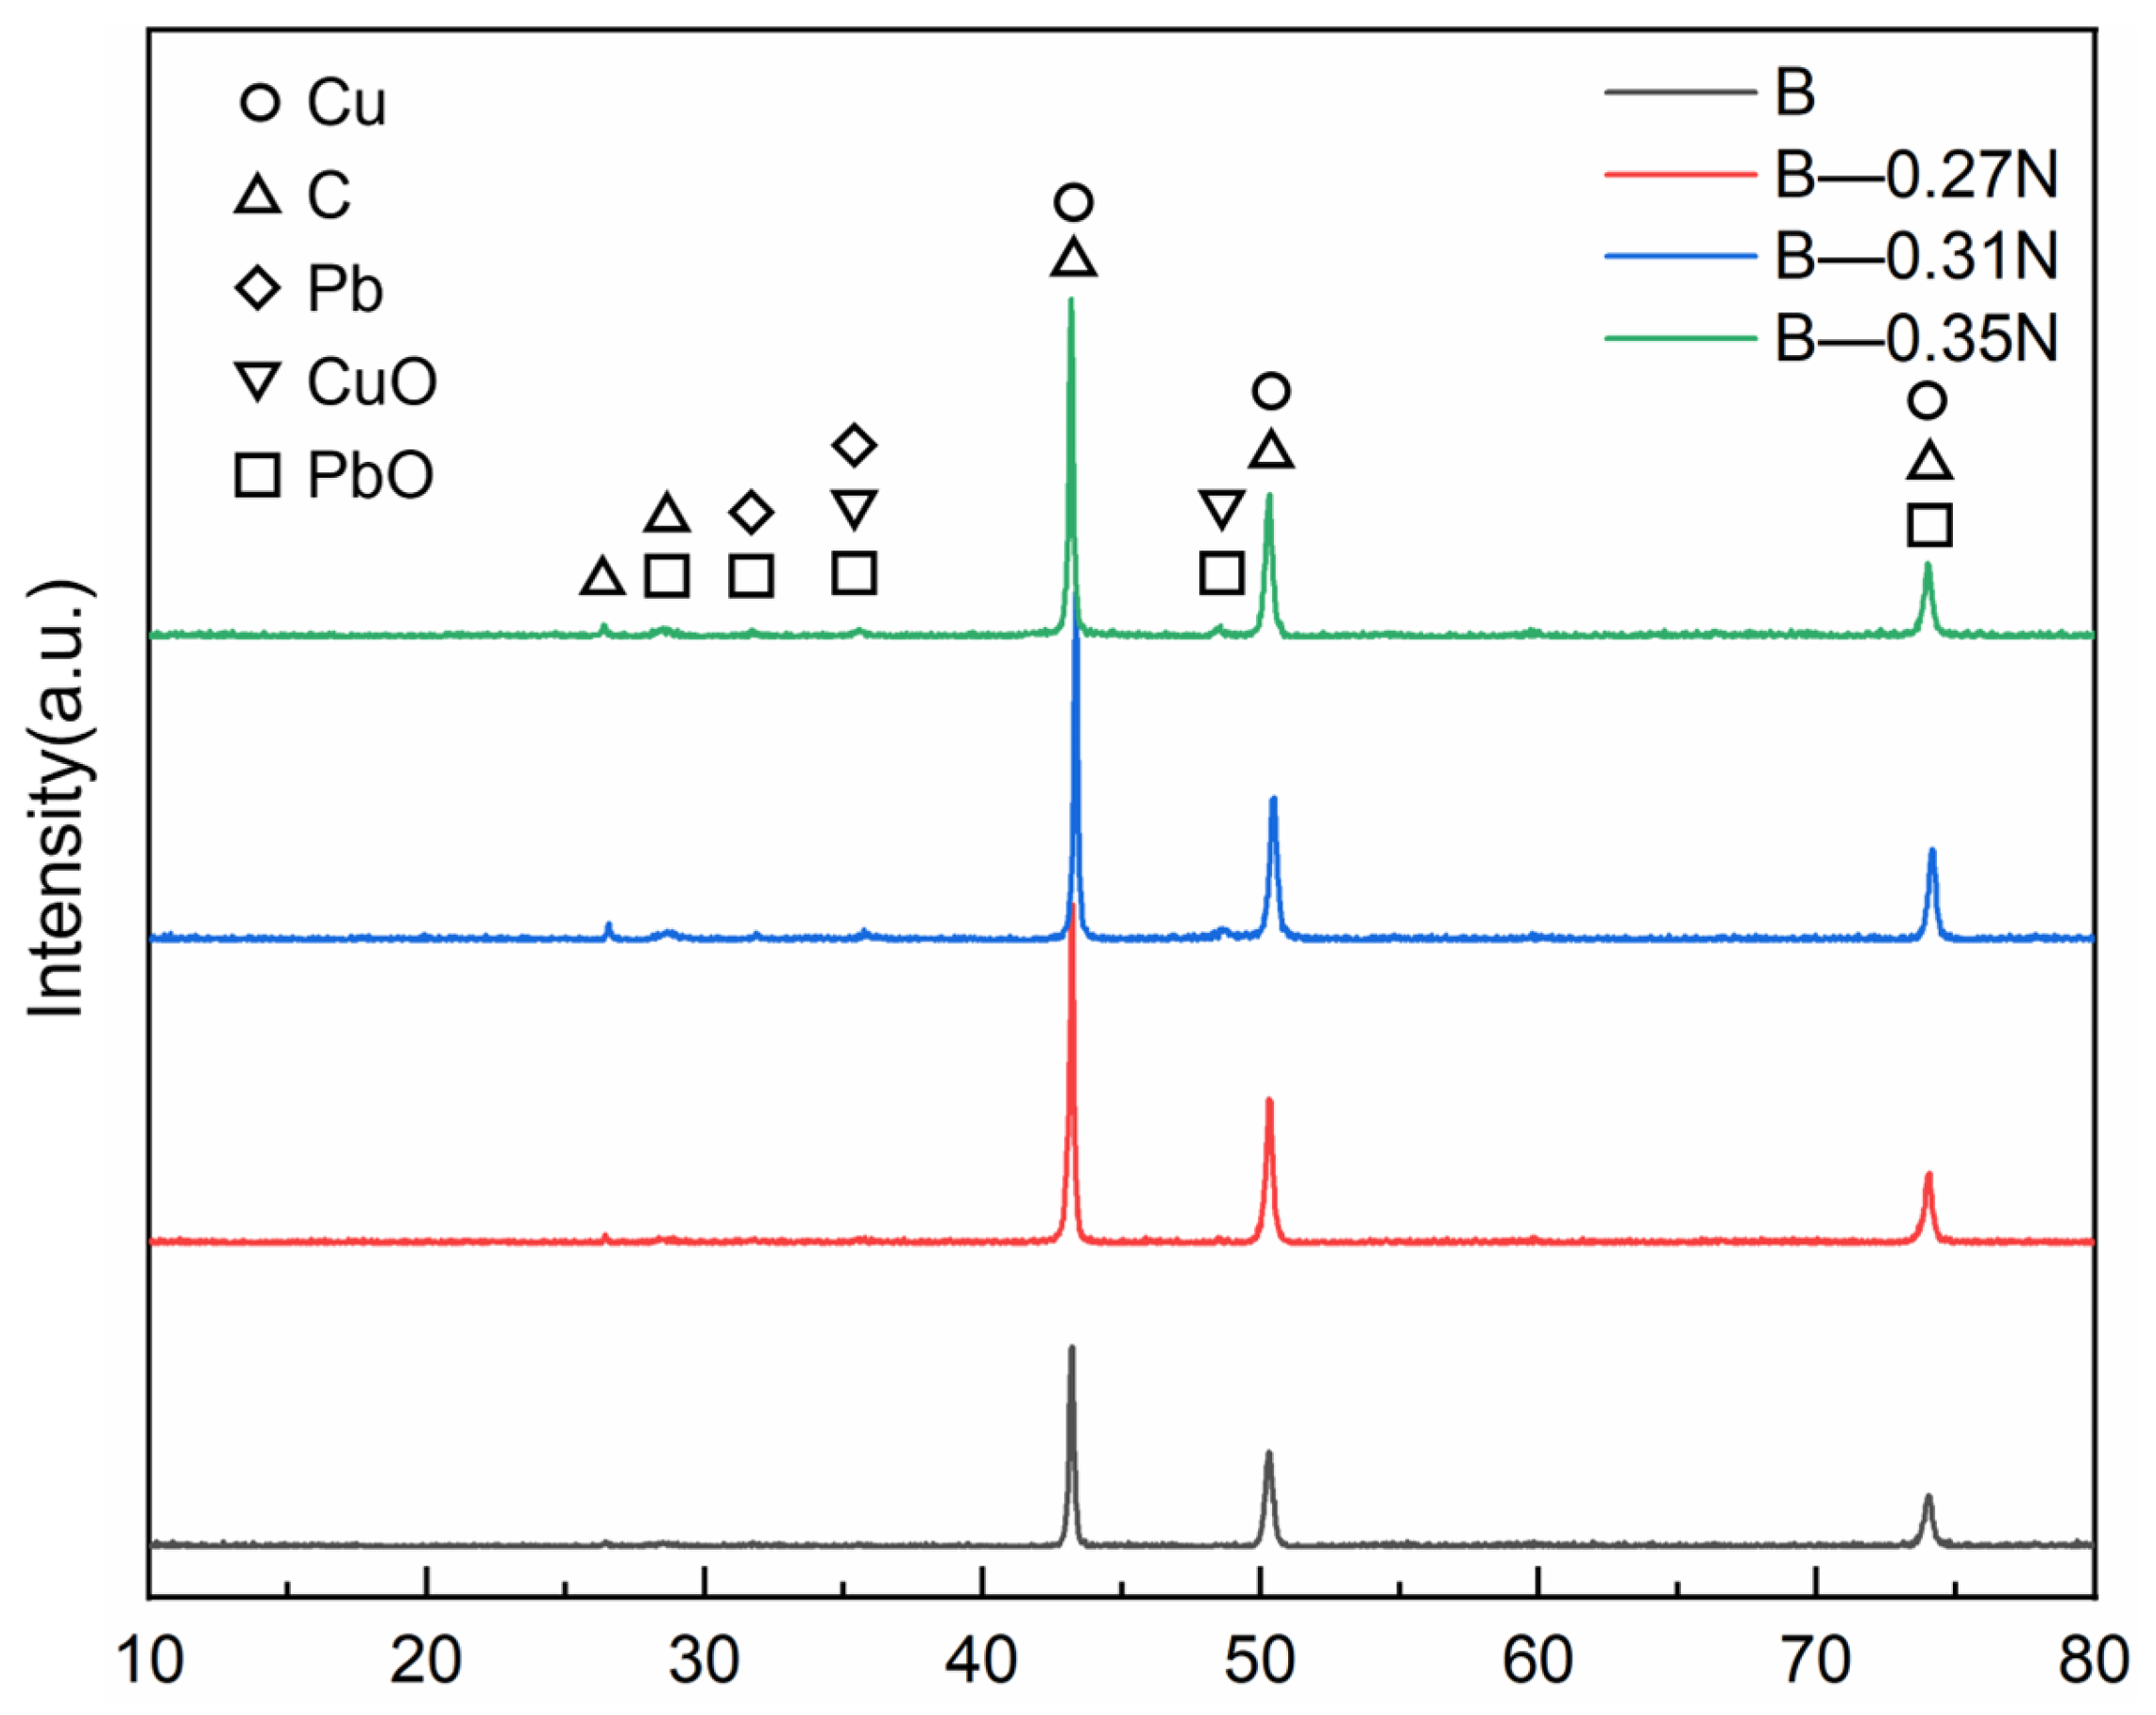
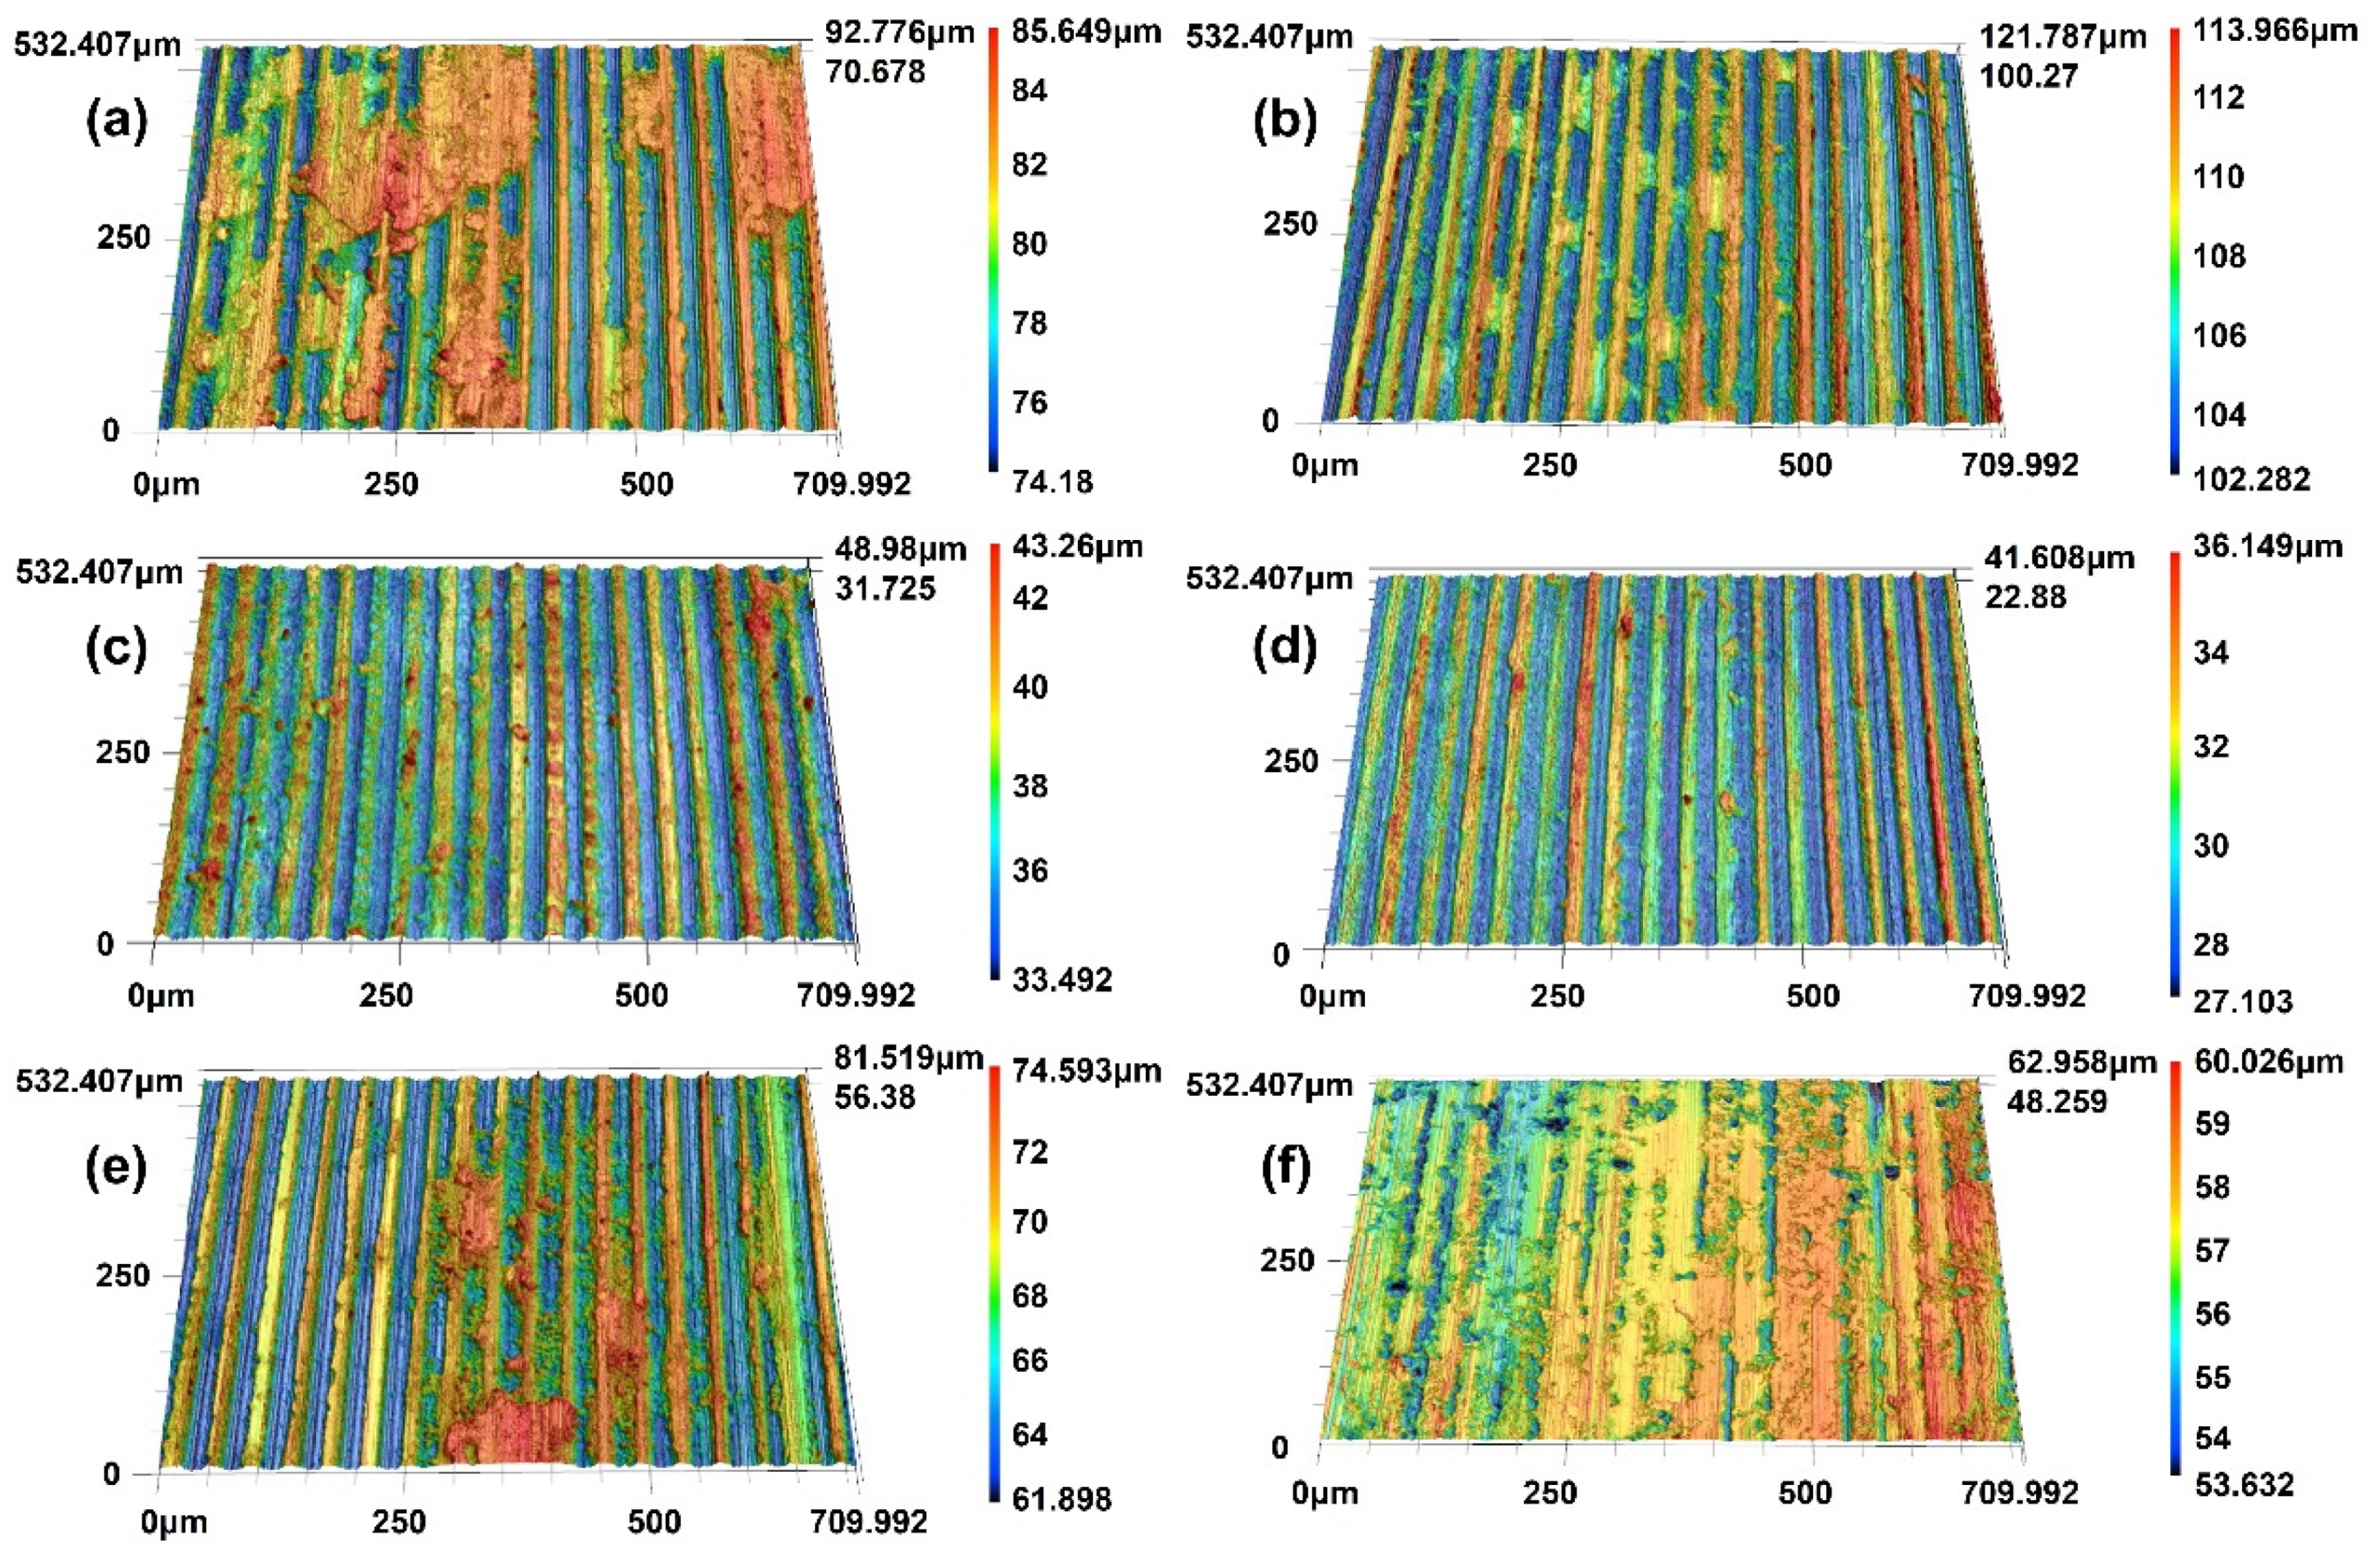
- The wear mechanisms of the two copper–graphite brushes under different loads were primarily delamination wear with a small amount of abrasive wear. As the contact load increased, the brush wear surfaces gradually became smoother and more even, and the lubricating film formed on the surface was mainly composed of C, PbO, and CuO.
Author Contributions
Funding
Institutional Review Board Statement
Informed Consent Statement
Data Availability Statement
Conflicts of Interest
References
- Li, J.; Li, J.; Wang, X.; Tian, G.; Fan, J. Machine Vision-Based Method for Measuring and Controlling the Angle of Conductive Slip Ring Brushes. Micromachines 2022, 13, 447. [Google Scholar] [CrossRef] [PubMed]
- Liu, X.; Zhang, G.; Zhang, Y.; Wang, J. Investigation of Accelerated Life Test on the Conductive Slip Ring of Ship’s Platform Inertial Navigation Equipment. In Proceedings of the 2022 International Conference on Cloud Computing, Big Data and Internet of Things (3CBIT2022), Wuhan, China, 22–23 October 2022; Volume 22, pp. 155–159. [Google Scholar]
- Yang, Y.; Mu, H.; Yao, Y.; Li, H.; Niu, G.; Liu, C.; Qian, Z. Particle traps constructed on the insulator of conductive slip rings for surface flashover mitigation under particle adhesion. AIP Adv. 2024, 14, 055216. [Google Scholar] [CrossRef]
- Chen, X.; Wang, Y.; Sheng, Y.; Yu, C.; Yang, X.; Xi, J. Vision-Aided Brush Alignment Assembly System for Precision Conductive Slip Rings. Machines 2022, 10, 393. [Google Scholar] [CrossRef]
- Sun, Y.; Wang, Y.; Sun, X.; Liu, X.; Yu, J. Research on Failure Modeling and Process Optimization of Transmission Conductive Slip Ring for Aerospace. Jixie Gongcheng Xuebao 2020, 56, 1–12. [Google Scholar]
- Bin, L. Simulation analysis of local temperature field of electric propulsion slip ring. Vibroengineering Procedia 2024, 54, 1–7. [Google Scholar] [CrossRef]
- Fukuda, N.; Sawa, K.; Aoyagi, M.; Ueno, T. Mechanism of the Sliding Contact of a Ag-Graphite Brush against a Au-plated Slip Ring for Varying Ag Content. IEEJ J. Ind. Appl. 2024, 13, 52–60. [Google Scholar] [CrossRef]
- Zhao, X.; Nie, Y.; Chen, M.; Qin, H.; Xu, X.; Qin, Z. Analysis of Contact Characteristics of Carbon Brush/Slip Ring under Eccentric Oscillation of Hydrogenerator Rotor. Shock. Vib. 2021, 2021, 2689960. [Google Scholar] [CrossRef]
- Niu, G.; Wu, H.; Qian, Z.; Liu, C.; Ma, Z. Research on the prediction model for the wear of bundle brush conductive slip ring in spacecraft. Aerosp. Syst. Eng. Shanghai (China) Cent. South Univ. (China) 2023, 12801, 12–16. [Google Scholar]
- Zhang, Y.; Meng, L.; Liu, M. Fatigue Analysis and Optimization of a Conductive Slip Ring with Finite Angle of Rotation. IOP Conf. Ser. Earth Environ. Sci. 2019, 252, 022107. [Google Scholar] [CrossRef]
- Liu, X.; Zhu, Y.; Liu, H.; Zhao, L.; Xie, Z. Study on transmission reliability of long life space electric slip ring. Opt. Precis. Eng. 2019, 27, 2028–2035. [Google Scholar]
- Wang, J.; Liu, R.; Xiao, R.; Ping, A.; Liu, J.; Zhang, M.; Li, Q. Optimized Design of Slip Ring Assembly for Aerospace to Reduce Deep Dielectric Charging. IEEE Trans. Nucl. Sci. 2022, 69, 915–924. [Google Scholar] [CrossRef]
- Wang, B.; Hong, K.; Feng, C.; Zhang, H. The Investigation of Internal Turret Single Point Mooring Slip Ring Structure Design. IOP Conf. Ser. Earth Environ. Sci. 2019, 252, 022060. [Google Scholar] [CrossRef]
- Huang, Z.; Li, Z.; Liu, M.; Wang, M.; Shao, D.; Xu, F.; Shi, X. Mechanical and Electrical Properties of Silver Paste Sintering on Copper-Alloy Slip Rings. J. Mater. Eng. Perform. 2024, 33, 1–10. [Google Scholar] [CrossRef]
- Zharkov, S.Y.; Sergeev, V.P.; Kalashnikov, M.P. Electrical Sliding Wear of Magnetron Cu-Mo-S Coatings. In Proceedings of the International Conference on Advanced Materials with Hierarchical Structure for New Technologies and Reliable Structures 2019, Tomsk, Russia, 1–5 October 2019; Volume 2167, p. 020400. [Google Scholar]
- Poljanec, D.; Kalin, M.; Kumar, L. Influence of contact parameters on the tribological behaviour of various graphite/graphite sliding electrical contacts. Wear 2018, 406–407, 75–83. [Google Scholar] [CrossRef]
- Liu, J.; Sun, K.; Zeng, L.; Wang, J.; Xiao, X.; Liu, J.; Guo, C.; Ding, Y. Microstructure and Properties of Copper–Graphite Composites Fabricated by Spark Plasma Sintering Based on Two-Step Mixing. Metals 2020, 10, 1506. [Google Scholar] [CrossRef]
- Yang, Z.; Ge, Y.; Zhang, X.; Shangguan, B.; Zhang, Y.; Wang, Y. Effect of Particle Size on Current-Carrying Friction and Wear Properties of Copper-Graphite Composites by Spark Plasma Sintering. Materials 2019, 12, 2825. [Google Scholar] [CrossRef]
- Jiang, X.; Song, J.; Su, Y.; Zhang, Y.; Hu, L. Novel Design of Copper–Graphite Self-Lubricating Composites for Reliability Improvement Based on 3D Network Structures of Copper Matrix. Tribol. Lett. 2018, 66, 143. [Google Scholar] [CrossRef]
- Nazeer, F.; Ma, Z.; Gao, L.; Malik, A.; Abubaker Khan, M.; Wang, F.; Li, H. Excellent mechanical properties of copper-graphite composites with the addition of tantalum alloying element. Vacuum 2019, 169, 108913. [Google Scholar] [CrossRef]
- Cheng, K.; Liu, R.; Xiong, X.; Lin, X.; Chen, J. The Effect of Sintering Temperature on the Microstructures and Properties of Resin-Bonded Copper–Graphite Brush Materials. Tribol. Lett. 2019, 67, 77. [Google Scholar] [CrossRef]
- Xiao, Z.; Chen, R.; Zhu, X.; Li, Z.; Xu, G.; Jia, Y.; Zhang, Y. Microstructure, and Physical and Mechanical Properties of Copper–Graphite Composites Obtained by In Situ Reaction Method. J. Mater. Eng. Perform. 2020, 29, 1696–1705. [Google Scholar] [CrossRef]
- Zhou, Y.; Wen, D.; Wang, Y.; Zuo, X.; Zhu, R.; Mia, M.F. Tribo-electrical properties of copper matrix composites in salt-fog environment. Tribol. Int. 2024, 192, 109299. [Google Scholar] [CrossRef]
- Zhang, J.; Sun, Y.; Sun, Z.; Lv, D.; Li, S.; Liu, J.; Zhang, J.; Yang, B. Effect of Bimodal Structure on the Frictional Properties of Copper–Graphite Composites. Trans. Indian Inst. Met. 2023, 77, 637–647. [Google Scholar] [CrossRef]
- Wei, H.; Li, M.; Zou, J.; Gong, Y. Study on sintering process of Ti2SnC modified copper-graphite composites. Vacuum 2023, 209, 111813. [Google Scholar] [CrossRef]
- Chen, W.; Yu, Y.; Ma, J.; Zhu, S.; Liu, W.; Yang, J. Low-Pressure Cold Spraying of Copper–Graphite Solid Lubricating Coatings on Aluminum Alloy 7075-T651. J. Therm. Spray Technol. 2019, 28, 1688–1698. [Google Scholar] [CrossRef]
- Liu, X.-l.; Cai, Z.-b.; Xiao, Q.; Shen, M.-x.; Yang, W.-b.; Chen, D.-y. Fretting wear behavior of brass/copper-graphite composites as a contactor material under electrical contact. Int. J. Mech. Sci. 2020, 184, 105703. [Google Scholar] [CrossRef]
- Grandin, M.; Wiklund, U. Wear phenomena and tribofilm formation of copper/copper-graphite sliding electrical contact materials. Wear 2018, 398–399, 227–235. [Google Scholar] [CrossRef]
- Lee, S.; Son, S.h.; Kim, J.; Yesuraj, J.; Kim, K.; Rhi, S.H. Heat conduction and thermal expansion of copper–graphite composite as a heat sink. Int. J. Energy Res. 2022, 46, 10907–10918. [Google Scholar] [CrossRef]
- Mazloum, A.; Kováčik, J.; Emmer, Š.; Sevostianov, I. Copper–graphite composites: Cross-property connections between electrical conductivity and thermal expansion coefficient for 0–90 vol% of graphite. Math. Mech. Solids 2022, 29, 2426–2440. [Google Scholar] [CrossRef]
- Zhu, R.; Zuo, X.; Zhou, Y.; Xie, W. Effect of Electric Current and Graphite Content on the Wear Behaviors of Copper/Graphite Composites. J. Tribol. 2023, 145, 051702. [Google Scholar] [CrossRef]
- Mazloum, A.; Kováčik, J.; Emmer, Š.; Sevostianov, I. Copper–graphite composites: Thermal expansion, thermal and electrical conductivities, and cross-property connections. J. Mater. Sci. 2016, 51, 7977–7990. [Google Scholar] [CrossRef]
- Cho, K.H.; Hong, U.S.; Lee, K.S.; Jang, H. Tribological Properties and Electrical Signal Transmission of Copper–Graphite Composites. Tribol. Lett. 2007, 27, 301–306. [Google Scholar] [CrossRef]
- Wu, H.; Liu, C.; Niu, G.; Zhang, L.; Liu, H.; Kang, X. Effect of the contact load and rotation speed on the formation of rolling current-carrying arc and the corresponding material damage. J. Mater. Res. Technol. 2024, 32, 1696–1703. [Google Scholar] [CrossRef]
- Wang, D.; Chen, X.; Li, F.; Chen, W.; Li, H.; Yao, C. Influence of normal load, electric current and sliding speed on tribological performance of electrical contact interface. Microelectron. Reliab. 2023, 142, 114929. [Google Scholar] [CrossRef]
- Liu, X.; Cai, Z.; Liu, S.; Wu, S.; Zhu, M. Influence of Wear Test Parameters on the Electrical Contact Performance of Brass Alloy/Copper Contactors Under Fretting Wear. J. Mater. Eng. Perform. 2019, 28, 817–827. [Google Scholar] [CrossRef]
- Zhang, F.; Yan, F.; Chen, T.; Li, X.; Wang, Z. Investigating the effect of load on tribological behaviour of Cu composite reinforced with Ti2SnC particles. Ind. Lubr. Tribol. 2020, 73, 207–214. [Google Scholar] [CrossRef]
- Zuo, X.; Du, M.; Zhou, Y. Influence of contact parameters on the coupling temperature of copper-brass electrical contacts. Eng. Fail. Anal. 2022, 136, 106205. [Google Scholar] [CrossRef]
- Lu, J.; Ma, C.; Zhang, L.; He, Z.; Guo, B.; Wei, J.; Zeng, D.; Li, W.; Liu, Y. Effect of normal load on damage mechanism of gradient copper-graphite composites under electric current. Wear 2025, 562, 205653. [Google Scholar] [CrossRef]
- Zhang, C.; Ren, W.; Liao, X. On the Relationship between Contact Resistance and Load Force for Electrode Materials with Rough Surfaces. Materials 2022, 15, 5667. [Google Scholar] [CrossRef]
- Ruusila, V.; Nyyssönen, T.; Kallio, M.; Vuorinen, P.; Lehtovaara, A.; Valtonen, K.; Kuokkala, V.T. The effect of microstructure and lead content on the tribological properties of bearing alloys. Proc. Inst. Mech. Eng. Part J J. Eng. Tribol. 2013, 227, 878–887. [Google Scholar] [CrossRef]
- Kestursatya, M.; Kim, J.K.; Rohatgi, P.K. Wear performance of copper–graphite composite and a leaded copper alloy. Mater. Sci. Eng. A 2003, 339, 150–158. [Google Scholar] [CrossRef]
- Tu, Y.; Zhang, L.; Zhang, X.; Kang, X. Improving the mechanical and tribological behavior of Cu-WS2 self-lubricating composite with the addition of WS2 nanosheet. Wear 2023, 530, 205013. [Google Scholar] [CrossRef]
- Zhou, Y.; Zhu, R.; Zuo, X.; Xie, W. Tribo-electrical behaviors of CNTs-MoS2/Cu composites under sliding electrical contact with brass. Tribol. Int. 2023, 180, 108207. [Google Scholar] [CrossRef]
- Yu, X.; Guo, Z.; Hao, J.; Zhao, X.; Peng, K.; Yang, J.; Pei, G. Preparation and properties of copper-based powder metallurgy brake pad for wind turbine. Mater. Sci. Eng. Powder Metall. 2014, 19, 66–70. [Google Scholar]
- Zheng, J.; He, M.; Liu, P.; Zhang, K. Effect of graphene nanoplatelets on the properties of copper-based friction materials prepared by spark plasma sintering. Nonferrous Met. Mater. Eng. 2021, 42, 5–12. [Google Scholar]
- Ma, W.; Lu, J. Effect of surface texture on transfer layer formation and tribological behaviour of copper–graphite composite. Wear 2011, 270, 218–229. [Google Scholar] [CrossRef]
- Wu, H.; Wang, N.; Zhang, L.; Ye, J.; Wang, C.; Tu, Y.; Kang, X. Effects of counterpart materials on the current carrying friction and wear properties of copper graphite composites. Mater. Sci. Eng. Powder Metall. 2024, 29, 384–395. [Google Scholar]
- Hernández Battez, A.; González, R.; Viesca, J.L.; Fernández, J.E.; Díaz Fernández, J.M.; Machado, A.; Chou, R.; Riba, J. CuO, ZrO2 and ZnO nanoparticles as antiwear additive in oil lubricants. Wear 2008, 265, 422–428. [Google Scholar] [CrossRef]


| Number | C | Pb | Cu |
|---|---|---|---|
| A | 45 | 3 | 52 |
| B | 30 | 3 | 67 |
| Number | Measured Density (g/cm3) | Theoretical Density (g/cm3) | Relative Density (%) |
|---|---|---|---|
| A | 5.6 | 3.85 | 68.75 |
| B | 5.8 | 4.76 | 82.07 |
Disclaimer/Publisher’s Note: The statements, opinions and data contained in all publications are solely those of the individual author(s) and contributor(s) and not of MDPI and/or the editor(s). MDPI and/or the editor(s) disclaim responsibility for any injury to people or property resulting from any ideas, methods, instructions or products referred to in the content. |
© 2025 by the authors. Licensee MDPI, Basel, Switzerland. This article is an open access article distributed under the terms and conditions of the Creative Commons Attribution (CC BY) license (https://creativecommons.org/licenses/by/4.0/).
Share and Cite
Ye, J.; Wang, N.; Wu, H.; Wang, C.; Kang, X. Contact Load on the Current-Carrying Tribological Performance of Copper–Graphite Composites. Materials 2025, 18, 2391. https://doi.org/10.3390/ma18102391
Ye J, Wang N, Wu H, Wang C, Kang X. Contact Load on the Current-Carrying Tribological Performance of Copper–Graphite Composites. Materials. 2025; 18(10):2391. https://doi.org/10.3390/ma18102391
Chicago/Turabian StyleYe, Jiayu, Nenghui Wang, Haihong Wu, Chuanfeng Wang, and Xiao Kang. 2025. "Contact Load on the Current-Carrying Tribological Performance of Copper–Graphite Composites" Materials 18, no. 10: 2391. https://doi.org/10.3390/ma18102391
APA StyleYe, J., Wang, N., Wu, H., Wang, C., & Kang, X. (2025). Contact Load on the Current-Carrying Tribological Performance of Copper–Graphite Composites. Materials, 18(10), 2391. https://doi.org/10.3390/ma18102391