
Impact of Microstructural Anisotropy on the Low-Cycle Fatigue of S420M Steel


Abstract

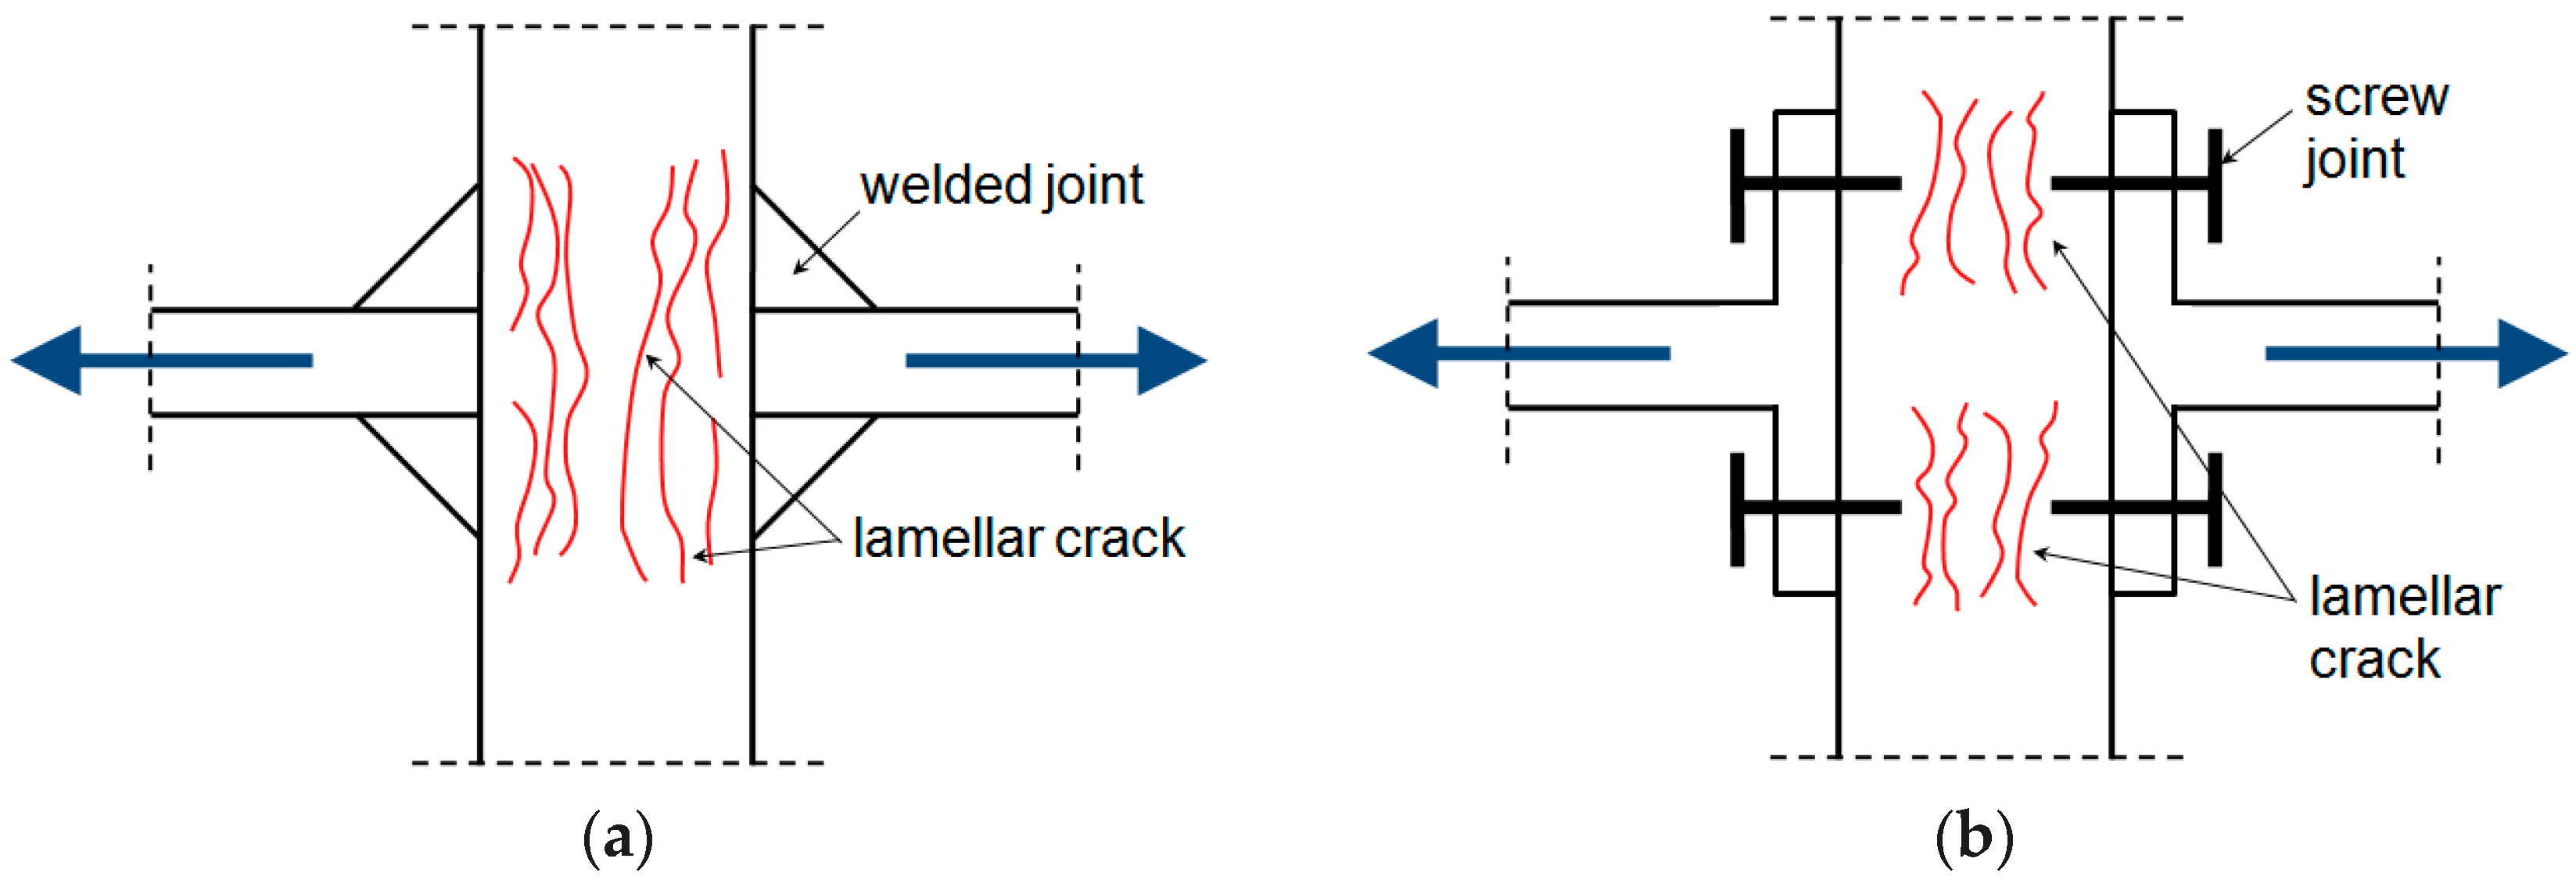
1. Introduction
2. Test Description
2.1. Methodology of Static Tensile Tests
2.2. Low-Cycle Fatigue Tests
2.3. Structure Analysis
2.4. Fatigue Life Calculation
3. Test Results and Analysis
3.1. Results of Static Tests
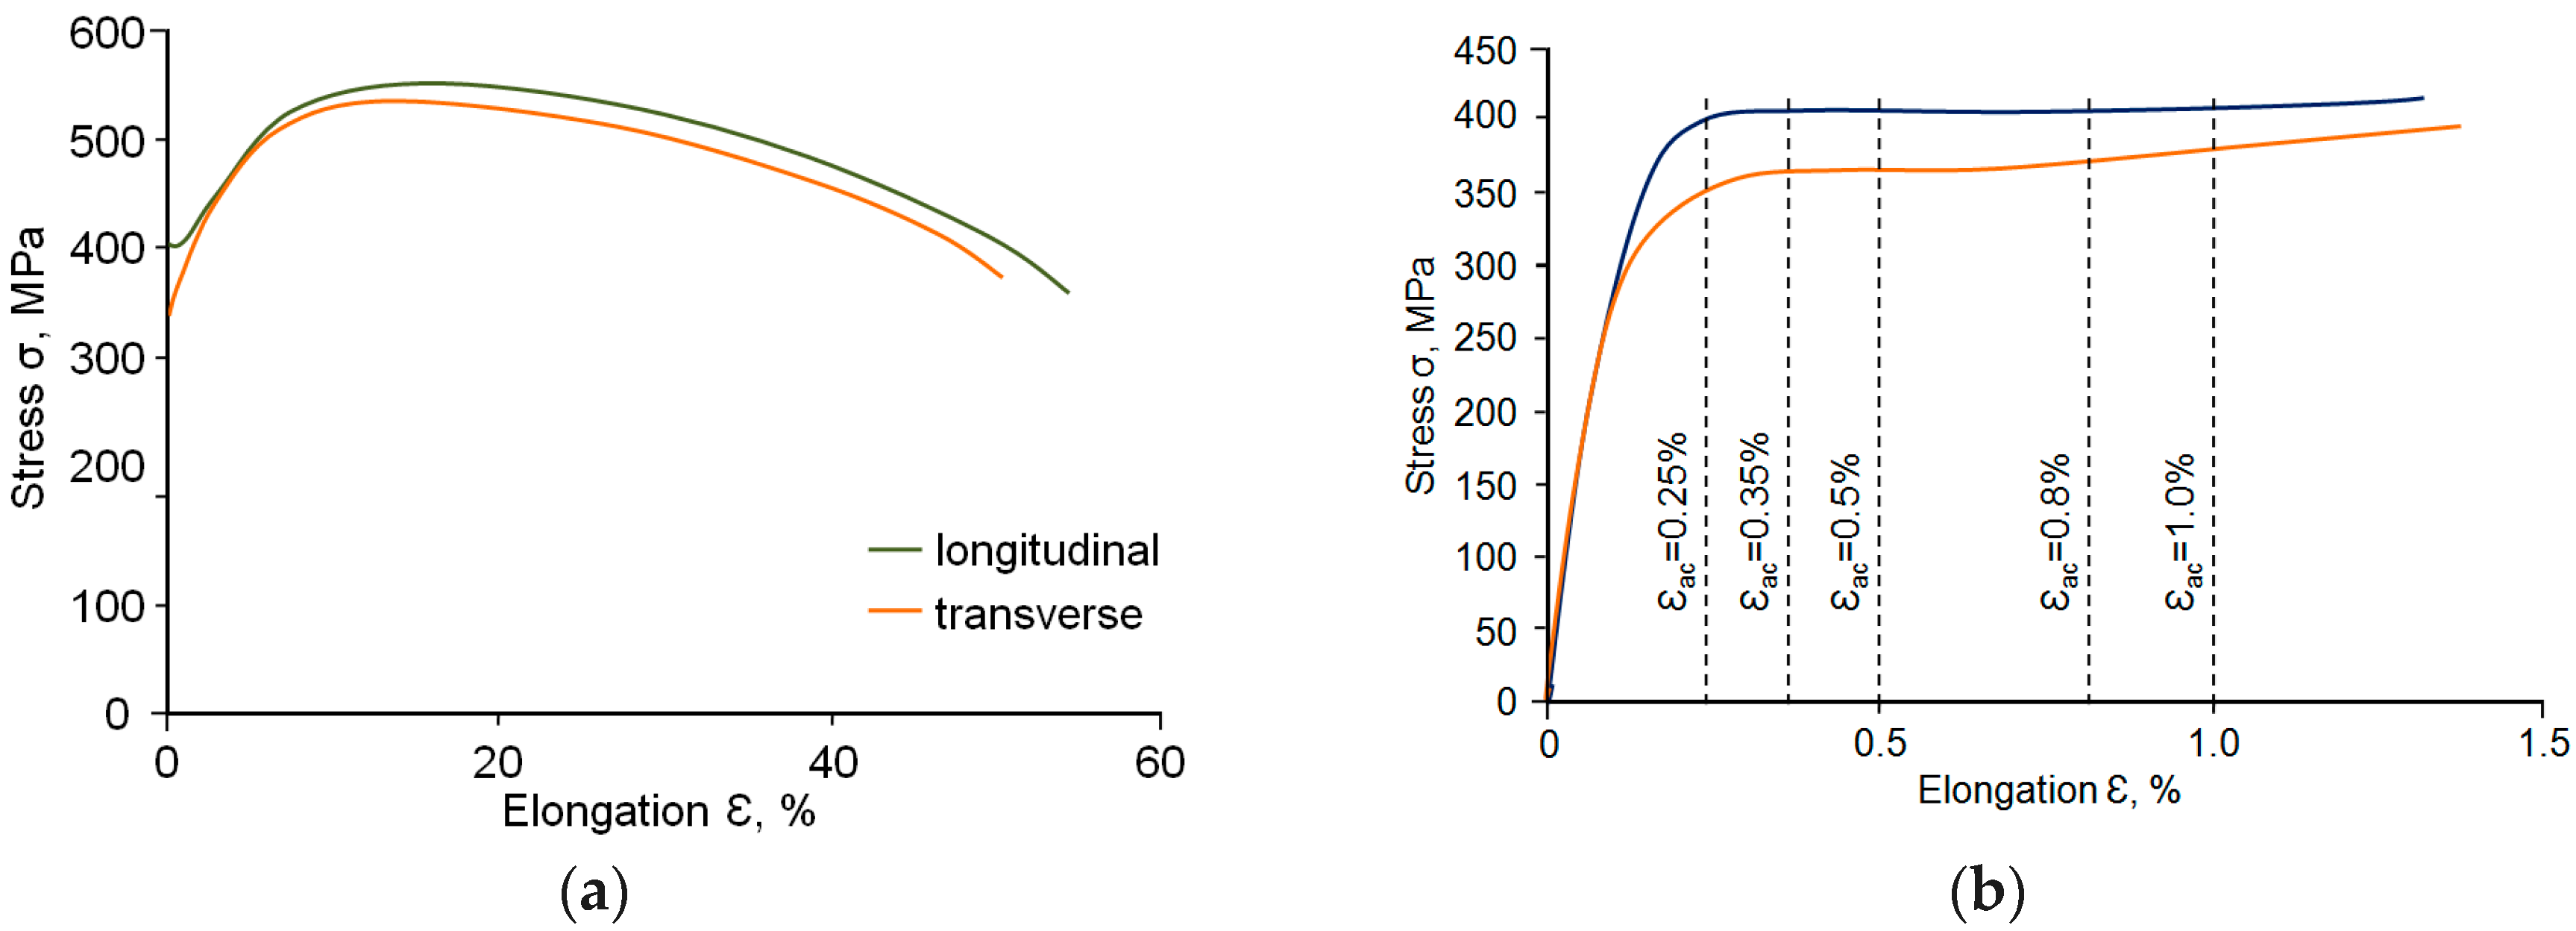
3.1.1. Static Tensile Tests
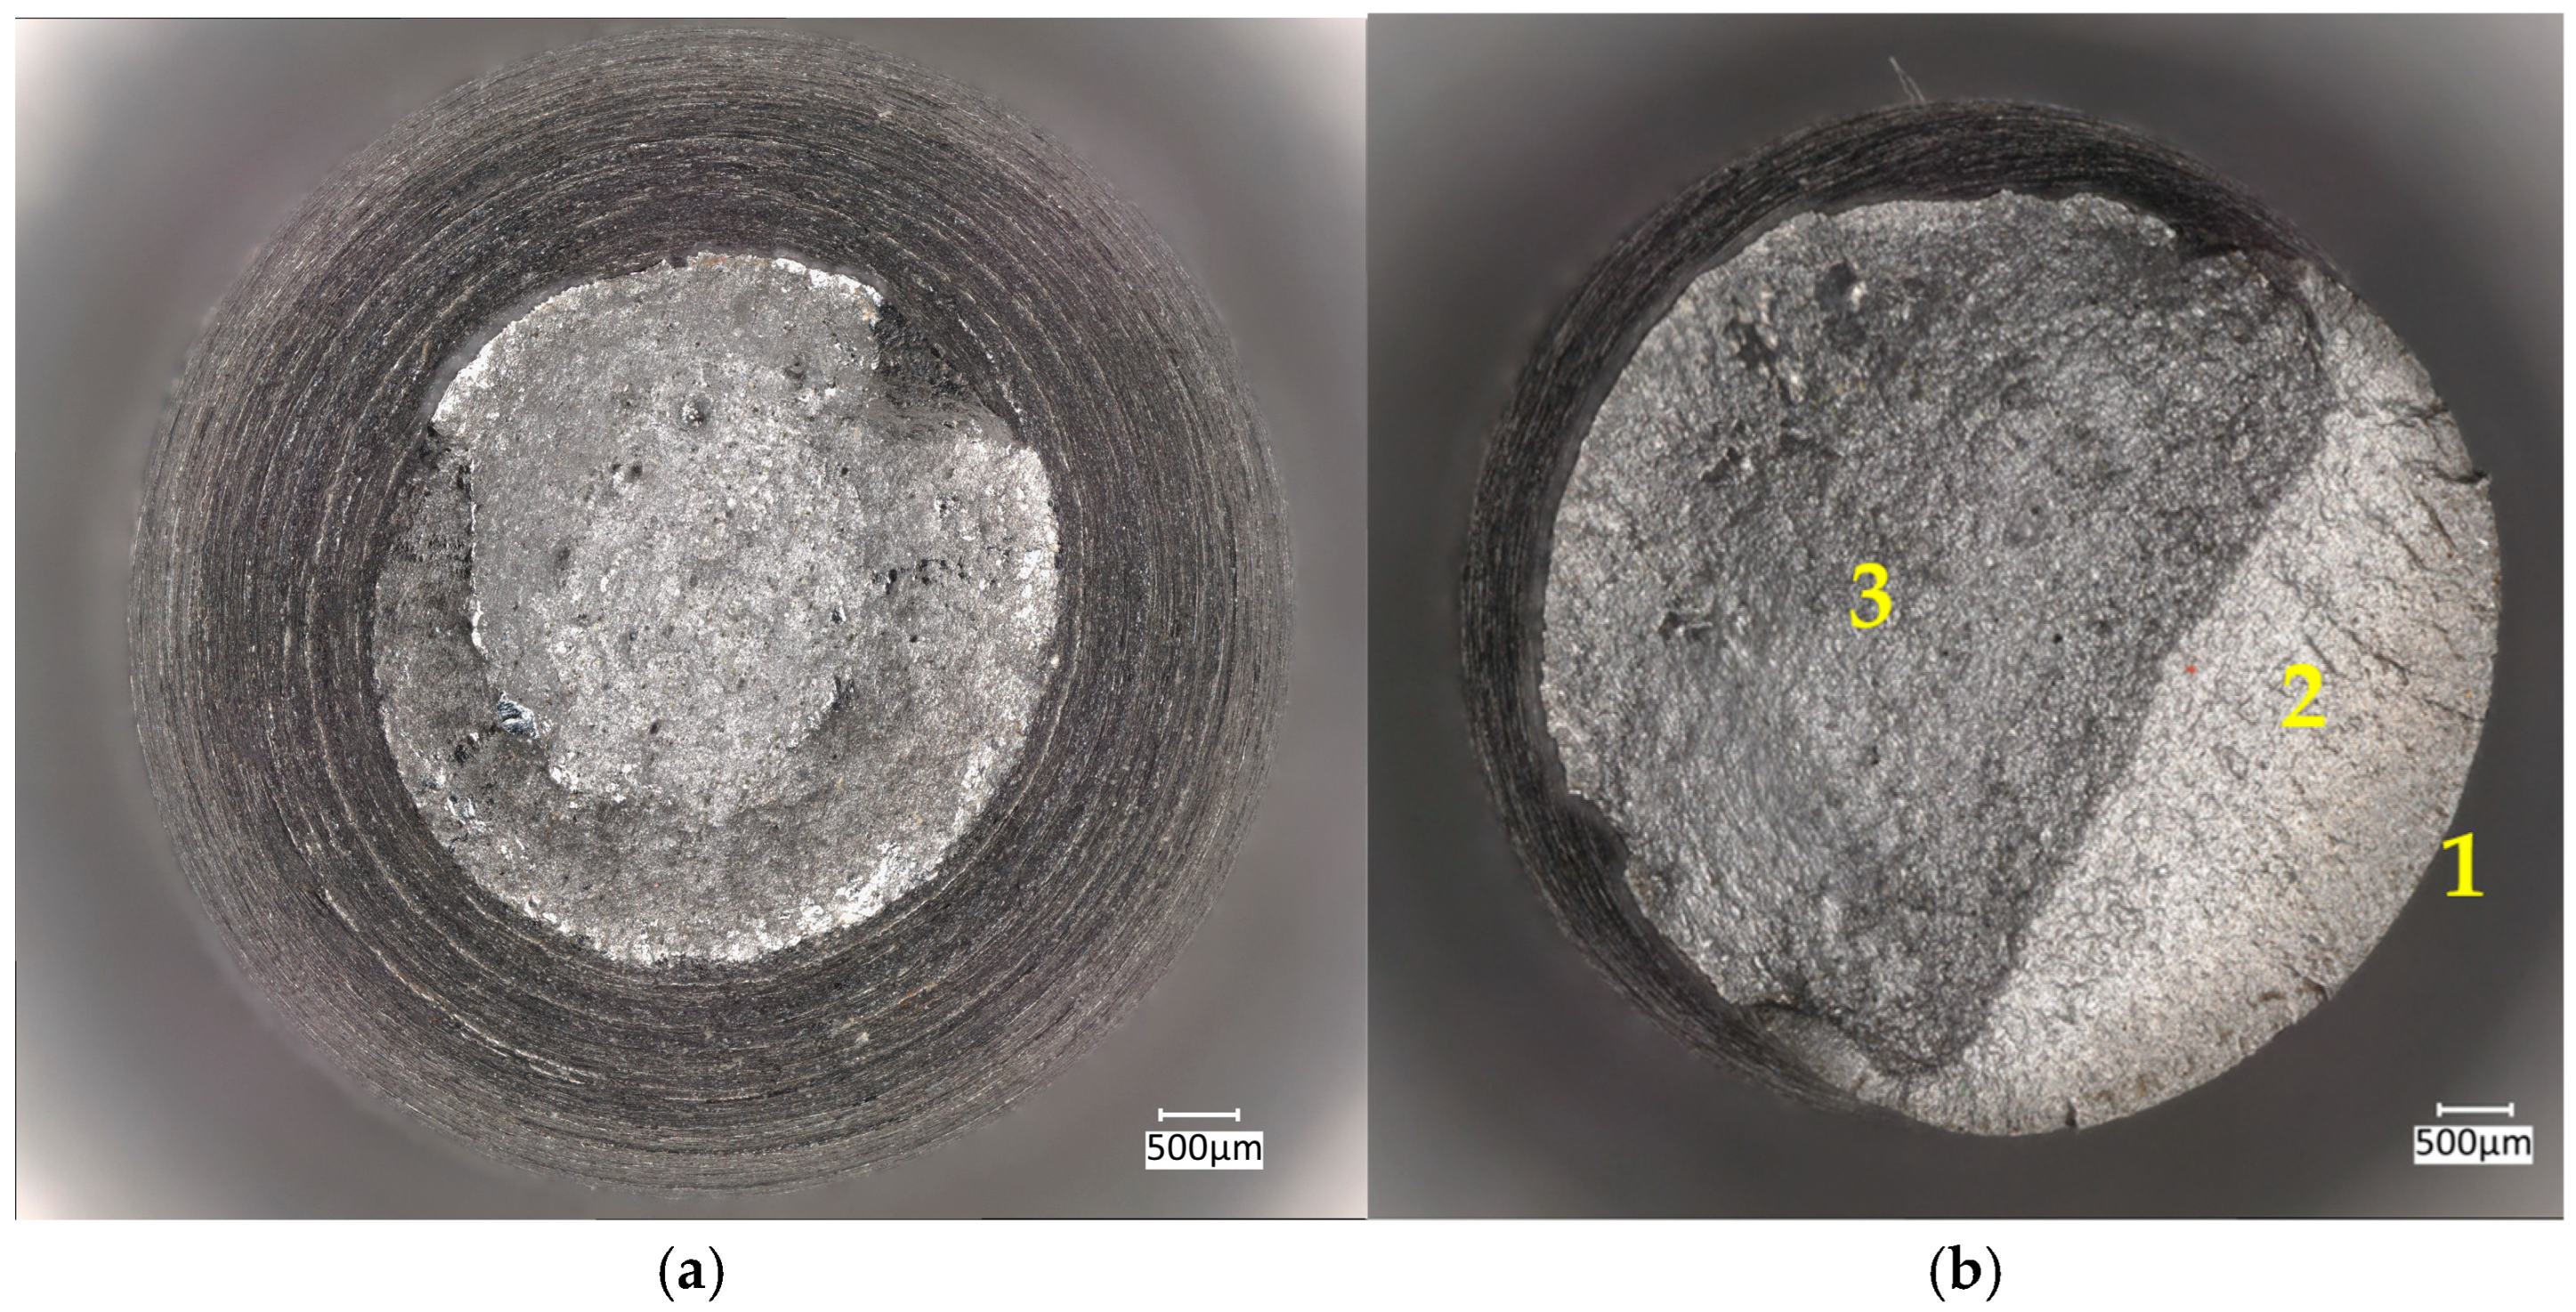
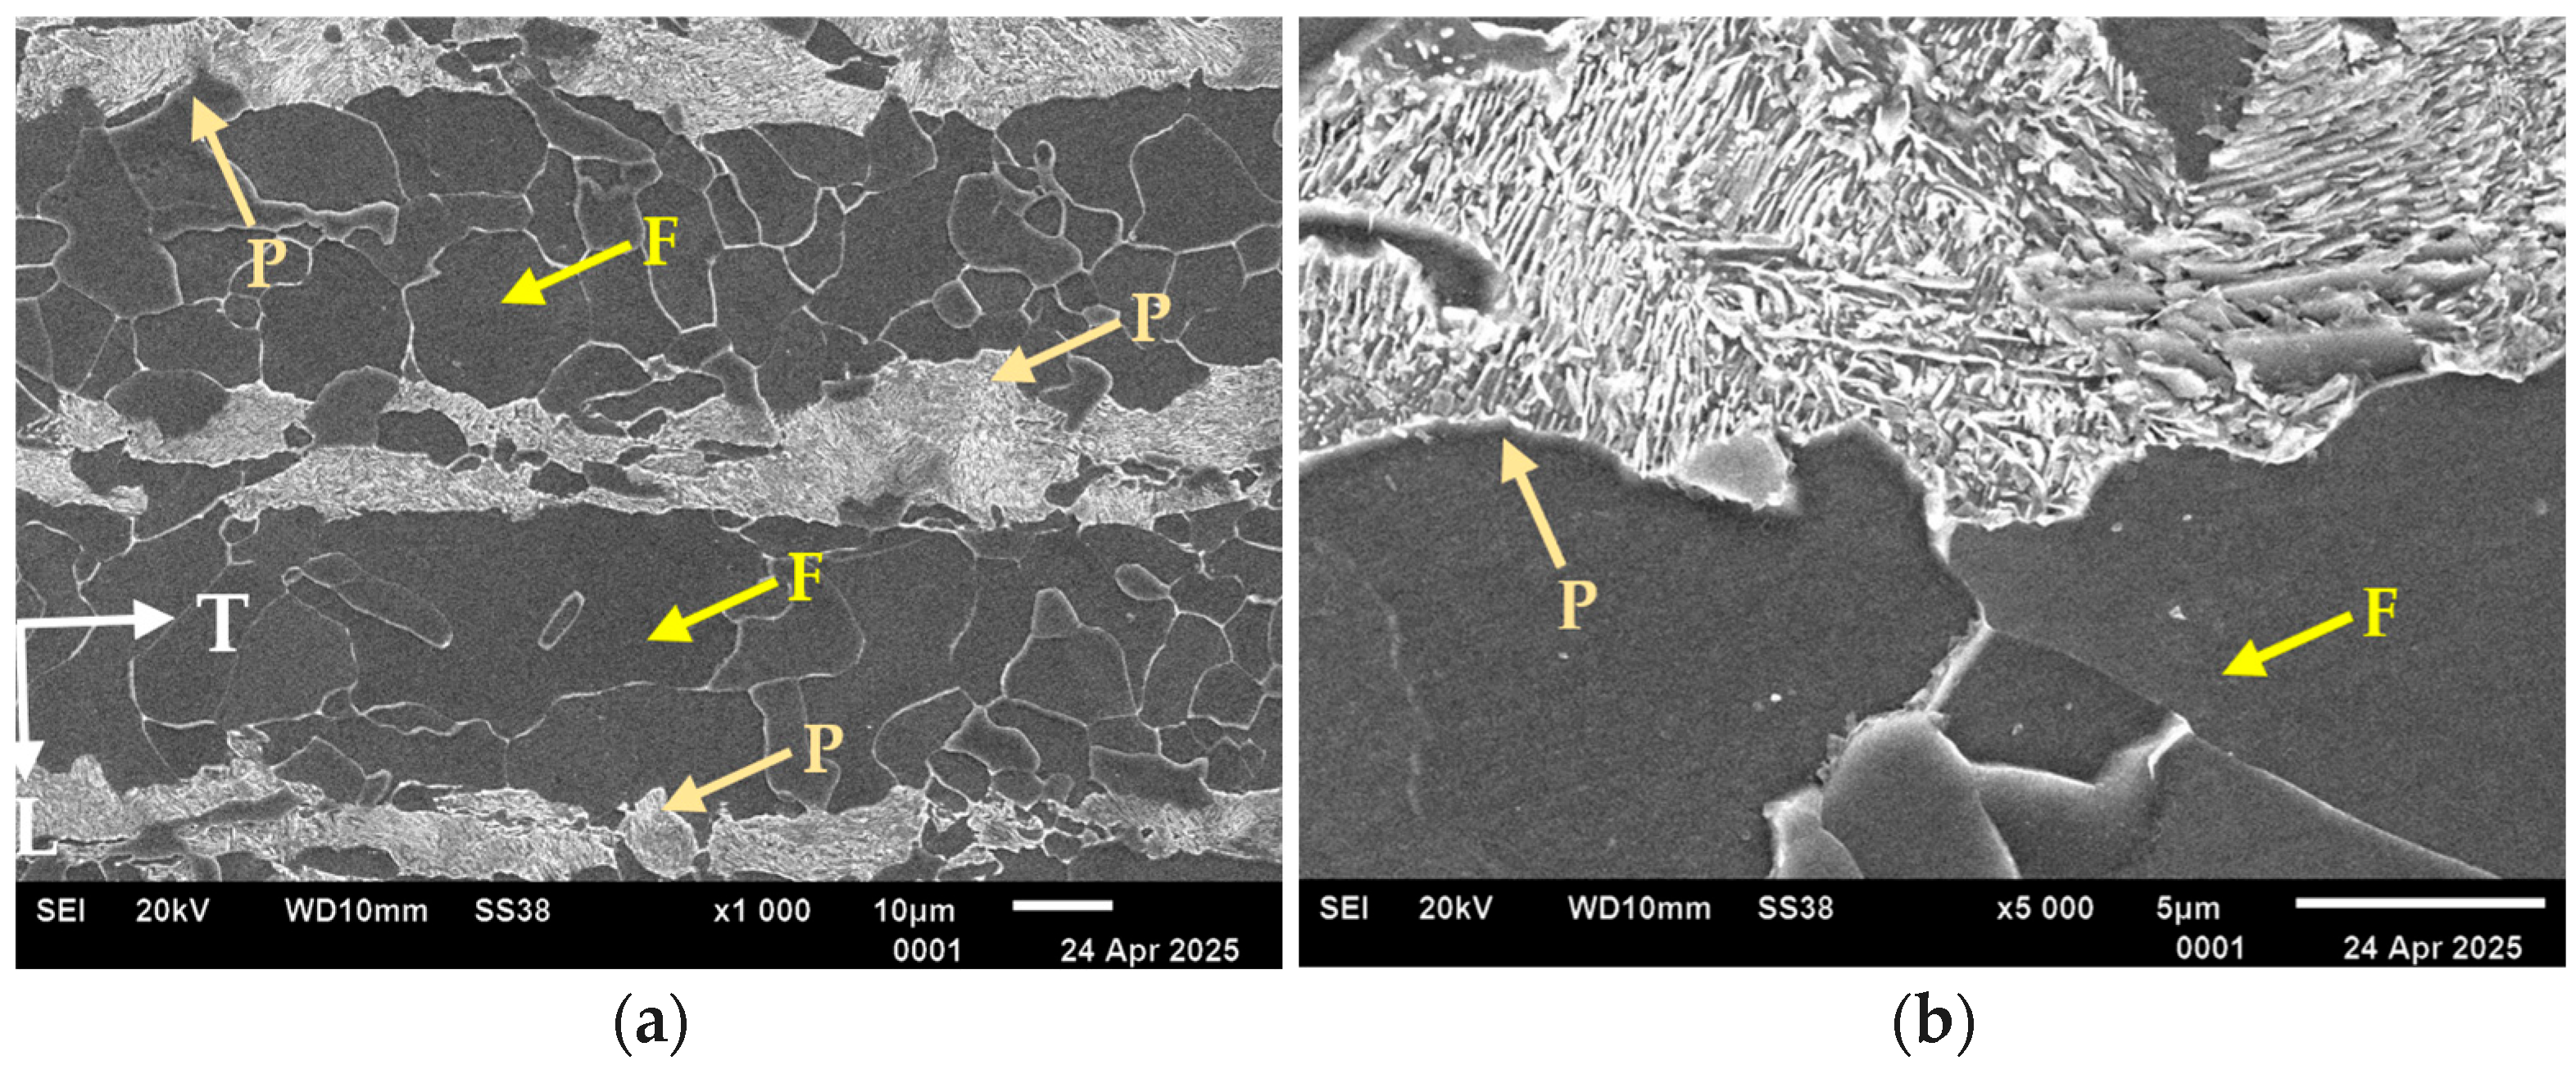
3.1.2. Microstructure Analysis
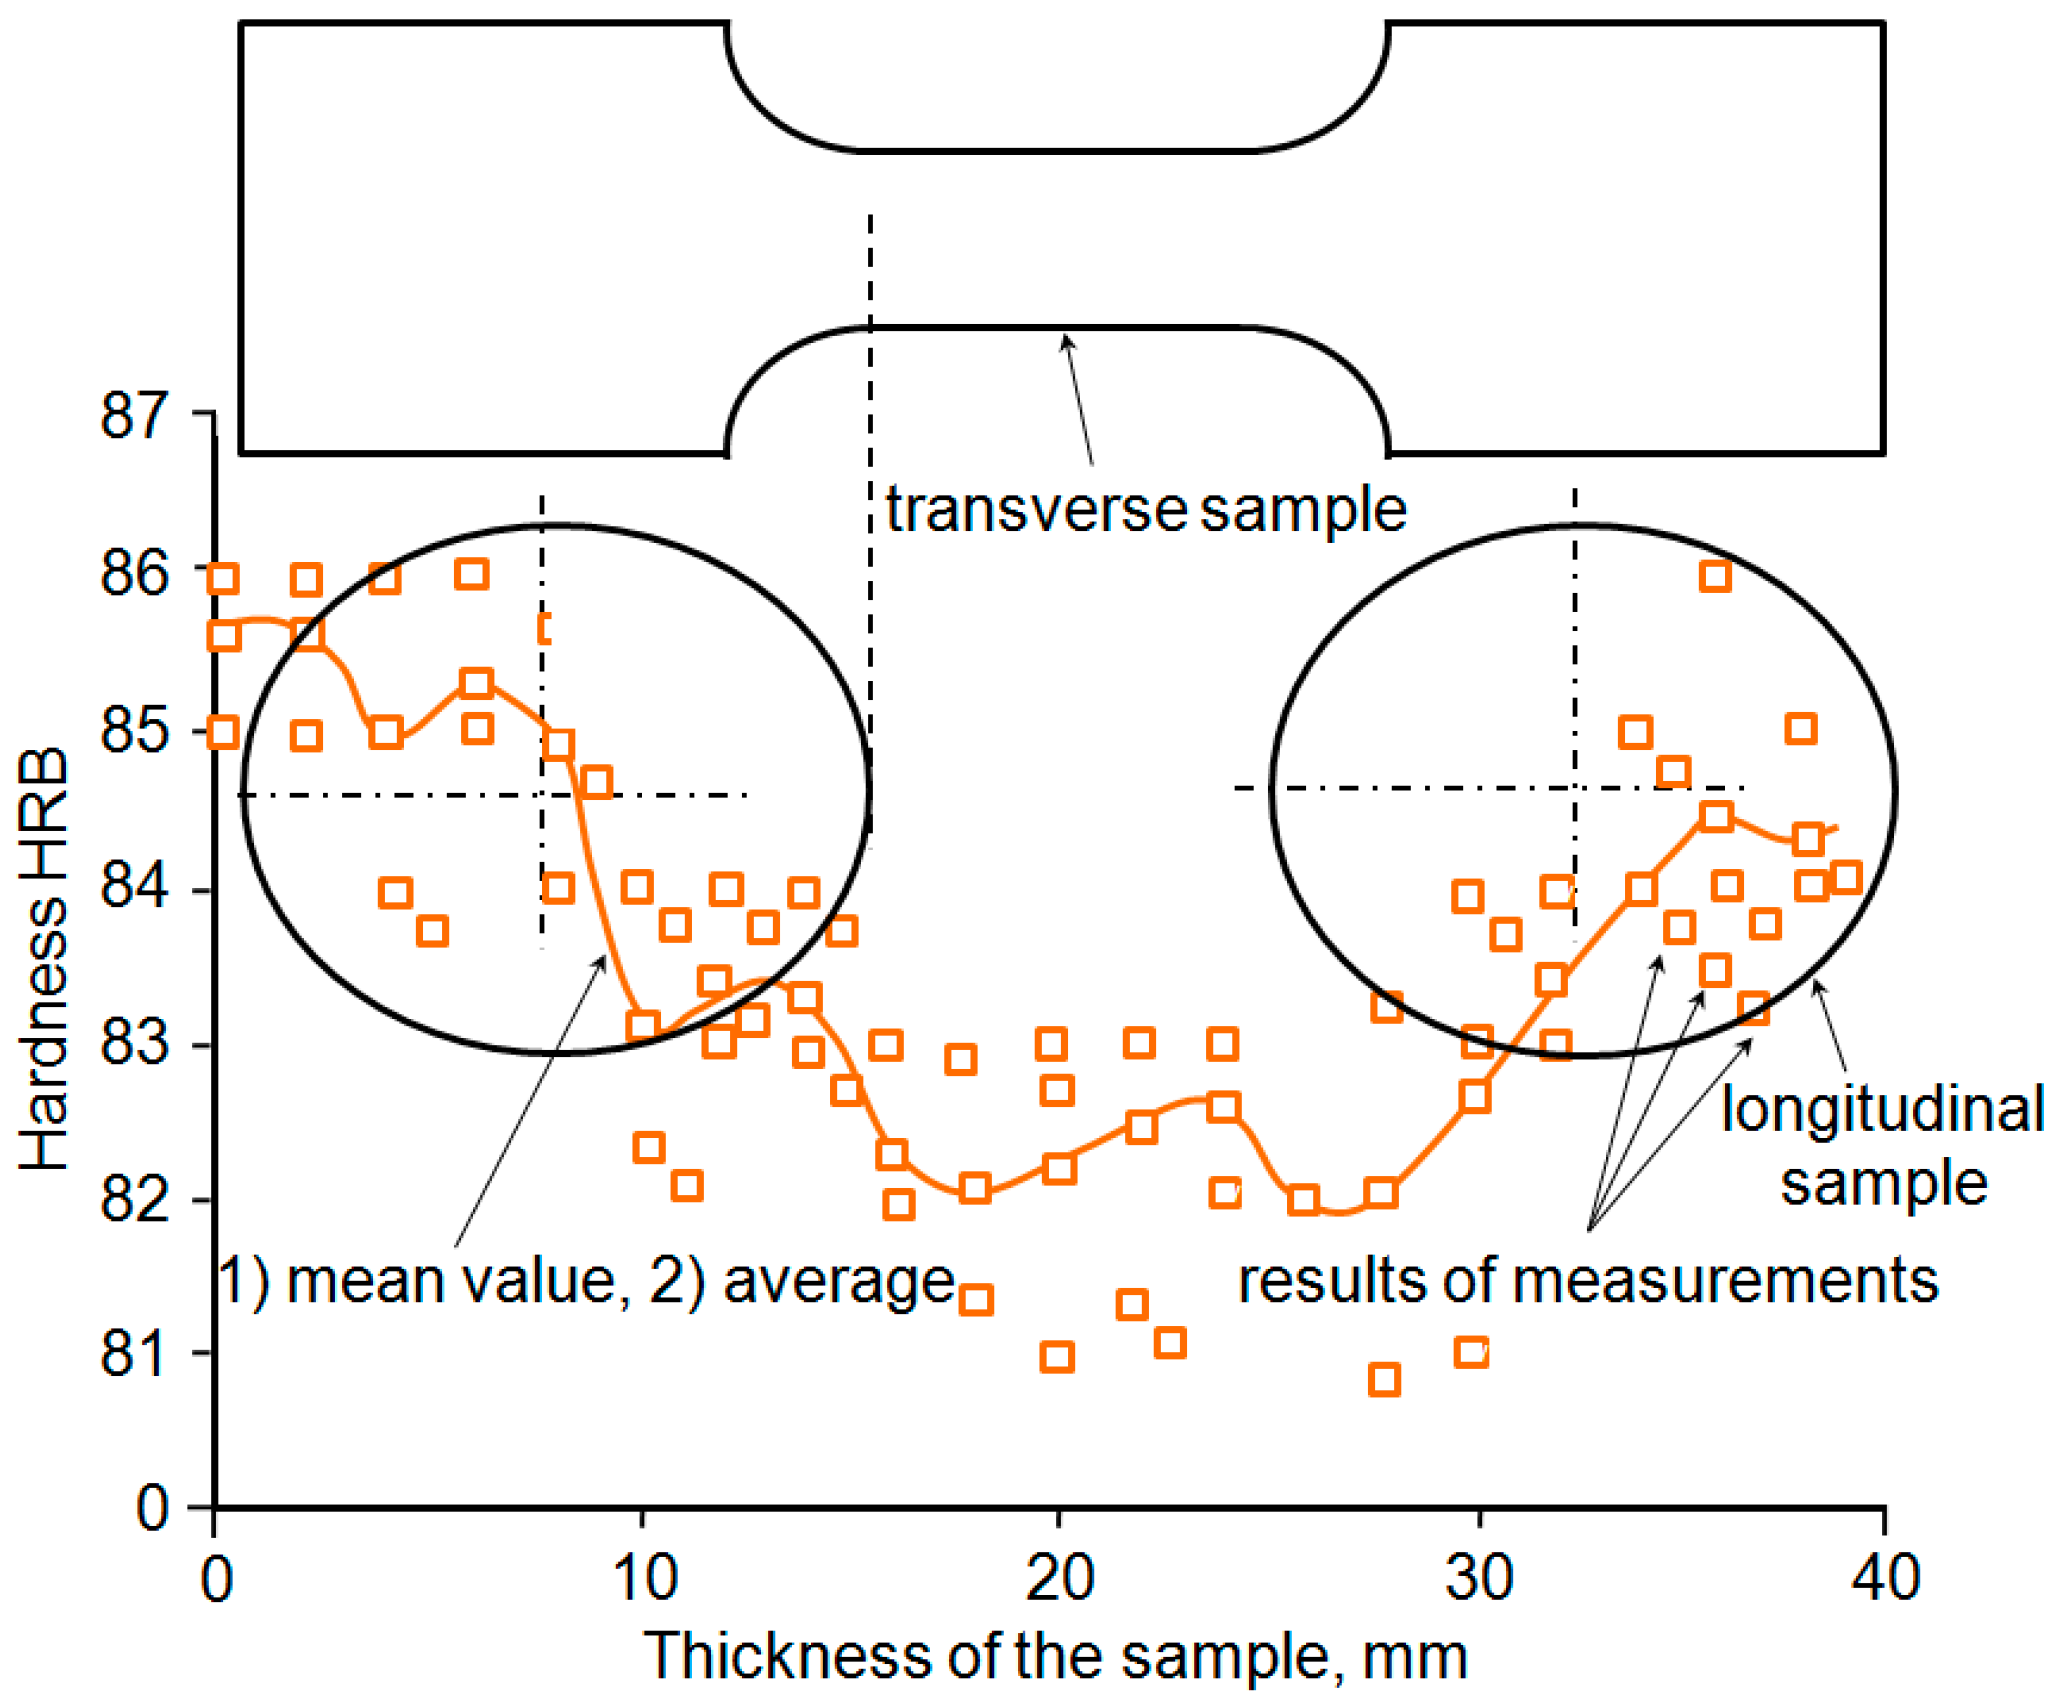
3.1.3. Results of Hardness Measurements
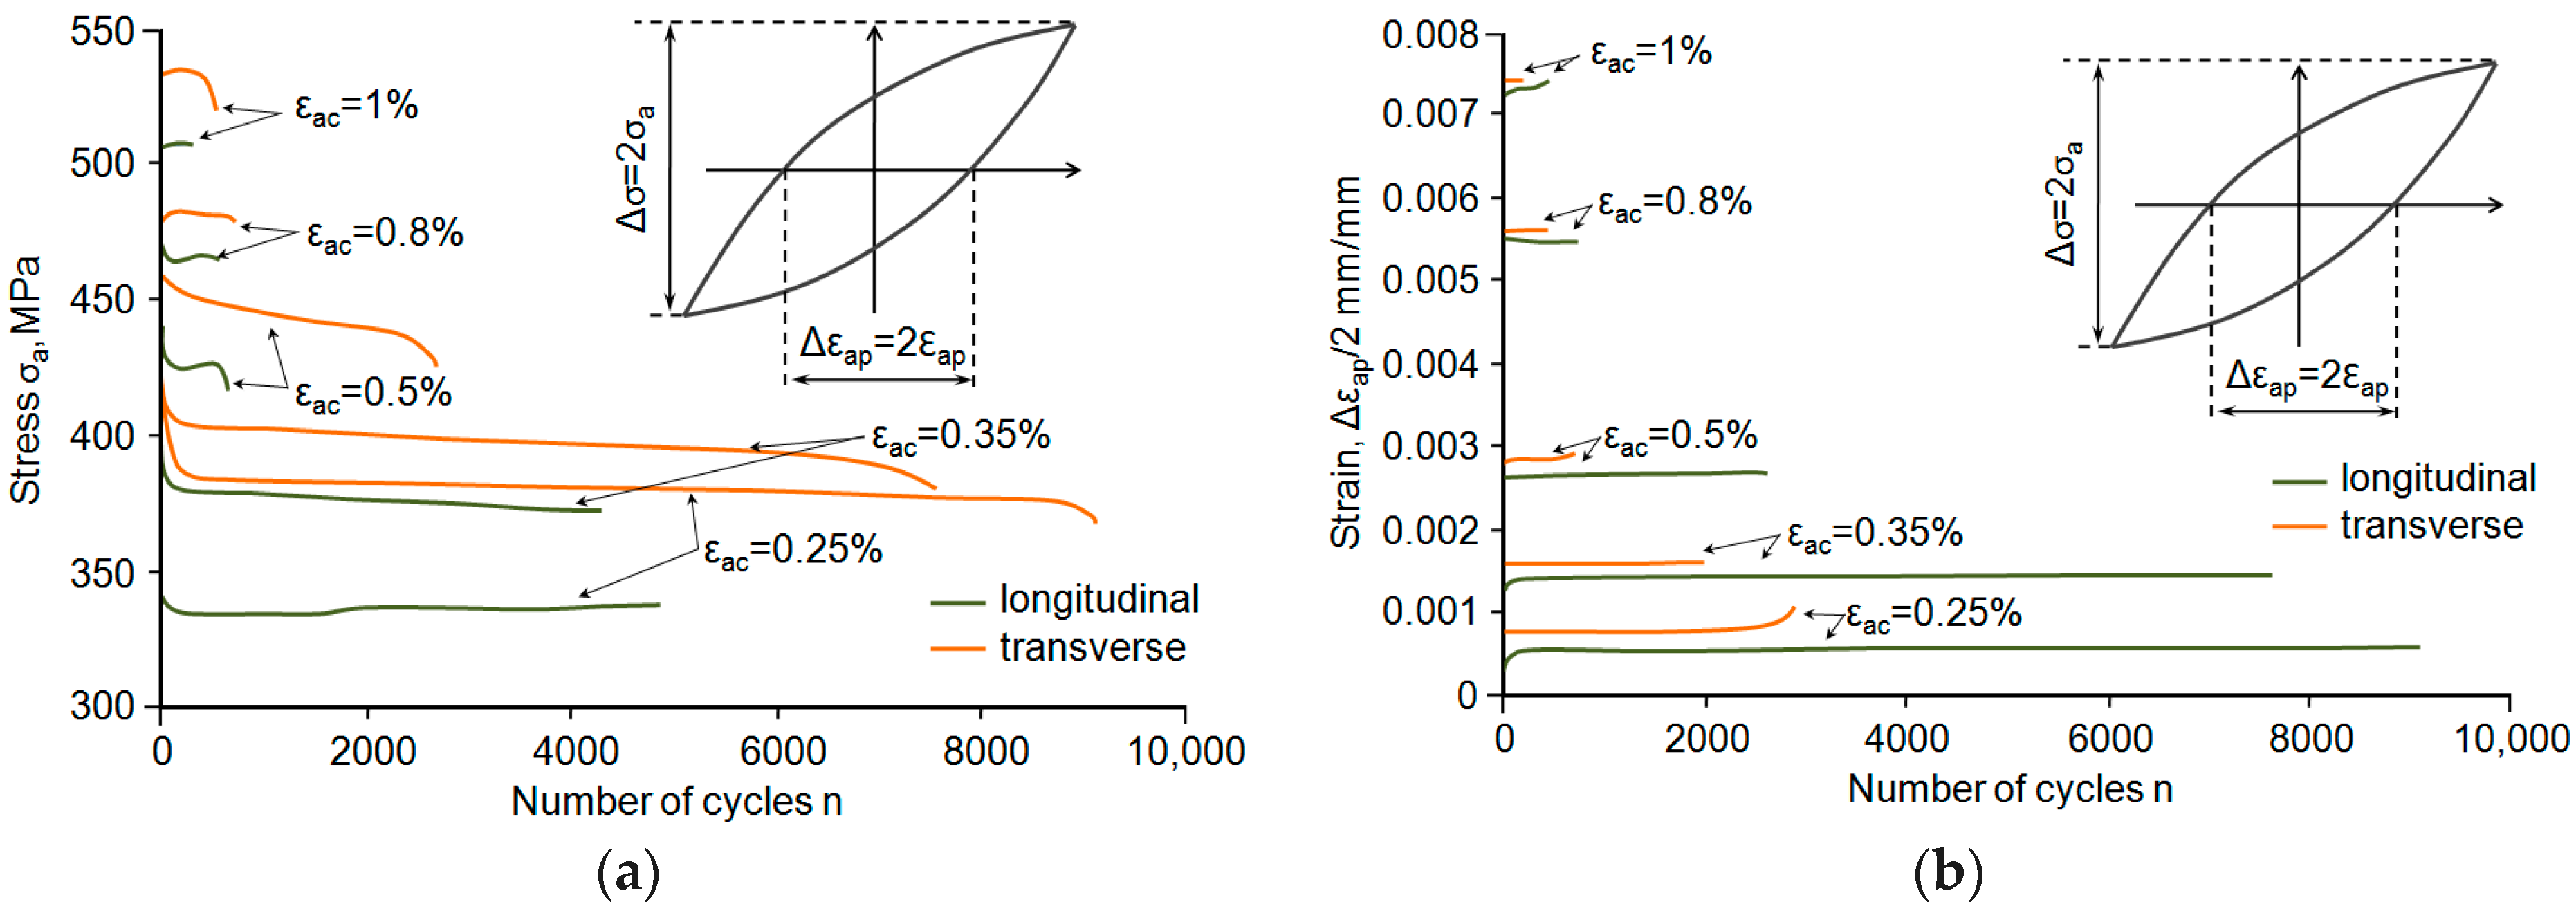
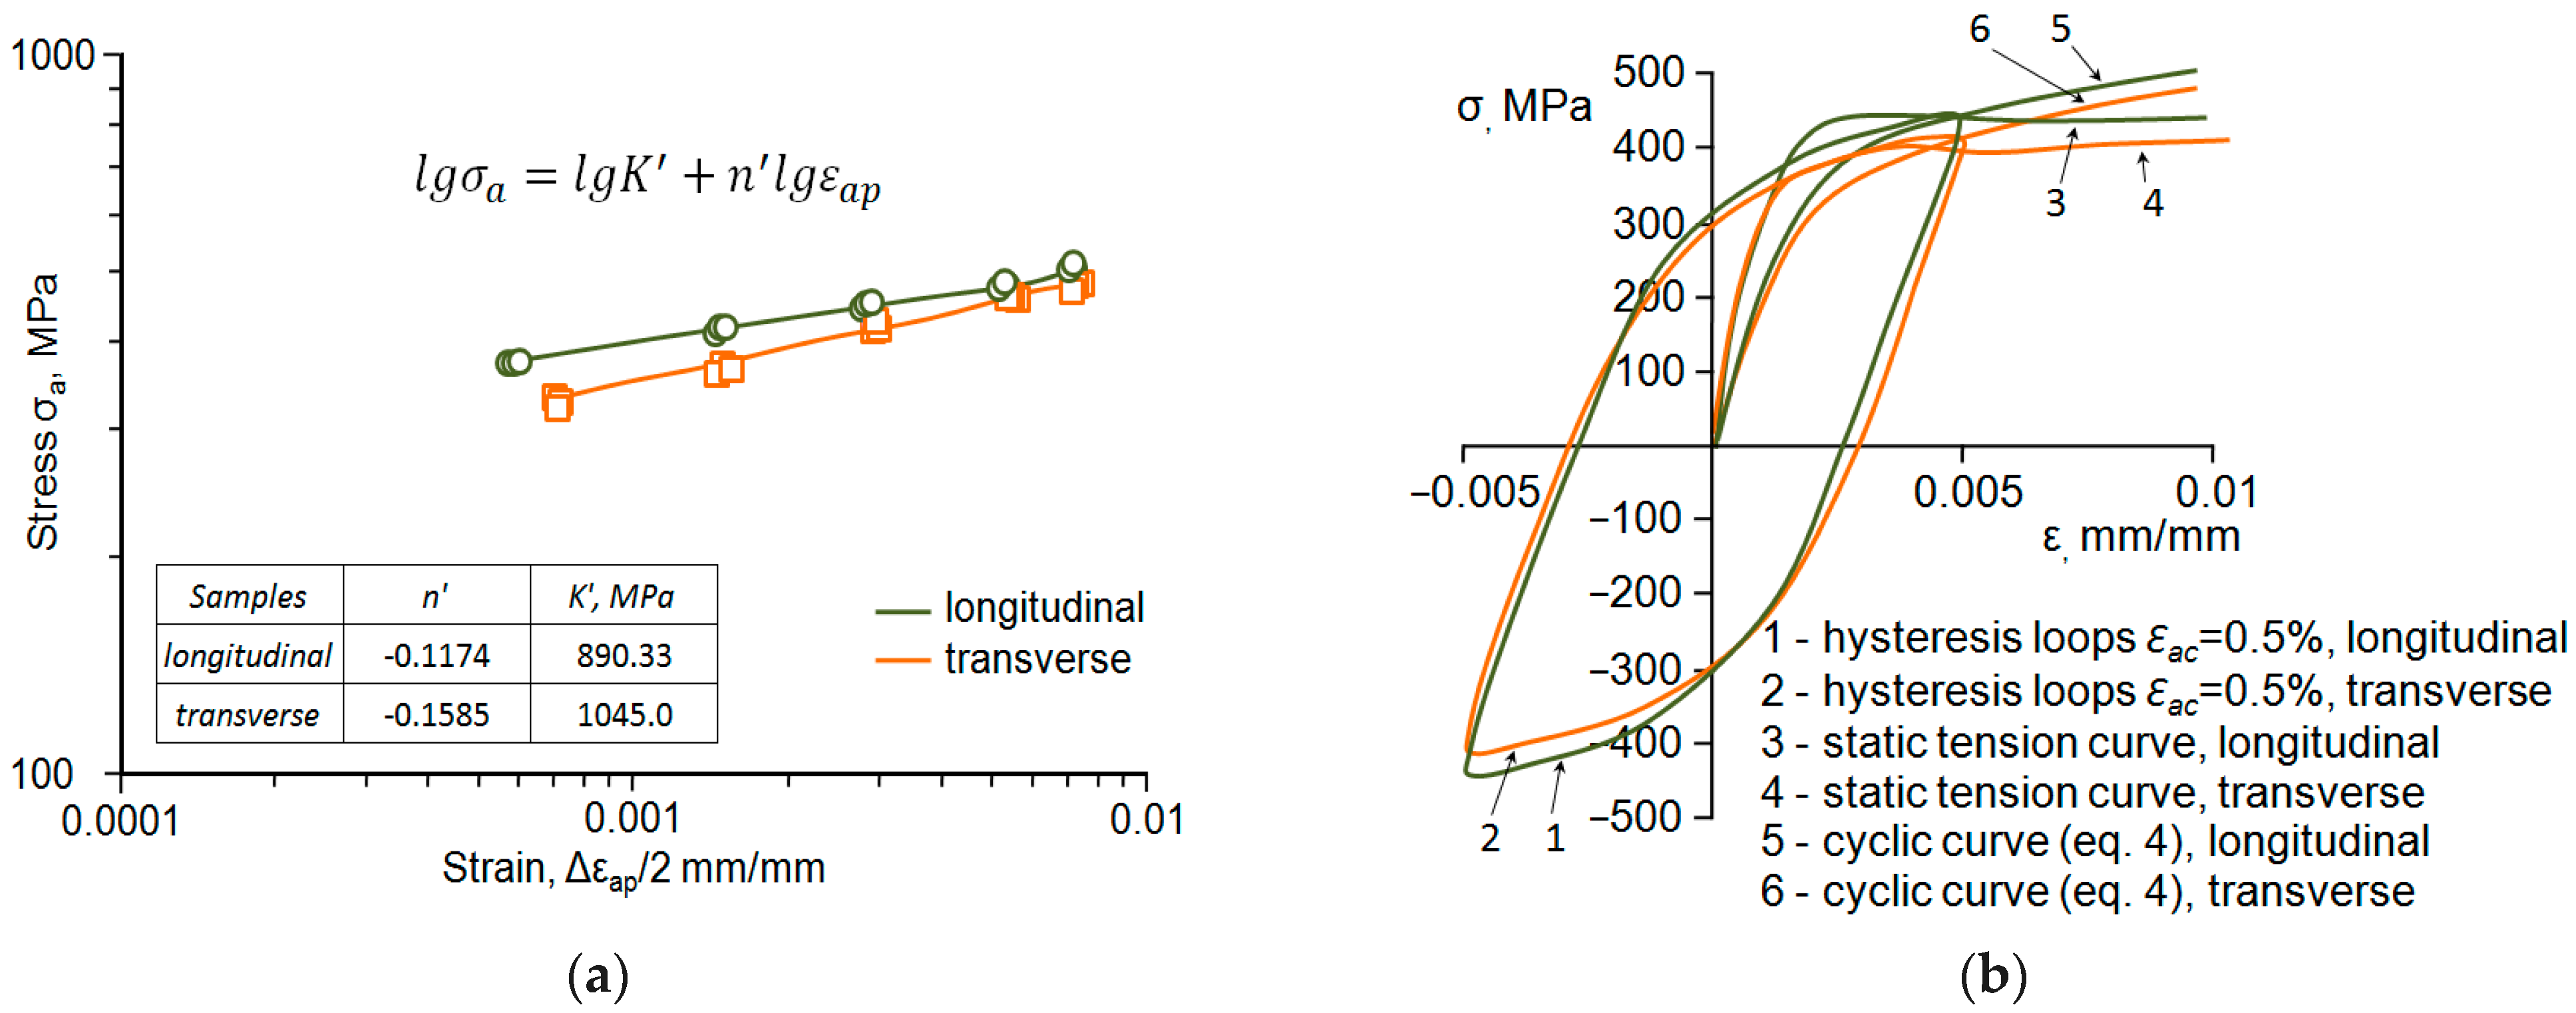
3.2. Constant-Amplitude Low-Cycle Fatigue Tests
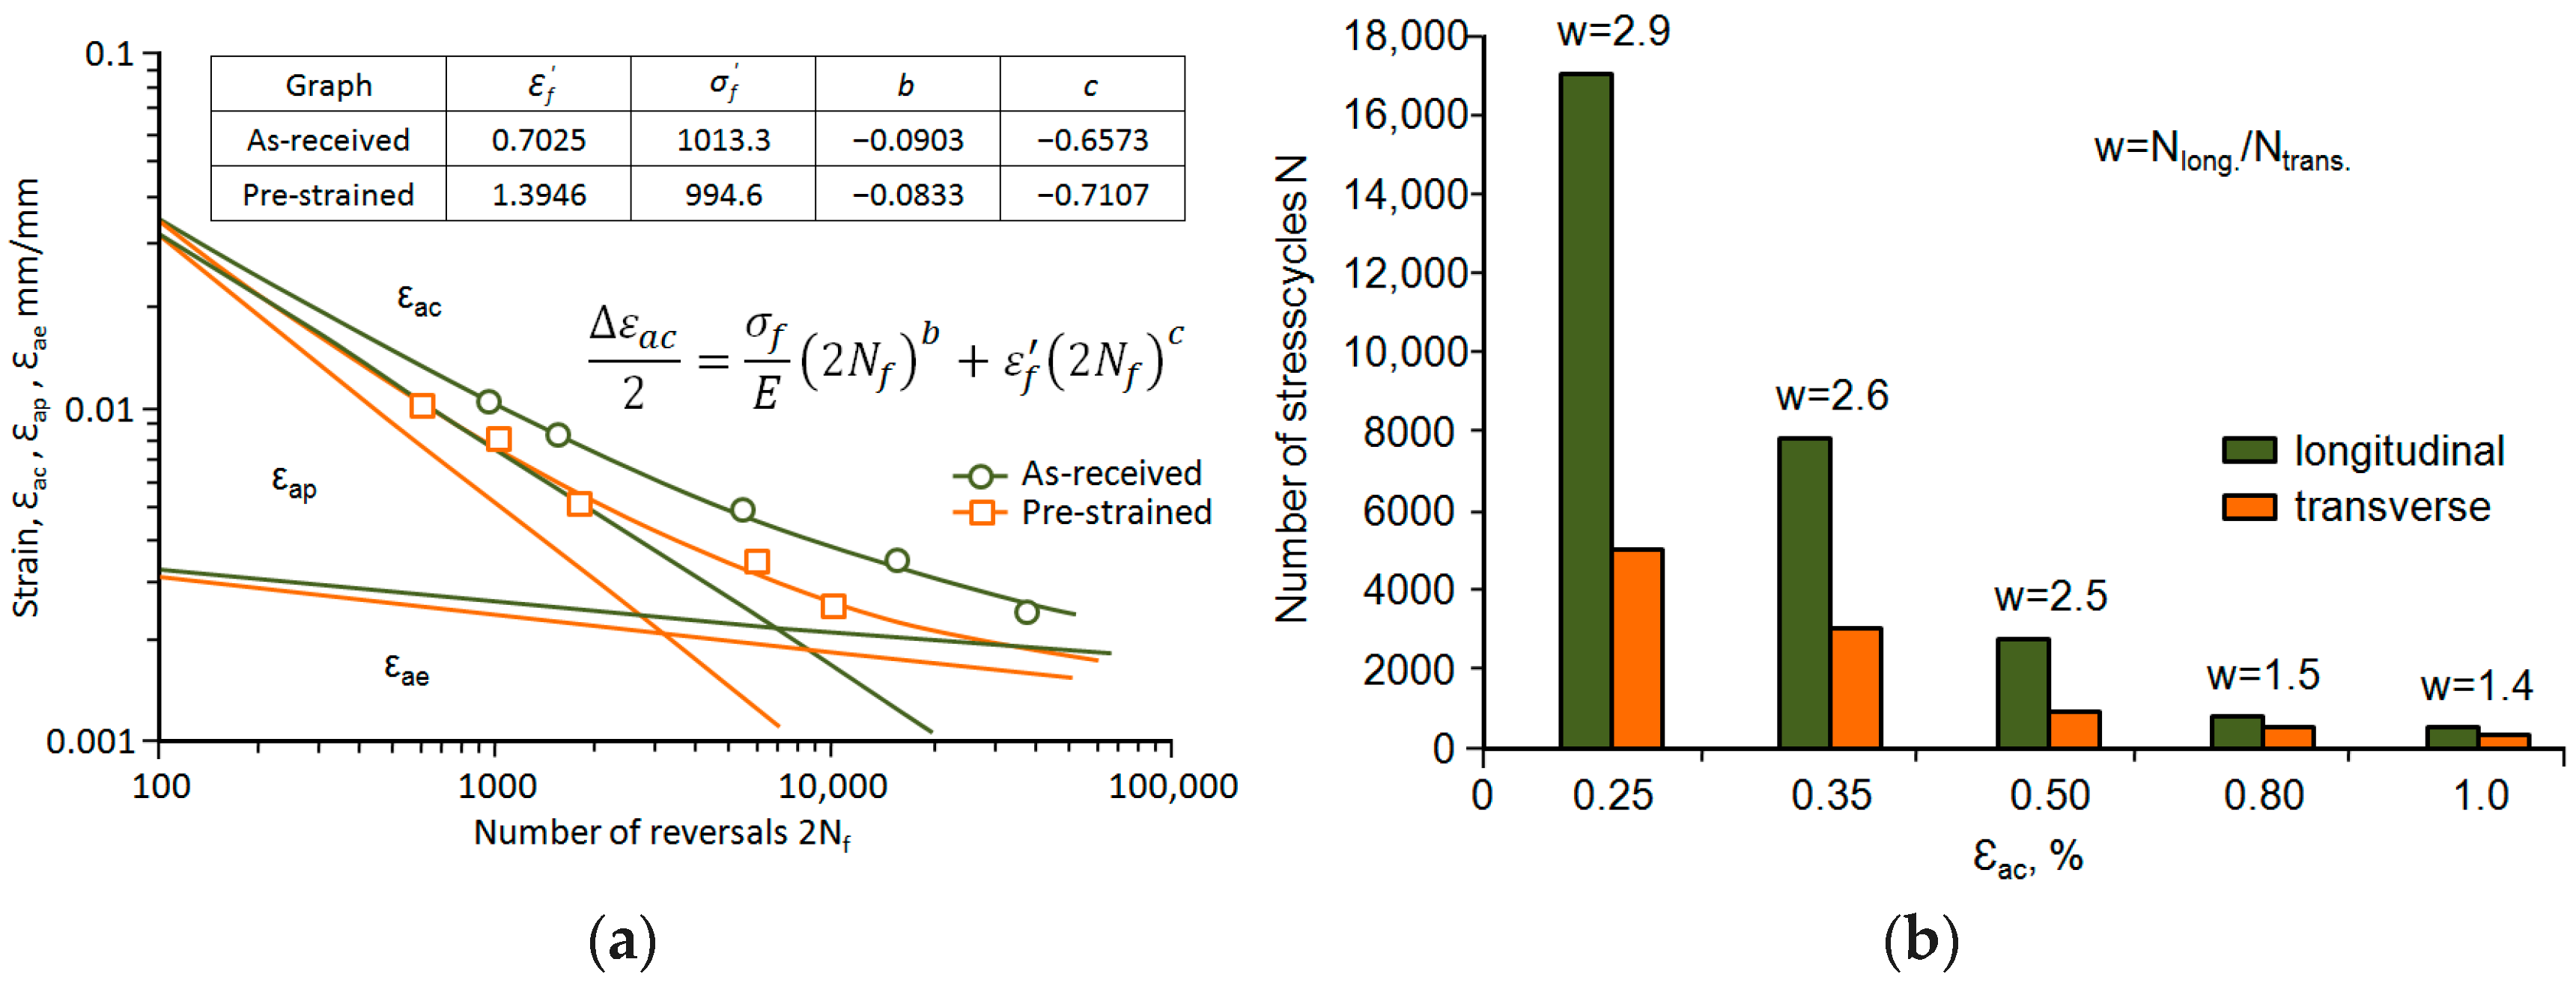
3.3. Programmed Low-Cycle Fatigue Tests
4. Conclusions
- The direction of collecting samples from the sheet metal has little impact on the basic strength parameters, i.e., TS and YS, obtained in the static tensile test.
- A comparative analysis of the reduction of area RA and the elongation of area El. shows a slight drop in these parameters in the case of perpendicular samples compared to parallel ones. Despite the reduction in the values of the RA and El. parameters, the S420M steel meets the material requirements as per the standard [14] related to the risk of lamellar crack occurrence.
- The rolling direction has a significant impact on the fatigue properties. The fatigue life of samples oriented perpendicular to the rolling direction is shorter than the fatigue life of the samples oriented parallel to the rolling direction. The above applies to both constant-amplitude and programmed loading.
- The comparative analysis of fatigue properties under constant-amplitude and programmed loading conditions indicates that the stabilisation course of cyclic properties under constant-amplitude and programmed loading conditions shows qualitative similarity regarding the nature of cyclic property changes and quantitative similarity regarding the values of hysteresis loop parameters during the same life periods.
- The experimental verification of the Palmgren–Miner hypothesis showed a significant influence on the durability of the material data used for the calculations. The basis for the effectiveness of fatigue life calculation results is having material data determined under conditions reflecting the actual loading conditions of the structural element.
Author Contributions
Funding
Institutional Review Board Statement
Informed Consent Statement
Data Availability Statement
Conflicts of Interest
Abbreviations
| i | Loading program block repetition |
| k | Number of loading program stages |
| no | Number of cycles in the loading program block |
| Ni | Number of cycles until fatigue failure at the i-th level |
| λ | Number of loading program block repetitions until fatigue failure |
| E | Young’s modulus |
| El. | Elongation |
| K′ | Cyclic strength coefficient |
| RA | Reduction of area |
| n | Current number of cycles of constant-amplitude loading |
| n′ | Cyclic strain hardening exponent |
| Nf | Number of cycles to failure |
| 2Nf | Number of reversals to failure |
| σ | Stress in general terms |
| σa | Amplitude of stress |
| ε | Strain in general terms |
| εac | Amplitude of total strain |
| εap | Amplitude of plastic strain |
| εae | Amplitude of elastic strain |
| Δε | Cyclic total strain range |
| Δεap | Cyclic plastic strain range |
| Δσ | Cyclic stress range |
| εf′ | Coefficient of cyclic plastic strain |
| σf′ | Fatigue strength coefficient |
| b, c | Exponents of strain diagram of fatigue |
| TS | Tensile strength |
| YS | Yield strength |
| YSH | Upper yield strength |
| YSL | Lower yield strength |
References
- Tucker, L.E. A Procedure for Designing Against Fatigue Failure of Notched Parts; SAE Technical Paper 720265; SAE International: New York, NY, USA, 1972. [Google Scholar]
- Fatemi, A.; Yang, L. Cumulative fatigue damage and life prediction theories: A survey of the state of the art for homogeneous materials. Int. J. Fatigue 1998, 20, 9–34. [Google Scholar] [CrossRef]
- He, Y.; Huang, W.; Guo, W.; Li, Y.; Zhao, S.; Lin, D. An investigation of the anisotropic fatigue properties of laser additively manufactured Ti-6Al-4V under vibration loading. Materials 2023, 16, 5099. [Google Scholar] [CrossRef] [PubMed]
- Jirandehi, A.P.; Hajshirmohammadi, B.; Carrion, P.; Khonsari, M.M.; Shamsaei, N.; Shao, S. Strain energy-based fatigue failure analyses of LB-PBF Inconel 718: Effect of build orientation. Addit. Manuf. 2022, 52, 102661. [Google Scholar] [CrossRef]
- Ghorbanpour, S.; Sahu, S.; Deshmukh, K.; Borisov, E.; Riemslag, T.; Reinton, E.; Bertolo, V.; Jiang, Q.; Popovich, A.; Shamshurin, A.; et al. Effect of microstructure induced anisotropy on fatigue behaviour of functionally graded Inconel 718 fabricated by additive manufacturing. Mater. Charact. 2001, 179, 111350. [Google Scholar] [CrossRef]
- Wu, H.; Hamada, S.; Noguchi, H. Pre-strain effect on fatigue strength characteristics of SUH660 plain specimens. Int. J. Fatigue 2013, 55, 291–298. [Google Scholar] [CrossRef]
- Sun, H.; Wei, K.; Yang, X.; Xiao, Z.; Wu, Y. Effects of pre-strain and annealing on the fatigue properties of complex phase steel CP800. Int. J. Fatigue 2020, 131, 105364. [Google Scholar] [CrossRef]
- Kim, J.H.; Park, W.S.; Chun, M.S.; Kim, J.J.; Bae, J.H.; Kim, M.H.; Lee, J.M. Effect of pre-straining on low-temperature mechanical behavior of AISI 304L. Mater. Sci. Eng. A 2012, 543, 50–57. [Google Scholar] [CrossRef]
- Mroziński, S.; Lipski, A.; Piotrowski, M.; Egner, H. Influence of pre-strain on static and fatigue properties of S420M steel. Materials 2023, 16, 590. [Google Scholar] [CrossRef]
- Chruścielski, G. Effect of rolling anisotropy on fracture toughness of AW 7075-T651 alloy. Arch. Sci. Technol. Res. J. 2012, 12, 19–27. [Google Scholar]
- Daoud, A.; Vogt, J.B.; Charkaluk, E.; Bouquerel, J.; Zhang, L.; Biasci, J.C. Anisotropy effects on the tensile and fatigue behaviour of an oxide dispersion strengthened copper alloy. Mater. Sci. Eng. A 2012, 534, 640–648. [Google Scholar] [CrossRef]
- Pessard, E.; Morel, F.; Morel, A. The anisotropic fatigue behavior of forged steel. Adv. Eng. Mater. 2009, 11, 732–735. [Google Scholar] [CrossRef]
- Pessard, E.; Morel, F.; Morel, A.; Bellet, D. Modelling the role of non-metallic inclusions on the anisotropic fatigue behaviour of forged steel. Int. J. Fatigue 2011, 33, 568–577. [Google Scholar] [CrossRef]
- EN 10164; Steel Products with Improved Deformation Properties Perpendicular to the Surface of the Product—Technical Delivery Conditions. European Committee for Standardization: Brussels, Belgium, 2004.
- LR-RU-002; Rules for The Manufacture, Testing and Certification of Materials. Lloyd’s Register: London, UK, 2019.
- EN 1993-1-10; Eurocode 3: Design of Steel Structures—Part 1–10: Material Toughness and Through-Thickness Properties. European Committee for Standardization: Brussels, Belgium, 2005.
- EN 10002-1; Metallic Materials—Tensile Testing—Part 1: Method of Test at Ambient Temperaturę. European Committee for Standardization: Brussels, Belgium, 2018.
- EN-1993-1-9; Eurocode 3: Design of Steel Structures—Part 1–9: Fatigue. European Committee for Standardization: Brussels, Belgium, 2007.
- ASTM E606-92; Standard Practice for Strain-Controlled Fatigue Testing. ASTM International: West Conshohocken, PA, USA, 1992.
- EN ISO 6508-1; Metallic Materials—Rockwell Hardness Test—Part 1: Tets Method. International Organization for Standardization: Geneva, Switzerland, 2023.
- Miner, M.A. Cumulative Damage in Fatigue, Transactions of the American Society of Mechanicals Engineers. J. Appl. Mech. 1945, 67, 159–164. [Google Scholar] [CrossRef]
- Palmgren, A. Die Lebensdauer von Kugellagern. Verfahrenstechnik 1924, 68, 339–341. [Google Scholar]
- Stradomski, Z.; Dyja, H.; Stradomski, G. The microstructure change during modeling of conventional and thermomechanical rolling of S355 steel bars. Mater. Sci. Forum 2010, 638–642, 2573–2578. [Google Scholar] [CrossRef]
- EN ISO 643; Steels—Micrographic Determination of the Apparent Grain Size. International Organization for Standardization: Geneva, Switzerland, 2024.
- Strzępek, P.; Mamala, A.; Boumerzoug, Z.; Baudin, T.; Brisseft, F.; Zasadzińska, M.; Noga, P. Effect of horizontal continuous casting parameters on cyclic macrosegregation, microstructure, and properties of high-strength Cu–Mg alloy cast rod. Metall. Mater. Trans. 2025, 56, 41–60. [Google Scholar] [CrossRef]
- Ramberg, W.; Osgood, W.R. Description of Stress-Strain Curves by Three Parameters; Technical Note, No 402; NACA: Washington, DC, USA, 1943. [Google Scholar]
- Manson, S.S. Behaviour of Materials Under Conditions of Thermal Stress; Report No. NACA TN2933; National Advisory Committee for Aeronautics: Washington, DC, USA, 1954. [Google Scholar]
- Coffin, L.F. A study of cyclic-thermal stresses in a ductile metal. ASME Trans. 1954, 76, 931–935. [Google Scholar] [CrossRef]
- Basquin, O.H. The exponential law of endurance tests. Proc. Am. Soc. Test. Mater. 1910, 10, 625–630. [Google Scholar]
- Mroziński, S. Influence of loading program sequence on the course of the 45 steel stabilization process. Arch. Mech. Eng. 2003, L, 387–401. [Google Scholar]
- Mroziński, S. Comparative analysis of cyclic properties of 30HGSA steel under constant-amplitude and incremental step loading. Arch. Mech. Eng. 2006, LIII, 191–205. [Google Scholar]
- Mroziński, S. Comparative analysis of two methods of metal cycle characteristics determination. Przegląd Mech. 2004, 4, 30–36. [Google Scholar]
- Bayerlein, M.; Christ, H.; Mughrabi, H. A critical evaluation of the incremental step test. In Proceedings of the Second International Conference on Low Cycle Fatigue and Elasto-Plastic Behaviour of Materials, Munich, Germany, 7–11 September 1987; pp. 149–153. [Google Scholar]
- Mroziński, S. Energy-based method of fatigue damage cumulation. Int. J. Fatigue 2019, 121, 73–83. [Google Scholar] [CrossRef]
- Mroziński, S.; Topoliński, T. New energy model of fatigue damage accumulation and its verification for 45-steel. J. Theor. Appl. Mech. 1999, 2, 223–239. [Google Scholar]
- Mroziński, S. A fatigue damage accumulation method in low cycle fatigue zone. J. Theor. Appl. Mech. 2000, 4, 767–780. [Google Scholar]


| C | Si | Mn | P | S |
|---|---|---|---|---|
| 0.16 | 0.22 | 1.53 | 0.018 | 0.009 |
| No. | εaci, % | ni |
|---|---|---|
| 1 | 0.25 | 10 |
| 2 | 0.35 | 10 |
| 3 | 0.50 | 10 |
| 4 | 0.80 | 10 |
| 5 | 1.00 | 10 |
| No. | Sample | TS | YSL | YSH | E | El. | RA |
|---|---|---|---|---|---|---|---|
| MPa | % | ||||||
| 1 | transverse | 510 | 350 | 360 | 210 | 50 | 61 |
| 2 | longitudinal | 540 | 410 | 415 | 202 | 58 | 69 |
| No. | Sample Type | Tests of Fatigue Life NExp | Calculations of Fatigue Life NObl | NExp/NObl |
|---|---|---|---|---|
| 1 | perpendicular | 340 | 359 | 0.94 |
| 2 | parallel | 530 | 610 | 0.87 |
Disclaimer/Publisher’s Note: The statements, opinions and data contained in all publications are solely those of the individual author(s) and contributor(s) and not of MDPI and/or the editor(s). MDPI and/or the editor(s) disclaim responsibility for any injury to people or property resulting from any ideas, methods, instructions or products referred to in the content. |
© 2025 by the authors. Licensee MDPI, Basel, Switzerland. This article is an open access article distributed under the terms and conditions of the Creative Commons Attribution (CC BY) license (https://creativecommons.org/licenses/by/4.0/).
Share and Cite
Mroziński, S.; Golański, G.; Jagielska-Wiaderek, K.; Szarek, A. Impact of Microstructural Anisotropy on the Low-Cycle Fatigue of S420M Steel. Materials 2025, 18, 2365. https://doi.org/10.3390/ma18102365
Mroziński S, Golański G, Jagielska-Wiaderek K, Szarek A. Impact of Microstructural Anisotropy on the Low-Cycle Fatigue of S420M Steel. Materials. 2025; 18(10):2365. https://doi.org/10.3390/ma18102365
Chicago/Turabian StyleMroziński, Stanisław, Grzegorz Golański, Karina Jagielska-Wiaderek, and Arkadiusz Szarek. 2025. "Impact of Microstructural Anisotropy on the Low-Cycle Fatigue of S420M Steel" Materials 18, no. 10: 2365. https://doi.org/10.3390/ma18102365
APA StyleMroziński, S., Golański, G., Jagielska-Wiaderek, K., & Szarek, A. (2025). Impact of Microstructural Anisotropy on the Low-Cycle Fatigue of S420M Steel. Materials, 18(10), 2365. https://doi.org/10.3390/ma18102365