Article

The Modulation of the Pore Structure in Porous Carbon by Metal Salts and Its Application for Joining Silicon Carbide Ceramics

1
State Key Laboratory of Advanced Marine Materials, Ningbo Institute of Materials Technology and Engineering, Chinese Academy of Sciences, Ningbo 315201, China
2
Qianwan Institute of CNITECH, Qianwan New Area, Ningbo 315336, China
*
Authors to whom correspondence should be addressed.
Materials 2025, 18(10), 2336; https://doi.org/10.3390/ma18102336 (registering DOI)
Submission received: 17 April 2025 / Revised: 12 May 2025 / Accepted: 15 May 2025 / Published: 17 May 2025
(This article belongs to the Section Advanced and Functional Ceramics and Glasses)

Abstract

:
In this work, the metal salts were introduced into the resin-solvent gel system to leverage their ortho-substitution effect, thereby accelerating the polymerization-induced phase separation process. Subsequent in-situ carbonization resulted in the preparation of porous carbon materials with three-dimensional interconnected pores. By precisely tuning the parameters of the resin-solvent-metal ion system, control over the pore structure of the porous carbon was achieved, with a porosity range of 16.5% to 66.5% and a pore diameter range of 8 to 248 nm. The addition of metallic salts can simply and effectively increase the pore structure after carbonization, making the infiltration of molten silicon easier. This is beneficial to the joining process of silicon carbide ceramics. Based on these findings, a high-reliability joining technique for large-sized (135 mm × 205 mm) silicon carbide ceramics was developed. The resulting interlayer was dense and defect-free, exhibiting a joining strength of 309 ± 33 MPa and a Weibull modulus of 10.67. These results highlight the critical role of structured porous media in advancing the field of large-sized ceramic joining.

1. Introduction

Porous carbons are functional materials with excellent properties, such as good pore structures, high porosity, good electrical conductivity, controllable pore sizes, and high specific surface areas [1,2,3,4]. Therefore, these materials are widely used in fields such as gas separation, water and air purification, adsorbent materials, catalyst carriers, chromatography, and the preparation of supercapacitors and carbide ceramics [5,6,7]. The application of porous carbon materials is closely related to their pore structure. Porous carbon materials are categorized into three types according to their pore sizes: micropores (<2 nm), mesopores (2~50 nm), and macropores (>50 nm) [8]. Micropores often function as catalytic active sites in specific energy conversion reactions, such as the oxygen reduction reaction (ORR). Mesopores enhance rapid mass transport and improve access to catalytic active sites, while macropores promote the swift diffusion of various molecules (e.g., oxygen) during the ORR process [9]. At the microstructural level, porous carbons exhibit diverse morphologies, including nanofiber films [10], nanospheres [11], activated carbon tubes [12], among others. Achieving superior performance requires rational control over the textural properties (pore volume, pore size distribution, degree of graphitization) and surface chemistry of carbon materials. This can be accomplished through strategies such as pore size regulation, channel optimization, doping modification, or catalyst loading, thereby fulfilling the specific demands of various applications. Fields such as supercapacitor fabrication [13] and gas chromatography require porous carbons in the mesoporous range (2–50 nm). Porous carbon materials with macroporous (>50 nm) structures are used in the preparation of new polymer catalysts, as conversion and separation materials, and to prepare carbide ceramics. Therefore, effectively controlling the pore structure of porous carbon materials is of great significance, especially for the preparation of carbide ceramics [14] Hucke [15] obtained a full-carbon porous prefab by pyrolyzing a polymer, and this prefab was reacted with molten silicon to obtain dense silicon carbide ceramics. This process can be extended to the joining of SiC ceramic with large size and complex shape [16,17]. By coating a layer of carbon containing porous preform on the surface of the parts to be joint, liquid silicon infiltrates the porous medium and reacts with carbon at high temperature, a SiC interlayer with near net size and high density can be obtained, which has great application potential. In this process, the pore structure of the porous carbon had a significant influence on the Si penetration process. Therefore, accurately controlling the pore structure of porous carbon materials is crucial for their successful application.
Currently, many methods have been used to prepare macroporous carbon materials, such as hard/soft template [18], activation [19], and polymerization-induced phase separation (PIPS) [20] methods. For instance, taking 100 nm-sized polystyrene nano-beads and polyvinylpyrrolidone as precursors, macroporous carbon microspheres (with macropore sizes of 50 to 90 nm) were obtained through a single-pot spray pyrolysis method [21].Silica spheres (about 180 nm) self-assembled into a polyacrylonitrile polymer shell, and the electrospinning-assisted hard template method was used to prepare mutually joining ordered macroporous hollow carbon nanofibers [22]. PIPS has many advantages compared to other methods, such as low manufacturing cost, simple process flow, and easy industrialization. Wang et al. [23] systematically studied the influence of process parameters on the use of a sterol resin to prepare a porous carbon pore structure. Xu et al. [20] reported that the control of the porous carbon pore structure was mainly related to the polymerization process of organic resins. Zhang Y. [24] and Yuan Z. [25,26] studied the influence of resin system composition and curing agent content on porous carbon pore structures by changing the mass ratio of furfuryl alcohol resin (FA) to phenolic resin (PF). When preparing porous carbon based on the PIPS method, the key to regulating the pore structure lies in the separation of the resin phase and the solvent phase. Some scholars have reported that divalent metal salts can effectively increase the degree of polymerization of phenolic resin [27], which is beneficial to phase separation. In our previous work [28], FeCl2 was added to a phenolic resin (PF) by the PIPS method to obtain a layered porous carbon material with meso-macro porous. The addition of FeCl2 changed the polymerization dynamics of the resin-solvent mixture, which affected the final porous carbon. At the same time [29], the adsorption properties of the prepared porous carbon material were studied. The adsorption capacity of this material for methylene orange (MO) reached 175.91 mg·g−1, demonstrating its potential as a magnetic separation superabsorbent candidate for the removal of MO and other dyes from wastewater.
In this paper, we continued our previous work and systematically studied the influence of thermodynamic factors (such as the organic resin/solvent mass ratio and solvent type of the metal ion-resin-solvent system) on the preparation of porous carbon pore structures. The influence of the Fe ion valence state (Fe2+, Fe3+) and coexisting anion types (NO3, Cl, etc.) on the porous carbon pore structure and phase was analyzed. The apparent porosity, bulk density, average pore size, and pore size distribution of the prepared porous carbon materials were characterized. The addition of metallic salts can simply and effectively increase the pore structure after carbonization, making the infiltration of molten silicon easier. This is beneficial to the joining process of silicon carbide ceramics. This work provides theoretical guidance for fully understanding the use of metal ions to regulate porous carbon pore structures. In addition, the porous carbon material prepared in this study has realized the high reliable connection of 135 mm × 205 mm large-scale SiC ceramic heat exchange components with complex pore structure.

2. Experimental Procedure

2.1. Materials

Phenol-formaldehyde resin (PF, industrial level, 99%) was purchased from FCP 15C, SIKA Tech, Lillesand, Norway. Ethyl alcohol (EG, ≥99%), diethylene glycol (DEG, ≥99%), triethylene glycol (TEG, ≥99%), polyethylene glycol 200 (PEG200, ≥99%), and polyethylene glycol 400 (PEG400, ≥99%) were purchased from Aladdin Chemistry Co., Ltd., Shanghai, China. Ferrous chloride (FeCl2, ≥99%), iron chloride (FeCl3, ≥99%), ferric nitrate (Fe(NO3)3, ≥99%), and ferrocene (C10H10Fe, ≥99%) were purchased from Sinopharm Chemical Reagent Co., Ltd., (Shanghai, China). The specimens for joining were SiC ceramics which were prepared by ourselves, which the 3-point flexure strength is over 400 MPa.

2.2. Porous Carbon Material Synthesis

The PF, organic solvent (one of EG, DEG, TEG, PEG200, PEG400), and corresponding metal salt (one of FeCl2, FeCl3, Fe(NO3)3, C10H10Fe) were mixed in a beaker and magnetically stirred for 30 min to ensure even mixing. The mixed solution was transferred into the crucible mold and subsequently placed in an oven for heating at 90 °C for 6 h. The temperature was then increased to 200 °C and maintained for 8 h. Finally, the crucible was removed and placed in a graphite furnace under the protection of an argon atmosphere and heated to 900 °C at a heating rate of 2 °C/min. The crucible was held at this temperature for 1 h and then cooled to room temperature to obtain the porous carbon material. In this work, variable parameters were employed as sample identifiers. Solvent variables were designated using the chemical abbreviations of the respective solvents (e.g., the ethylene glycol system is denoted as EG). The resin/solvent composition ratio was indicated by the mass ratio of resin to solvent (e.g., the PF/EG system with a ratio of 2:1 is labeled as 2:1). Samples containing metal salts were identified using the chemical formula of the corresponding salt (e.g., the FeCl3 system is marked as FeCl3). The blank control sample was designated as no–Fe.

2.3. Experimental Methods for Joining

In this work, the silicon carbide parts need to be ultrasonically cleaned in ethanol for 20 min before joining. The prepared resin based solution was coated between two silicon carbide ceramic parts to be connected, which were cured at 90–200 °C, pyrolyzed and carbonized at 900 °C, and infiltrated with molten silicon at 1600 °C after pickling, respectively, to realize the silicon carbide ceramic connection process.

2.4. Characterization

The phase compositions of the porous carbon samples were qualitatively or semi-quantitatively analyzed with an X-ray diffractometer (XRD, D/Max-2250V, Rigaku, Tokyo, Japan). The pore structures of the porous carbon samples were measured with a fully automatic mercury porosimeter (AutoPoreIV 9510, Norcross, GA, USA) to characterize their apparent porosity, bulk density, average pore size, and pore size distribution. Nitrogen adsorption-desorption experiments were performed with a fully automatic specific surface area and microporous pore analyzer (ASAP2020HD88, Norcross, GA, USA) to characterize the pore characteristics of the porous carbon samples. The weight and volume changes of the samples after curing and pyrolysis were evaluated by measuring the weight and volume of the cured body and the carbonized product. Fourier transform infrared spectroscopy (FT-IR) was performed on the cured body of the resin-solvent system with a Fourier transform infrared spectrometer (NICOLET Is10, Waltham, MA, USA). Sample microstructures were analyzed using a field emission scanning electron microscope (FE-SEM; SU-8220, Hitachi, Tokyo, Japan) equipped with an energy-dispersive X-ray spectrometer (EDS). A laser confocal Raman spectrometer (inVia, Renishaw, Gloucestershire, UK) was used to qualitatively and quantitatively analyze the molecular structures of the samples. The X-ray photoelectron spectroscopy (XPS) spectra were recorded on Kratos Ultra DLD XPS Kratos. The strength of the joining specimens was tested on an Instron 5566 testing system (Instron-5566, Boston, MA, USA). The internal structure of the connecting parts is tested by X-ray Industrial CT nondestructive testing equipment (450 kV). The carbon content was measured by LECO CS600 (LECO, Mönchengladbach, Germany), the iron content was quantified by ICP-OES (SPECTRO ARCOS II, Kleve, Germany), and the oxygen content was determined by a LECO ON836 (LECO, Mönchengladbach, Germany).

3. Results and Discussion

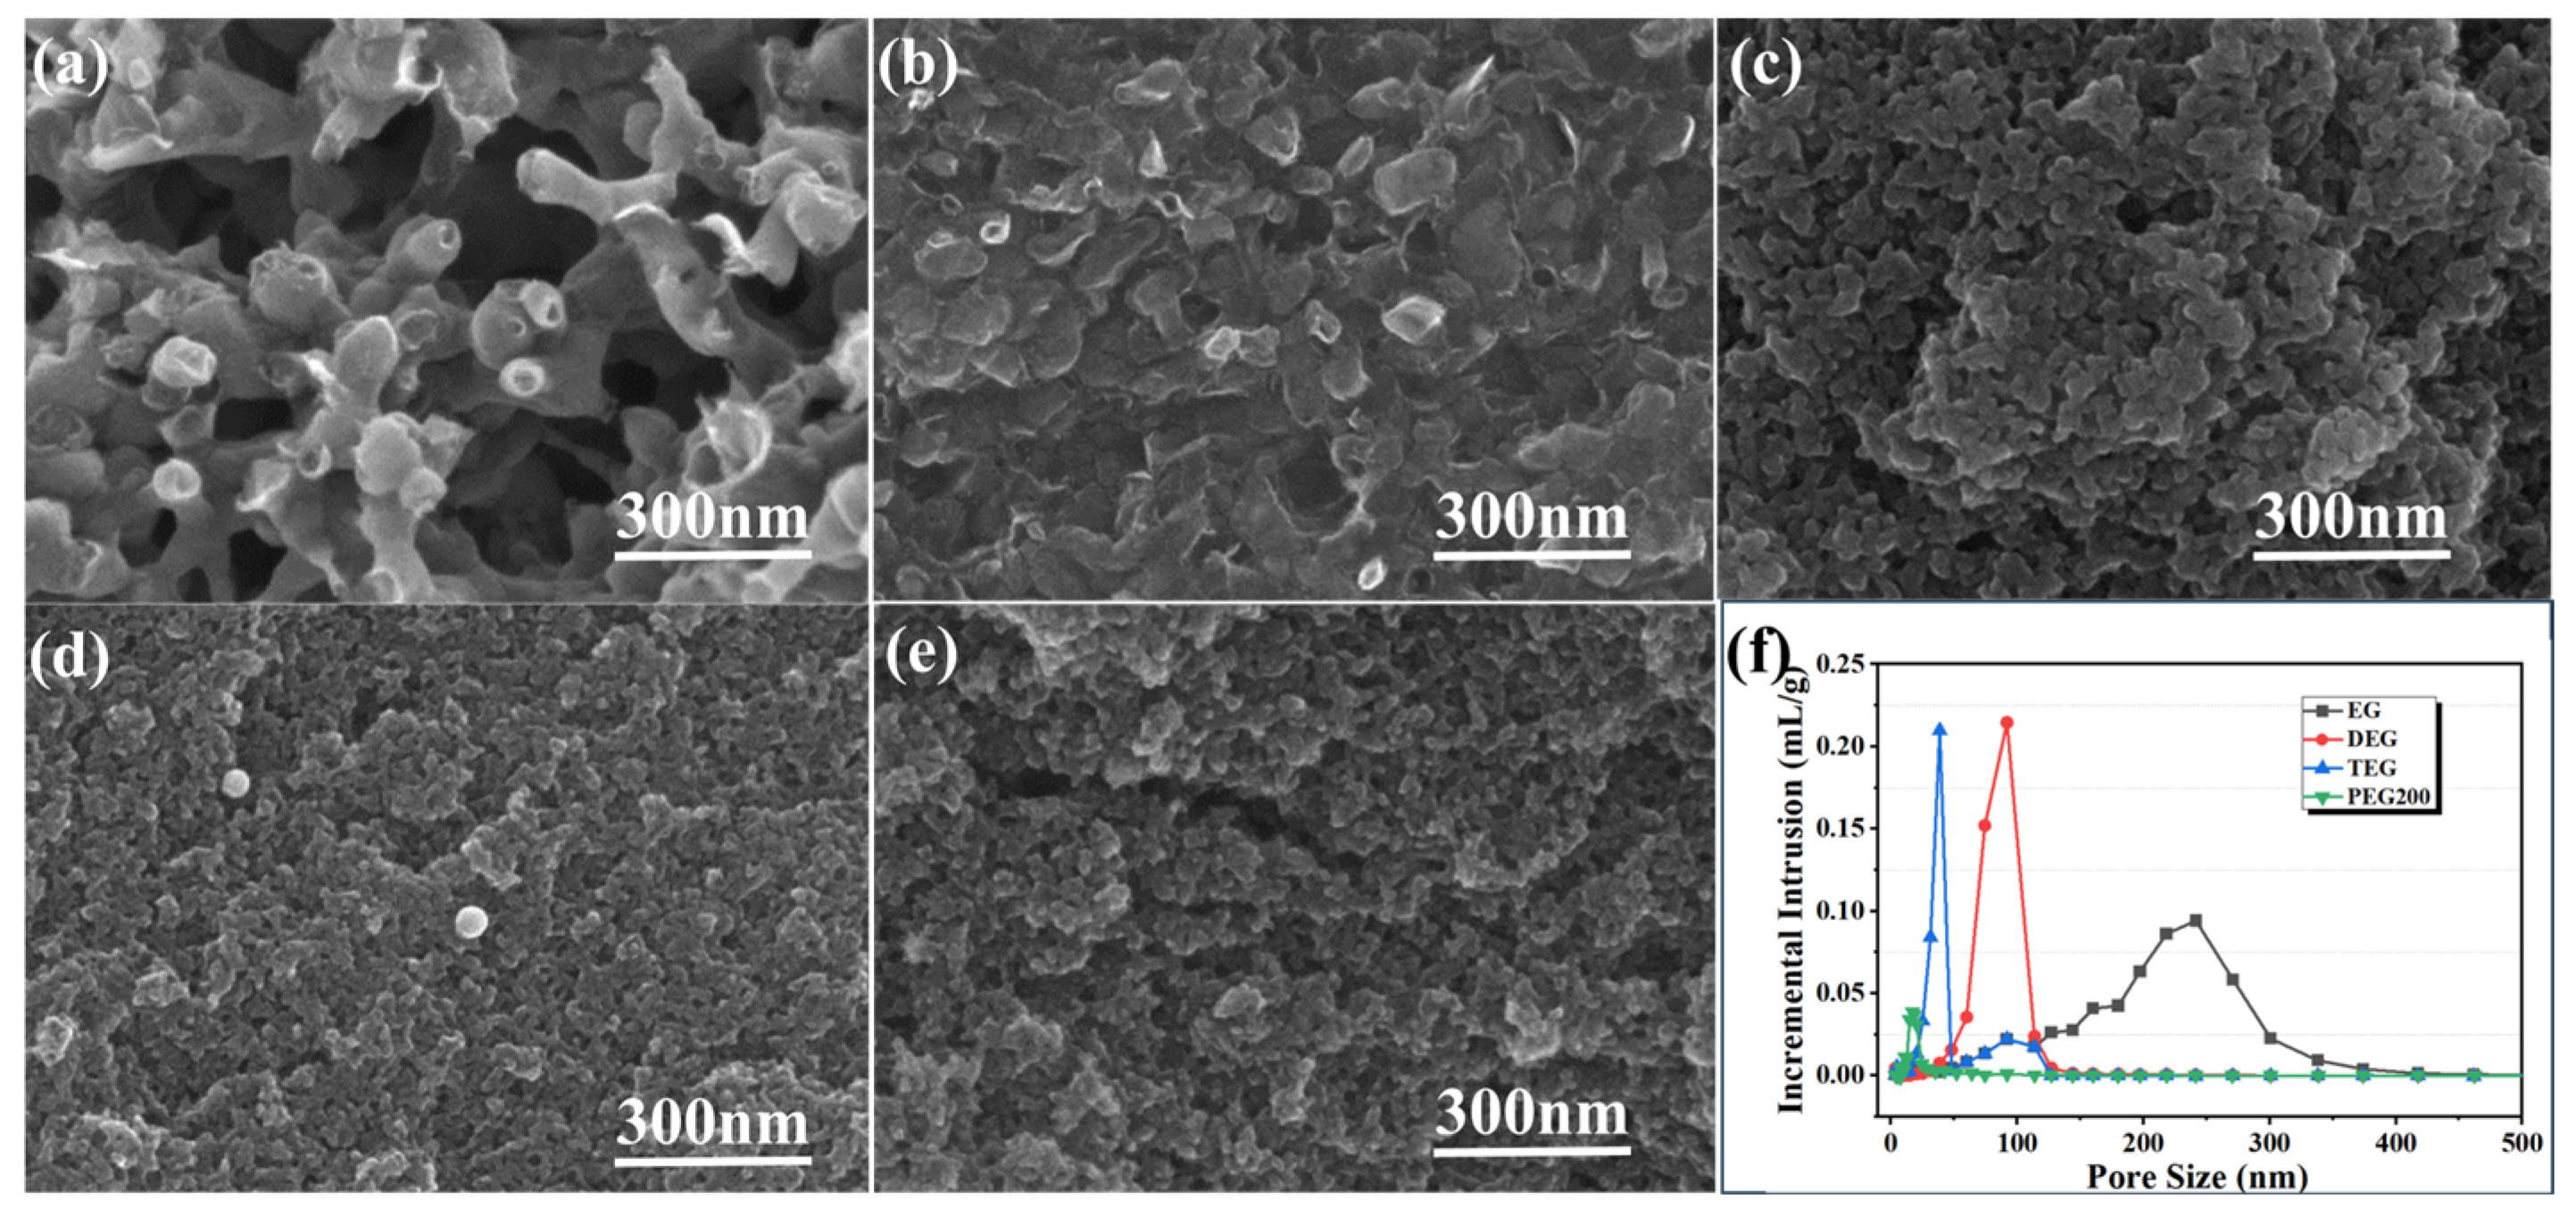
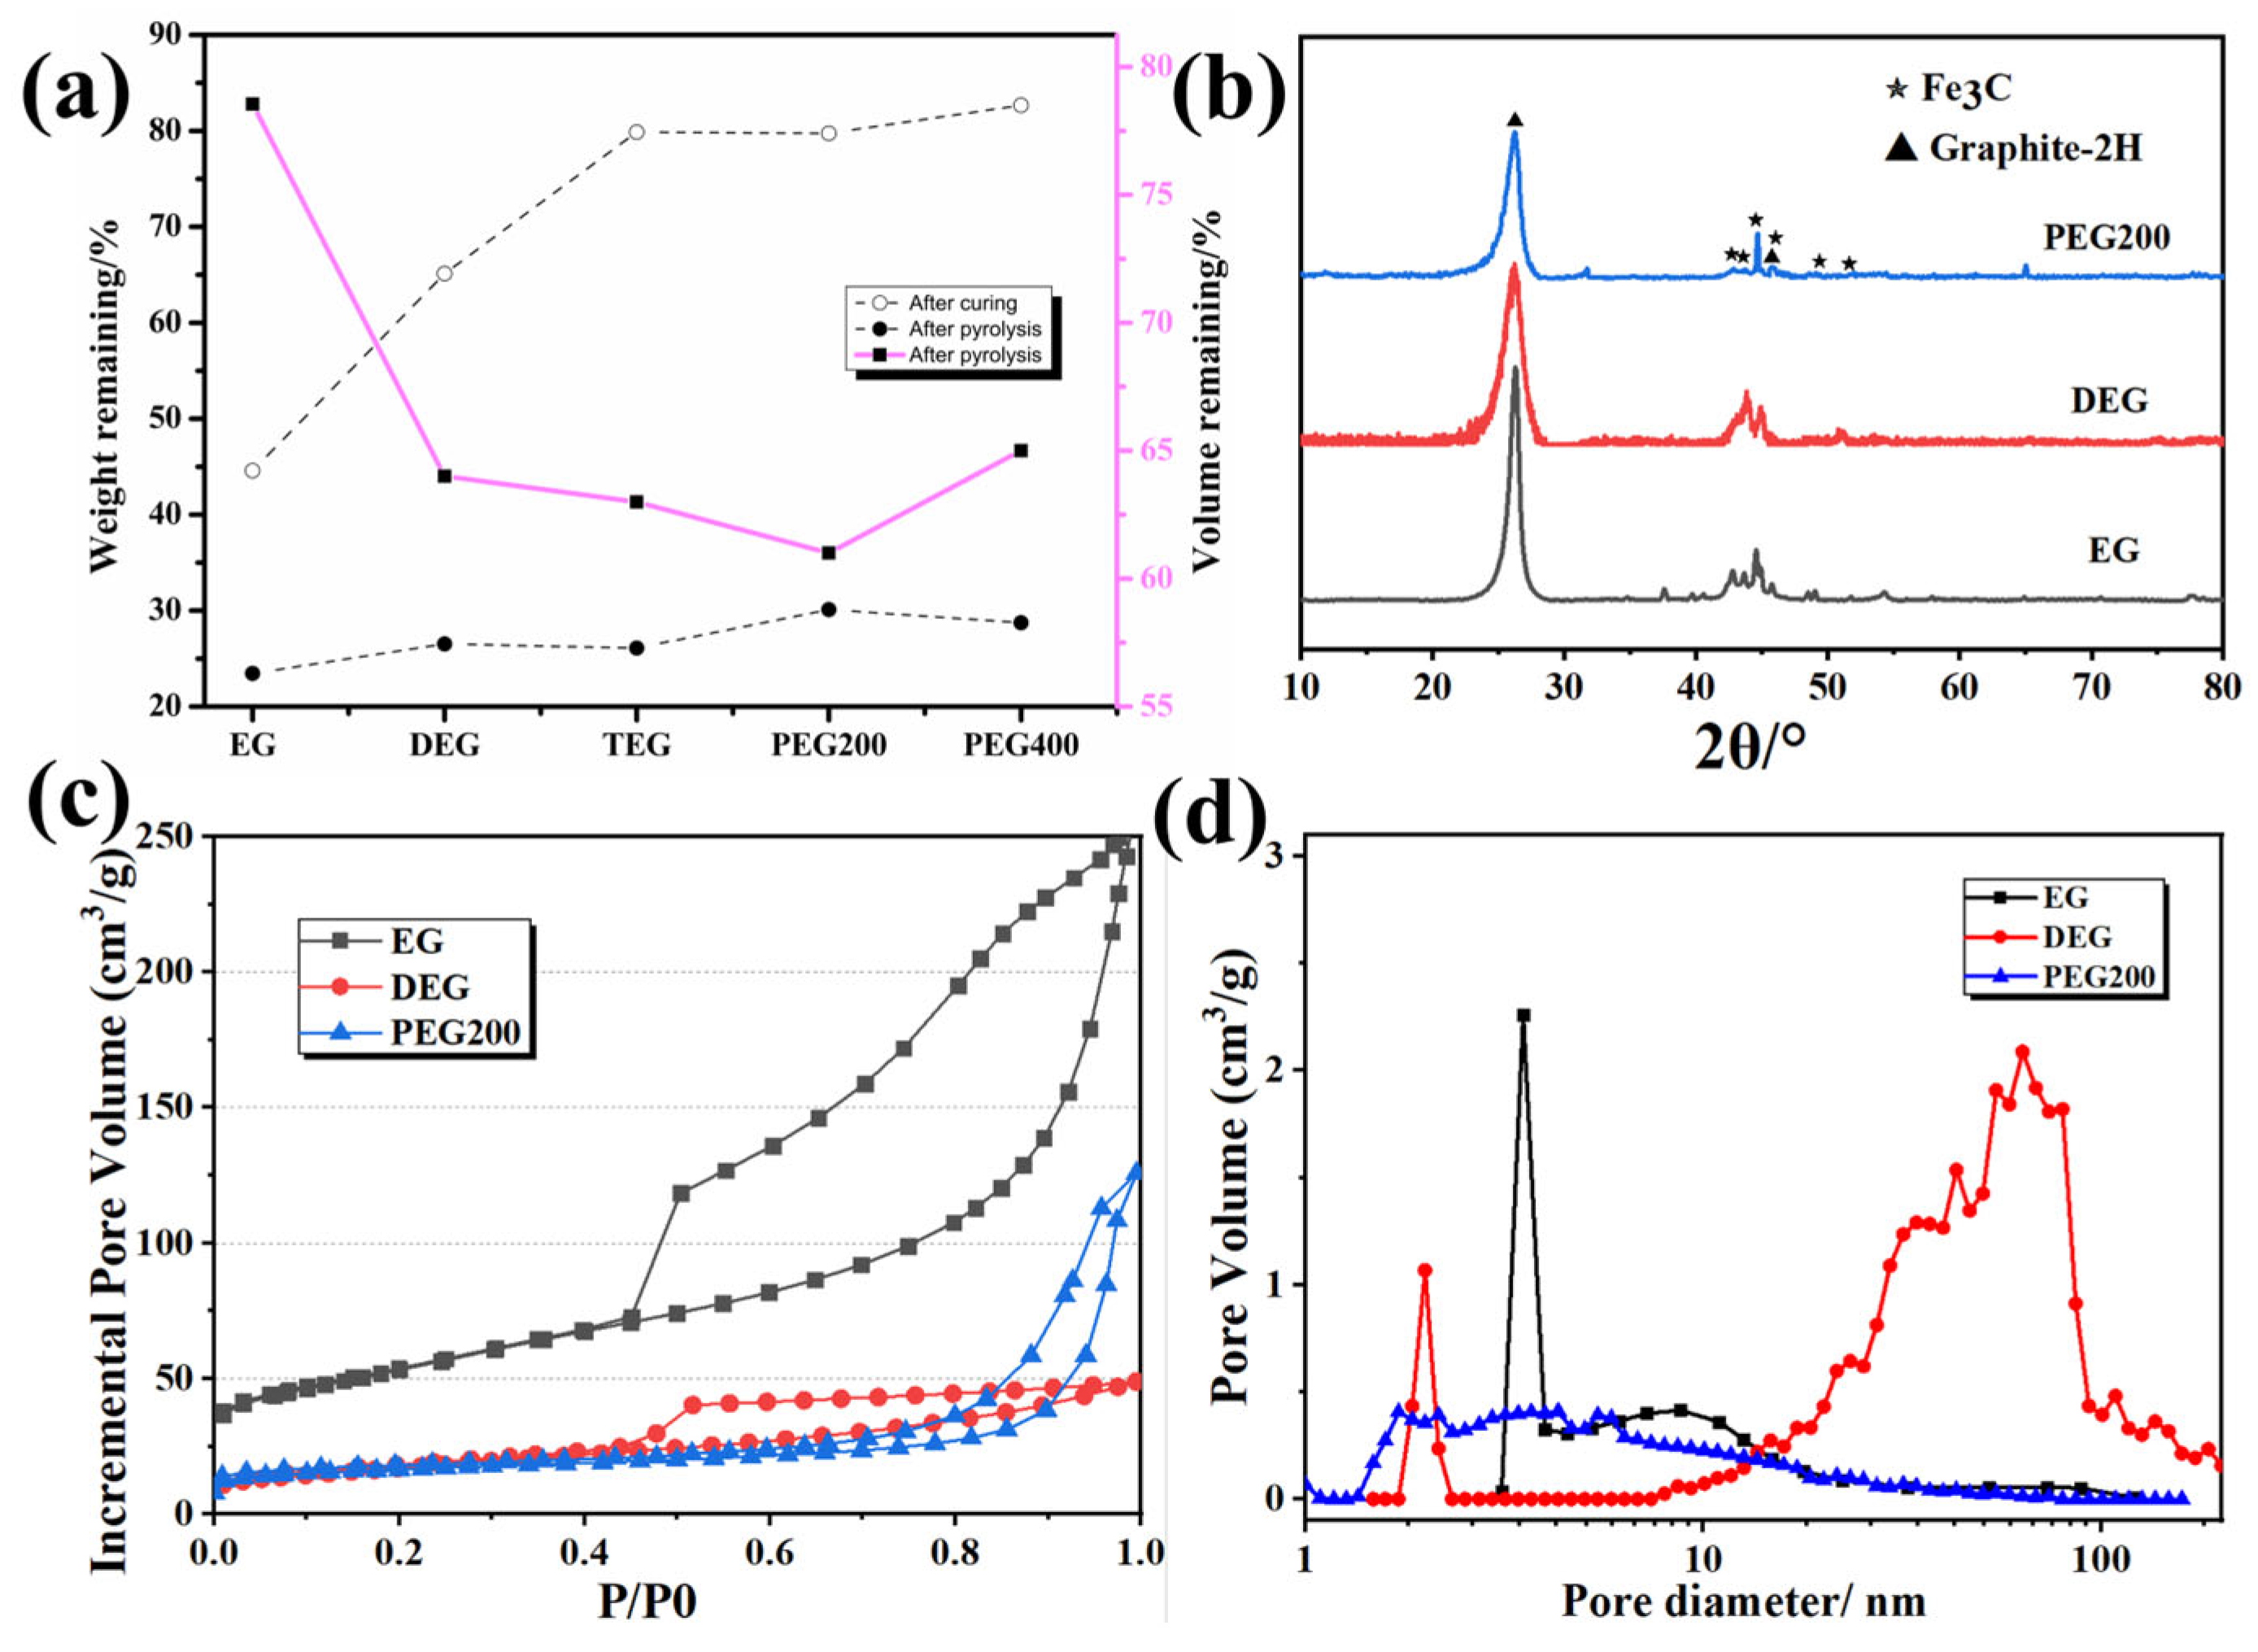
3.1. Influence of Solvent Type and Resin-Solvent Quality on Porous Carbon Pore Structure

Five organic solvents with different viscosities and molecular weights were selected to study the effects of organic solvent type on the porous carbon pore structure. Varying the solvent changed the viscosity of the resin-solvent system, affecting the thermodynamics of phase separation and regulating the pore structure. Table 1 lists the basic properties of the chosen solvents as well as the bulk density and apparent porosity of the porous carbon after carbonization. As the molecular weight of the solvent increased, the porosity gradually decreased and the bulk density gradually increased.
SEM micrographs of the porous carbon samples obtained after the high-temperature carbonization of the resin-solvent systems prepared with different solvents are shown in Figure 1. The porous carbon materials exhibited continuous three-dimensional pore networks. The formation of these bi-continuous network structures can be explained by phase separation theory. The phase separation process of the phenolic resin-solvent system was carried out in accordance with the spinodal decomposition (SD) mechanism [30]: a micro-double continuous phase existed in the initial stage of phase separation, and a double continuous phase structure was eventually formed. After pyrolysis, due to the volatilization or decomposition of the alcohol, the obtained porous carbon samples exhibited a three-dimensional connected network-like structure. As the molecular weight of the solvent increased, the porosity gradually decreased, which was consistent with the measured porosity results shown in Table 1. This was because solvents with higher molecular weights increased the viscosity of the resin-alcohol system. Higher viscosity meant that it was more difficult for molecules to move during the reactive molecular phase separation process, reducing the rate of phase separation. After pyrolysis, the porosity of the porous carbon samples decreased and the pore size decreased. The pore size distribution of samples prepared in different solvents was characterized using the mercury porosimetry method (Figure 1f). The results indicated that the pore size progressively decreased with increasing solvent viscosity and molecular weight, which is in good agreement with the SEM observations. In addition to solvent viscosity and molecular weight, solvent polarity also plays a critical role in determining the state of monomers and products within the system, thereby influencing the polymerization process [31]. Higher solvent polarity enhances hydrogen bonding capabilities by enabling stronger hydrogen bonds with polar solutes, improving the solubility of resin monomers in the solvent, and facilitating the formation of homogeneous resin-solvent-metal salt systems. During resin gel polymerization, high-polarity solvents can retard the gelation process, extend the phase separation time window, allow for more extensive phase domain growth, and ultimately result in porous structures with larger pore diameters following high-temperature in-situ carbonization.
The changes in the remaining mass and volume of the resin-solvent solutions prepared using different types of solvents after curing and pyrolysis are shown in Figure 2. As the molecular weight and viscosity of the solvent increased, less mass was lost during the curing process. This was because the dispersed ethylene glycol-rich phase formed during the phase separation process increased. With increasing molecular weight, volume shrinkage became more severe after carbonization, which resulted in a lower porosity and smaller pore size. The crystal structure of the porous carbon materials after carbonization was characterized by XRD. As shown in Figure 2b, a sharp diffraction peak at 27.3° corresponds to the (002) plane of graphite carbon, while the prominent peaks at 37.6°, 43.7°, and 54.4° are attributed to the (210), (102), and (230) planes of orthorhombic Fe3C [32]. These results confirm the coexistence of graphite carbon and orthorhombic Fe3C in the porous carbon material. The peak positions and peak shapes of the porous carbons prepared by different solvents are consistent, suggesting that the type of solvent has no significant effect on the phase composition of the porous carbon. Figure 2c displays the nitrogen adsorption isotherms of different solvent samples, all of which exhibit behaviors characteristic of type IV curves with H4-type hysteresis loops. The specific surface areas of EG, DEG, and PEG200, as determined by the Brunauer-Emmett-Teller (BET) method, are 188, 61, and 54 m2·g−1, respectively. As the molecular weight of the solvent increases, the specific surface area decreases gradually, likely due to a reduction in porosity. The mesopore size distribution is illustrated in Figure 2d, with pore diameters predominantly ranging from 2–4 nm. The formation of mesopores is primarily attributed to the Fe-catalyzed C–H2O reaction [29].
Based on the obtained results on the effect of solvent type, ethylene glycol was selected as the organic solvent to study the influence of PF/EG quality on the porous carbon pore structure. The microstructures of carbonized products prepared from resin mixtures with different PF/EG mass ratios were evaluated by SEM, as shown in Figure 3. Changing the PF/EG mass ratio significantly affected the pore structures of the porous carbon samples. With increasing PF/EG mass ratio (that is, with increasing ethylene glycol content in the resin-solvent system), smaller pores were formed and the carbon skeleton became finer. When the PF/EG mass ratio was >1 (ratio of 7:3, as shown in Figure 3a), the ethylene glycol content was lower than the resin content. At this ratio, the porous carbon structure was mainly based on the carbon matrix, and the pores tended to be isolated. This showed that with a small amount of ethylene glycol, the solvent-rich phase formed after the resin-solvent system phase separation process did not exist as a continuous phase. As the PF/EG mass ratio further decreased (ratios of 5:5 and 1:2, as shown in Figure 3b,c), the carbon matrix skeleton became thinner. This was because the larger amount of ethylene glycol meant it was easier for the solvent-rich phase to form a continuous phase, enabling the formation of a double continuous network pore structure after pyrolysis. However, when the ethylene glycol content was too high (ratio of 2:8, as shown in Figure 3d), carbon skeleton formation was not possible, causing the sample to shatter after pyrolysis.
The apparent porosities and bulk densities of the carbonized products prepared from resin mixtures with different PF/EG mass ratios are listed in Table 2. With increasing ethylene glycol content, the porosity significantly increased, the bulk density gradually decreased, and the residual carbon rate gradually decreased. This was because as the amount of ethylene glycol increased, more substances decomposed and volatilized during pyrolysis, resulting in larger pores and a smaller residual mass.
The changes in the remaining mass and volume of porous carbon samples prepared using resin-solvent solutions with different PF/EG mass ratios after curing and pyrolysis (Figure 4). With increasing ethylene glycol content, the quality loss during the curing process gradually increased. After curing and carbonization treatment, the remaining quality (residual carbon rate) gradually decreased with increasing ethylene glycol content. This trend was consistent with the results shown in Figure 3 and Table 2.
The Raman spectra of the three porous carbon samples are shown in Figure 4b. The intensity ratio (Ig/Id) of the D-peak and G-peak is commonly used to characterize the degree of graphitization of carbon materials [33], and a greater Ig/Id ratio indicates a higher graphitization degree. The results indicated that as the resin/solvent ratio decreased, the degree of graphitization increased. This could be attributed to the reduced residual carbon mass, which enhances the effective concentration of metal salt catalysts. Metal salts are known to facilitate the graphitization of carbon. The XRD results (Figure 4c) indicated that the primary crystal structures in the porous carbon were graphite carbon and Fe3C. As the resin-to-solvent mass ratio increases, the intensity of the diffraction peaks became stronger while the full width at half maximum (FWHM) decreases, suggesting an enhancement in crystallinity. This observation was consistent with the Raman spectroscopy results. The mesopore size distribution of the 5:5 and 1:2 samples is illustrated in Figure 2d, with pore diameters predominantly ranging from 2 to 4 nm. The formation of these mesopores is primarily attributed to the iron-catalyzed C–H2O reaction. According to SEM observations, the dominant pore structures of the 5:5 and 1:2 samples are in the macropore range. For the 7:3 sample, the mesopore size distribution spans two ranges: 2–4 nm and 20–40 nm. The formation of pores in the 20–40 nm range is ascribed to the low solvent content, which induces polymerization-driven phase separation and the development of smaller solvent-rich domains. These domains eventually lead to the formation of a finer pore structure after carbonization.

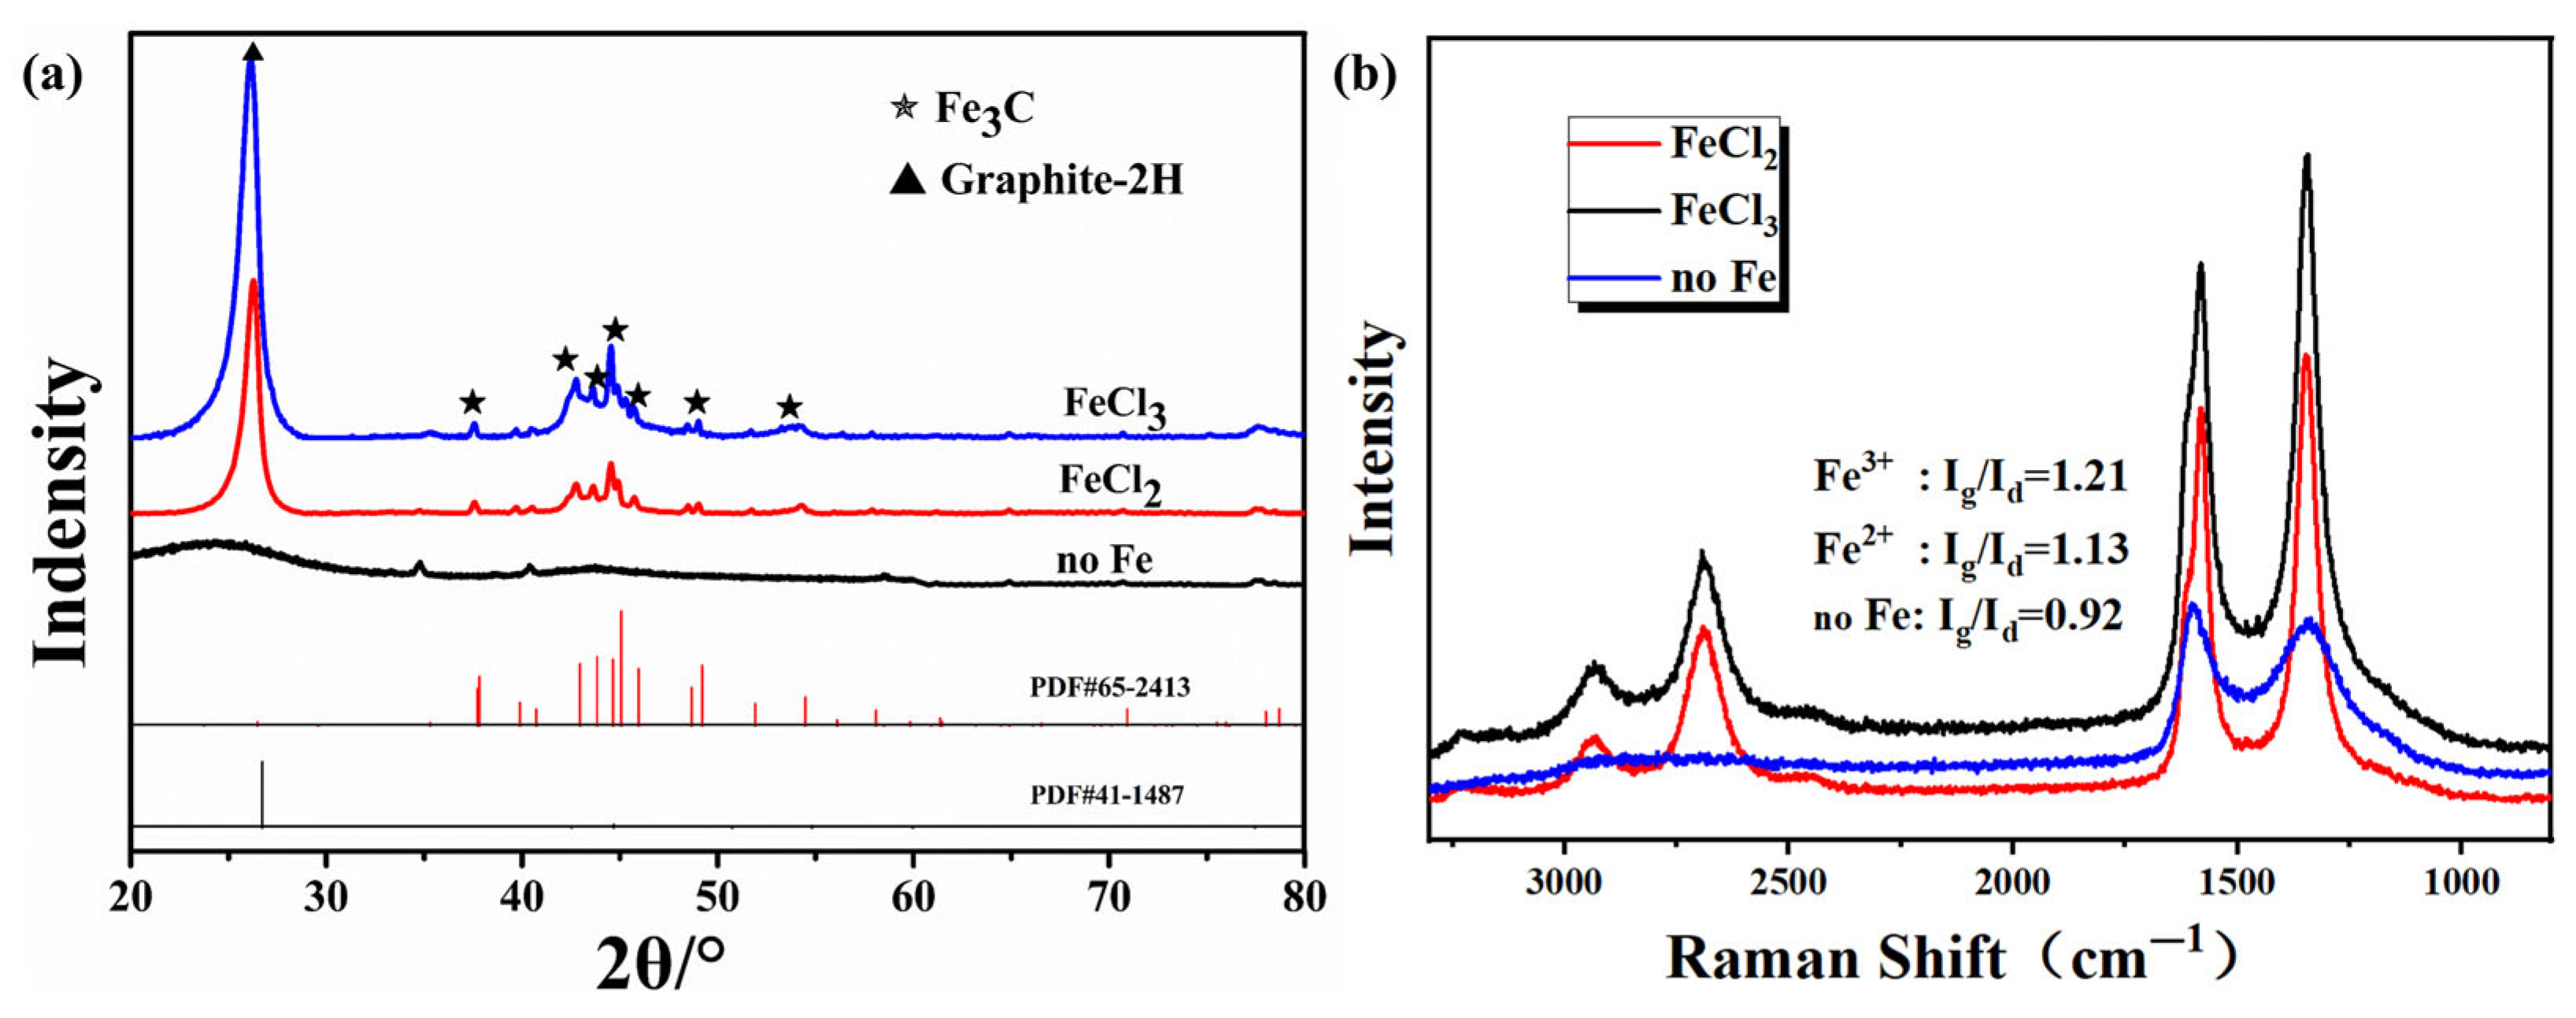
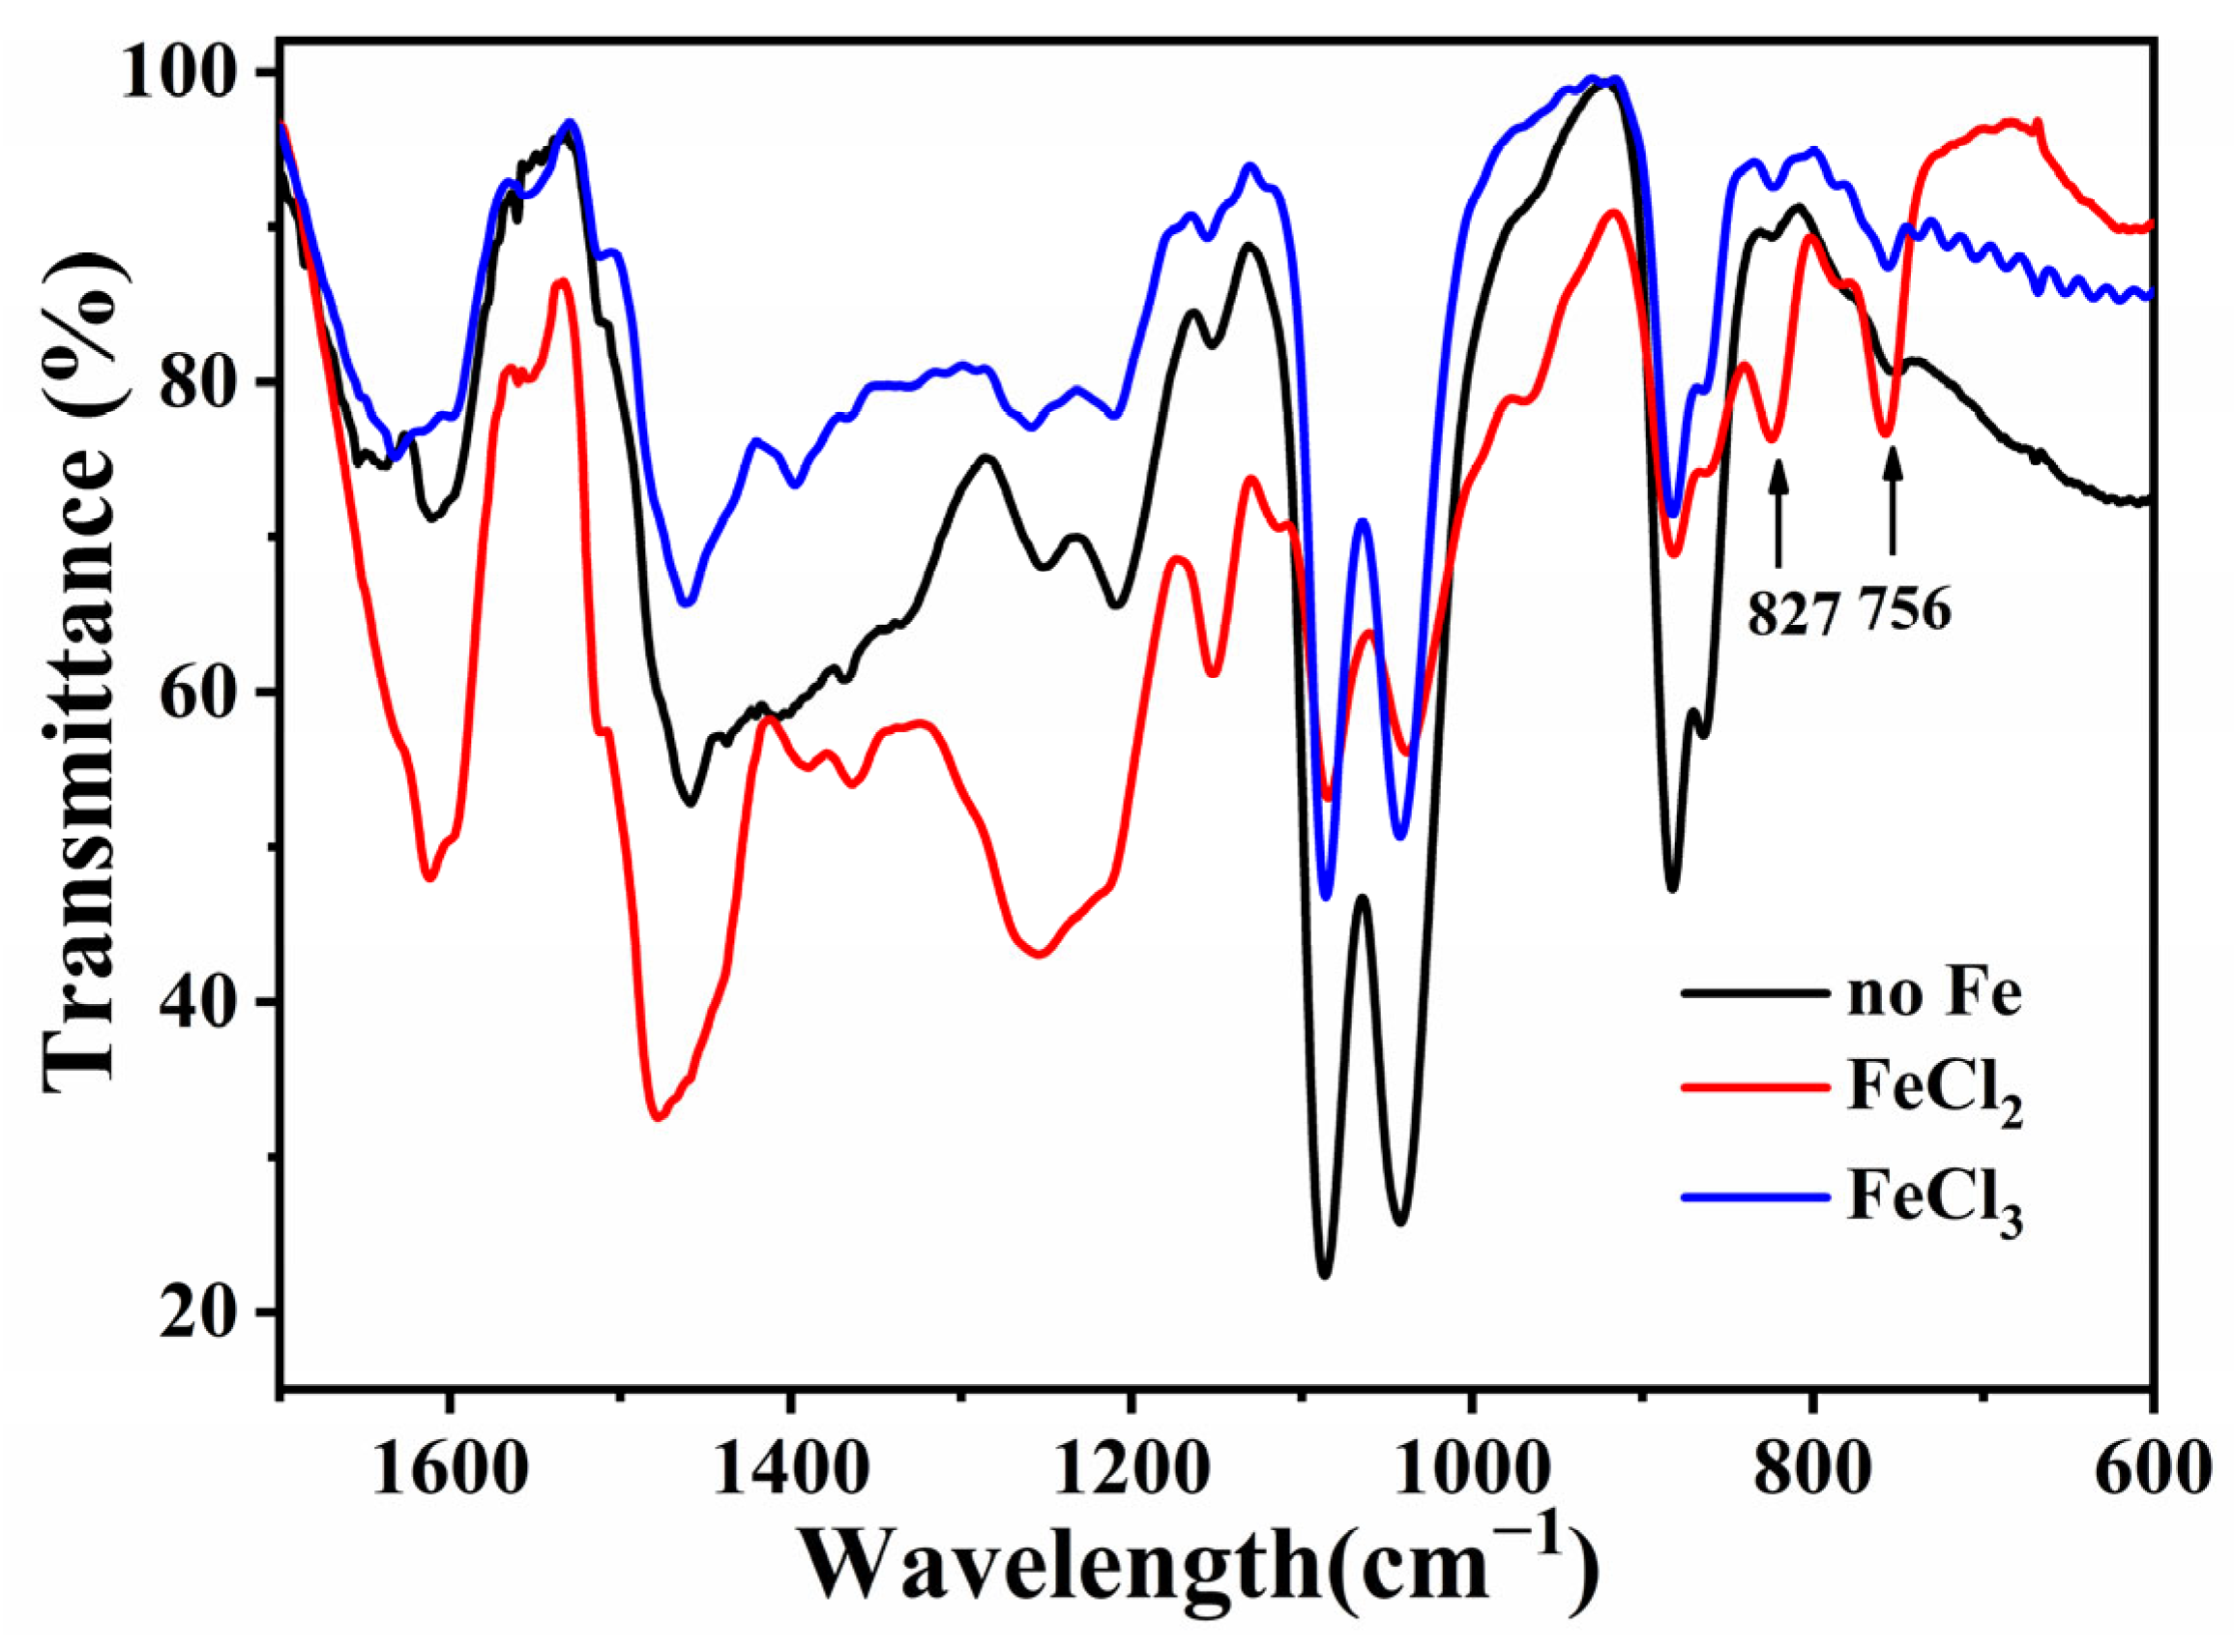
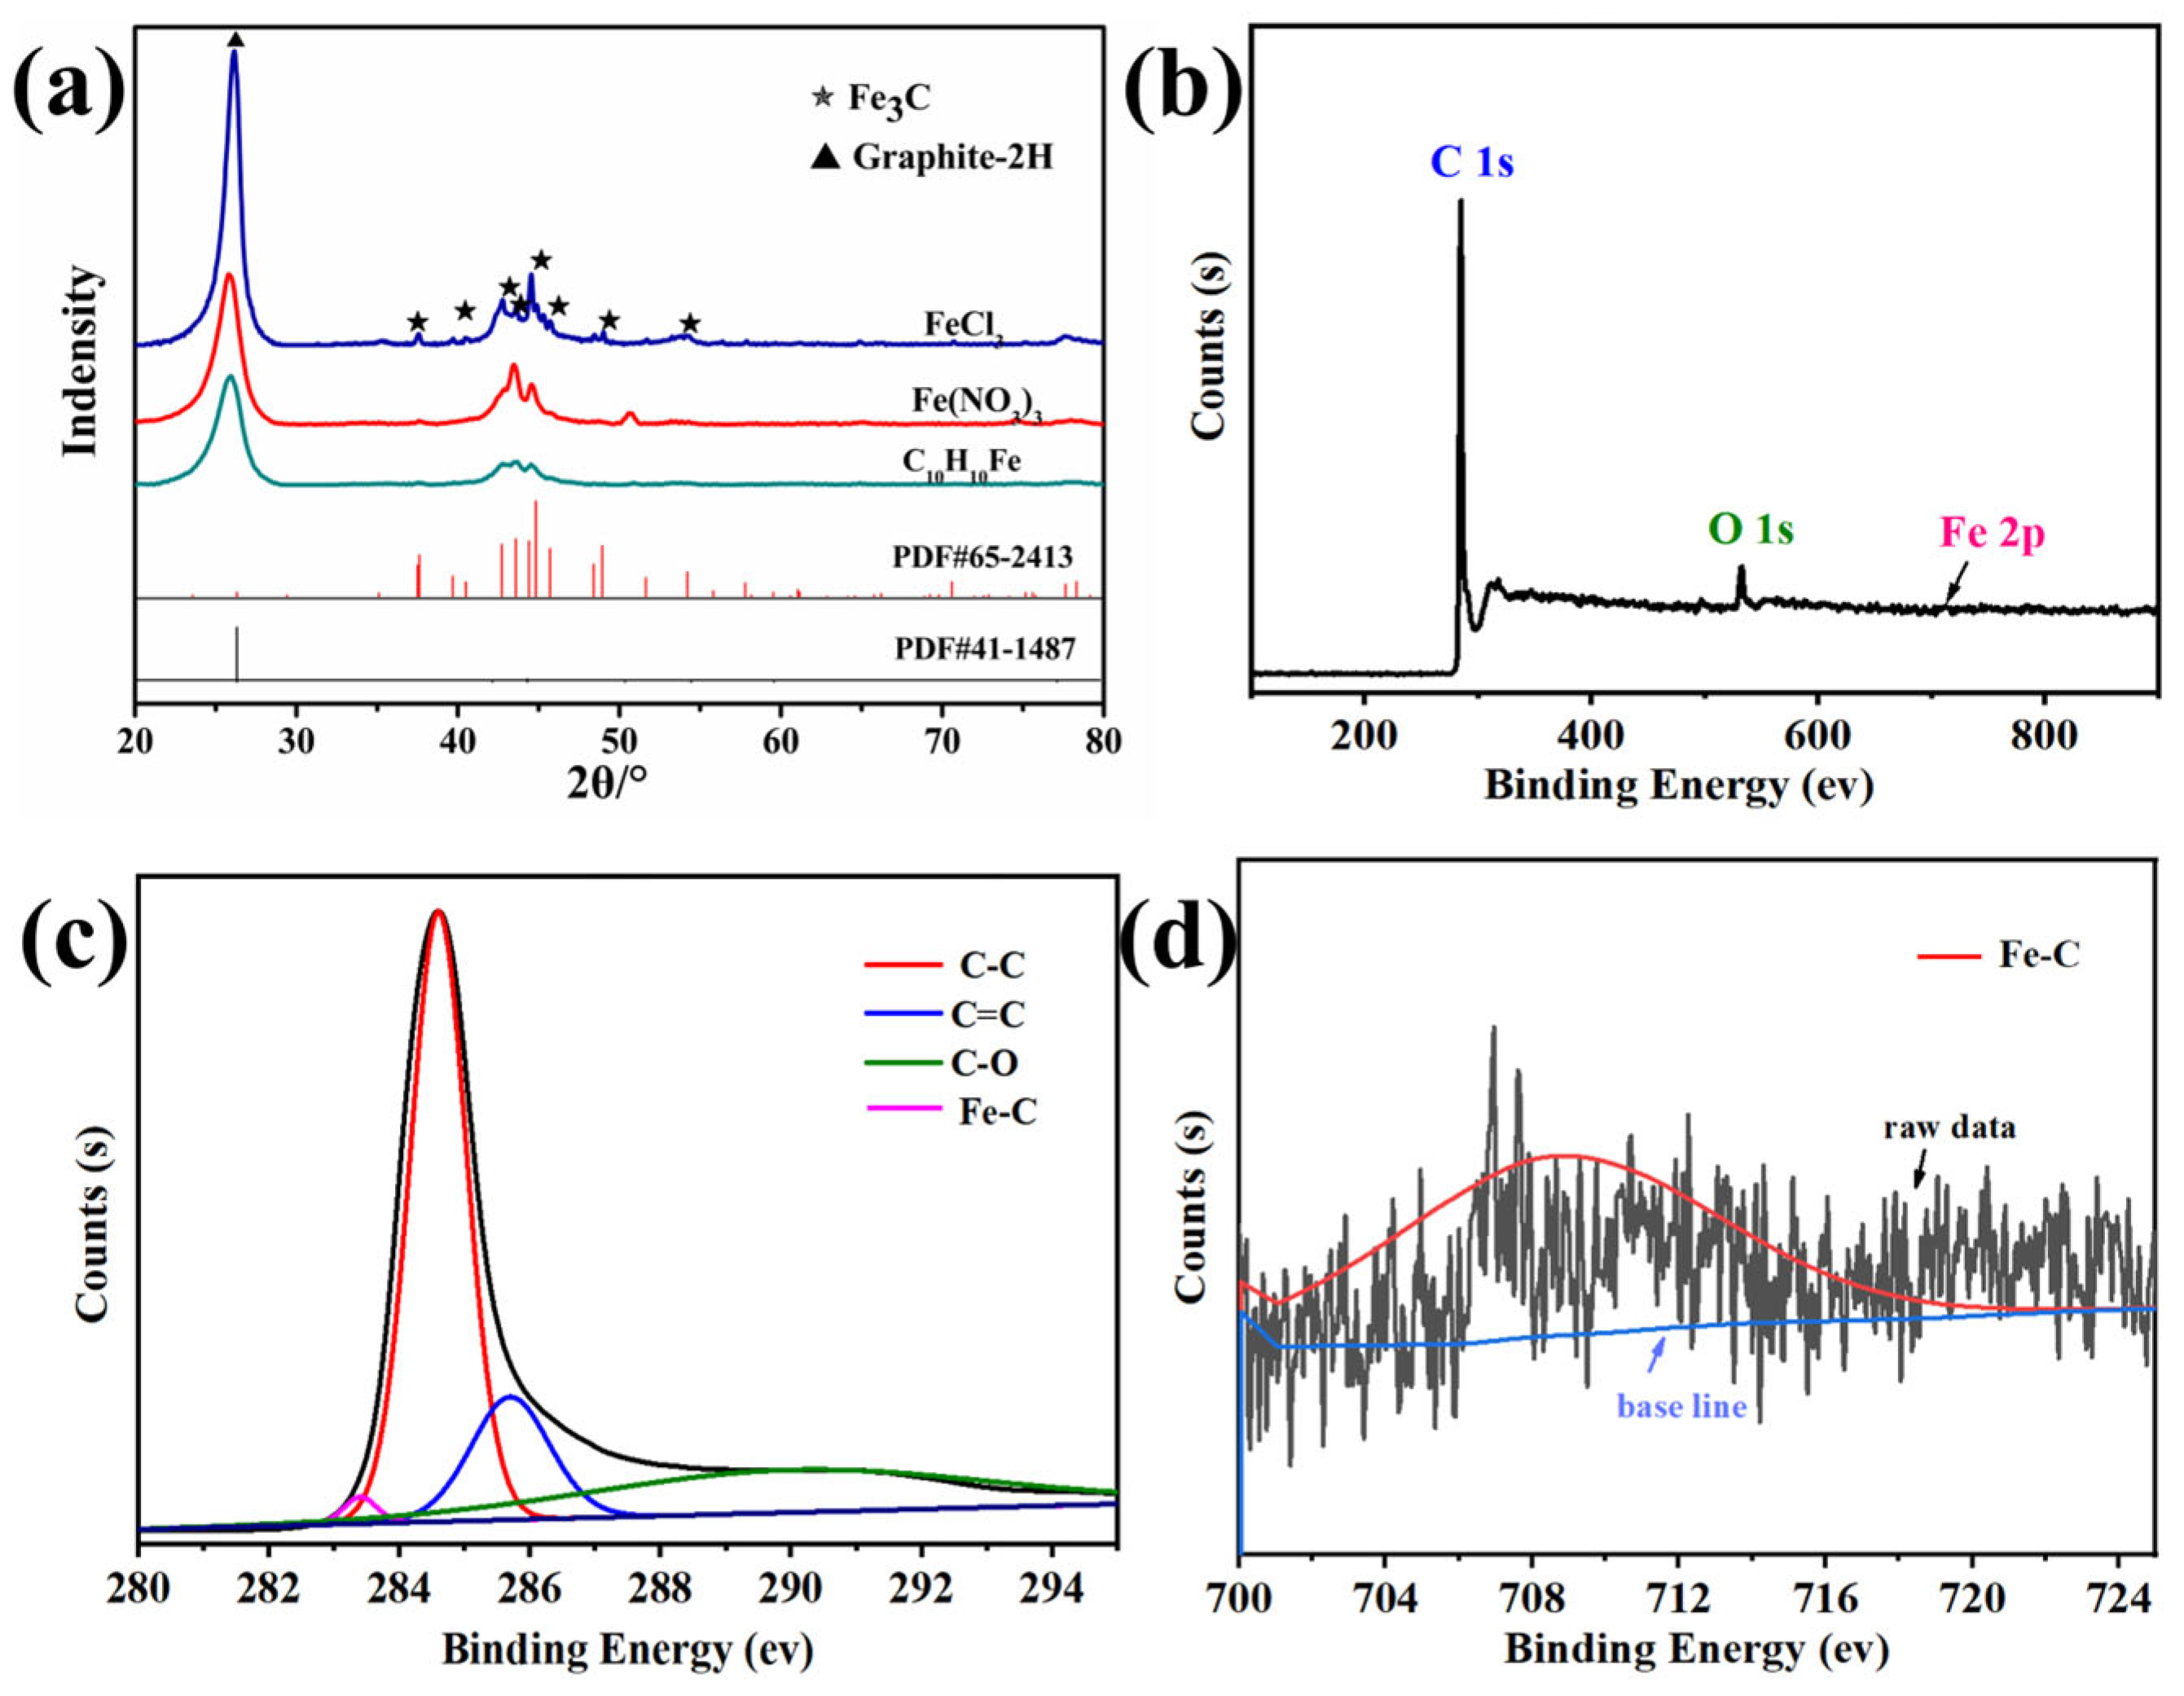
3.2. Influence of Fe Ion Valence State on Pore Structure

The microstructures of the porous carbon samples obtained after carbonization of three resin mixtures prepared without the addition of metal ions (no Fe), with FeCl2, and with FeCl3 are shown in Figure 5. After adding FeCl2 and FeCl3 to the resin-solvent system, a three-dimensional connected pore structure was obtained after carbonization. Moreover, the pore size was significantly enhanced compared with the sample prepared without the addition of metal ions. Compared with the addition of FeCl2, the pores of the porous carbon sample prepared with FeCl3 were larger in size and were more widely distributed. However, the sample prepared using FeCl3 had a less uniform pore structure.
The specific structural parameters of the porous carbon samples prepared using no Fe, FeCl2, and FeCl3 were analyzed, as shown in Table 3. Compared with the sample prepared without using Fe, the porosity and average pore size were significantly increased by the addition of Fe ions, while the bulk density was greatly reduced. Therefore, the addition of metal ions was conducive to pore formation [34]. When FeCl2 was added, the average pore size of the resulting porous carbon was 190 ± 15 nm, the apparent porosity was 63.3 ± 1.7%, and the bulk density was 0.73 g·cm−3. In contrast, the porous carbon sample prepared with Fe3+ had a slightly larger average pore size of 248 ± 29 nm, a lower apparent porosity of 50.9 ± 1.3%, and a higher bulk density of 0.95 g·cm−3.
The pore size distributions of the samples were evaluated with mercury porosimetry, as shown in Figure 6a. The porous carbon obtained using FeCl2 had a pore size distribution of 150~300 nm. The sample prepared with Fe3+ had a wider pore size distribution of 120~400 nm, which was consistent with the SEM images shown in Figure 5. Mercury porosimetry is mainly used to evaluate pores with diameters >50 nm. Therefore, nitrogen adsorption-desorption tests were used to analyze the micro-mesoporous structures of the porous carbon materials, as shown in Figure 6b,c. The porous carbon prepared without Fe had a 10~30 nm pore size distribution. The porous carbon samples prepared using FeCl2 and FeCl3 both showed pores concentrated around 3.5 nm. However, the sample prepared with FeCl2 had a broader mesoporous pore size distribution of 4~20 nm, while the pore size distribution of the sample prepared with FeCl3 was much narrower. The FeCl3 has a higher Lewis acidity than FeCl2 and has the coordination ability with the oxygen-containing functional groups of carbon precursors. In the Fe3⁺ system, the metal-organic complex formed by strong coordination can induce a more stable double continuous phase structure, and a wider distribution pore structure network is formed after carbonization. As shown in Figure 6c, the adsorption-desorption isotherms of the samples of no Fe, FeCl2, and FeCl3 fit the type IV adsorption isotherms, because the adsorption isotherms at higher relative pressures P/P0 (0.7 < P/P0 < 1.0) showed clear hysteresis loop, which is also typical of the adsorption isotherm of mesoporous structure.
The XRD patterns of the porous carbon samples (no Fe, FeCl2, and FeCl3) are shown in Figure 7a. The diffraction pattern of the porous carbon (no Fe) only showed a gentle amorphous peak at about 23°, indicating that an amorphous carbon structure was obtained. The FeCl2 sample exhibits a sharp diffraction peak at 27°, corresponding to the (002) plane of graphite carbon. The prominent peaks at 37.6°, 43.7°, and 54.4° are attributed to the (210), (102), and (230) planes of orthorhombic Fe3C, respectively. After introducing FeCl3, the peak positions remain essentially unchanged compared with the FeCl2 sample, suggesting that regardless of the valence state of the added metal ions, they predominantly exist in the form of Fe3C after carbonization. Notably, compared with the FeCl2 sample, the FeCl3 sample demonstrates a significantly enhanced intensity of the graphite peak and a reduced full width at half maximum (FWHM), indicating an improvement in the degree of graphitization. The graphitization process of carbon materials is significantly influenced by the catalytic effect of metal ions, the essence of which lies in the directional induction ability of transition metal ions on the reconstruction of the sp2 hybridization network during the pyrolysis of the carbon matrix. Fe3⁺ has a higher charge density compared to Fe2⁺, and this characteristic enhances its coordination with the oxygen-containing functional groups of the carbon precursor, forming a more stable metal-carbon intermediate phase during the carbonization stage. This coordination stabilization effect effectively reduces the activation energy barrier for the growth of graphite microcrystals. The Raman spectra of the three porous carbon samples are shown in Figure 7b. The porous carbon sample prepared with the addition of FeCl2 had an Ig/Id ratio of 1.13, while that of the porous carbon obtained with the addition of FeCl3 increased to 1.19. Therefore, FeCl3 was more conducive to enhancing the degree of graphitization than FeCl2, which was consistent with the XRD results.
The FT-IR spectra of the resin mixtures prepared without Fe and with the addition of FeCl2 or FeCl3 after pre-curing at 90 °C are shown in Figure 8. After adding FeCl2, the resin mixture showed strong absorption peaks at 827 and 750 cm−1. An absorption peak at 825 cm−1 corresponds to the bending vibration of the C–H bonds of 1,4-disubstituted and 1,2,4- trisubstituted benzene rings [35], indicating the existence of para-substituted phenol groups. An absorption peak at 756 cm−1 corresponds to the bending vibration of the C–H bonds of 1,2-disubstituted and 1,2,6 trisubstituted benzene rings [35], indicating the existence of ortho-substituted phenol groups. In the phenolic structure of phenolic resin, the ortho position exhibits the lowest reactivity, whereas the para position demonstrates the highest reactivity. Consequently, during the polymerization reaction involving the phenolic structure, the –CH2OH group preferentially undergoes addition at the para position, leaving the less reactive ortho position, which becomes more challenging for subsequent addition reactions. Upon introducing metal ions, their directing effect facilitates ortho substitution of the –CH2OH group, thereby preserving the highly reactive para position. This enables easier reactions with the –CH2OH group or other polymer molecules in subsequent polymerization steps, ultimately yielding a polymer product with a higher degree of polymerization. As the curing extent of the resin mixture increases, the phase separation between the resin and solvent accelerates, promoting the formation of pore structures. Unlike the resin prepared with the addition of FeCl2, the resin mixture prepared with the addition of FeCl3 did not show strong absorption peaks at 827 and 750 cm−1. Therefore, FeCl3 only acted as a catalyst during the polymerization reaction and was not involved in the formation of the polymer skeleton. This explained the lower porosity of the porous carbon sample prepared with FeCl3 compared with that of the sample prepared with FeCl2.

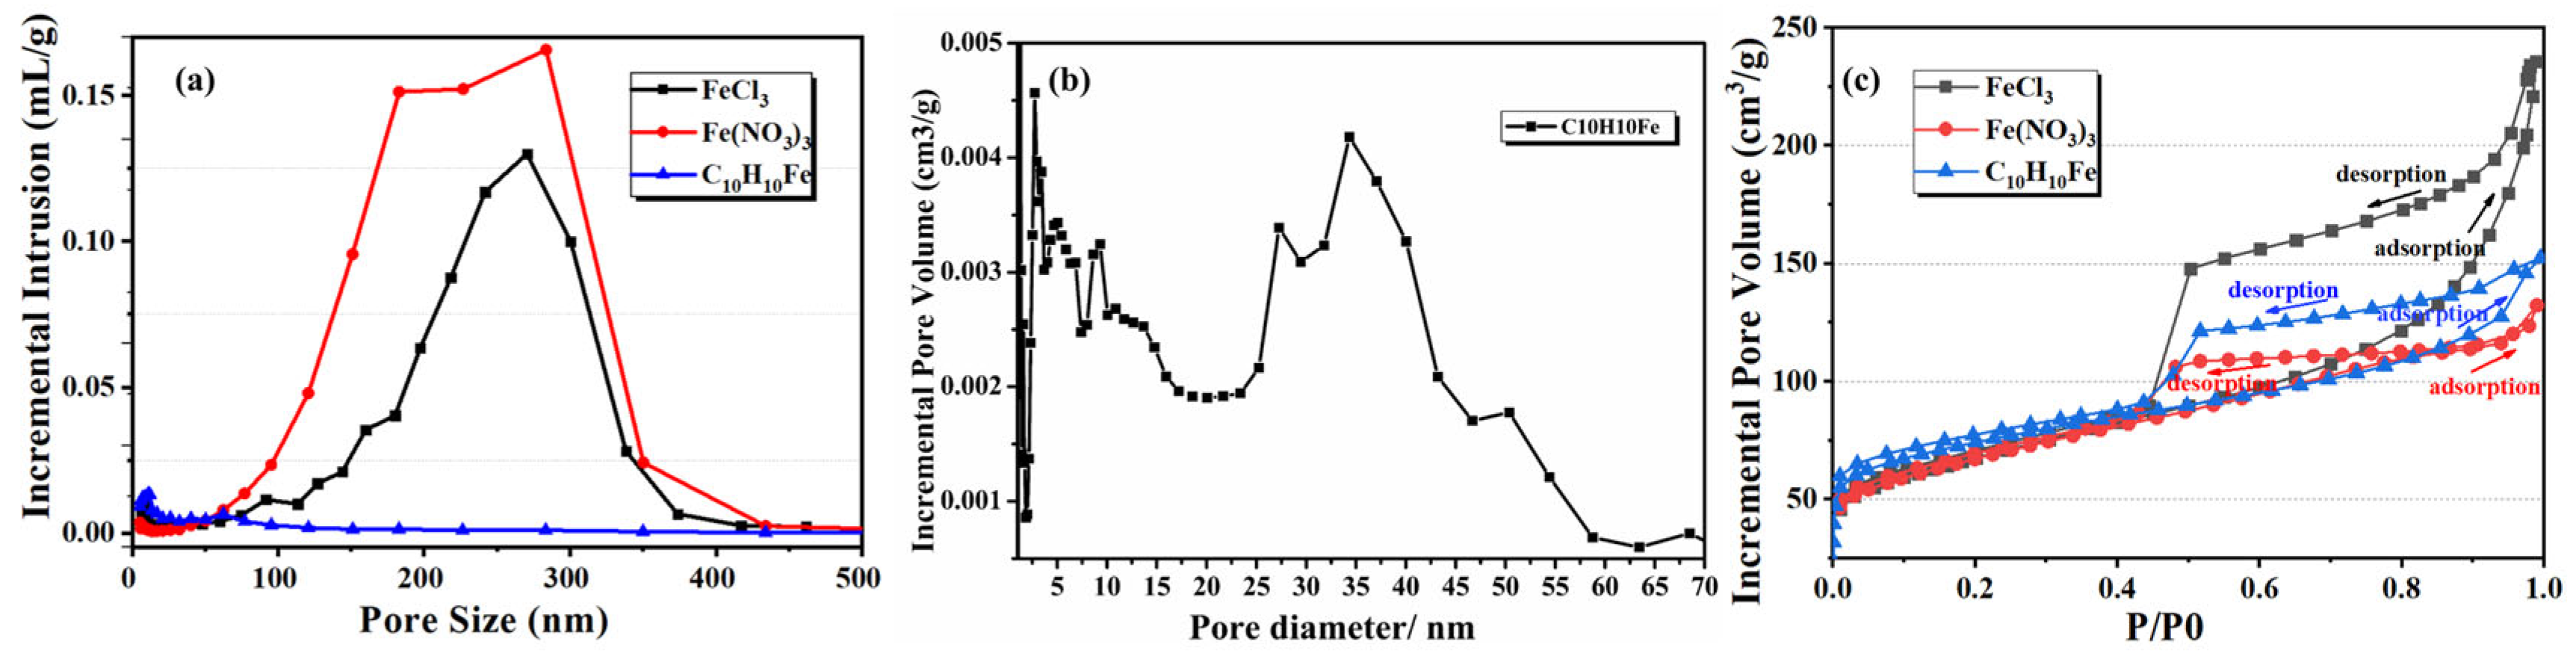
3.3. Influence of Coexisting Anion Type on Porous Carbon Pore Structure

Porous carbon samples were obtained by pyrolyzing resin mixtures separately prepared with the addition of FeCl3, Fe(NO3)3, or C10H10Fe. The microstructures of these samples were evaluated by SEM, as shown in Figure 9. The pore structures of the samples prepared using FeCl3, and Fe(NO3)3 were similar, with three-dimensional pore networks. The porous carbon sample prepared with the addition of ferrocene was similar to the porous carbon sample prepared without the addition of Fe, with a small pore size and low pore structural uniformity.
The pore structure parameters of the porous carbon samples prepared with different anions were evaluated by mercury porosimetry and nitrogen adsorption-desorption, as shown in Table 4. The pore size distributions obtained from the nitrogen adsorption- desorption data are shown in Figure 10. The porous carbon prepared with Fe(NO3)3 had an average pore size of 228 ± 21 nm, an apparent porosity of 51.4 ± 1.9%, a bulk density of 0.97 g·cm−3, and a pore size distribution in the range of 100~350 nm. This was similar to the porous carbon sample prepared with the addition of FeCl3. The porous carbon sample prepared with C10H10Fe had an average pore size of 8 ± 3 nm, an apparent porosity of 30.9 ± 1.9%, a bulk density of 1.21 g·cm−3, and a pore size distribution of 2~40 nm. As shown in Figure 10c, the adsorption-desorption isotherms of the three samples were all type IV (the typical isotherm type of mesoporous structures).
In the preparation system of porous carbon materials, the anionic coordination environment has a significant regulatory effect on the thermal decomposition kinetics of metal ion and the sol-gel phase separation process. As strong electrolyte salts, FeCl3 and Fe(NO3)3 show excellent dissociation characteristics in glycol solvent. Through the coordination between metal cations and resin monomers, the topological growth of three-dimensional network structure can be effectively induced, so as to retain the macro through multi-stage pore structure in the process of pyrolysis and carbonization. In contrast, metal organic compound C10H10Fe is limited by the coordination saturation effect, and it is difficult to achieve effective dissociation in polar solvent system. Due to the coordination inertia of the Fe centers in the molecules, the metal catalytic sites were not exposed enough and could not effectively participate in the template guiding role in the process of resin polymerization. This limited metal organic synergistic effect directly inhibits the formation dynamics of bicontinuous phases in the process of phase separation, and ultimately leads to the disordered development of pore structure. It is worth noting that at the high temperature carbonization stage, the Fe species in C10H10Fe molecule can still be partially transformed into nano catalytic sites, which catalyzes the surface reaction between carbon matrix and gasification medium, forming pores of about 3.5 nm [36].
The X-ray diffraction (XRD) analysis of porous carbon samples synthesized with different anionic iron salts (FeCl3, Fe(NO3)3, and C10H10Fe) reveals consistent phase composition across all specimens, as illustrated in Figure 11a. All diffraction patterns exhibit characteristic peaks corresponding to the graphitic carbon phase and iron carbide phases. This observation indicates that different anionic (Cl⁻, NO3⁻, or organometallic ligands) do not significantly influence the final phase evolution during pyrolysis. The thermal decomposition pathways of the iron salts to similar intermediate products under high-temperature carbonization conditions, where the anion-derived volatile species (e.g., HCl, NOX, or hydrocarbons) are fully evolved, leaving metallic iron nanoparticles to catalyze graphitization and subsequently react with carbon to form thermodynamically stable iron carbides. The bonding characteristics and elemental composition of FeCl3 sample are further confirmed with XPS (Figure 11b–d). The near-surface composition determined by XPS (Figure 11b) indicated that the atomic contents of C, O and Fe in FeCl3 were 97, 2.5 and 0.5%, respectively, which matched the elemental mapping results obtained from the ICP-OES analysis discussed earlier. Figure 11c shows that the peaks at 284.5 eV, 285.9 eV and 289.3 eV for C 1s correspond to C–C, C=C of sp2 graphitic carbon and C–O bonds, respectively [32]. The dominant Fe–C peak (283.4 eV) corresponds to Fe3C. The Fe–C peak at 708.9 eV is attributed to Fe3C (Figure 11d).

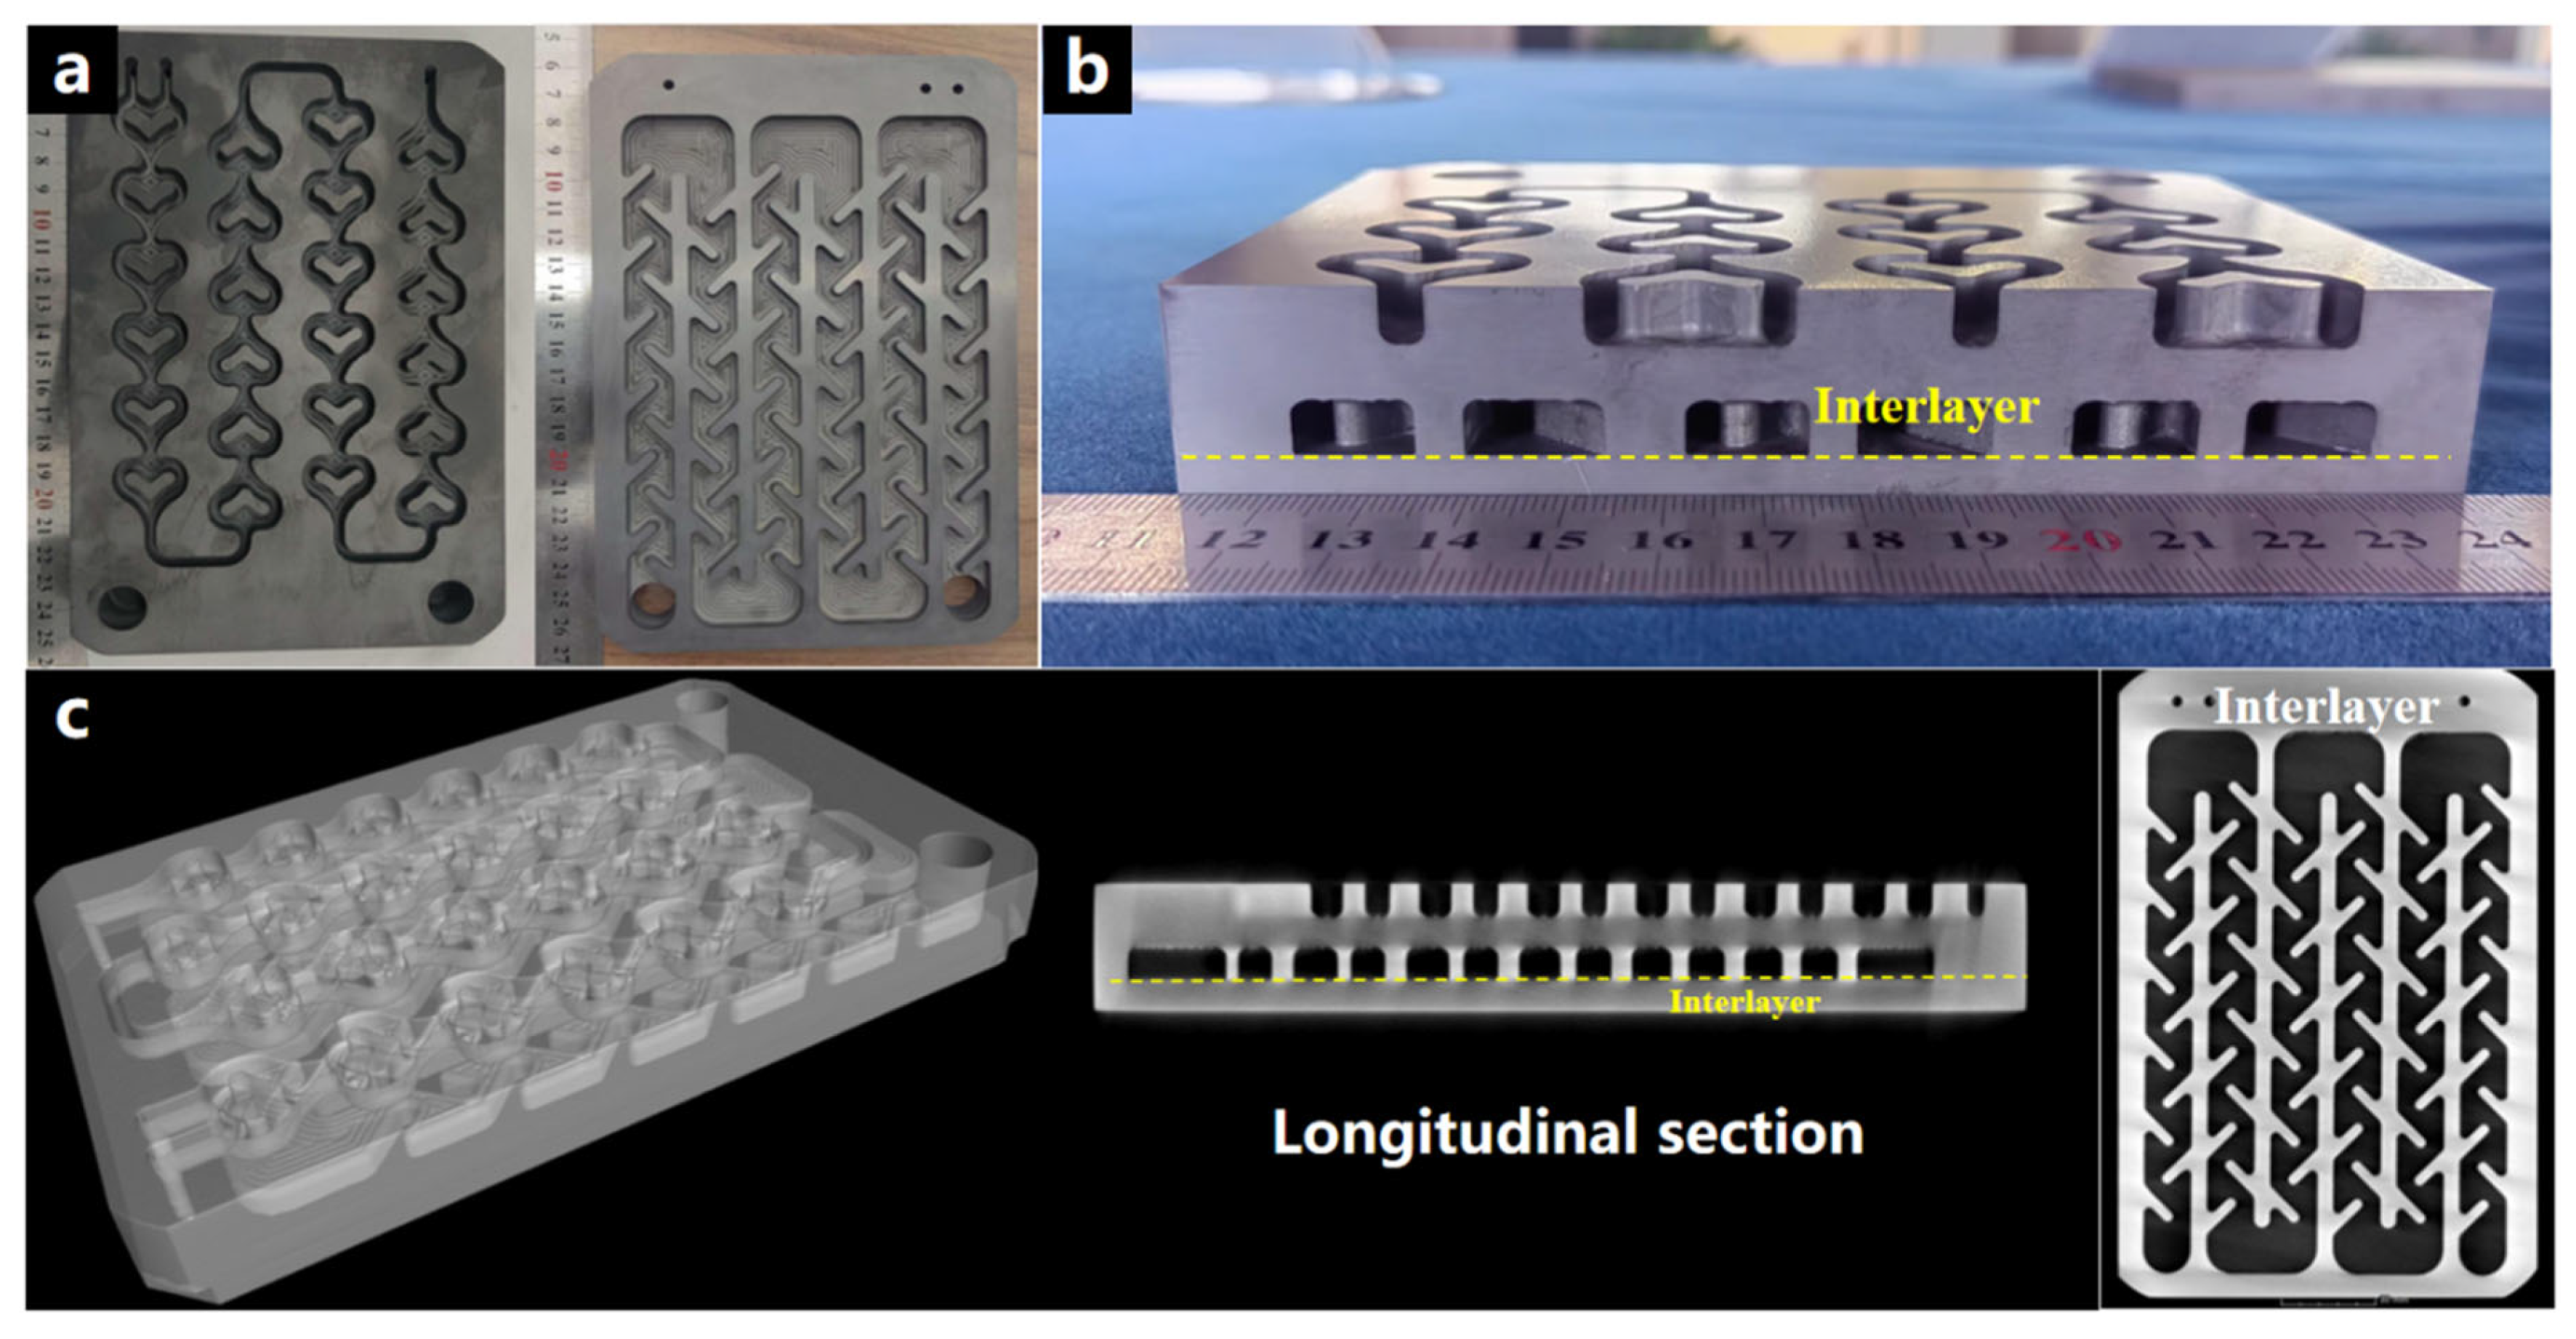
3.4. The Joining of Silicon Carbide Parts

The theoretical density of the porous carbon preform that can react completely with liquid silicon without silicon residue is 0.963 g·cm−3 [37]. In this study, a resin-based solution with added FeCl3 was selected for the subsequent joining experiment. After carbonization, the average pore diameter was 248 ± 29 nm, and the volume density of the porous carbon preform was 0.95 ± 0.02 g·cm−3, which was close to the theoretical density of the porous carbon preform. This structural feature provided an ideal transmission channel for the kinetics of the liquid silicon infiltration reaction. The FeCl3 induced continuous meso-macro pore network effectively reduced the capillary resistance during the silicon melt infiltration process. The three-dimensional continuous pore structure maintained a stable chemical potential gradient at the reaction interface, thereby inhibiting the local enrichment of unreacted silicon. The microstructure of the joint of the joined sample is shown in Figure 12a. The joint structure was dense, without cracks, and there were no pores at the interlayer and interface. The results of the flexural strength and Weibull modulus of the joined specimens at room temperature are shown in Figure 12b. The flexural strength reached 309 ± 33 MPa, and the Weibull modulus reached 10.67. The high flexural strength and high Weibull modulus revealed the uniformity of the defect distribution in the connection layer, which was directly related to the uniformity of the spatial distribution of Fe3⁺ ions in the resin solution. The coordination effect of metal ions promoted the formation of a resin network with uniformly distributed pore structure characteristics, significantly improving the uniformity of SiC/Si distribution in the connection layer, which was manifested as a narrow dispersion characteristic of strength distribution at the macroscopic scale.
The thermal shock resistance of the joining samples was evaluated by testing their flexural strength after 30 cycles from room temperature to 450 °C. The flexural strength reached 318 ± 23 MPa after 30 cycles. The slight increase in flexural strength can be attributed to the formation of SiO2 after SiC oxidation, which effectively fills surface defects. This not only prevents further oxidation but also enhances the mechanical properties. Compared with the existing reaction joining systems (Table 5), this study successfully induces the formation of a three-dimensionally interconnected macroporous structure via metal salts during resin carbonization. This significantly enhances the molten silicon infiltration process, achieving both high joining strength and an impressive Weibull modulus of 10.67. The excellent stability and reliability of the joint further highlight its superior comprehensive mechanical properties.
This study conducted connection research on a large-sized 135 mm × 205 mm silicon carbide ceramic heat exchanger (Figure 13a). The cross-sectional morphology after connection (Figure 13b) shows that no typical pore defect band was observed at the connection interface. The industrial CT non-destructive testing three-dimensional reconstruction results (Figure 13c) further reveal the structural integrity of the connection body at the macroscopic scale. The isotropic gray-scale distribution feature indicates the high uniformity of the connection layer, which is attributed to the uniform distribution of the three-dimensional connected pore structure within the porous green body. During the connection thermodynamic process, the three-dimensional connected pores of the carbon skeleton regulate the local supersaturation of silicon vapor, ensuring the dynamic stability of the connection process of large-sized components. The process reliability demonstrated by this technical system validates the significant role of structured porous media in the field of ceramic connection. The three-dimensional connected pore network provides a penetration channel for liquid silicon, which provides a theoretical basis and engineering practice foundation for the development of connection technology for large-sized new ceramic matrix composite structures.

4. Conclusions

In summary, the pore structure of the porous carbon materials was successfully regulated by controlling the mass ratio of organic resin to solvent, the type of solvent, the valence state of metal ions, and the type of coexisting anions in the metal ion-resin-solvent system. As the molecular weight and viscosity of the solvent increased, the porosity of the porous carbon gradually decreased. When ethylene glycol was used as the solvent, the porosity reached a maximum of 52.9%. As the mass ratio of resin to solvent decreased, the porosity gradually increased. When the mass ratio was lower than 2:8, the sample could not form a carbon skeleton. The selection of metal ions (Fe2+ and Fe3+) significantly affected the formation mechanism of the pore structure. Fe2+ promoted the ortho-substitution of the phenolic structure of the resin, improved the resin polymerization, accelerated the phase separation process, and led to a higher porosity (i.e., 63.3%) with an average pore size of 190 ± 15 nm. In the preparation system of porous carbon materials, the anion coordination environment had a significant regulatory effect on the thermal decomposition kinetics of the metal precursor and the sol-gel phase separation process. Strong electrolyte metal salts (NO3−, Cl) had a better pore-forming effect compared to metal organic compounds. Based on this study, a high-reliability connection of 135 mm × 205 mm large-sized silicon carbide ceramics was achieved using the resin solution. The connection layer was dense and defect-free, with a connection strength of 309 ± 33 MPa and a Weibull modulus of 10.67, verifying the important role of structured porous media in the field of large-sized ceramic connections.

Author Contributions

Conceptualization, X.W. and Z.H.; methodology, X.W.; software, H.W.; validation, B.P. and Z.L.; formal analysis, X.W.; investigation, X.W.; resources, X.W. and H.W.; data curation, X.W. and B.P.; writing—original draft preparation, X.W.; writing—review and editing, Z.H.; visualization, B.P.; supervision, Z.L.; project administration, Z.L.; funding acquisition, X.W. and Z.H. All authors have read and agreed to the published version of the manuscript.

Funding

This work was supported by the National Key R and D Program of China (2022YFB3706200), National Natural Science Foundation of China (U23A20563).

Institutional Review Board Statement

Not applicable.

Informed Consent Statement

Not applicable.

Data Availability Statement

Data will be available on request.

Acknowledgments

The authors express their gratitude to MIIT (Ministry of Industry and Information Technology of China) and NSFC (National Natural Science Foundation of China) for the financial support.

Conflicts of Interest

The authors declare no conflict of interest.

References

  1. Li, S.; Cheng, C.; Thomas, A. Carbon-based microbial-fuel-cell electrodes: From conductive supports to active catalysts. Adv. Mater. 2017, 29, 1602547. [Google Scholar] [CrossRef] [PubMed]
  2. Eid, K.; Abdelhafiz, A.A.; Abdel-Azeim, S.; Varma, R.S.; Shibl, M.F. Scalable nitrogen-enriched porous sub-100 nm graphitic carbon nanocapsules for efficient oxygen reduction reaction in different media. Green Chem. 2023, 25, 6748–6758. [Google Scholar] [CrossRef]
  3. Lu, Q.; Eid, K.; Li, W. Heteroatom-Doped Porous Carbon-Based Nanostructures for Electrochemical CO2 Reduction. Nanomaterials 2022, 12, 2379. [Google Scholar] [CrossRef]
  4. Salah, B.; Abdelgawad, A.; El-Demellawi, J.K.; Lu, Q.; Xia, Z.; Abdullah, A.M.; Eid, K. Scalable one-pot fabrication of carbon-nanofiber-supported noble-metal-free nanocrystals for synergetic-dependent green hydrogen production: Unraveling electrolyte and support effects. ACS Appl. Mater. Interfaces 2024, 16, 18768–18781. [Google Scholar] [CrossRef] [PubMed]
  5. Chen, X.; Wu, Y.; Gu, W.; Zhou, M.; Tang, S.; Cao, J.; Zou, Z.; Ji, G. Research progress on nanostructure design and composition regulation of carbon spheres for the microwave absorption. Carbon 2022, 189, 617–633. [Google Scholar] [CrossRef]
  6. Wang, J.; Zhou, M.; Xie, Z.; Hao, X.; Tang, S.; Wang, J.; Zou, Z.; Ji, G. Enhanced interfacial polarization of biomass-derived porous carbon with a low radar cross-section. J. Colloid Interface Sci. 2022, 612, 146–155. [Google Scholar] [CrossRef]
  7. Guan, X.; Yang, Z.; Zhu, Y.; Yang, L.; Zhou, M.; Wu, Y.; Yang, L.; Deng, T.; Ji, G. The controllable porous structure and s-doping of hollow carbon sphere synergistically act on the microwave attenuation. Carbon 2022, 188, 1–11. [Google Scholar] [CrossRef]
  8. Li, B.; Xiong, H.; Xiao, Y. Progress on synthesis and applications of porous carbon materials. Int. J. Electrochem. Sci. 2020, 15, 1363–1377. [Google Scholar] [CrossRef]
  9. Li, X.; Zhao, Y.; Yang, Y.; Gao, S. A universal strategy for carbon–based ORR–active electrocatalyst: One porogen, two pore–creating mechanisms, three pore types. Nano Energy 2019, 62, 628–637. [Google Scholar] [CrossRef]
  10. Ding, J.P.; Zhang, H.P.; Li, X.D.; Yang, G.C. Adaptive local mean based empirical mode decomposition and its application in harmonic detections. Mater. Des. 2014, 141, 17–25. [Google Scholar] [CrossRef]
  11. Kapri, S.; Majee, R.; Bhattacharyya, S. Chemical Modifications of Porous Carbon Nanospheres Obtained from Ubiquitous Precursors for Targeted Drug Delivery and Live Cell Imaging. ACS Sustain. Chem. Eng. 2018, 6, 8503–8514. [Google Scholar] [CrossRef]
  12. Su, X.L.; Li, S.H.; Jiang, S.; Peng, Z.K.; Guan, X.X.; Zheng, X.C. Superior capacitive behavior of porous activated carbon tubes derived from biomass waste-cotonier strobili fibers. Adv. Powder Technol. 2018, 29, 2097–2107. [Google Scholar] [CrossRef]
  13. Wu, X.; Liu, J.; Wang, Y.; Zhao, Y.; Li, G.; Zhang, G. Fabrication of porous carbon nanosheets via Urea-Promoted activation of potassium citrate for enhanced supercapacitor performance. Chem. Eng. J. 2025, 512, 162487. [Google Scholar] [CrossRef]
  14. Li, F.; Zhu, M.; Chen, J.; Huang, C.; Zhu, Y.; Huang, Z. High-strength and low-silicon SiC ceramics prepared by extrusion molding 3D printing. J. Eur. Ceram. Soc. 2024, 44, 617–625. [Google Scholar] [CrossRef]
  15. Hucke, E.E. Methods of Producing Carbonaceous Bodies and the Products Thereof. U.S. Patent No. 3,859,421, 7 January 1975. [Google Scholar]
  16. Du, W.; Ma, B.; Thomas, J.; Singh, D. Concurrent reaction-bonded joining and densification of additively manufactured silicon carbide by liquid silicon infiltration. J. Eur. Ceram. Soc. 2023, 43, 2345–2353. [Google Scholar] [CrossRef]
  17. Wu, X.; Huang, Q.; Zhu, Y.; Huang, Z. Joining of SiC Ceramic by Si–C Reaction Bonding Using Organic Resin as Carbon Precursor. Materials 2022, 15, 4242. [Google Scholar] [CrossRef]
  18. Seo, J.; Park, H.; Shin, K.; Baeck, S.H.; Rhym, Y.; Shim, S.E. Lignin-derived macroporous carbon foams prepared by using poly(methyl methacrylate) particles as the template. Carbon 2014, 76, 357–367. [Google Scholar] [CrossRef]
  19. Han, S.; Feng, Y.; Zhang, F.; Yang, C.; Yao, Z.; Zhao, W.; Qiu, F.; Yang, L.; Yao, Y.; Zhuang, X.; et al. Metal-Phosphide-Containing Porous Carbons Derived from an Ionic-Polymer Framework and Applied as Highly Efficient Electrochemical Catalysts for Water Splitting. Adv. Funct. Mater. 2015, 25, 3899–3906. [Google Scholar] [CrossRef]
  20. Xu, S.; Li, J.; Qiao, G.; Wang, H.; Lu, T. Pore structure control of mesoporous carbon monoliths derived from mixtures of phenolic resin and ethylene glycol. Carbon 2009, 47, 2103–2111. [Google Scholar] [CrossRef]
  21. Choi, S.H.; Kang, Y.C. Polystyrene-Templated Aerosol Synthesis of MoS2–Amorphous Carbon Composite with Open Macropores as Battery Electrode. ChemSusChem 2015, 8, 2260–2267. [Google Scholar] [CrossRef]
  22. Yin, Y.; Xu, J.; Liu, Q.; Zhang, X. Macroporous interconnected hollow carbon nanofibers inspired by golden-toad eggs toward a binder-free, high-rate, and flexible electrode. Adv. Mater. 2016, 28, 7494–7500. [Google Scholar] [CrossRef] [PubMed]
  23. Wang, Y.; Tan, S.; Jiang, D.; Zhang, X. Preparation of porous carbon derived from mixtures of furfuryl resin and glycol with controlled pore size distribution. Carbon 2003, 41, 2065–2072. [Google Scholar] [CrossRef]
  24. Zhang, Y.; Yuan, Z.; Zhou, Y. Effect of furfural alcohol/phenol-formaldehyde resin mass ratio on the properties of porous carbon. Mater. Lett. 2013, 109, 124–126. [Google Scholar] [CrossRef]
  25. Yuan, Z.; Zhang, Y.; Zhou, Y.; Han, J. Preparation and characterization of porous carbons obtained from mixtures of furfuryl alcohol and phenol-formaldehyde resin. Mater. Chem. Phys. 2014, 143, 707–712. [Google Scholar] [CrossRef]
  26. Yuan, Z.; Zhang, Y.; Zhou, Y. Effect of curing catalyst content on the pore structure of porous carbon obtained from phenolic resin and furfuryl alcohol. Mater. Lett. 2013, 110, 218–220. [Google Scholar] [CrossRef]
  27. Pizzi, A. Kinetics of the metal-catalyzed condensations of phenols and polyelavonoid tannins with formaldehyde. J. Polym. Sci. 1980, 18, 3447–3454. [Google Scholar] [CrossRef]
  28. Wu, X.; Zhu, Y.; Pei, B.; Cai, P.; Huang, Z. Effect of FeCl2 on the pore structure of porous carbon obtained from phenol formaldehyde resin and ethylene glycol. Mater. Lett. 2018, 215, 50–52. [Google Scholar] [CrossRef]
  29. Wu, X.; Zhu, Y.; Huang, Q.; Huang, Z. Facile synthesis of magnetic hierarchical porous carbon and the adsorption properties. Mater. Charact. 2022, 193, 112273. [Google Scholar] [CrossRef]
  30. Hashimoto, T.; Takenaka, M.; Jinnai, H. Morphology control of polymer blends by a chemical pinning of spinodal decomposition. Polymer 1989, 30, 177–179. [Google Scholar]
  31. Salmani, H.; Bilibin, A. Nanoprecipitation-miniemulsion polymerization combined method: A novel approach to synthesis drug loaded nanoparticles with tunable characteristics. Eur. Polym. J. 2016, 84, 631–641. [Google Scholar] [CrossRef]
  32. Chen, D.; Feng, C.; Han, Y.; Yu, B.; Chen, W.; Zhou, Z.; Chen, N.; Goodenough, J.B.; He, W. Origin of extra capacity in the solid electrolyte interphase near high-capacity iron carbide anodes for Li ion batteries. Energy Environ. Sci. 2020, 13, 2924–2937. [Google Scholar] [CrossRef]
  33. Urbonaite, S.; Hälldahl, L.; Svensson, G. Raman spectroscopy studies of carbide derived carbons. Carbon 2008, 46, 1942–1947. [Google Scholar] [CrossRef]
  34. Kruk, M.; Jaroniec, M. Gas adsorption characterization of ordered organic− inorganic nanocomposite materials. Chem. Mater. 2001, 13, 3169–3183. [Google Scholar] [CrossRef]
  35. Ouchi, K. Infra-red study of structural changes during the pyrolysis of a phenol-formaldehyde resin. Carbon 1966, 4, 59–66. [Google Scholar] [CrossRef]
  36. Zhao, M.; Song, H.; Chen, X.; Lian, W. Large-scale synthesis of onion-like carbon nanoparticles by carbonization of phenolic resin. Acta Mater. 2007, 55, 6144–6150. [Google Scholar] [CrossRef]
  37. Behrendt, D.R.; Singh, M. Effect of carbon preform pore volume and infiltrants on the composition of reaction-formed silicon carbide materials. J. Mater. Synth. Process. 1994, 2, 117–123. [Google Scholar]
  38. Sung, H.-W.; Kim, Y.-H.; Kim, D.J. Joining of reaction bonded silicon carbide using self-infiltration of residual Si present in the RBSC. Ceram. Int. 2020, 46, 28800–28805. [Google Scholar] [CrossRef]
  39. Wu, X.; Pei, B.; Zhu, Y.; Huang, Z. Joining of the Cf/SiC composites by a one-step Si infiltration reaction bonding. Mater. Charact. 2019, 155, 109799. [Google Scholar] [CrossRef]
  40. Giuranno, D.; Sobczak, N.; Bruzda, G.; Nowak, R.; Polkowski, W.; Polkowska, A.; Kudyba, A.; Novakovic, R. Studies of the joining-relevant interfacial properties in the Si-Ti/C and Si-Ti/SiC systems. J. Mater. Eng. Perform. 2020, 29, 4864–4871. [Google Scholar] [CrossRef]
  41. Grasso, S.; Tatarko, P.; Rizzo, S.; Porwal, H.; Hu, C.; Katoh, Y.; Salvo, M.; Reece, M.J.; Ferraris, M. Joining of β-SiC by spark plasma sintering. J. Eur. Ceram. Soc. 2014, 34, 1681–1686. [Google Scholar] [CrossRef]
Figure 1. Effect of solvent type on the microstructure of porous carbon: (a) EG, (b) DEG, (c) TEG, (d) PEG200, and (e) PEG400, (f) mercury porosimetry pore size distributions.
Materials 18 02336 g001
Figure 2. Effect of solvent type on (a) the weight and volume change of porous carbon samples after curing and pyrolysis, (b) XRD patterns, (c) nitrogen adsorption-desorption isotherms, and (d) nitrogen adsorption-desorption pore size distributions.
Materials 18 02336 g002
Figure 3. Morphologies of carbonized products prepared from resin mixtures with different PF/EG ratios: (a) 7:3, (b) 5:5, (c) 1:2, and (d) 2:8.
Materials 18 02336 g003
Figure 4. Effect of PF/EG mass ratio on (a) the weight and volume change of samples after curing and pyrolysis, (b) raman spectra, (c) XRD patterns, (d) nitrogen adsorption-desorption isotherms, and (e) nitrogen adsorption-desorption pore size distributions.
Materials 18 02336 g004
Figure 5. SEM images showing the microstructure of porous carbon samples prepared with (a) no Fe, (b) FeCl2, and (c) FeCl3.
Materials 18 02336 g005
Figure 6. Textural analysis of porous carbon samples prepared with no Fe, with FeCl2, and with FeCl3: (a) mercury porosimetry pore size distributions, (b) nitrogen adsorption-desorption pore size distributions, and (c) nitrogen adsorption-desorption isotherms.
Materials 18 02336 g006
Figure 7. (a) XRD patterns and (b) Raman spectra of the porous carbon samples prepared using no Fe, with FeCl2, or with FeCl3.
Materials 18 02336 g007
Figure 8. FT-IR spectra of resin mixtures prepared without Fe and with the addition of FeCl2 or FeCl3 after pre-curing at 90 °C.
Materials 18 02336 g008
Figure 9. SEM images showing the microstructures of porous carbons prepared with (a) FeCl3, (b) Fe(NO3)3, and (c) C10H10Fe.
Materials 18 02336 g009
Figure 10. Pore size distributions (a,b) and N2-siotherm features (c) of porous carbon samples prepared with different anions.
Materials 18 02336 g010
Figure 11. (a) XRD patterns of the porous carbon samples prepared with different anions. (b) XPS-survey spectra of FeCl3. (c) High-resolution XPS spectrum of C 1s. (d) High-resolution XPS spectrum of Fe 2p.
Materials 18 02336 g011
Figure 12. (a) Microstructure of the joint and (b) Flexural strengths and Weibull modulus of the joint.
Materials 18 02336 g012
Figure 13. (a) Photos of SiC ceramic parts for joining (b) Sample profile photo after joining and (c) Industrial CT nondestructive testing.
Materials 18 02336 g013
Table 1. Effect of solvent type on the pore structure of porous carbon.
Solvent TypeMelting Point
/°C
Viscosity
/mPa·s
Average Molecular WeightBulk Density (g·cm−3)Apparent Porosity (%)Materials Compositions (wt%)
EG186.51662.070.71 ± 0.0352.9 ± 1.097.83 (C), 0.34 (Fe), 1.83 (O)
DEG245.528106.120.98 ± 0.0234.7 ± 0.997.24 (C), 0.38 (Fe), 1.83 (O)
TEG288.035150.171.08 ± 0.0428.1 ± 1.397.45 (C), 0.41 (Fe), 2.14 (O)
PEG200>25031200.001.19 ± 0.0321.2 ± 1.198.23 (C), 0.40 (Fe), 1.37 (O)
PEG400>25041400.001.10 ± 0.0216.5 ± 0.896.53 (C), 0.45 (Fe), 3.02 (O)
Table 2. Performance parameters of porous carbon materials prepared from resin mixtures with different PF/EG mass ratios.
Resin/SolventApparent Porosity (%)Bulk Density (g·cm−3)Carbon Residue Rate/%Materials Compositions (wt%)
7:334.2 ± 2.60.99 ± 0.0234.83 ± 1.996.23 (C), 0.42 (Fe), 3.35 (O)
5:552.9 ± 3.20.71 ± 0.0425.53 ± 2.197.83 (C), 0.34 (Fe), 1.83 (O)
1:266.5 ± 1.60.50 ± 0.0319.48 ± 1.597.28 (C), 0.31 (Fe), 2.41 (O)
2:8————5.61 ± 0.795.14 (C), 0.21 (Fe), 4.65 (O)
Table 3. Specific structural parameters of the internal pore structure of porous carbon samples prepared using Fe ions with different valance states.
SampleApparent Porosity (%)Average Aperture (nm)Bulk Density (g·cm−3)Vtotal (cm3·g−1)Skeleton Density (g·cm−3)Materials Compositions (wt%)
NoFe25.6 ± 1.114 ± 51.18 ± 0.080.21 ± 0.071.55 ± 0.0498.11 (C), 1.89 (O)
FeCl263.3 ± 1.7190 ± 150.73 ± 0.010.86 ± 0.021.91 ± 0.0597.83 (C), 0.34 (Fe), 1.83 (O)
FeCl350.9 ± 1.3248 ± 290.95 ± 0.020.75 ± 0.031.94 ± 0.0397.51 (C), 0.45 (Fe), 2.04 (O)
Table 4. Pore structure parameters of porous carbon materials prepared with different anions.
SampleApparent Porosity (%)Average Aperture (nm)Bulk Density (g·cm−3)Vtotal (cm3·g−1)Skeleton Density (g·cm−3)Materials Compositions (wt%)
FeCl350.9 ± 1.3248 ± 290.95 ± 0.020.75 ± 0.031.94 ± 0.0397.51 (C), 0.45 (Fe), 2.04 (O)
Fe(NO3)351.4 ± 1.9228 ± 210.97 ± 0.010.67 ± 0.031.89 ± 0.0597.42 (C), 0.46 (Fe), 2.12 (O)
C10H10Fe30.9 ± 1.98 ± 31.21 ± 0.020.24 ± 0.041.75 ± 0.0297.51 (C), 0.45 (Fe), 2.04 (O)
no Fe25.6 ± 1.114 ± 51.18 ± 0.080.21 ± 0.071.55 ± 0.0498.11 (C), 1.89 (O)
Table 5. A comparison of the joining performance of SiC in other studies with that achieved in this work.
Joining Base MaterialInterlayer MaterialsJoining ConditionJoint StrengthSource
SiC-SiCPF-FeCl3Silicon powder, 1600 °C, vacFlexural strength 309 MPa;
Weibull modulus 10.67
This work
SiC-SiCParchment paper1450~1550 °C, vacFlexural strength
243~246 MPa
[38]
Cf/SiC- Cf/SiCPFSilicon powder, 1600 °C, vacFlexural strength
203 ± 24 MPa
[39]
SiCf/SiC- SiCf/SiCSi-Ti/SiCSi-Ti infiltration, 1350 °C 2 h/[40]
additive-manufactured SiCgraphite paperSilicon powder, 1550 °C 2 h/[16]
SiC-SiC/Spark Plasma Sintering (SPS) 1900 °C, 5 min, 60 MPa,Flexural strength
193 ± 21 MPa
[41]
Disclaimer/Publisher’s Note: The statements, opinions and data contained in all publications are solely those of the individual author(s) and contributor(s) and not of MDPI and/or the editor(s). MDPI and/or the editor(s) disclaim responsibility for any injury to people or property resulting from any ideas, methods, instructions or products referred to in the content.

