
Study on the Properties of Alkali-Excited Concrete Modified by Nano-SiO2 Based on Response Surface Methodology

Abstract
1. Introduction
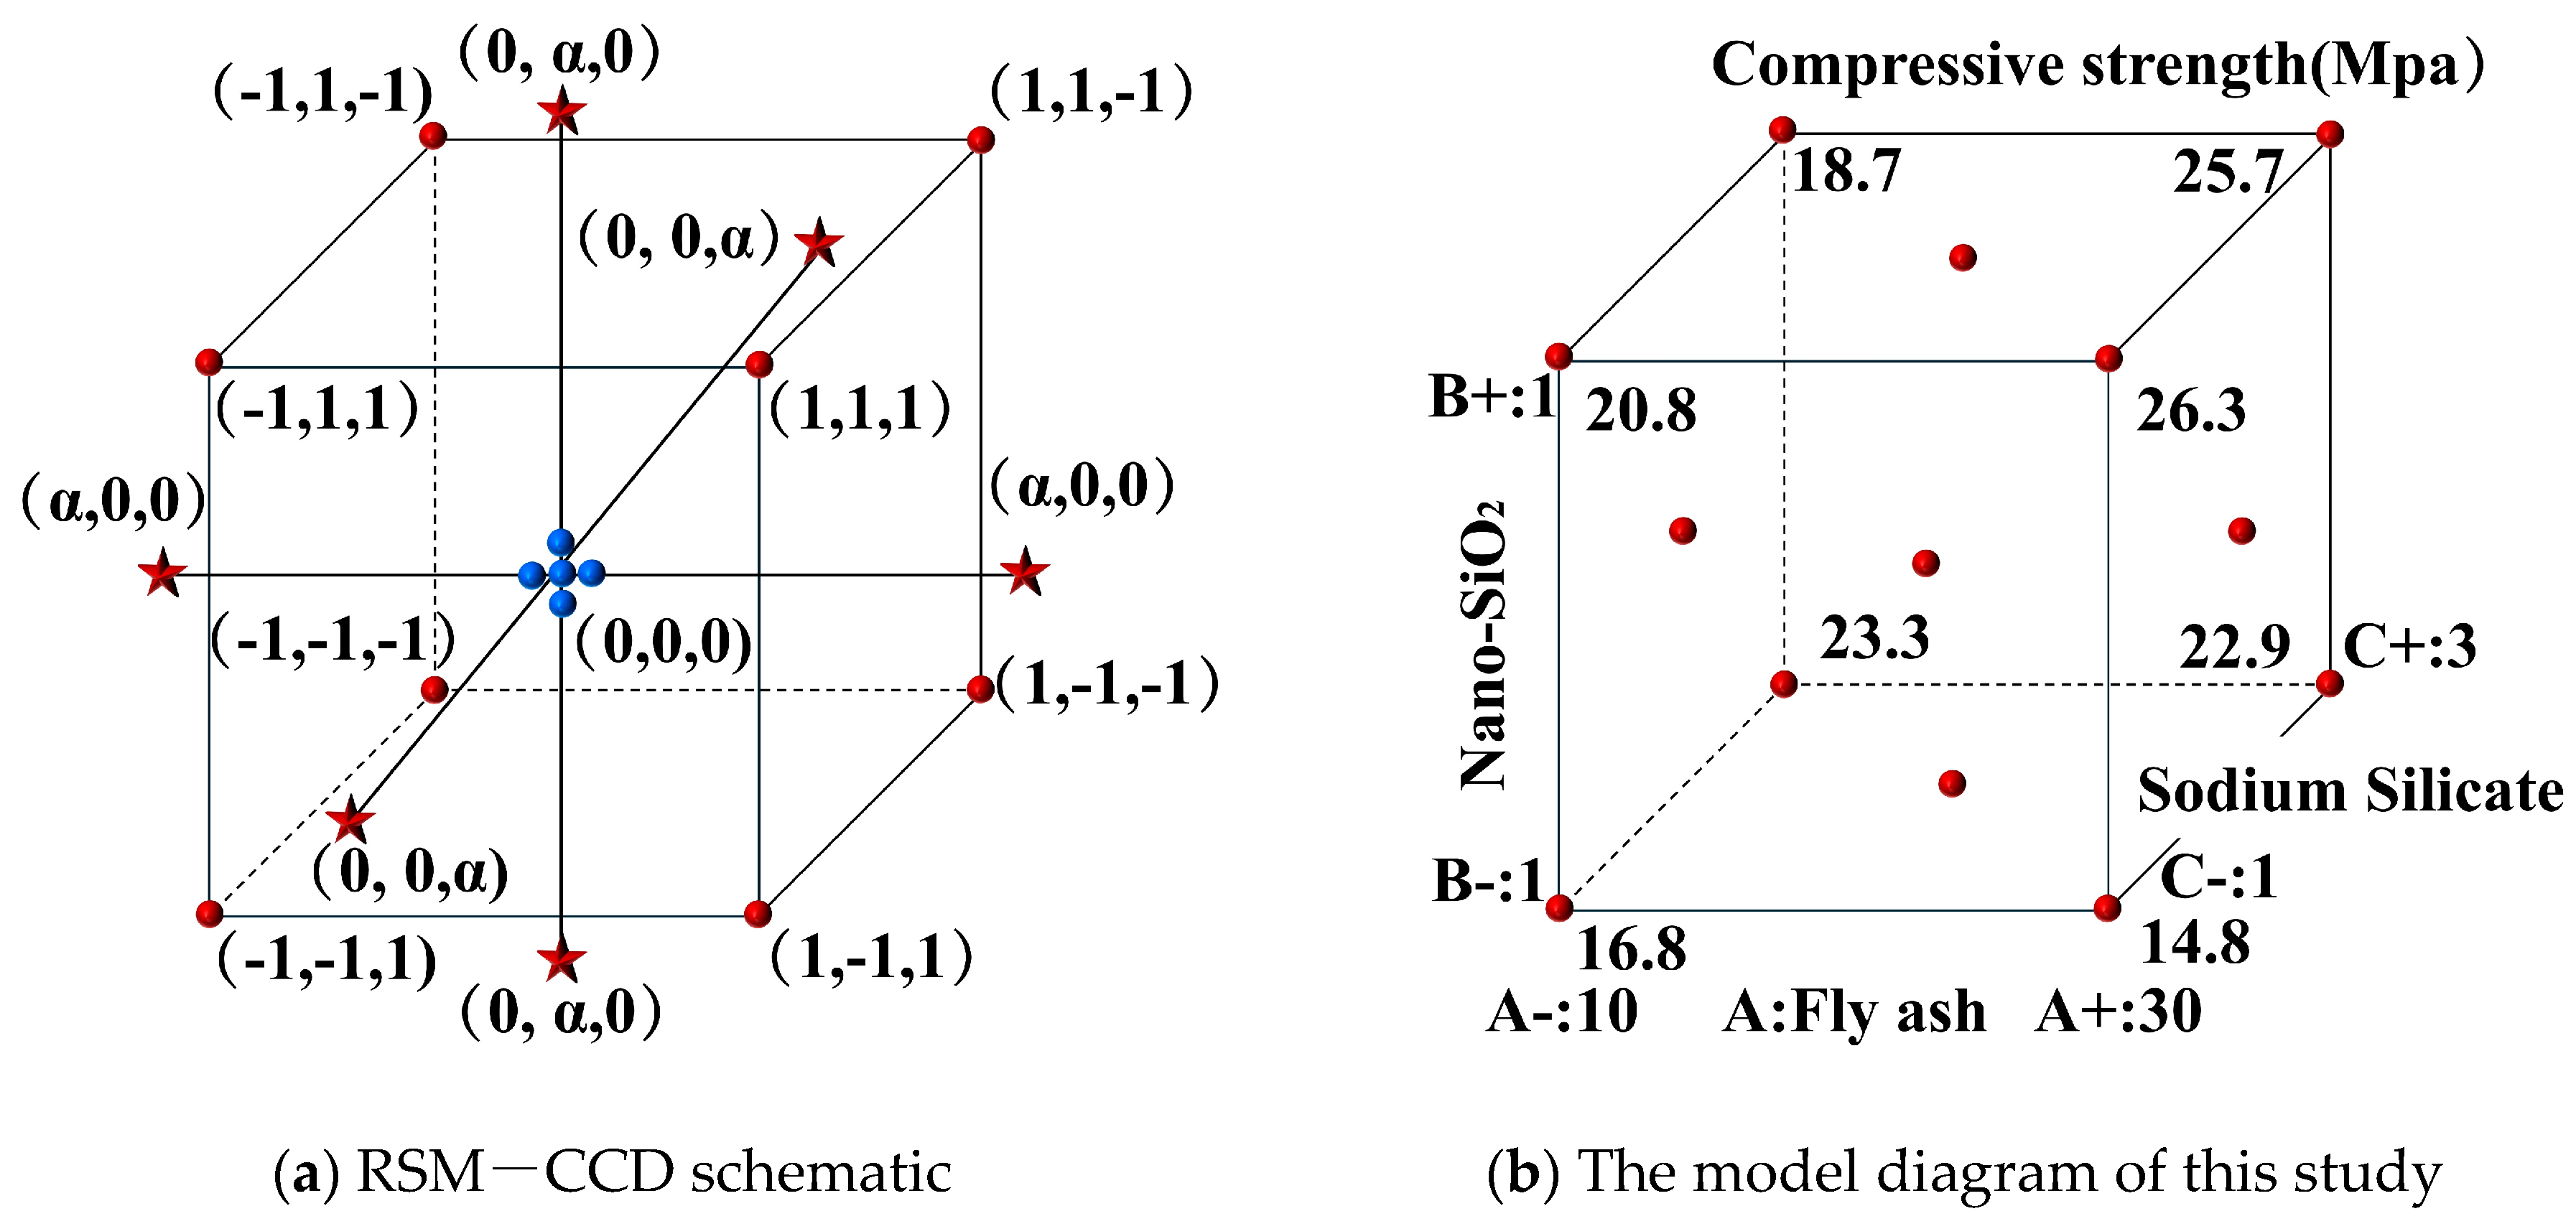
2. Response Surface Method
3. Materials and Methods
3.1. Materials
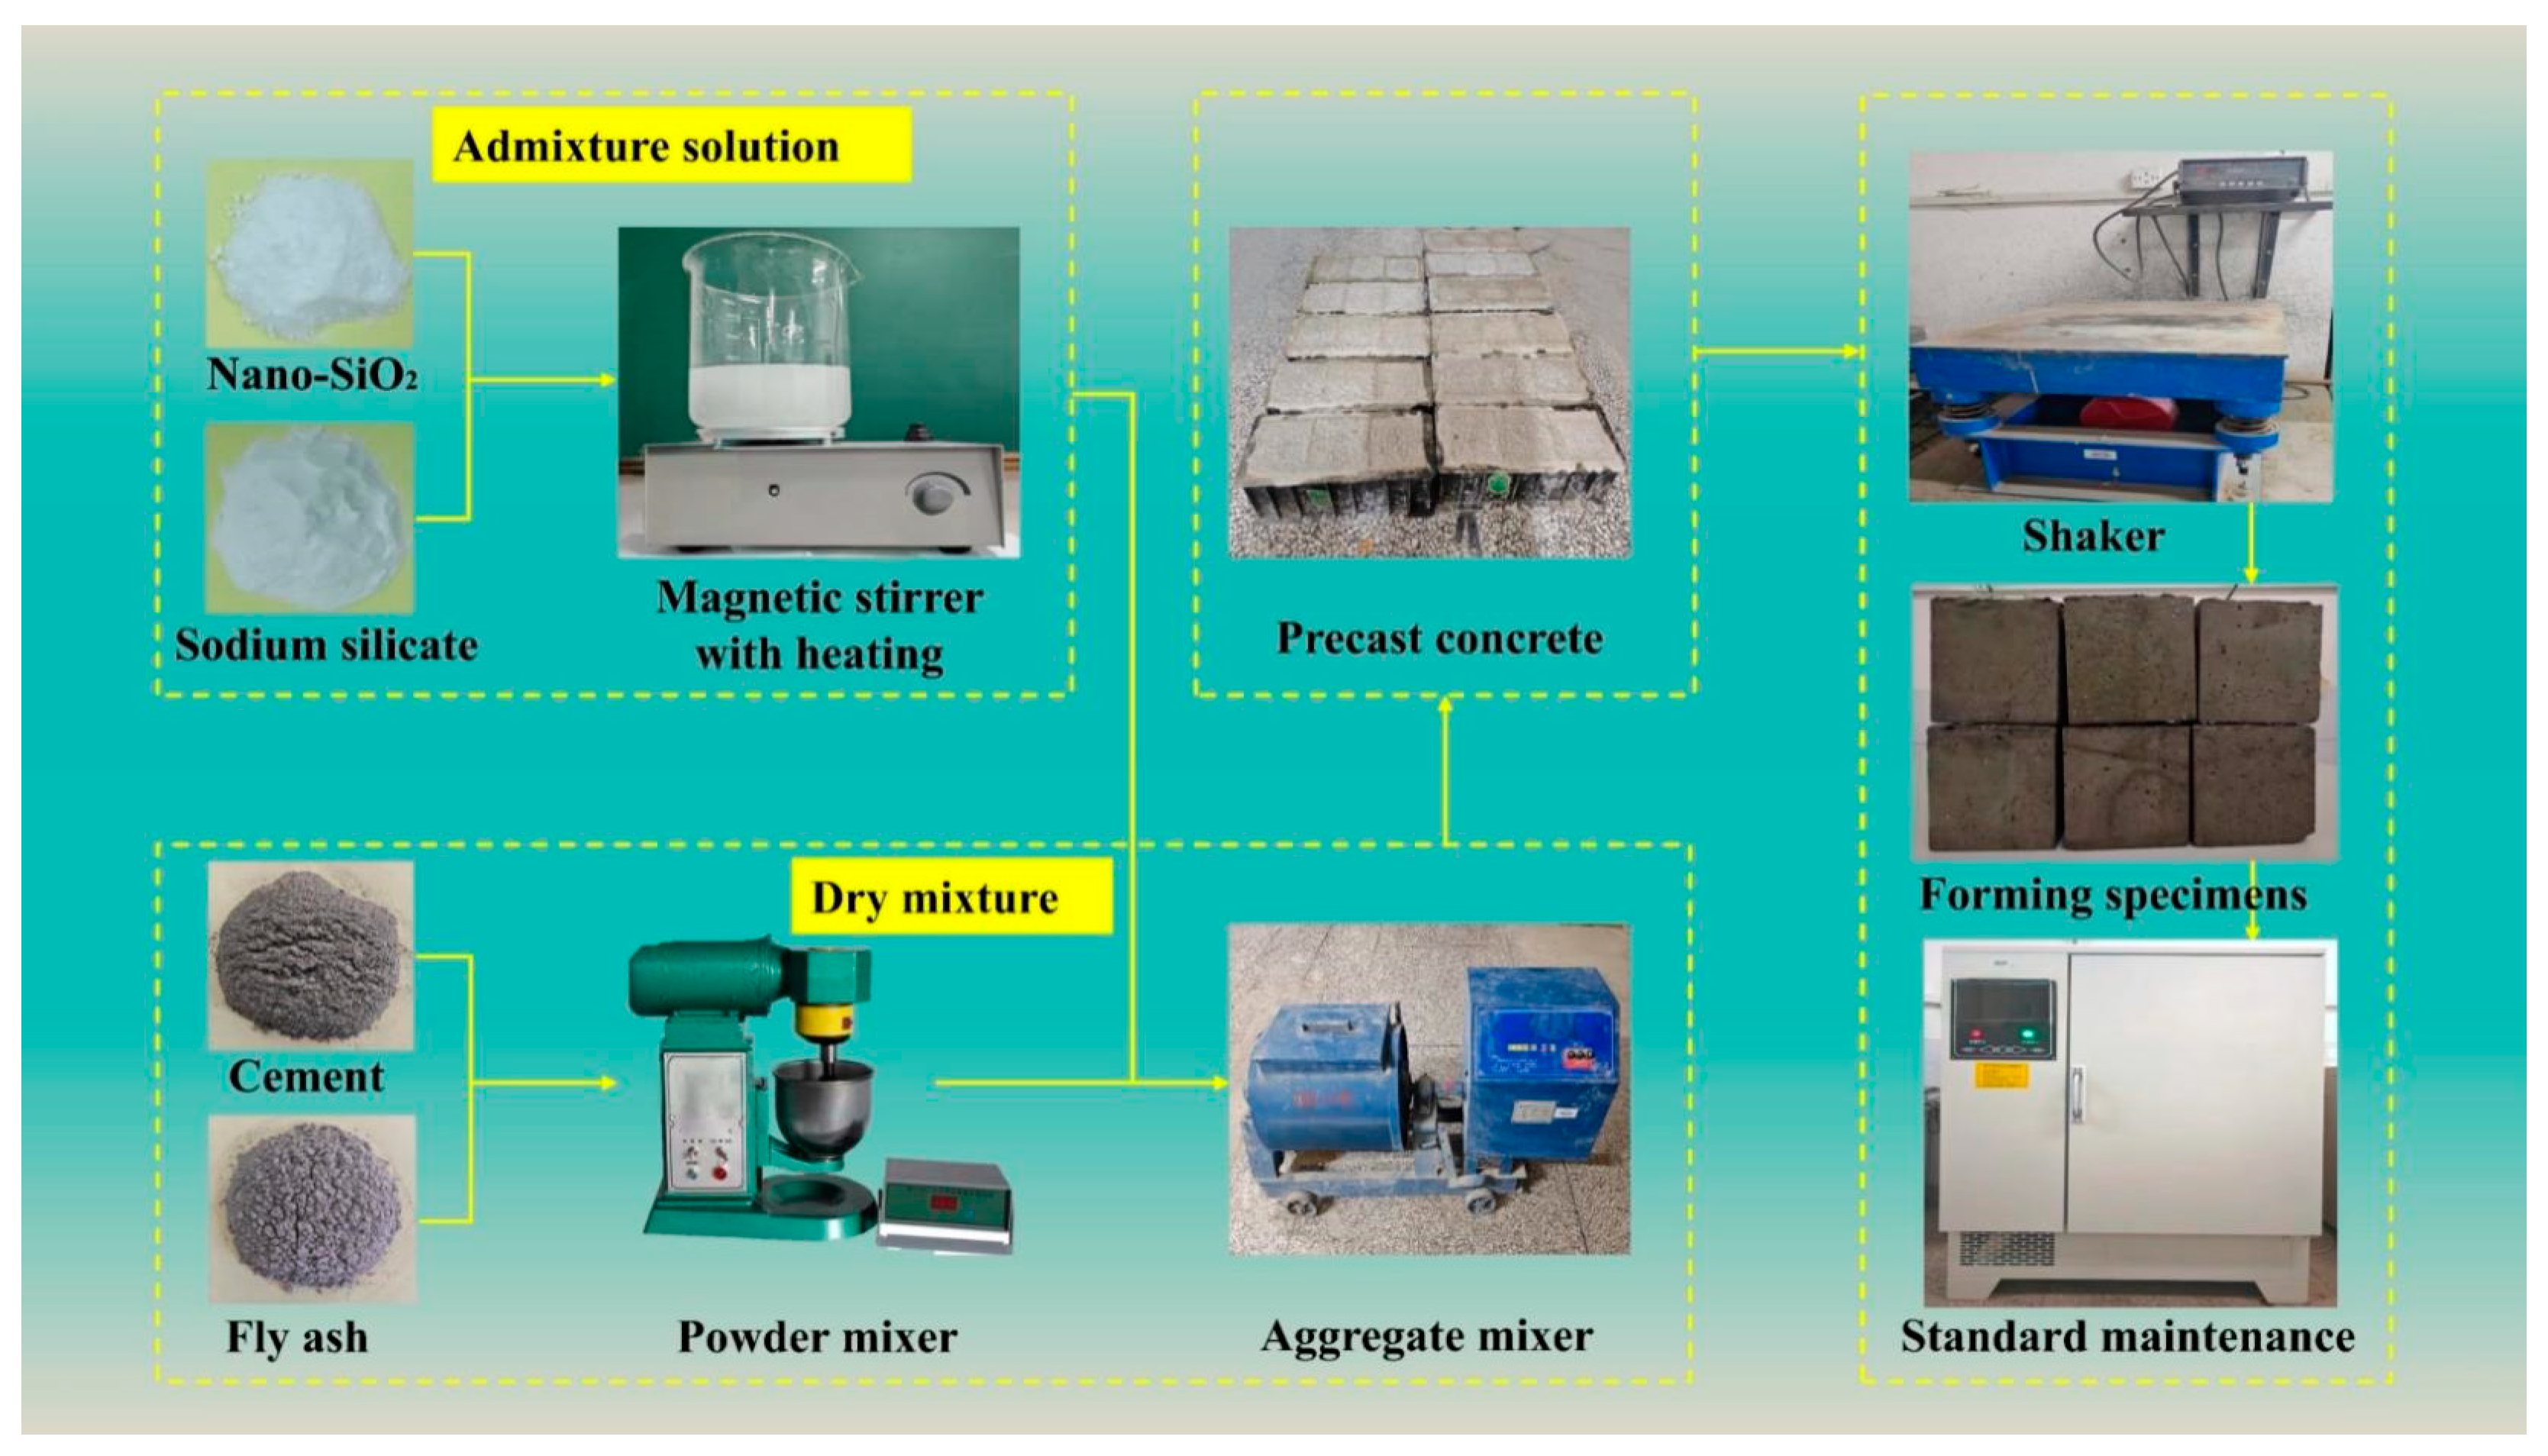
3.2. Sample Preparation Process
3.3. Experimental Method
3.3.1. Compressive Strength Test Method
3.3.2. SEM and XRD Testing Methods
4. Experimental Scheme
5. Experimental Results and Analysis
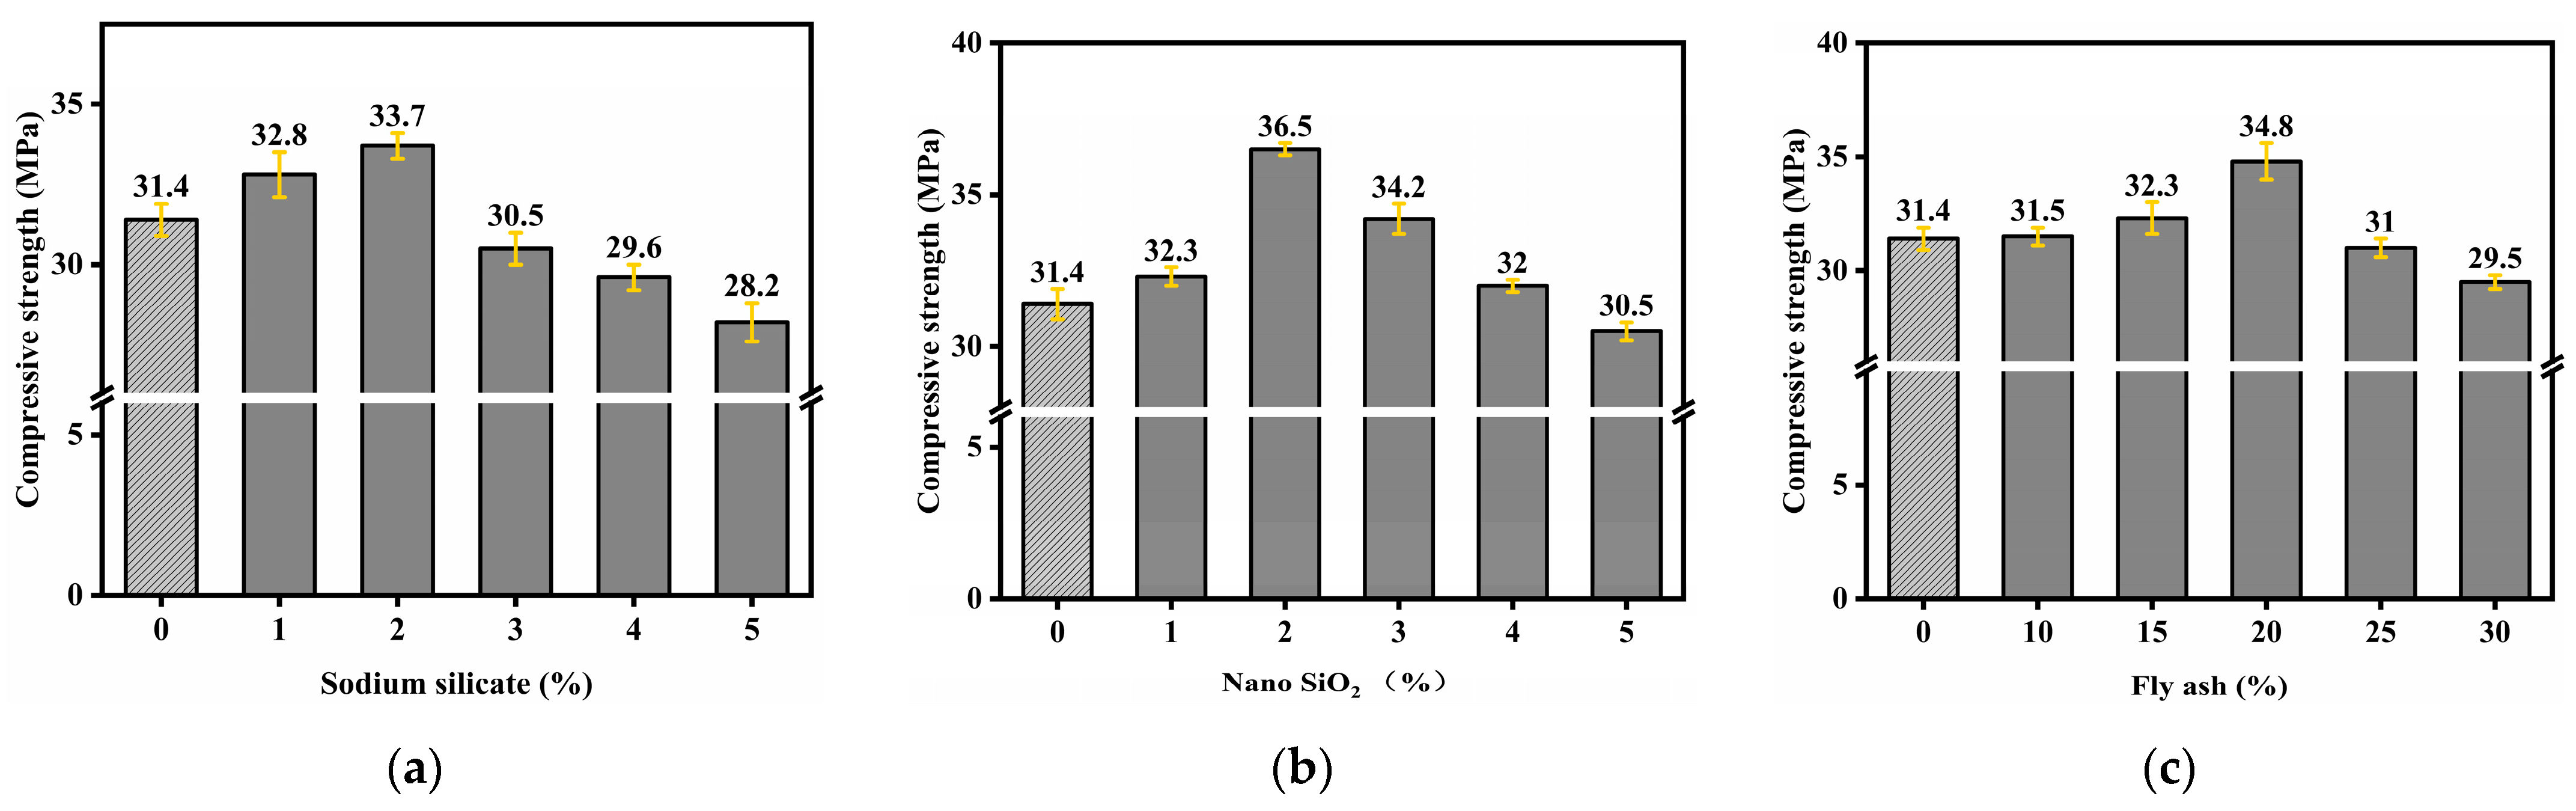
5.1. Analysis of Single-Factor Experimental Results
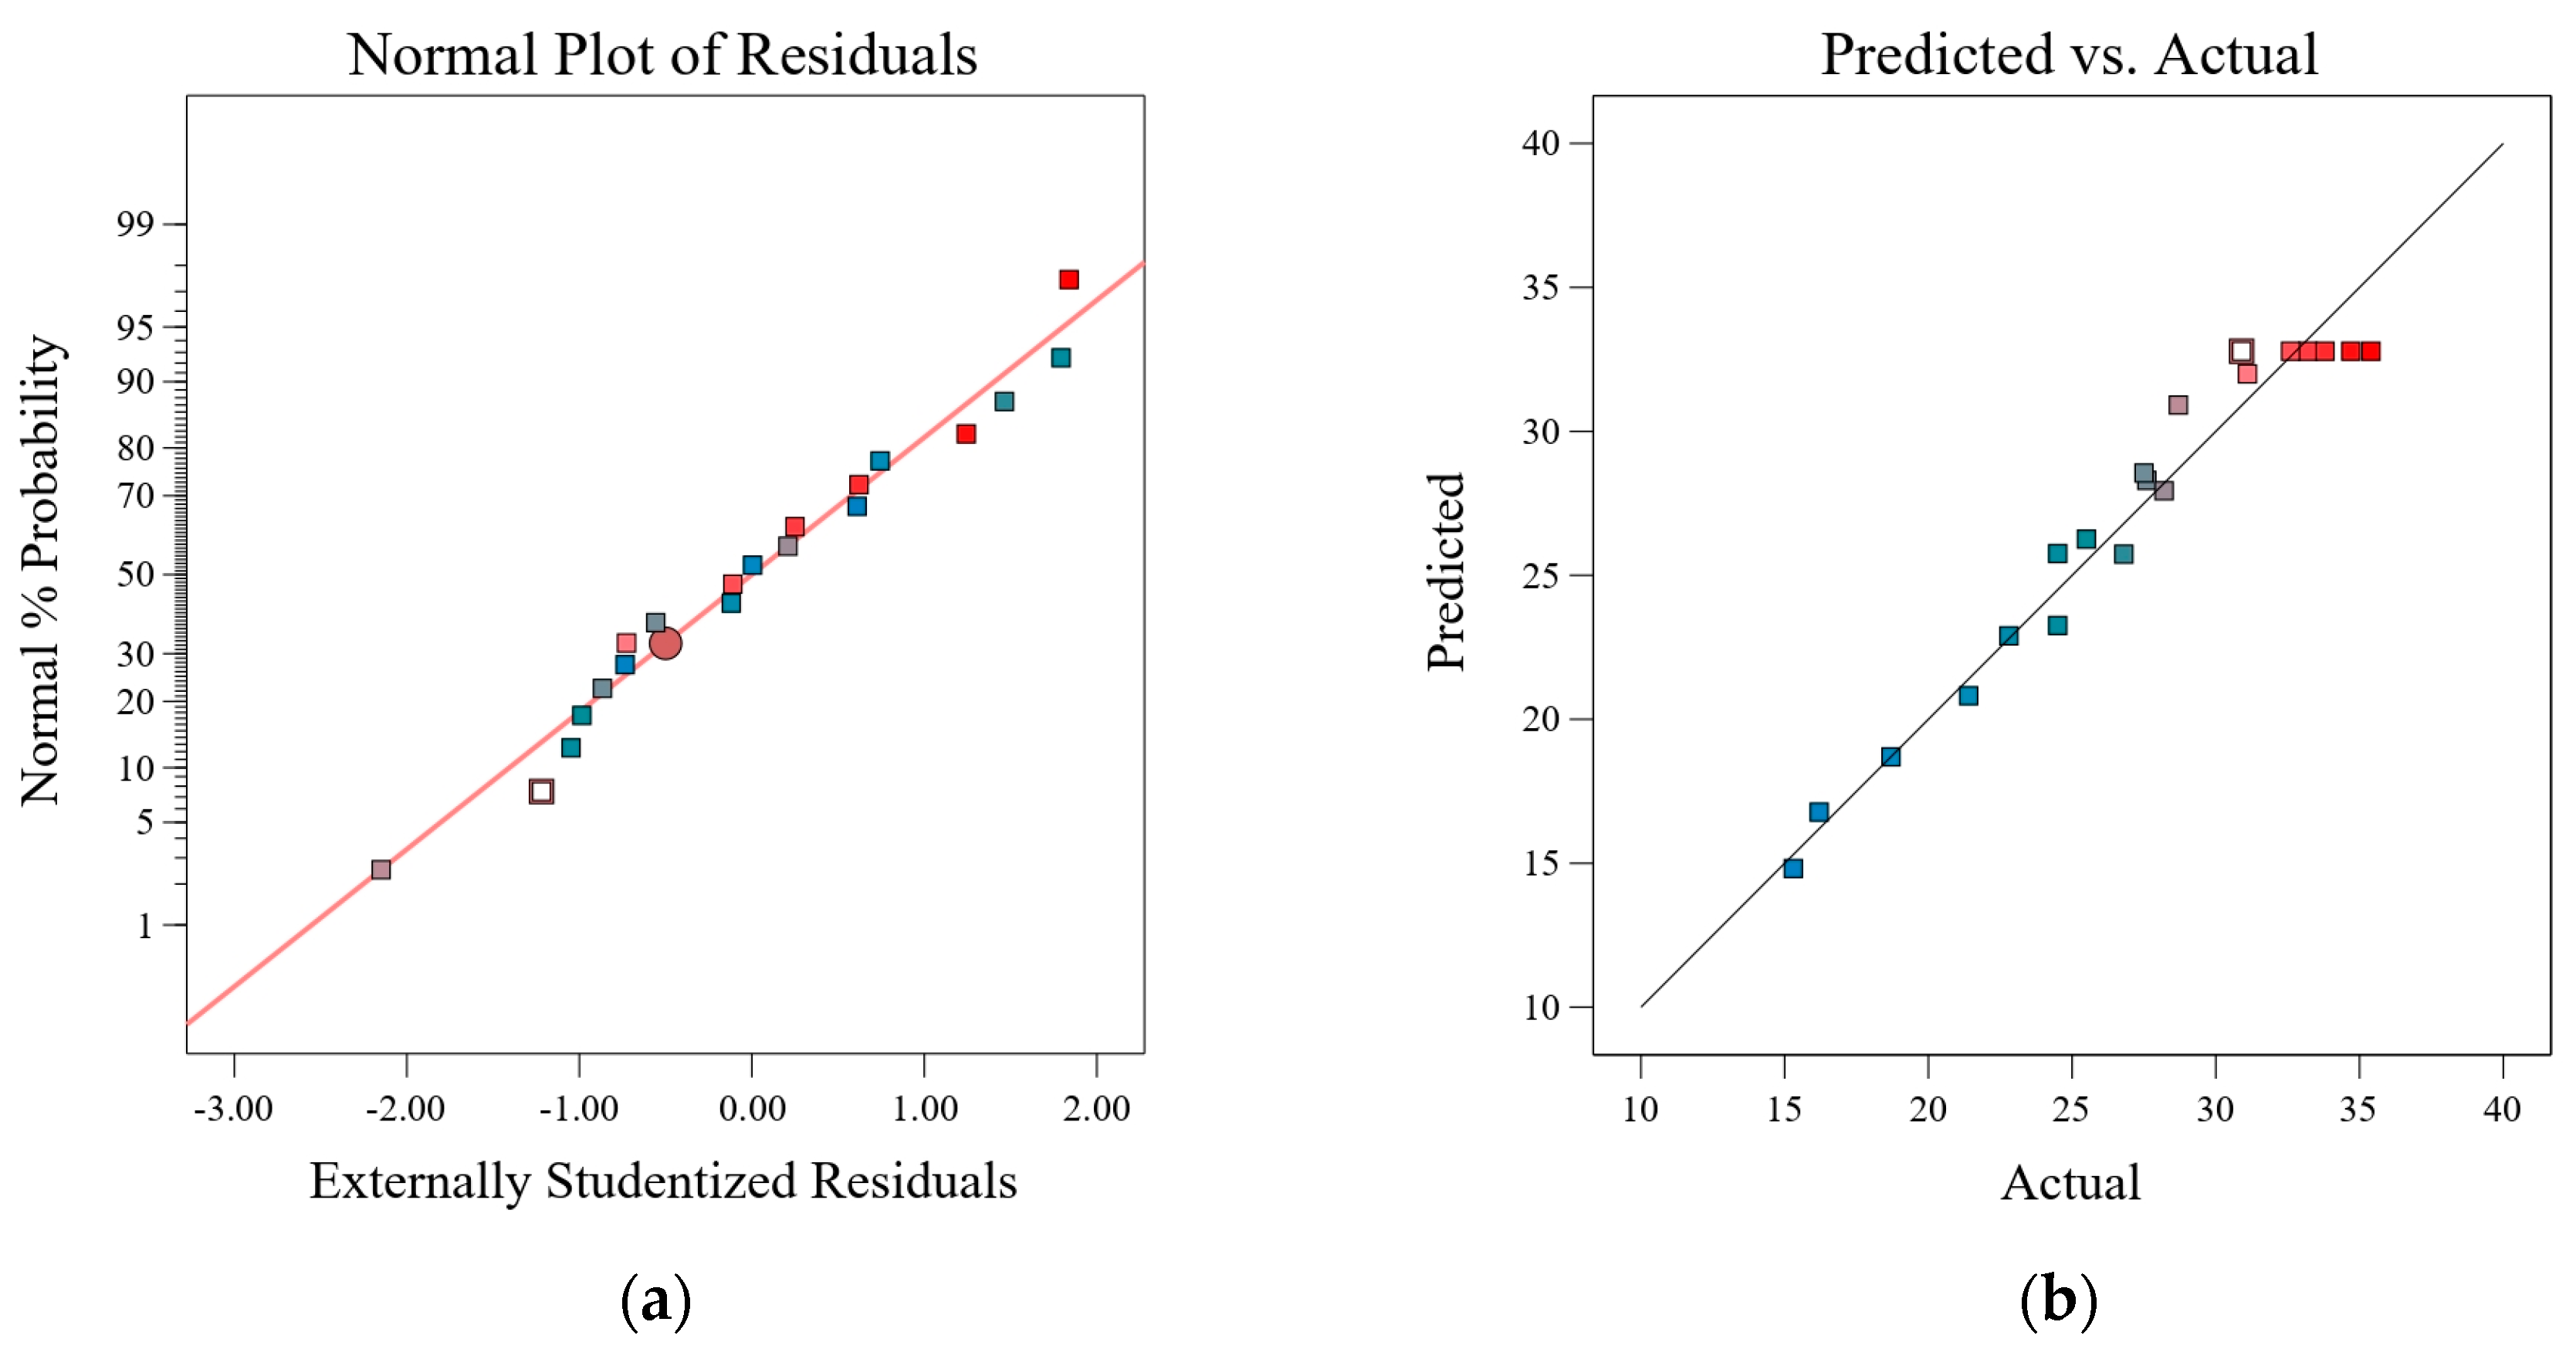
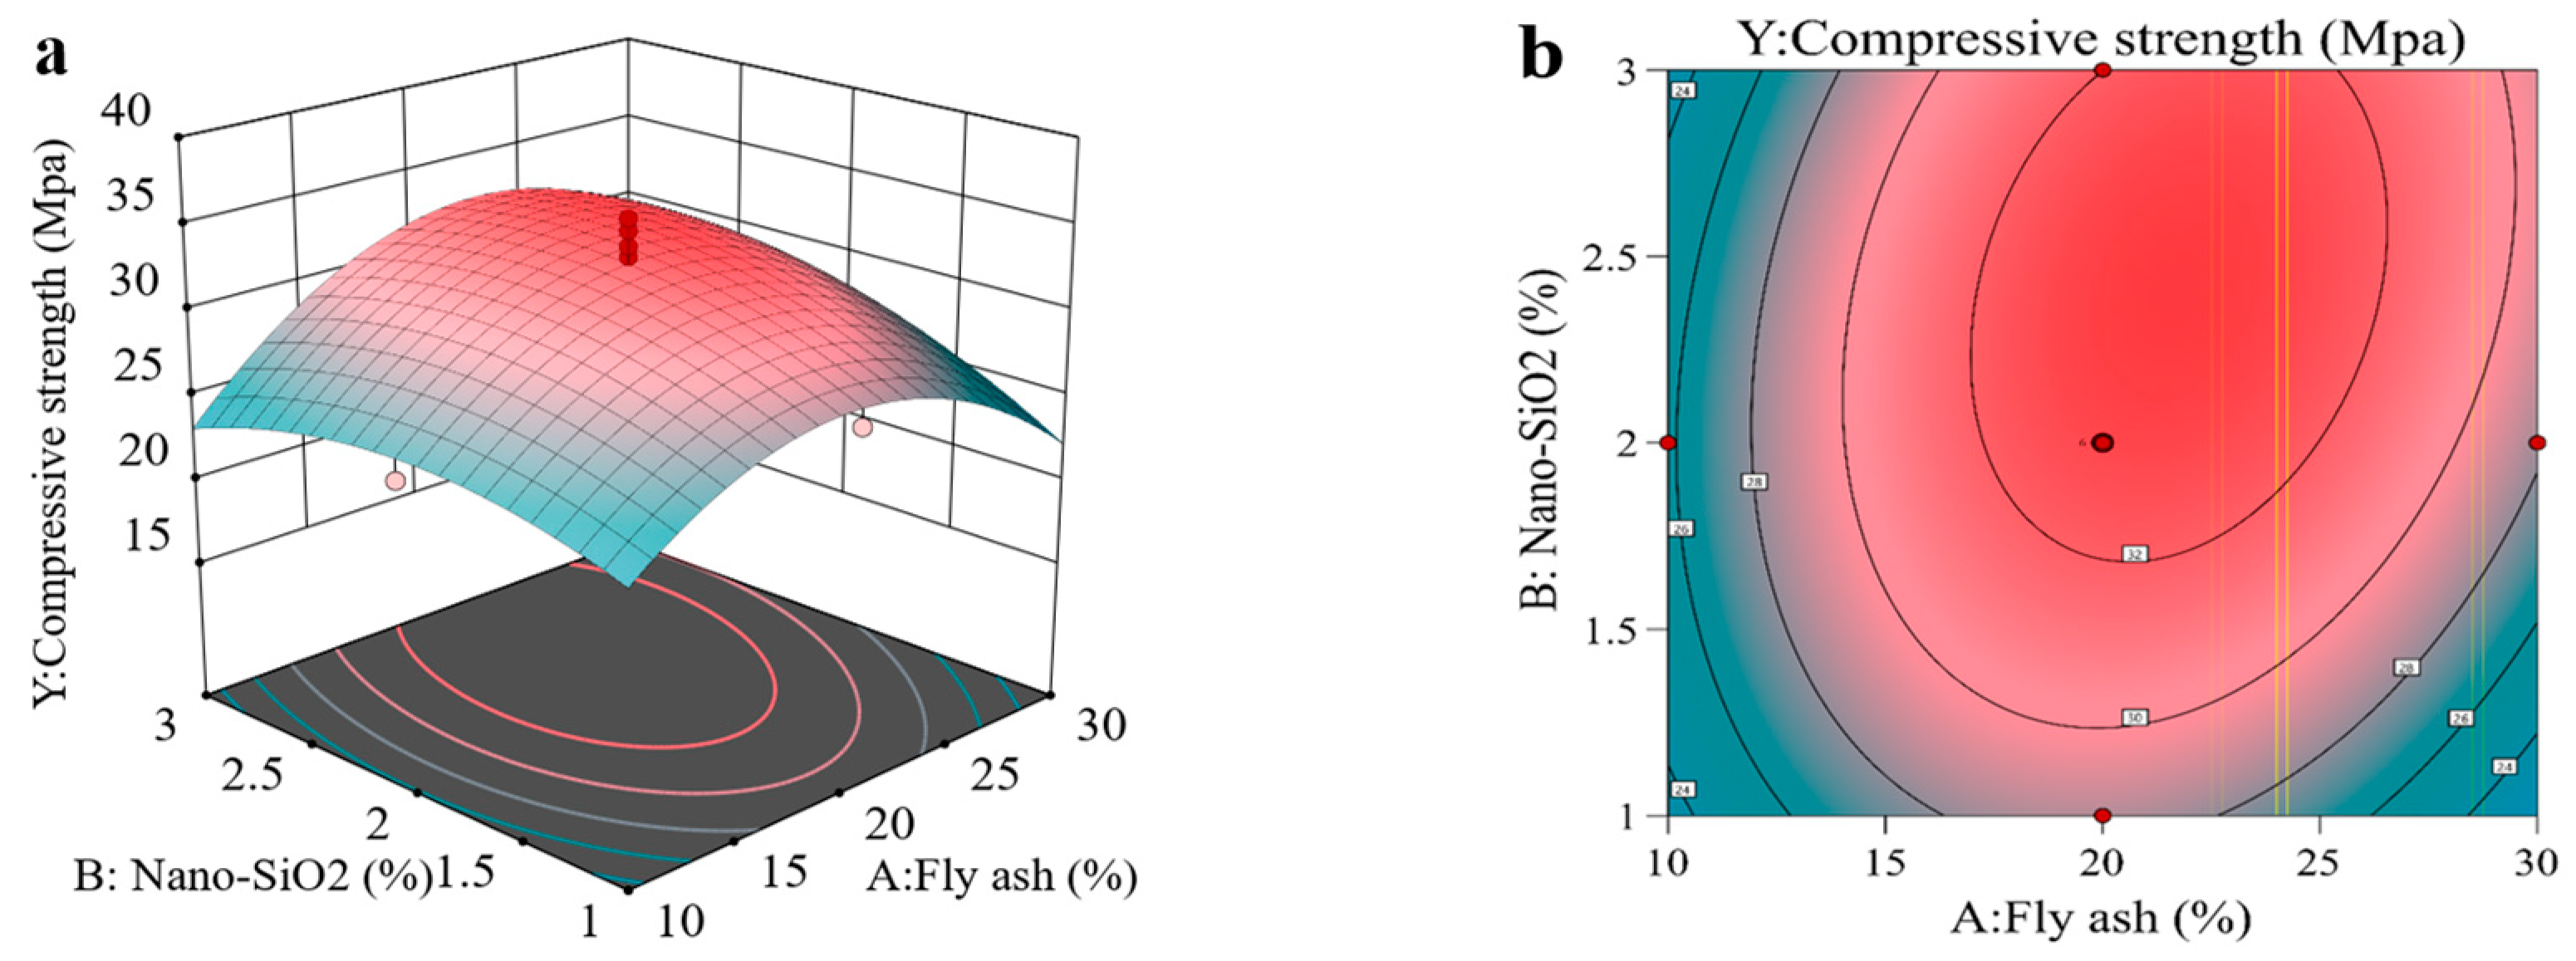
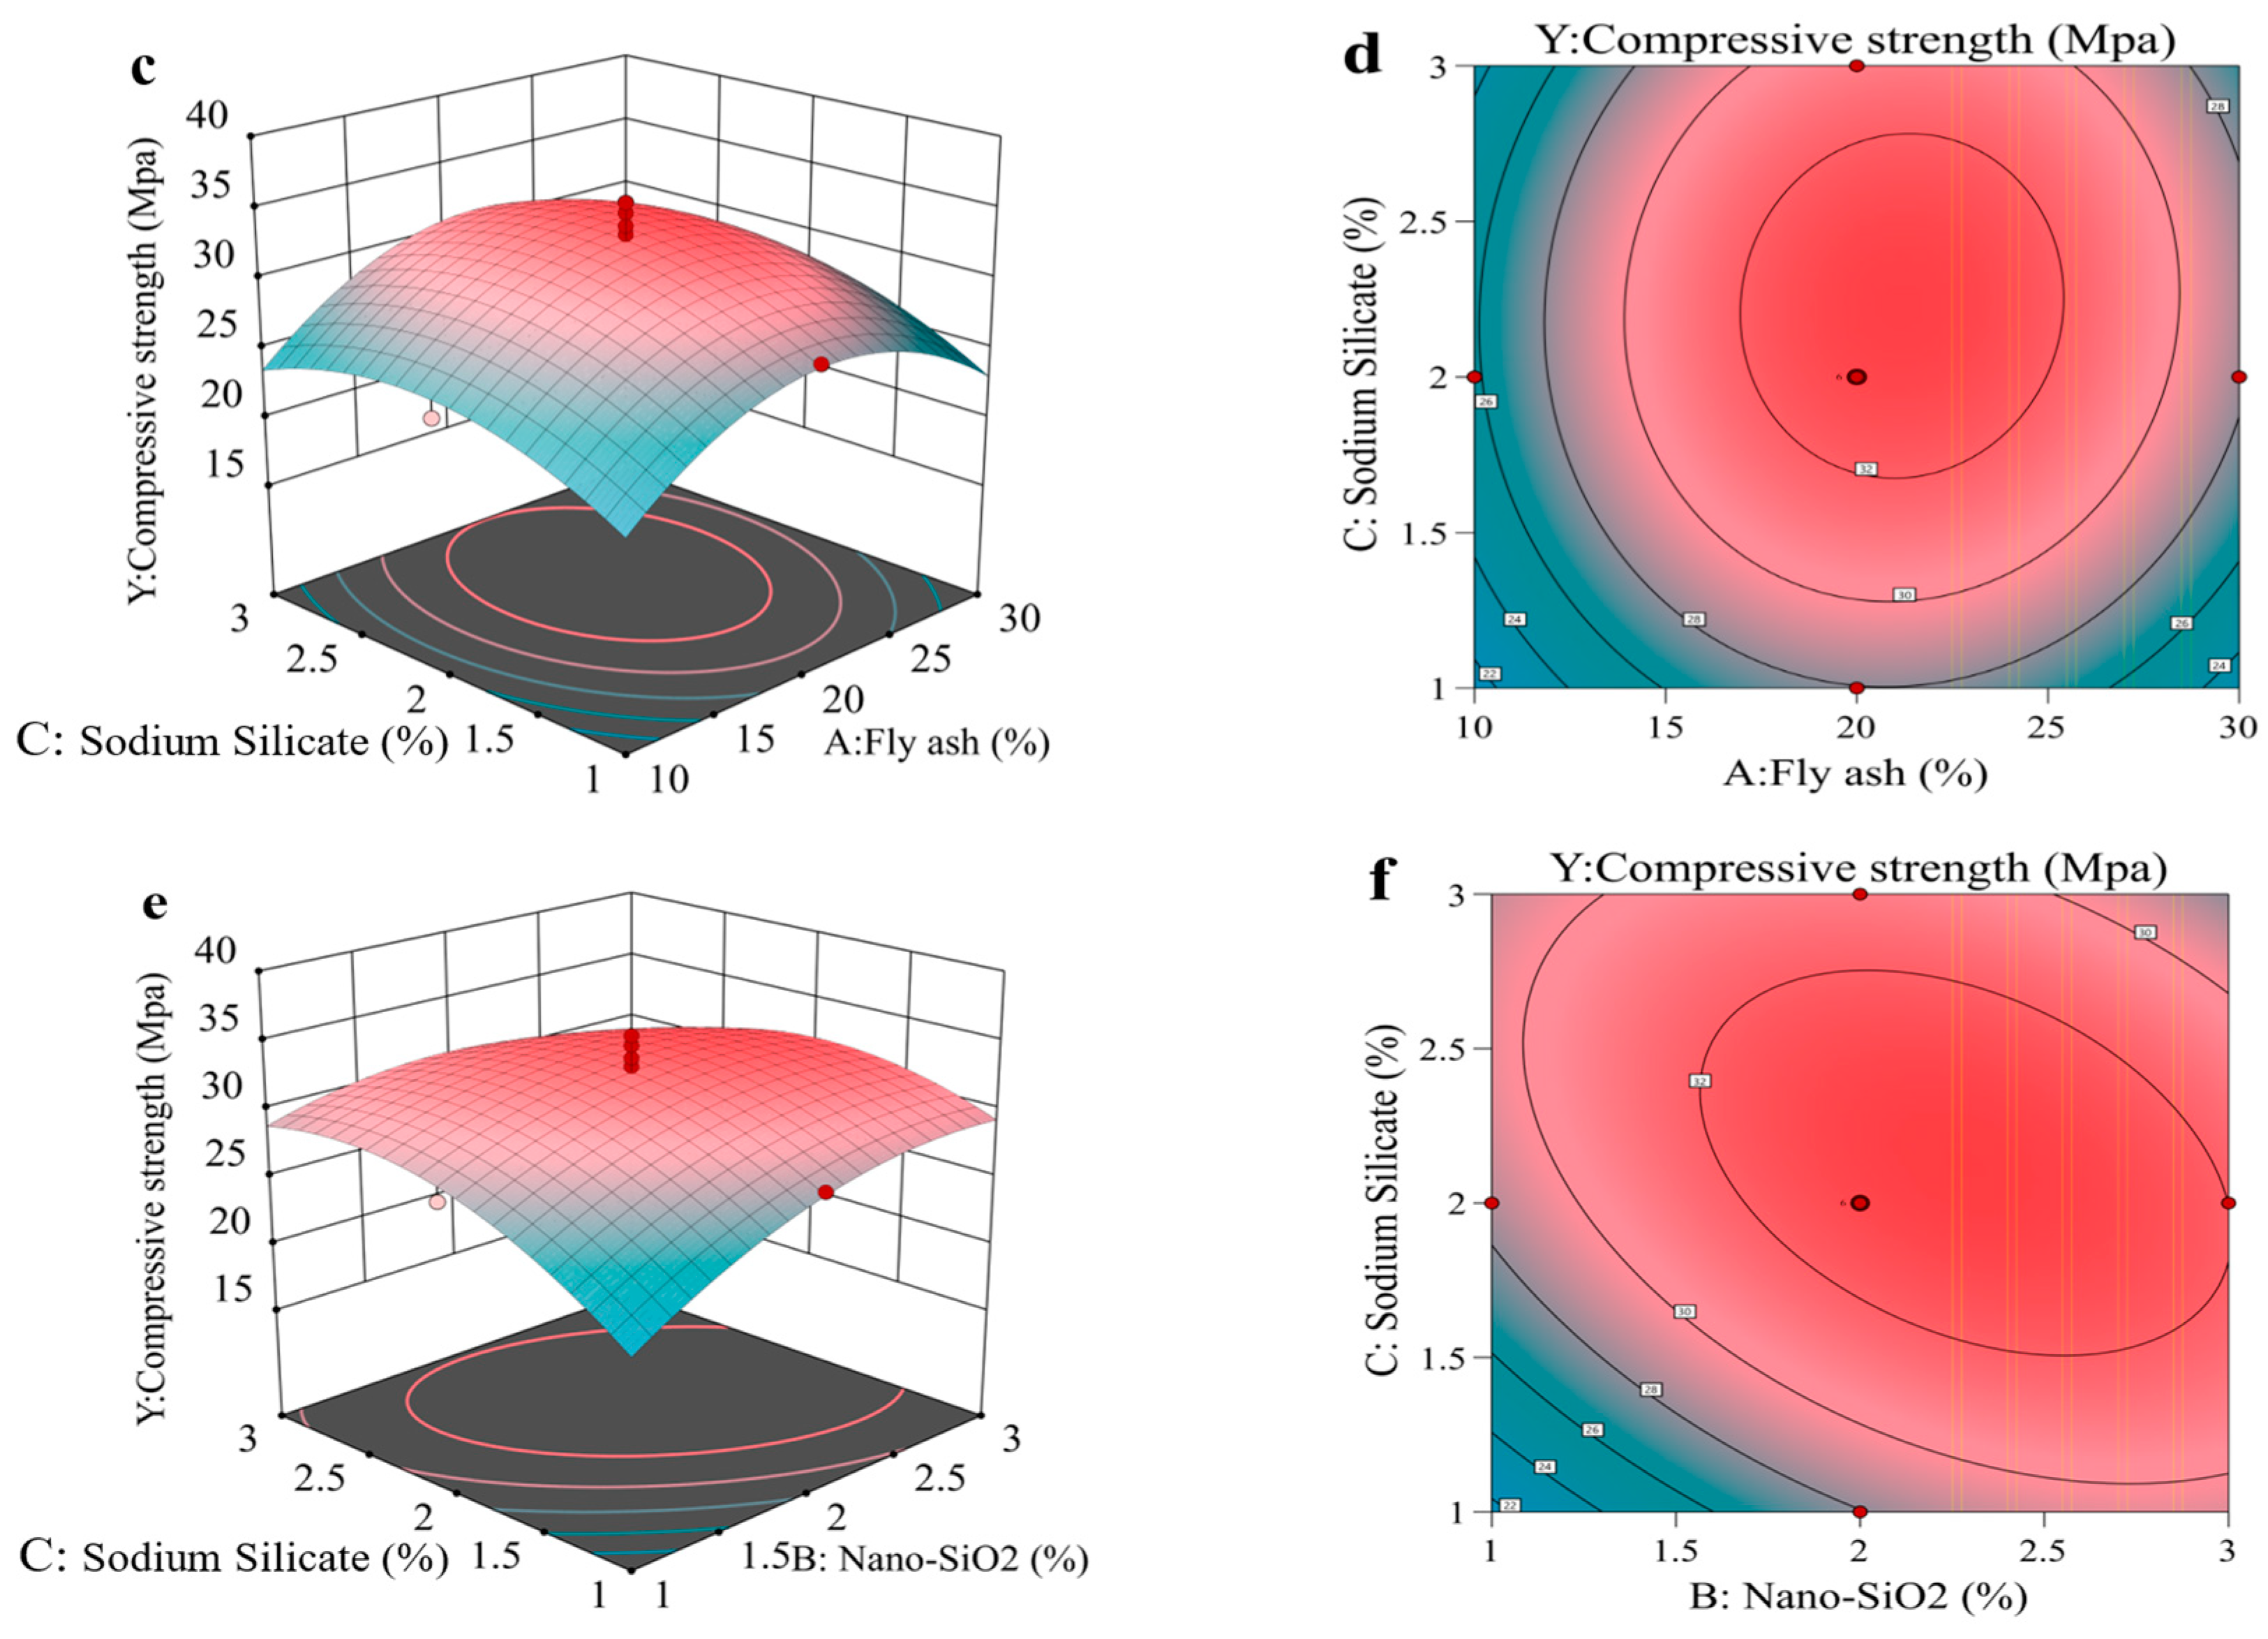
5.2. Optimization Design of Mix Ratio Based on Response Surface Methodology
5.3. Microscopic Characterization of SEM and XRD
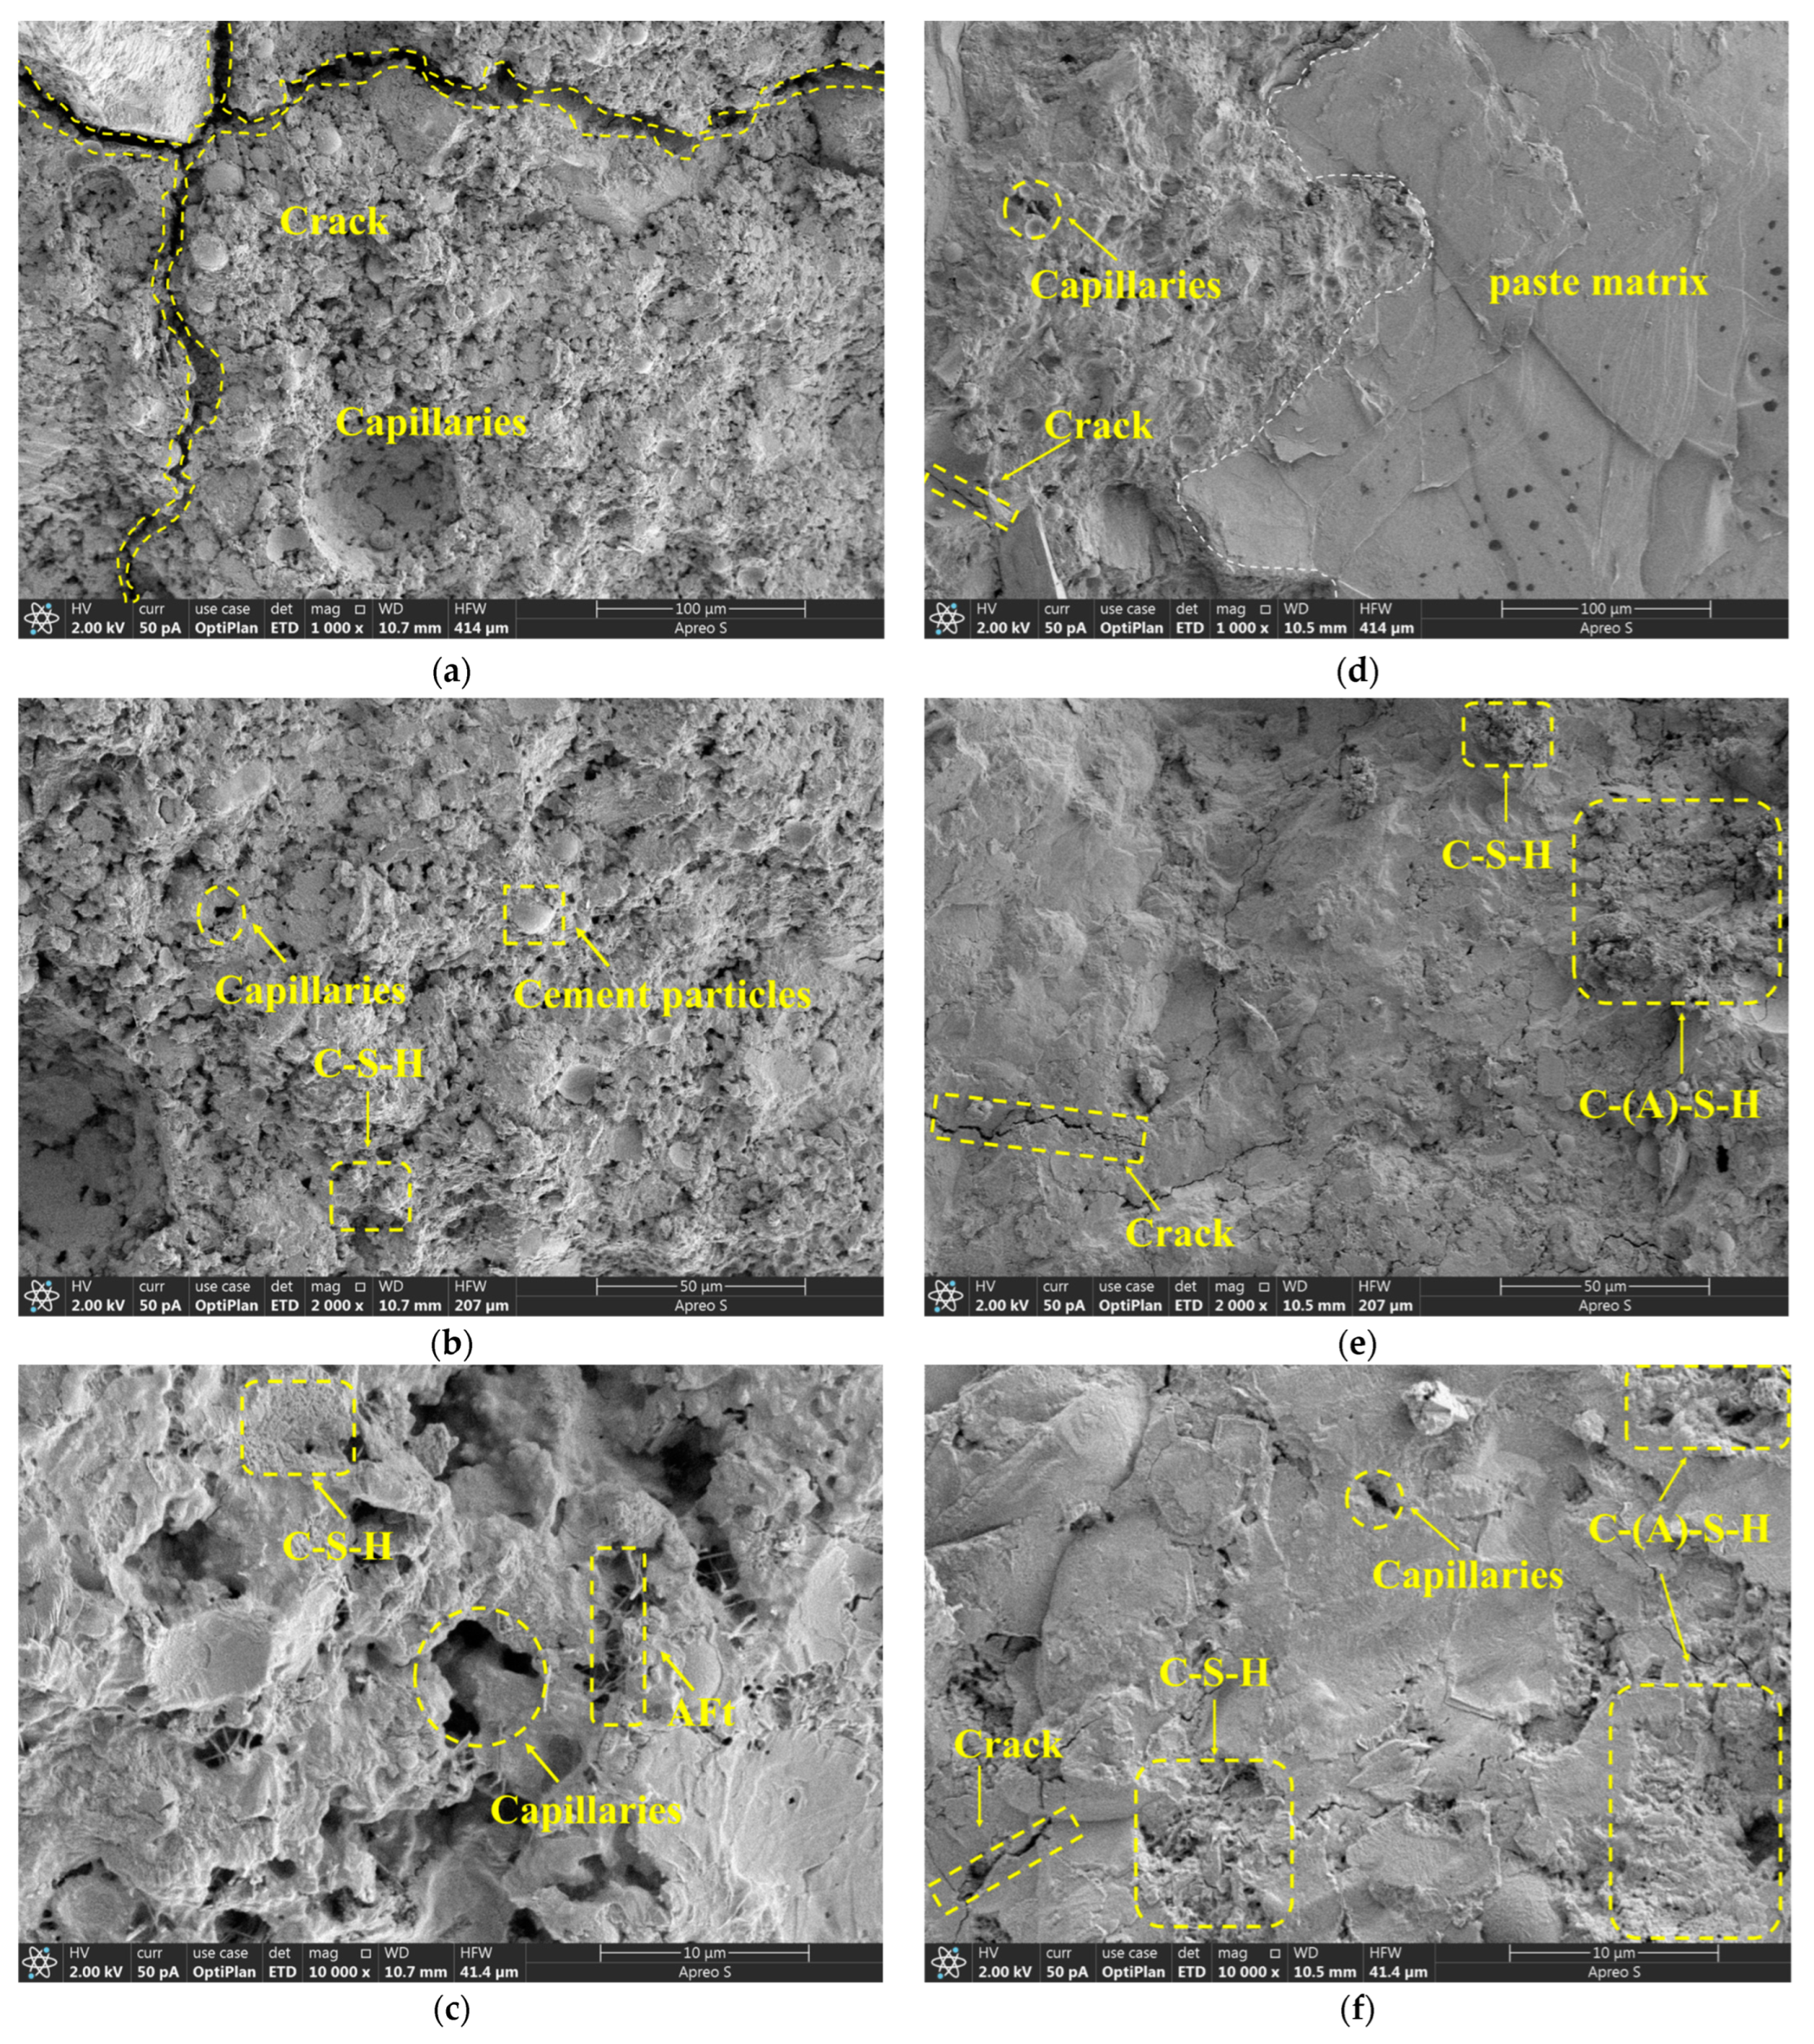
5.3.1. SEM Analysis
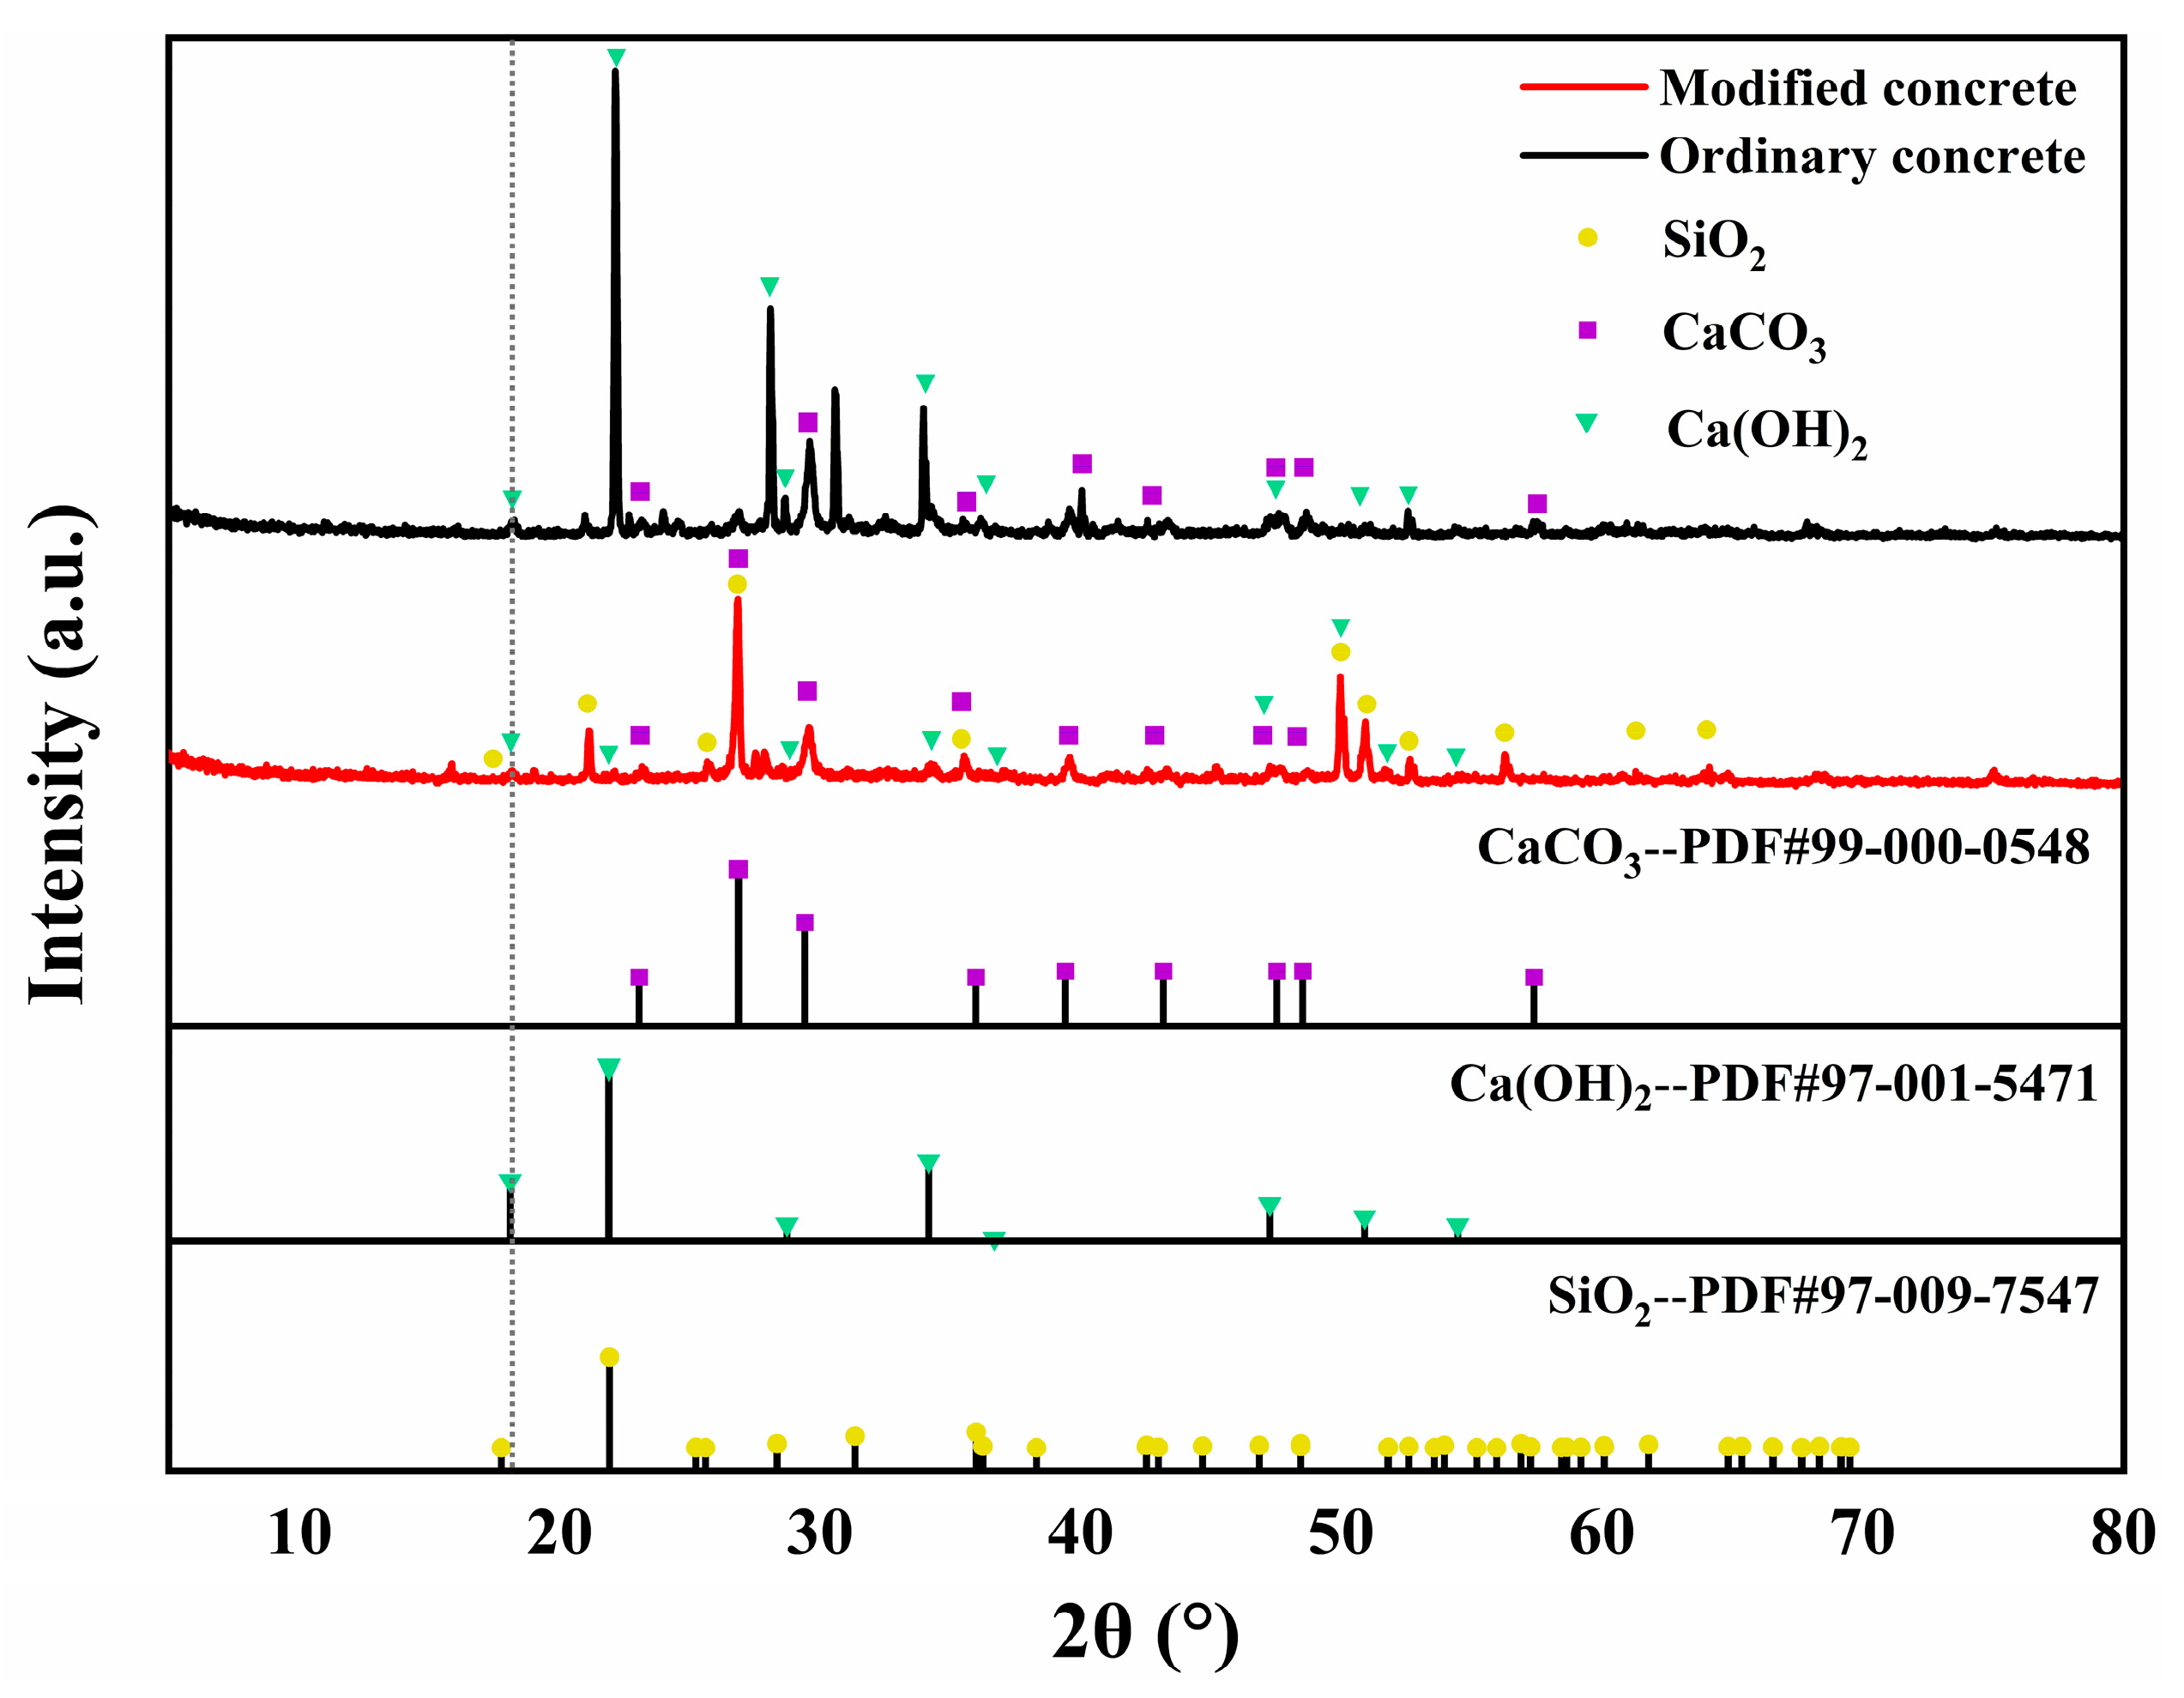
5.3.2. XRD Analysis
6. Conclusions
Author Contributions
Funding
Institutional Review Board Statement
Informed Consent Statement
Data Availability Statement
Conflicts of Interest
References
- Wu, S.B.; Shao, Z.; Andrew, R.M.; Bing, L.F.; Wang, J.Y.; Niu, L.; Liu, Z.; Xi, F.M. Global CO2 uptake by cement materials accounts 1930–2023. Sci. Data 2024, 11, 1409. [Google Scholar] [CrossRef] [PubMed]
- Yao, Z.T.; Ji, X.S.; Sarker, P.K.; Tang, J.H.; Ge, L.Q.; Xia, M.S.; Xi, Y.Q. A comprehensive review on the applications of coal fly ash. Earth-Sci. Rev. 2015, 141, 105–121. [Google Scholar] [CrossRef]
- Assi, L.N.; Deaver, E.; Elbatanouny, M.K.; Ziehl, P. Investigation of early compressive strength of fly ash-based geopolymer concrete. Constr. Build. Mater. 2016, 112, 807–815. [Google Scholar] [CrossRef]
- Liu, J.; An, R.; Jiang, Z.; Jin, H.S.; Zhu, J.H.; Liu, W.; Huang, Z.Y.; Xing, F.; Liu, J.Y.; Fan, X.; et al. Effects of w/b ratio, fly ash, limestone calcined clay, seawater and sea-sand on workability, mechanical properties, drying shrinkage behavior and micro-structural characteristics of concrete. Constr. Build. Mater. 2022, 321, 126333. [Google Scholar] [CrossRef]
- Yu, B.H. Study on Mechanical Properties and Durability of Fly Ash Concrete. Hans J. Civ. Eng. 2023, 12, 483–490. [Google Scholar] [CrossRef]
- Cui, Y.P.; Wang, L.C.; Liu, J.; Liu, R.Q.; Pang, B. Impact of particle size of fly ash on the early compressive strength of concrete: Experimental investigation and modelling. Constr. Build. Mater. 2022, 323, 126444. [Google Scholar] [CrossRef]
- Gu, Y.M.; Fang, Y.H.; You, D.; Gong, Y.F.; Zhu, C.H. Properties and microstructure of alkali-activated slag cement cured at below- and about-normal temperature. Constr. Build. Mater. 2015, 79, 1–8. [Google Scholar] [CrossRef]
- Said, A.M.; Zeidan, M.S.; Bassuoni, M.T.; Tian, Y. Properties of concrete incorporating nano-silica. Constr. Build. Mater. 2012, 36, 838–844. [Google Scholar] [CrossRef]
- Hosan, A.; Shaikh, F.U.A.; Sarker, P.; Aslani, F. Nano- and micro-scale characterisation of interfacial transition zone (ITZ) of high volume slag and slag-fly ash blended concretes containing nano SiO2 and nano CaCO3. Constr. Build. Mater. 2021, 269, 121311. [Google Scholar] [CrossRef]
- Vo, D.-H.; Tran Thi, K.-D.; Hwang, C.-L.; Liao, M.-C.; Hsu, W.-L.; Yehualaw, M.D. Mechanical properties of concrete produced with alkali-activated slag-fly ash and recycled concrete aggregate and designed using the densified mixture design algorithm (DMDA) method: Effects of recycled aggregate content and alkaline solution. Dev. Built Environ. 2023, 14, 100125. [Google Scholar] [CrossRef]
- Taylor, H.F.W. Cement Chemistry, 2nd ed.; Thomas Telford: London, UK, 1997. [Google Scholar]
- Davidovits, J. Geopolymers: Inorganic polymeric new materials. J. Therm. Anal. Calorim. 1991, 37, 1633–1656. [Google Scholar] [CrossRef]
- Song, Y.X.; Zhou, C.X.; Xue, H.J. Effect of alkali-activation on the strength and microstructure of fly ash concrete. J. Mater. Sci. Eng. 2024, 42, 254–261. [Google Scholar]
- Jing, J.H. The Experiment and Performance Calculation Method of Hybrid Fibers Reinforced Recycled Brick Aggregates Concrete. Master’s Thesis, Zhengzhou University, Zhengzhou, China, 2018; pp. 2–3. [Google Scholar]
- Ge, P.; Huang, W.; Li, M. Experimental study on recycled brick aggregate concrete frame model. J. Zhejiang Univ. Eng. Sci. 2021, 55, 10–19. [Google Scholar]
- JGJ 55-2011; Specification for Mix Proportion Design of Ordinary Concrete. The State Bureau of Quality and Technical Supervision of the People’s Republic of China: Beijing, China, 2011.
- Xu, Y.; Li, M.L.; Zhao, X.M. The response curved surface regression analysis technique: The application of a new regression analysis technique in materials research. Rare Met. Mater. Eng. 2001, 30, 428–432. [Google Scholar]
- Li, L.; Zhang, S.; He, Q. Application of response surface methodology in experiment design and optimization. Res. Explor. Lab. 2015, 34, 41–45. [Google Scholar]
- Taherkhani, H.; Noorian, F. Investigating permanent deformation of recycled asphalt concrete containing waste oils as rejuvenator using response surface methodology (RSM). Iran. J. Sci. Technol. Trans. Civ. Eng. 2020, 45, 1989–2001. [Google Scholar] [CrossRef]
- Lu, G.J.; Ji, T. Mechanical properties of ternary polymer mortar based on response surface method. J. Build. Mater. 2021, 24, 970–976. [Google Scholar]
- Wang, J.W.; Wang, W. Response surface based multi-objective optimization of basalt fiber reinforced foamed concrete. Mater. Rep. 2019, 33, 4092–4097. [Google Scholar]
- Wang, A.G.; Huang, M.; Chu, Y.J.; Zhu, Y.C.; Liu, K.W.; Guo, L.P.; Liu, P.; Sun, D.S. Optimization of mix proportion of basic magnesium sulfate cement-based high-strength coral concrete. Constr. Build. Mater. 2022, 341, 127709. [Google Scholar] [CrossRef]
- Zhang, Q.Y.; Feng, X.J.; Chen, X.D. Mix design for recycled aggregate pervious concrete based on response surface methodology. Constr. Build. Mater. 2020, 259, 119776. [Google Scholar] [CrossRef]
- GB/T 50080-2016; Standard for Test Method of Performance on Ordinary Fresh Concrete. The State Bureau of Quality and Technical Supervision of the People’s Republic of China: Beijing, China, 2020.
- GB/T 50081-2019; Standard for Test Method of Mechanical Properties on Ordinary Concrete. The State Bureau of Quality and Technical Supervision of the People’s Republic of China: Beijing, China, 2019.

| Index | Na2O Content | SiO2 Content | Modulus | Whiteness | Bulk Density |
|---|---|---|---|---|---|
| Detect | 21.84% | 60.71% | 2.87 | 98.47% | 0.56 g/cm3 |
| Index | SiO2 | Specific Surface Area | Tap Density | PH of Suspension | Chloride | Al2O3 | TiO2 | Fe2O3 |
|---|---|---|---|---|---|---|---|---|
| Detect | 99.87% | 125.00 m2/g | 59.00 g/L | 4.45 | 45.00% | 12.00% | 10.00% | 7.00% |
| Index | Al2O3 | SiO2 | SO3 | CaO | Iron Content | Alkali Content | Water Content | Density | Bulk Density |
|---|---|---|---|---|---|---|---|---|---|
| Detect | 36.80% | 45.10% | 1.20% | 4.50% | 0.85% | 0.75% | 0.40% | 2.10 g/cm3 | 1.10 g/cm3 |
| Water | Cement | Fine Aggregates | Coarse Aggregates | Sodium Silicate | Nano-SiO2 | Fly Ash | Water-Reducing Agent |
|---|---|---|---|---|---|---|---|
| 210.0 | 420.0 | 680.0 | 1150.0 | 0 | 0 | 0 | 4.2 |
| 369.6 | 4.2 | 4.2 | 42.0 | ||||
| 340.2 | 8.4 | 8.4 | 63.0 | ||||
| 310.8 | 12.6 | 12.6 | 84.0 | ||||
| 281.4 | 16.8 | 16.8 | 105.0 | ||||
| 252.0 | 21.0 | 21.0 | 126.0 |
| Level | Factor | ||
|---|---|---|---|
| A (%) | B (%) | C (%) | |
| −1 | 10.0 | 1.0 | 1.0 |
| 0 | 20.0 | 2.0 | 2.0 |
| 1 | 30.0 | 3.0 | 3.0 |
| Specimen Number | Variable Value | Coding Level | ||||
|---|---|---|---|---|---|---|
| A (%) | B (%) | C (%) | A (%) | B (%) | C (%) | |
| 1 | 20 | 2 | 1 | 0 | 0 | −1 |
| 2 | 20 | 1 | 2 | 0 | −1 | 0 |
| 3 | 20 | 2 | 2 | 0 | 0 | 0 |
| 4 | 10 | 1 | 3 | −1 | −1 | 1 |
| 5 | 10 | 3 | 1 | −1 | 1 | −1 |
| 6 | 20 | 2 | 2 | 0 | 0 | 0 |
| 7 | 30 | 1 | 3 | 1 | −1 | 1 |
| 8 | 20 | 2 | 2 | 0 | 0 | 0 |
| 9 | 20 | 2 | 2 | 0 | 0 | 0 |
| 10 | 30 | 3 | 3 | 1 | 1 | 1 |
| 11 | 30 | 2 | 2 | 1 | 0 | 0 |
| 12 | 20 | 2 | 3 | 0 | 0 | 1 |
| 13 | 20 | 2 | 2 | 0 | 0 | 0 |
| 14 | 30 | 3 | 1 | 1 | 1 | −1 |
| 15 | 30 | 1 | 1 | 1 | −1 | −1 |
| 16 | 10 | 1 | 1 | −1 | −1 | −1 |
| 17 | 10 | 2 | 2 | −1 | 0 | 0 |
| 18 | 10 | 3 | 3 | −1 | 1 | 1 |
| 19 | 20 | 2 | 2 | 0 | 0 | 0 |
| 20 | 20 | 3 | 2 | 0 | 1 | 0 |
| Parameters to Be Optimized | Range of Values | Target Value | |
|---|---|---|---|
| Min Value | Max Value | ||
| A (%) | 10.0 | 30.0 | 10.0–30.0 |
| B (%) | 1.0 | 3.0 | 1.0–3.0 |
| C (%) | 1.0 | 3.0 | 1.0–3.0 |
| Y (MPa) | 15.3 | 35.4 | Maximum value |
| Specimen Number | Factor | Compressive Strength (MPa) | |||
|---|---|---|---|---|---|
| A (%) | B (%) | C (%) | Measured Values | Predicted Value | |
| 1 | 20.0 | 2.0 | 1.0 | 28.2 | 27.9 |
| 2 | 20.0 | 1.0 | 2.0 | 27.5 | 28.1 |
| 3 | 20.0 | 2.0 | 2.0 | 33.2 | 32.8 |
| 4 | 10.0 | 1.0 | 3.0 | 24.5 | 23.3 |
| 5 | 10.0 | 3.0 | 1.0 | 21.4 | 20.8 |
| 6 | 20.0 | 2.0 | 2.0 | 35.4 | 32.8 |
| 7 | 30.0 | 1.0 | 3.0 | 22.8 | 22.9 |
| 8 | 20.0 | 2.0 | 2.0 | 30.9 | 32.8 |
| 9 | 20.0 | 2.0 | 2.0 | 32.6 | 32.8 |
| 10 | 30.0 | 3.0 | 3.0 | 26.8 | 25.7 |
| 11 | 30.0 | 2.0 | 2.0 | 27.6 | 28.3 |
| 12 | 20.0 | 2.0 | 3.0 | 28.7 | 30.9 |
| 13 | 20.0 | 2.0 | 2.0 | 33.8 | 32.8 |
| 14 | 30.0 | 3.0 | 1.0 | 25.5 | 26.3 |
| 15 | 30.0 | 1.0 | 1.0 | 15.3 | 14.8 |
| 16 | 10.0 | 1.0 | 1.0 | 16.2 | 16.8 |
| 17 | 10.0 | 2.0 | 2.0 | 24.5 | 25.8 |
| 18 | 10.0 | 3.0 | 3.0 | 18.7 | 18.7 |
| 19 | 20.0 | 2.0 | 2.0 | 34.7 | 32.8 |
| 20 | 20.0 | 3.0 | 2.0 | 31.1 | 32.0 |
| Data Sources | Sum of Squares | Degree of Freedom | Mean Square | F-Value | p-Value | Significant or Not |
|---|---|---|---|---|---|---|
| Y | 640.63 | 9.00 | 71.78 | 25.05 | <0.0001 | Yes |
| A | 16.13 | 1.00 | 16.13 | 5.68 | 0.04 | Yes |
| B | 29.58 | 1.00 | 29.58 | 10.41 | 0.01 | Yes |
| C | 22.20 | 1.00 | 22.20 | 7.81 | 0.02 | Yes |
| AB | 27.38 | 1.00 | 27.38 | 9.64 | 0.01 | Yes |
| AC | 1.28 | 1.00 | 1.28 | 0.45 | 0.52 | No |
| BC | 36.98 | 1.00 | 36.98 | 13.01 | 0.01 | Yes |
| A2 | 91.92 | 1.00 | 91.92 | 32.10 | 0.0002 | Yes |
| B2 | 17.31 | 1.00 | 17.31 | 6.09 | 0.03 | Yes |
| C2 | 31.03 | 1.00 | 31.03 | 10.92 | 0.01 | Yes |
| Residual | 28.42 | 10.00 | 2.84 | - | - | - |
| Lack-of-fit | 15.64 | 5.00 | 3.13 | 1.22 | 0.42 | No |
| Pure Error | 12.77 | 5.00 | 2.55 | - | - | - |
| Total Variation | 669.04 | 19.00 | - | - | - | - |
| Model | Standard Deviation | Average | Correlation-R2 | Adjustment-Ra2 | Prediction-Rp2 | Coefficient of Variation | Signal-to-Noise Ratio |
|---|---|---|---|---|---|---|---|
| Y | 1.69 | 26.97 | 0.96 | 0.92 | 0.77 | 6.25% | 15.07 |
| Mix Ratio Number | Fly Ash Content | Nano-SiO2 Content | Sodium Silicate Content | Compressive Strength | Desirability Function |
|---|---|---|---|---|---|
| Ⅰ | 21.7% | 2.4% | 2.1% | 33.3 MPa | 0.9 |
| Y | E | |
|---|---|---|
| Predicted Value | Experimental Values | |
| 33.3 MPa | 34.8 MPa | 4.5% |
Disclaimer/Publisher’s Note: The statements, opinions and data contained in all publications are solely those of the individual author(s) and contributor(s) and not of MDPI and/or the editor(s). MDPI and/or the editor(s) disclaim responsibility for any injury to people or property resulting from any ideas, methods, instructions or products referred to in the content. |
© 2025 by the authors. Licensee MDPI, Basel, Switzerland. This article is an open access article distributed under the terms and conditions of the Creative Commons Attribution (CC BY) license (https://creativecommons.org/licenses/by/4.0/).
Share and Cite
Sun, Q.; Wei, X.; Cai, R.; Li, D. Study on the Properties of Alkali-Excited Concrete Modified by Nano-SiO2 Based on Response Surface Methodology. Materials 2025, 18, 2292. https://doi.org/10.3390/ma18102292
Sun Q, Wei X, Cai R, Li D. Study on the Properties of Alkali-Excited Concrete Modified by Nano-SiO2 Based on Response Surface Methodology. Materials. 2025; 18(10):2292. https://doi.org/10.3390/ma18102292
Chicago/Turabian StyleSun, Qiao, Xin Wei, Renjie Cai, and Dongwei Li. 2025. "Study on the Properties of Alkali-Excited Concrete Modified by Nano-SiO2 Based on Response Surface Methodology" Materials 18, no. 10: 2292. https://doi.org/10.3390/ma18102292
APA StyleSun, Q., Wei, X., Cai, R., & Li, D. (2025). Study on the Properties of Alkali-Excited Concrete Modified by Nano-SiO2 Based on Response Surface Methodology. Materials, 18(10), 2292. https://doi.org/10.3390/ma18102292