
A Fast and Efficient Hydrogen Chloride Sensor Based on a Polymer Composite Film Using a Novel Schiff-Based Triphenylamine Molecule as the Probe


Abstract

1. Introduction
2. Materials and Methods
2.1. Materials
2.2. Synthesis of Schiff-Based Triphenylamine Derivatives
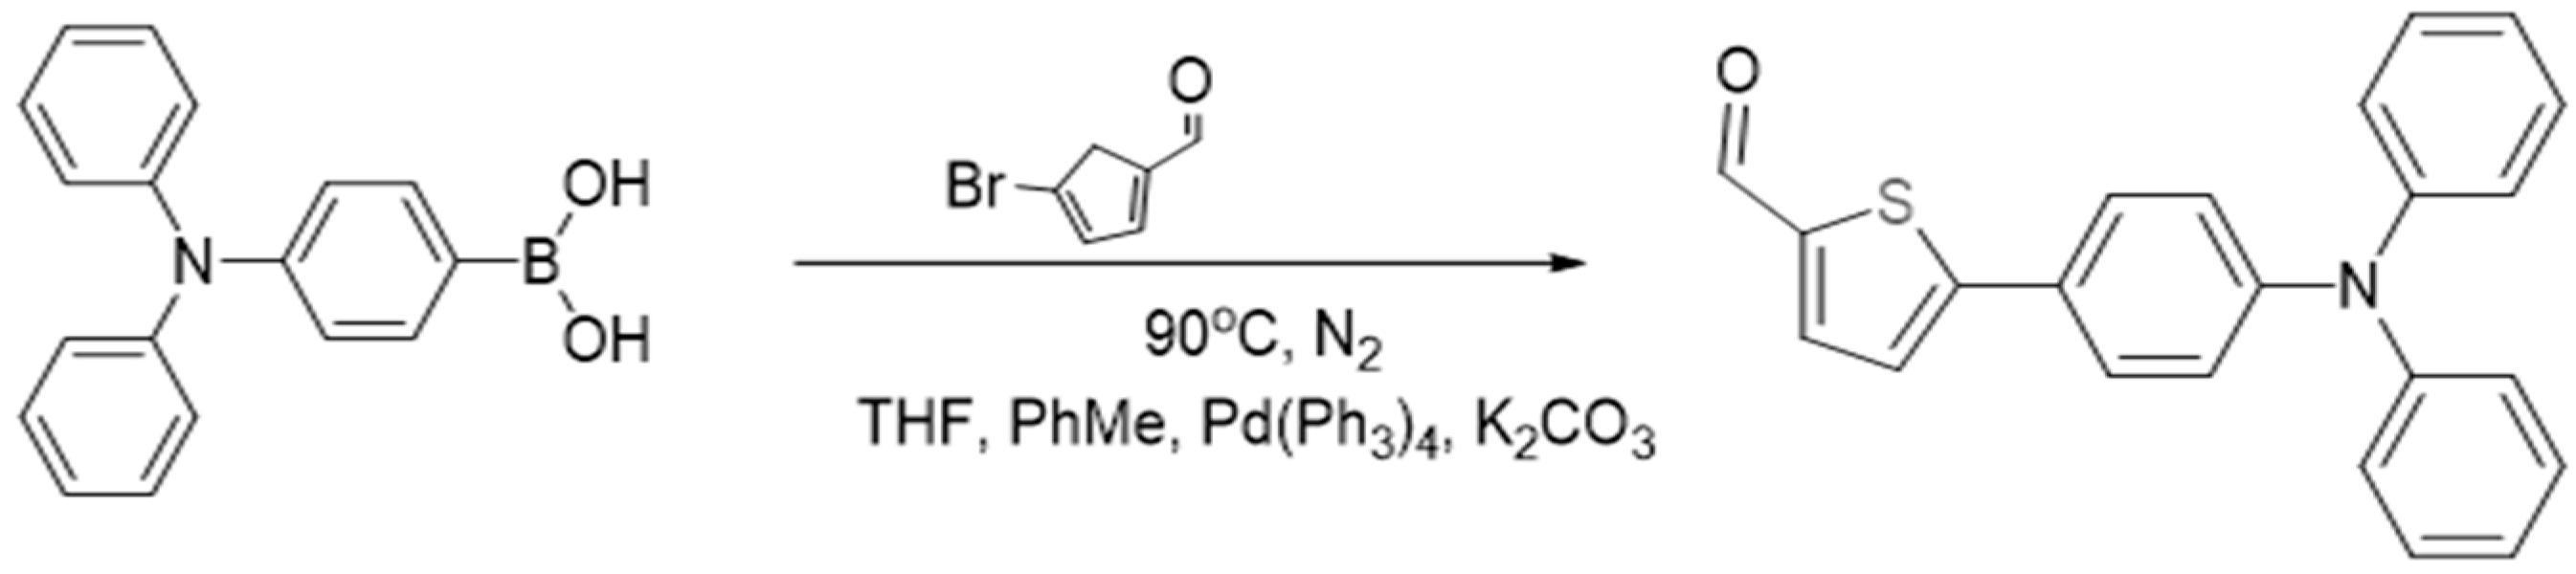
2.2.1. Synthesis of 5-(4-(Diphenylamino)phenyl)thiophene-2-carbaldehyde
2.2.2. Synthesis of N,N-Diphenyl-4,4′-biphenyldiamine
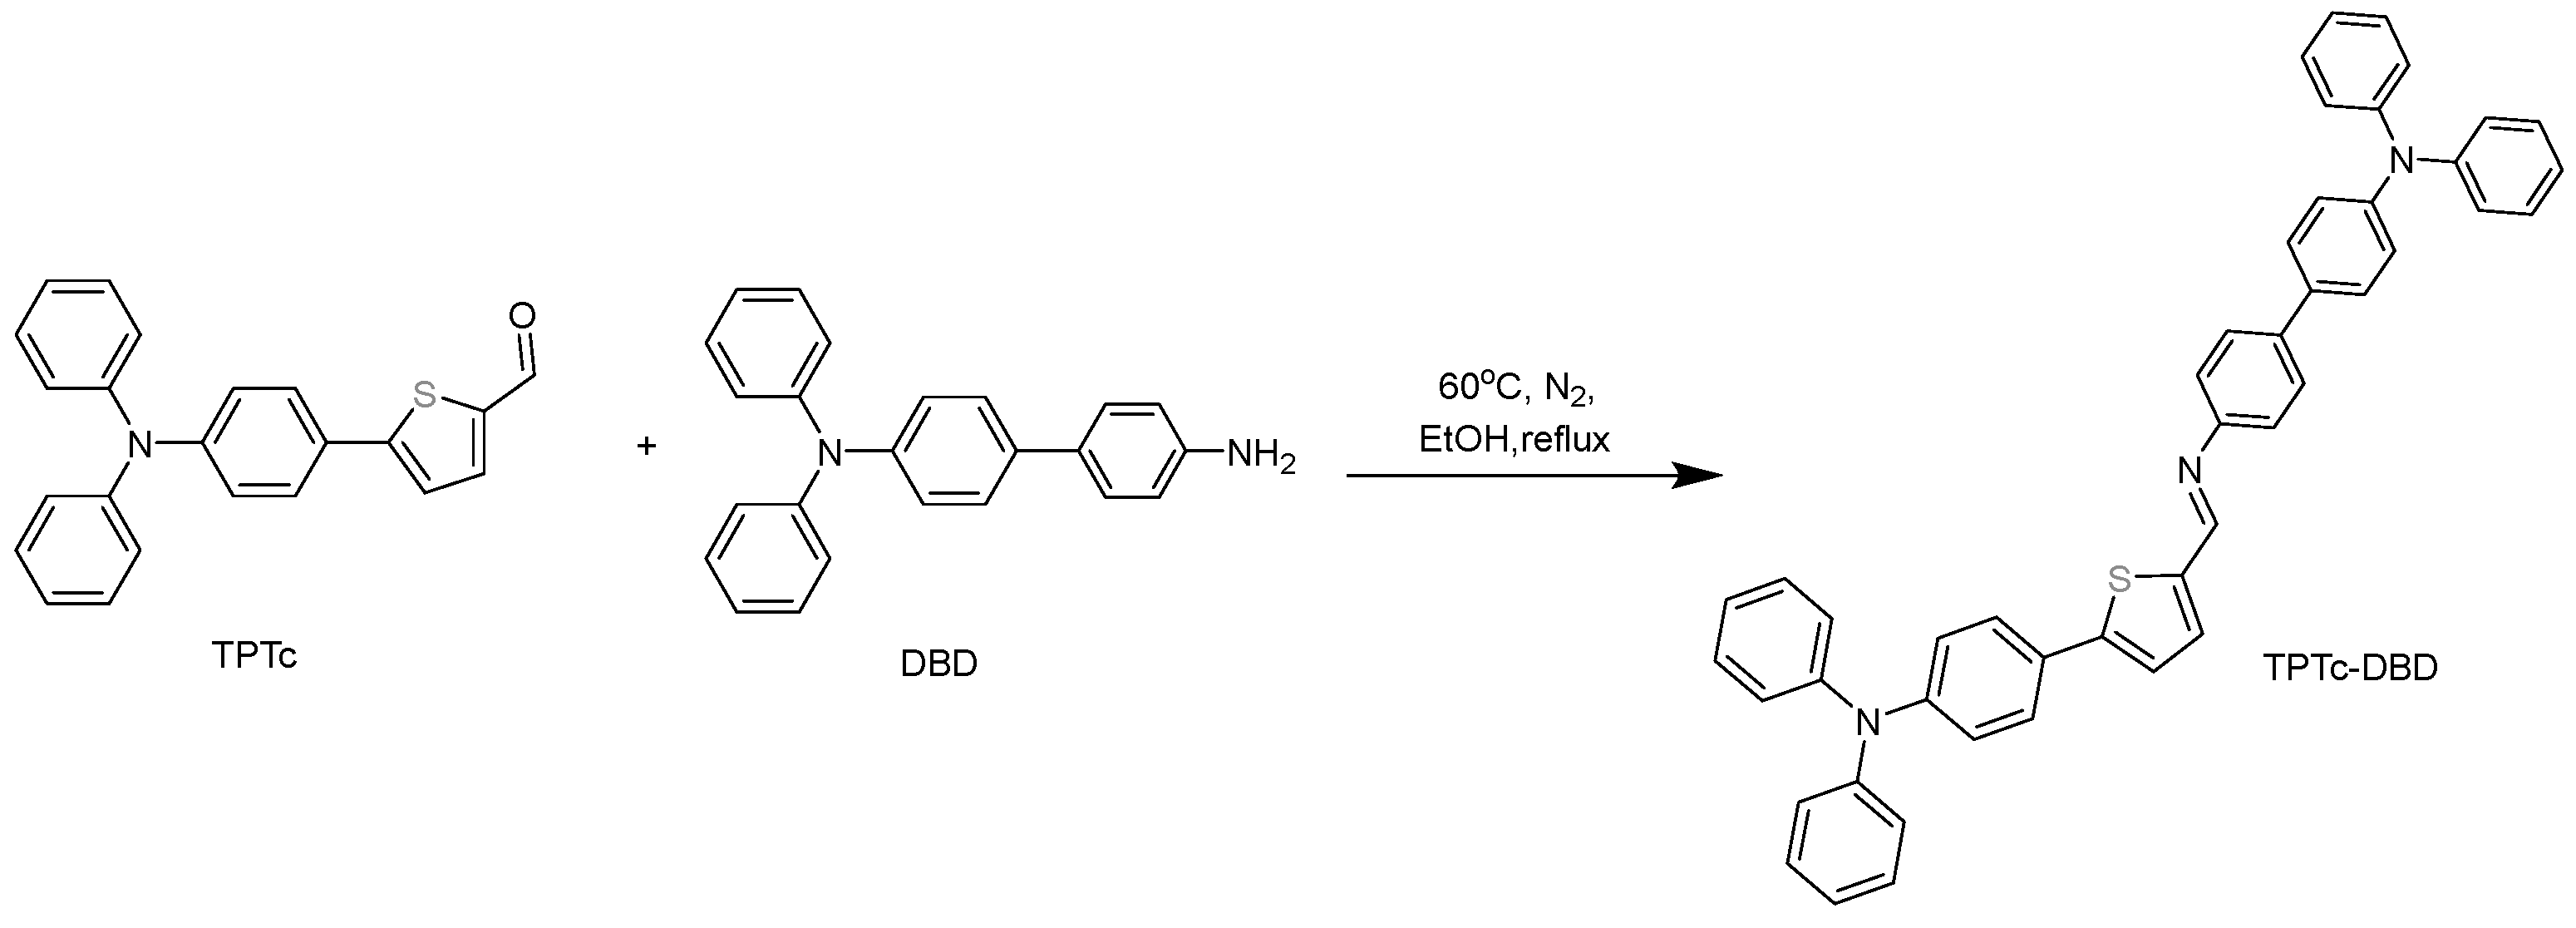
2.2.3. Synthesis of TPTc-DBD
2.2.4. Preparation of TPTc-DBD/PVDF Composite Porous Film
2.2.5. Preparation of the HCl Gas Detection Device
2.3. Methods
3. Results and Discussion
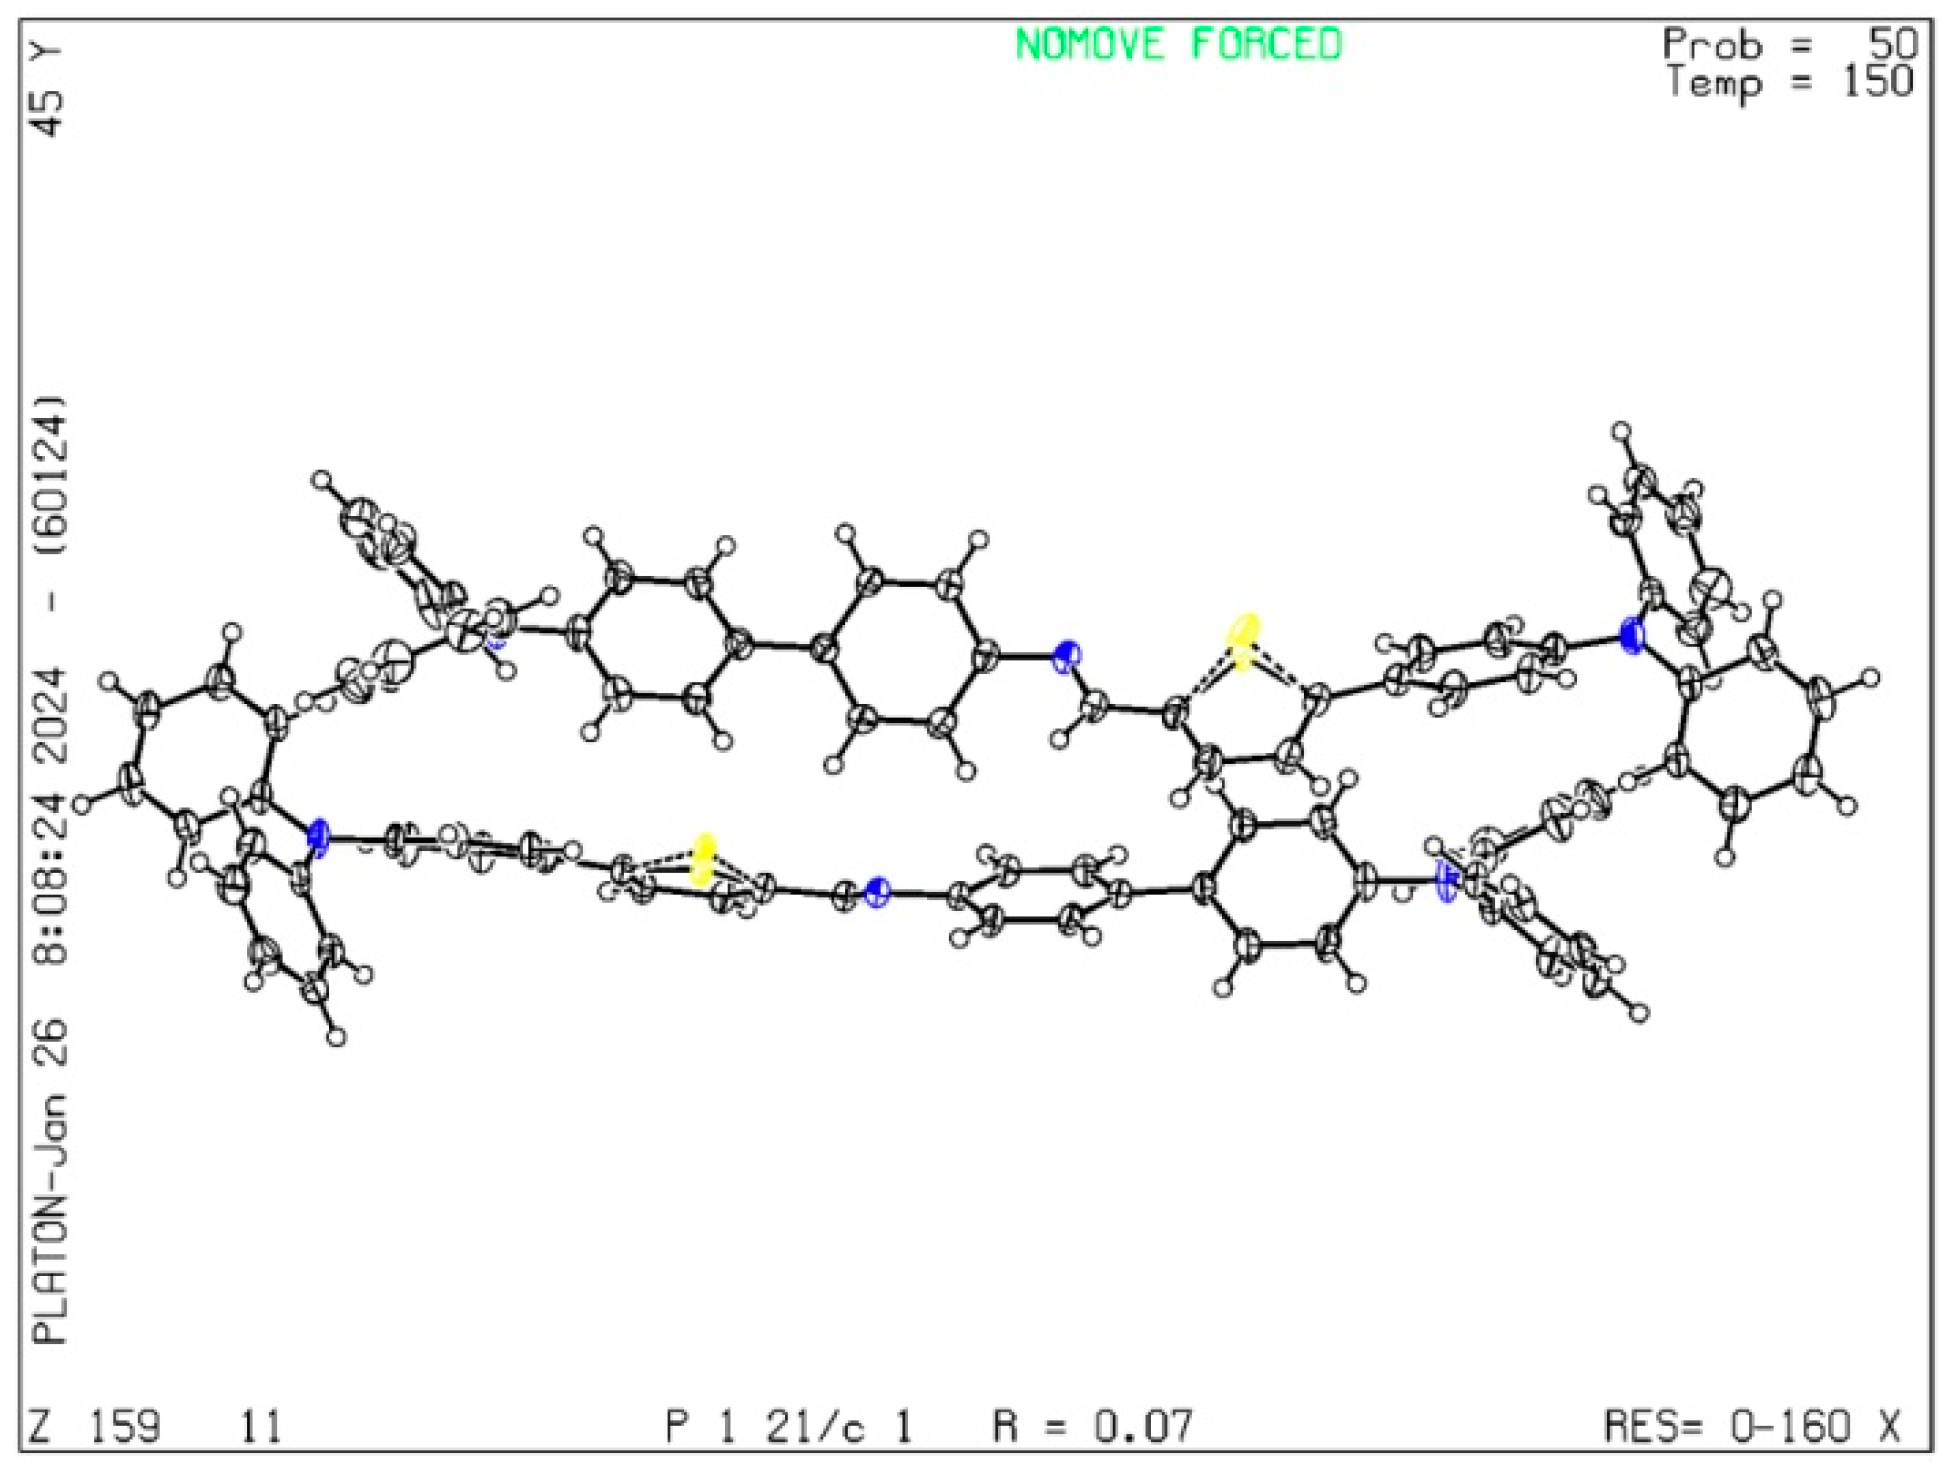
3.1. Single Crystal Diffraction Analysis of TPTc-DBD
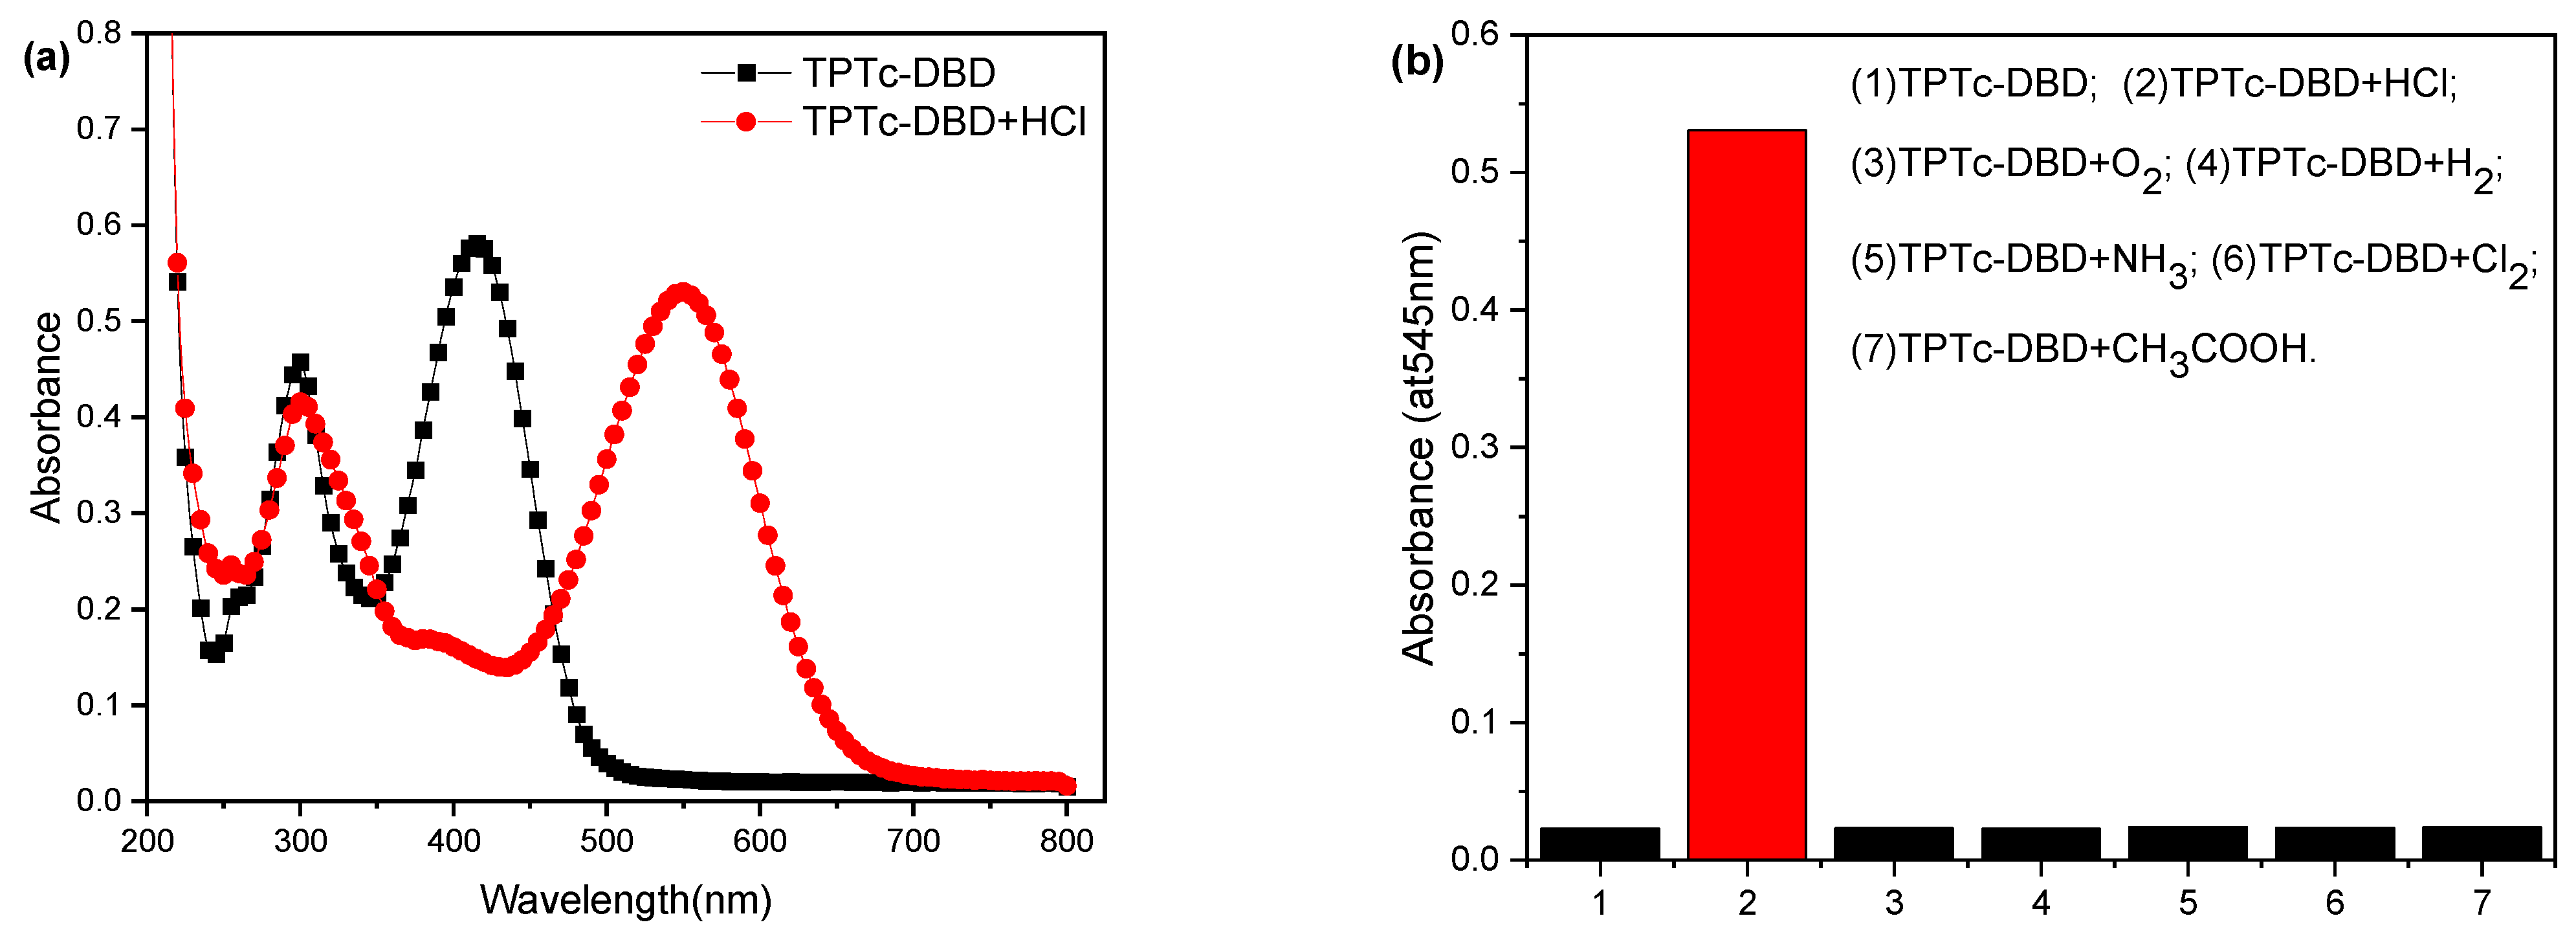
3.2. Photophysical Properties of the TPTc-DBD and Its Selectivity to HCl and the Companion Gas
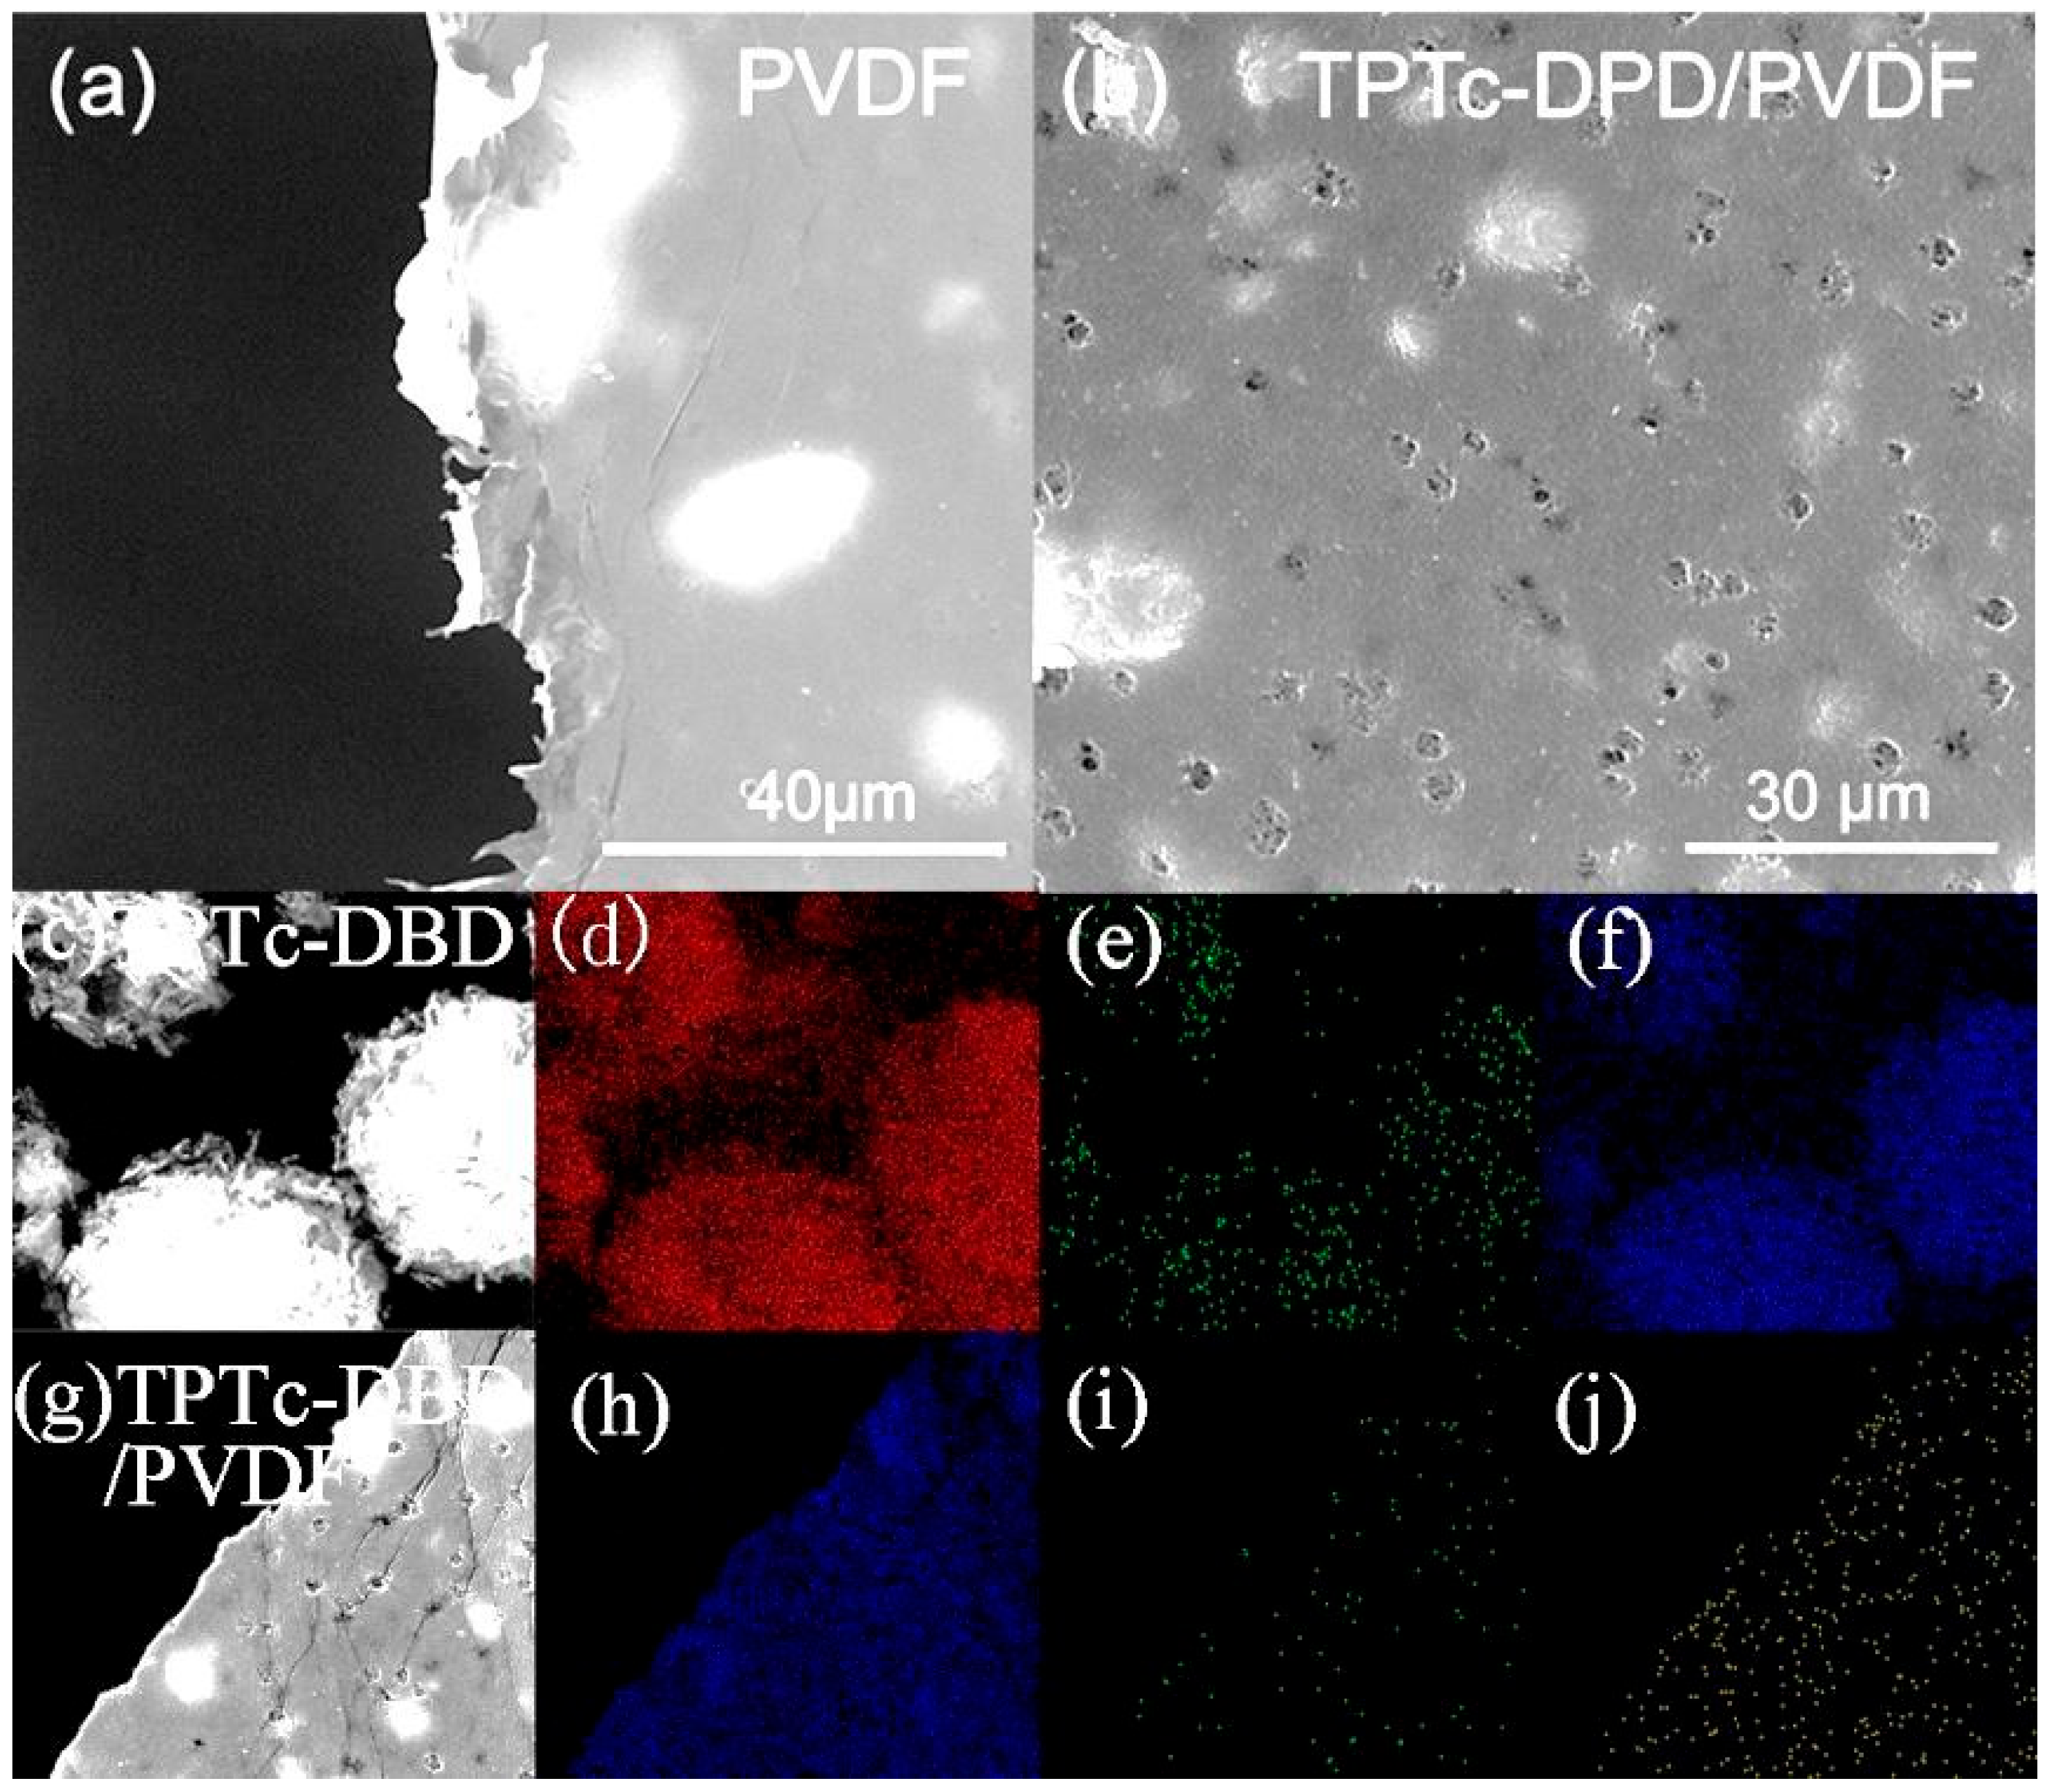
3.3. Morphological Study of Composite Porous Films of TPTc-DBD and PVDF
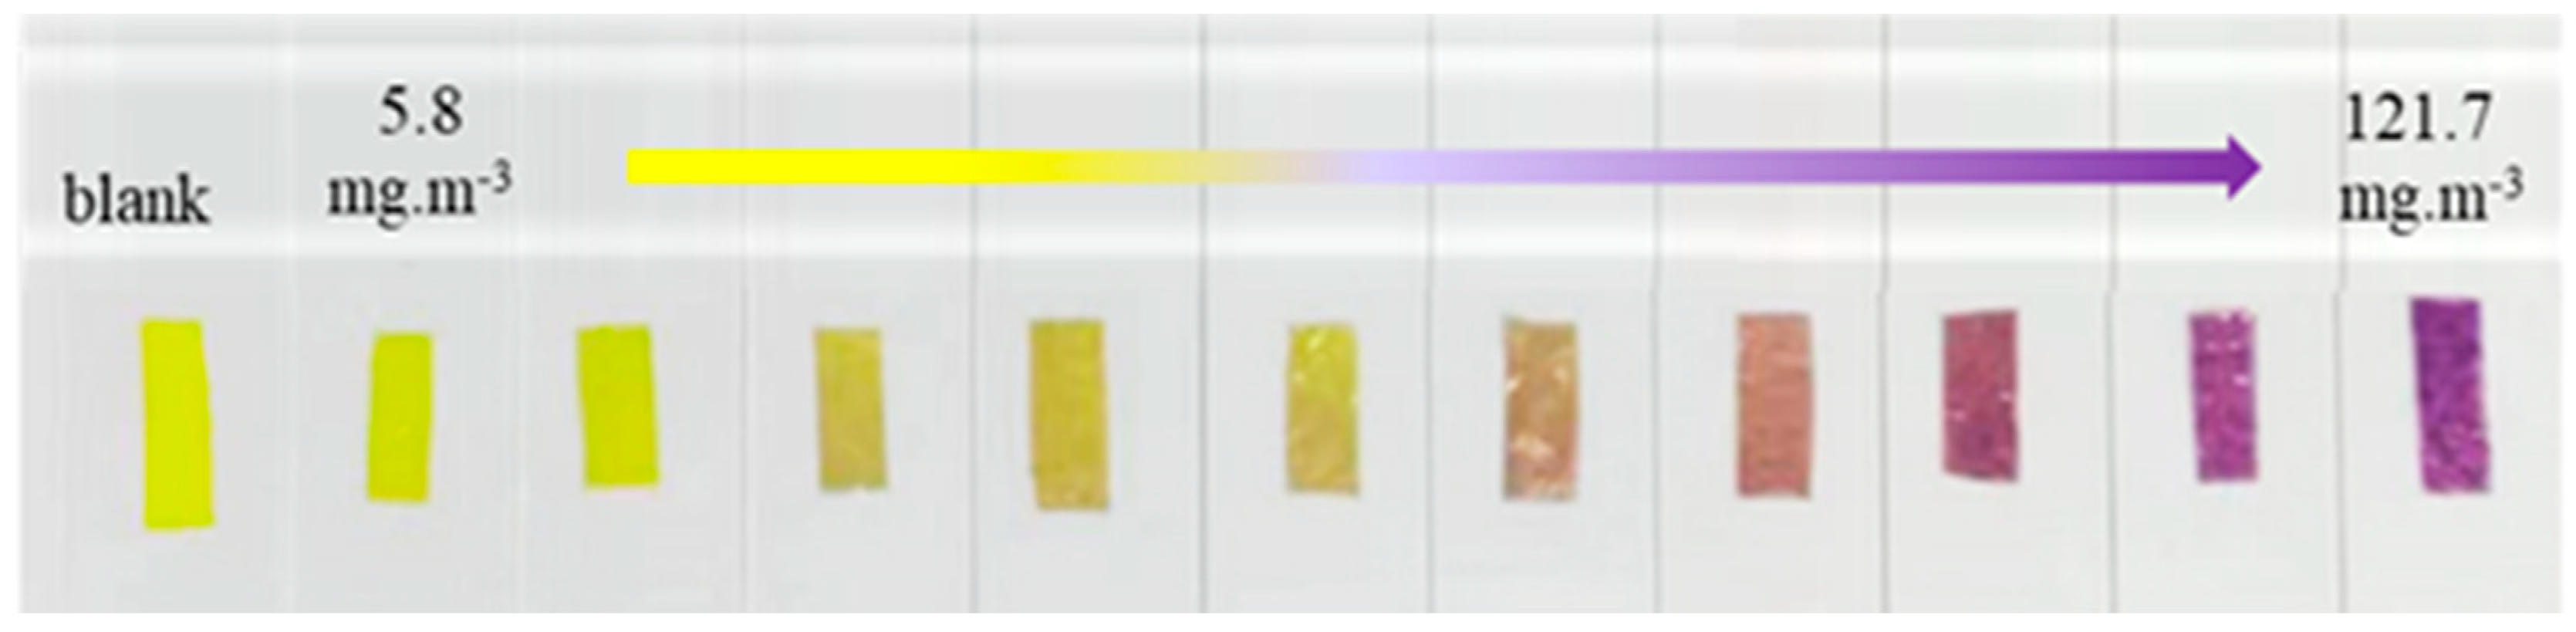
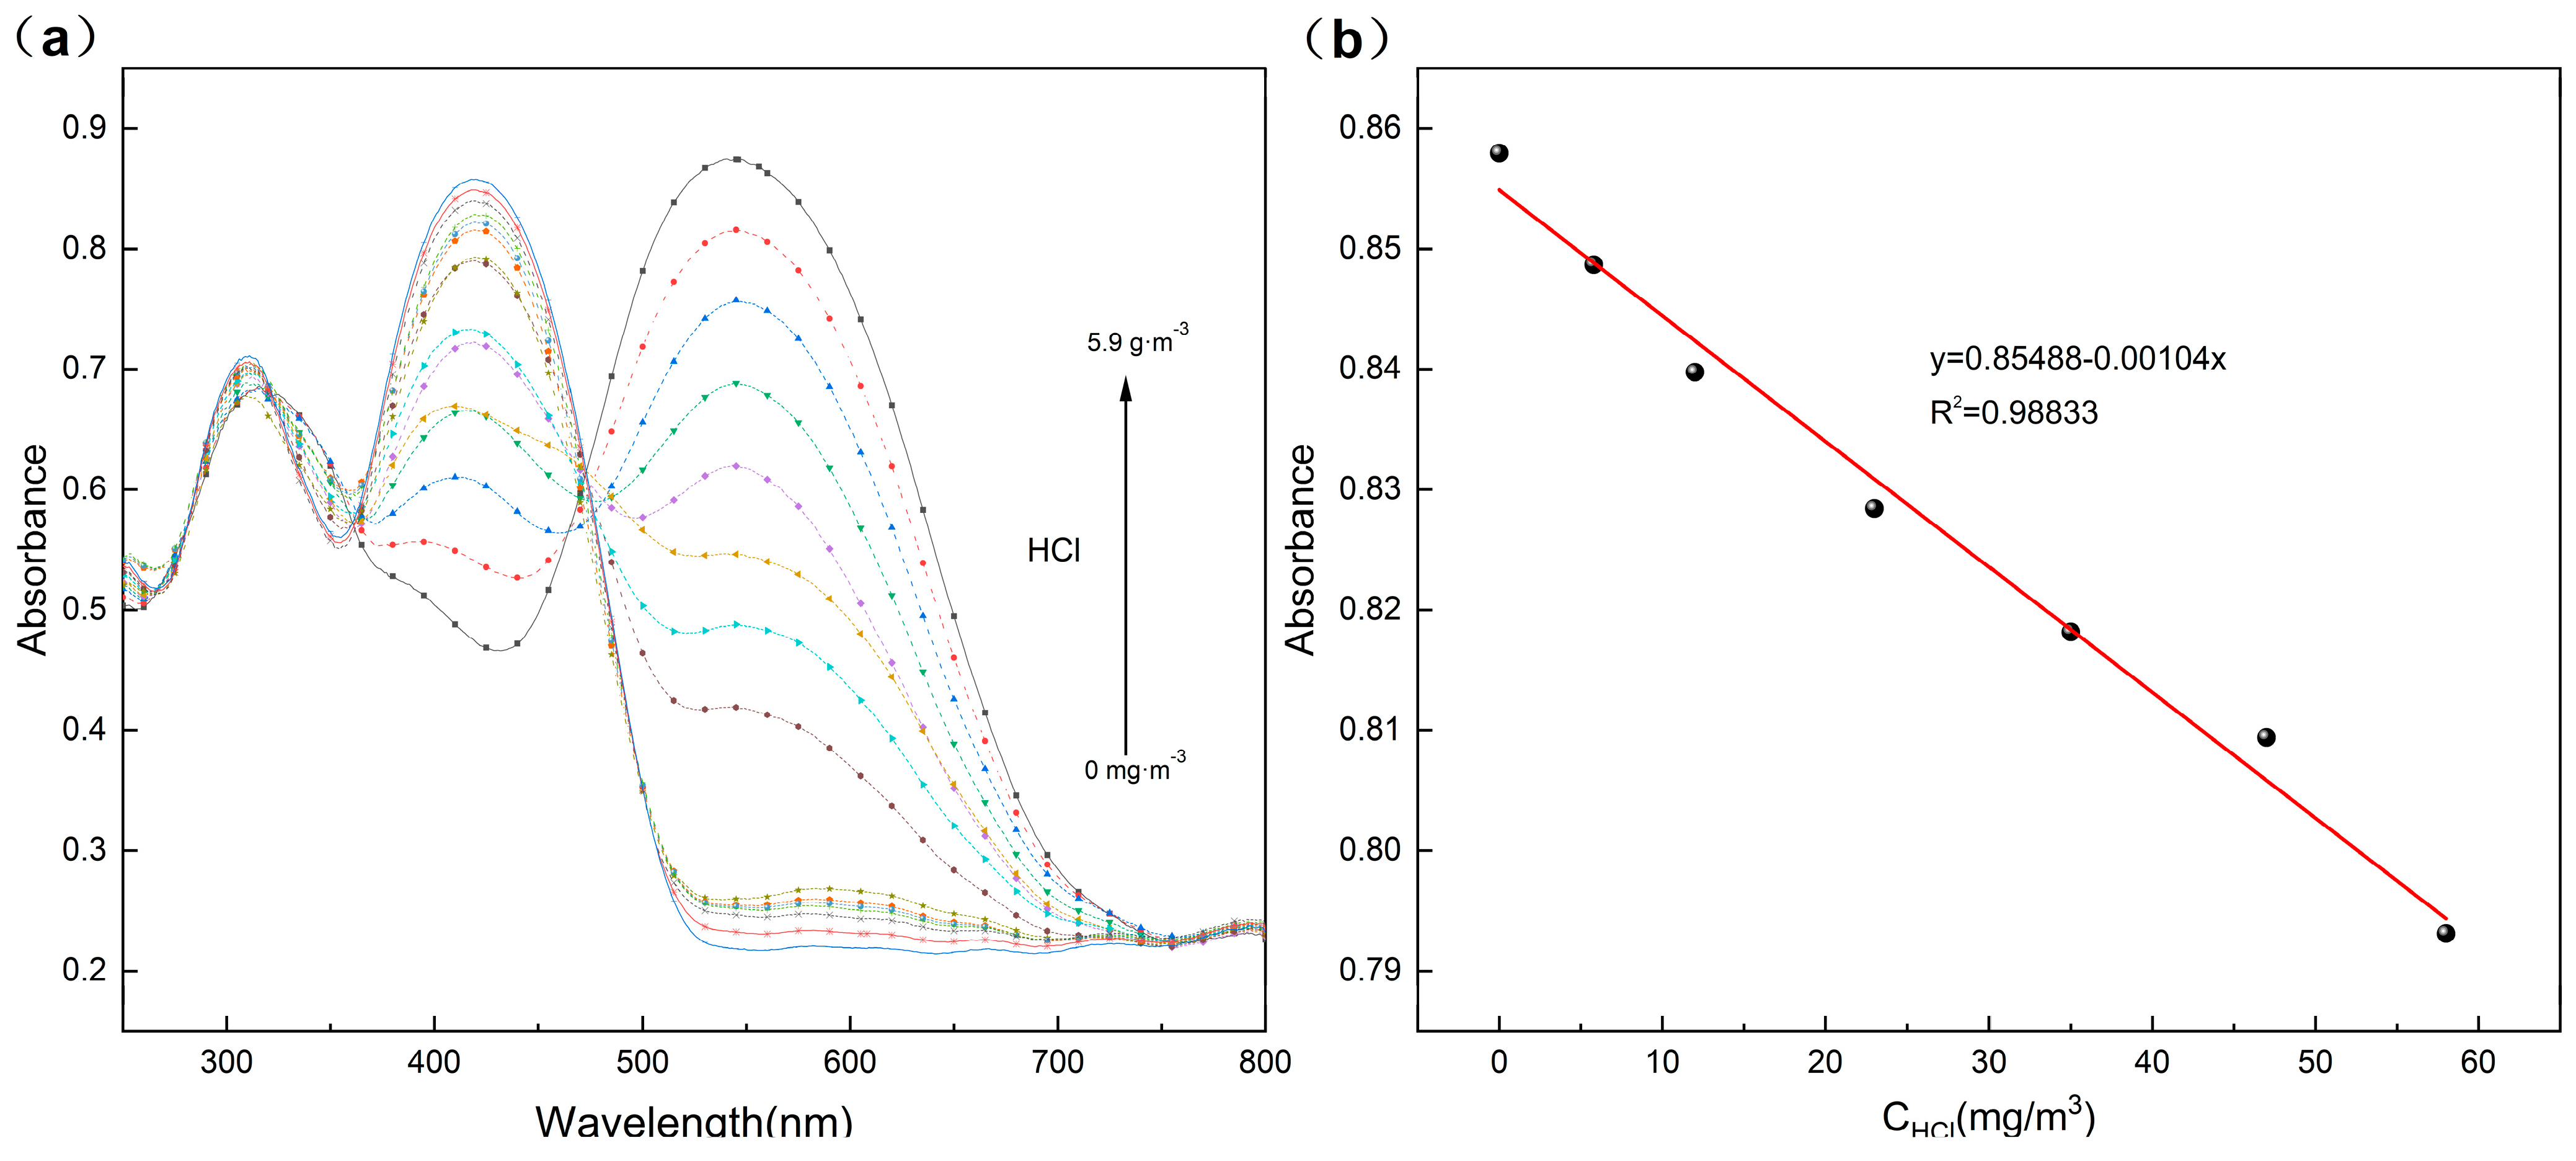
3.4. Sensing Performance of TPTc-DBD/PVDF Composite Film for HCl Gas
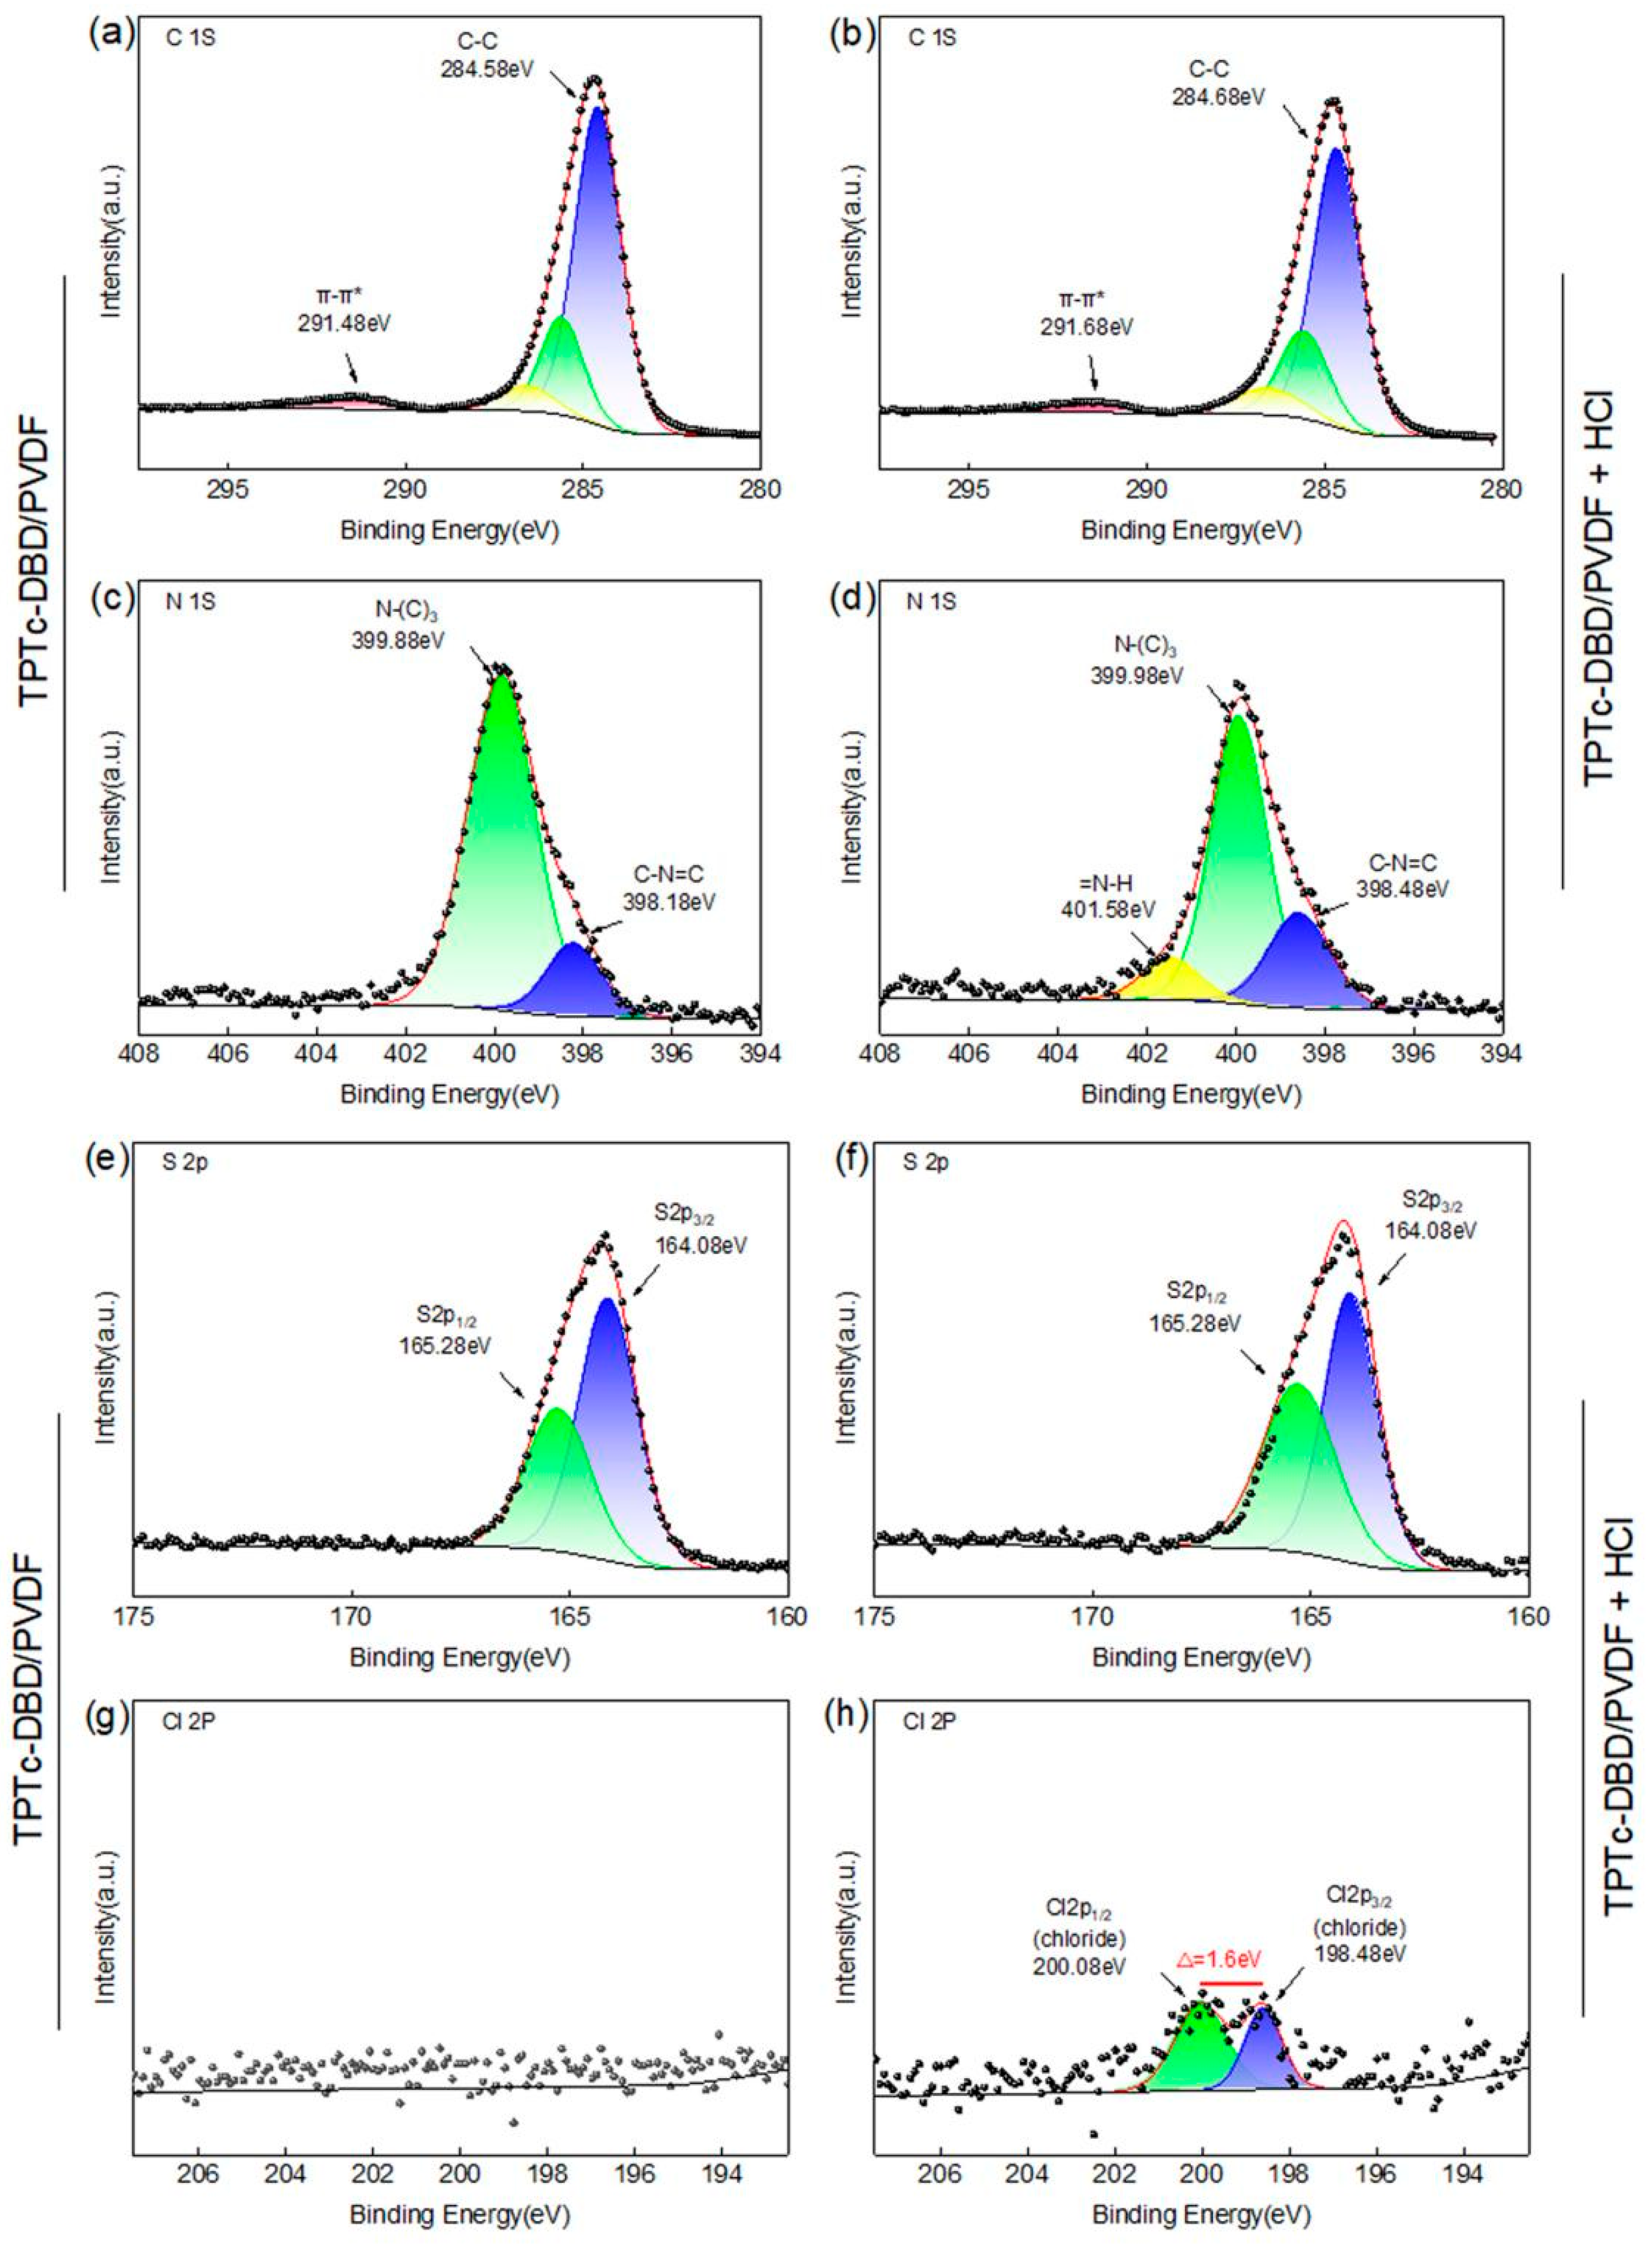
3.5. XPS Analysis of TPTc-DBD/PVDF Composite Film
3.6. Theoretical Computational Study of HCl Binding to TPTc-DBD
3.7. The Cyclic Detection Performance of TPTc-DBD/PVDF Composite Film for HCl
4. Conclusions
Supplementary Materials
Author Contributions
Funding
Institutional Review Board Statement
Informed Consent Statement
Data Availability Statement
Conflicts of Interest
Abbreviations
| HCl | hydrogen chloride |
| PVDF | polyvinylidene fluoride |
| PVA | polyvinyl alcohol |
| PAM | Polyacrylamide |
| THF | tetrahydrofuran |
| TPTc | 5-(4-(diphenylamino)phenyl)thiophene-2-carbaldehyde |
| DBD | N,N-Diphenyl-4,4′-biphenyldiamine |
| NMR | Nuclear Magnetic Resonance |
| M.P. | melting point |
| HRMS | high resolution mass spectrometry |
| DFT | density functional theory |
| CCDC | the cambridge crystallographic data centre |
| SEM | scanning electron microscopy analysis |
| HOMO | Highest Occupied Molecular Orbital |
| LUMO | Lowest Unoccupied Molecular Orbital |
| FTIR | Fourier transform infrared spectroscopy |
References
- Muthukumar, P.; John, S.A. Highly sensitive detection of HCl gas using a thin film of meso-tetra(4-pyridyl)porphyrin coated glass slide by optochemical method. Sens. Actuators B-Chem. 2011, 159, 238–244. [Google Scholar] [CrossRef]
- Matsuguchi, M.; Kadowaki, Y.; Noda, K. HCl gas monitoring based on a QCM using morpholine-functional styrene-co-chloromethylstyrene copolymer coatings. Sens. Actuators B-Chem. 2007, 120, 462–466. [Google Scholar] [CrossRef]
- Cano, M.; Castillero, P.; Roales, J. A transparent TMPyP/TiO2 composite thin film as an HCl sensitive optochemical gas sensor. Sens. Actuators B-Chem. 2010, 150, 764–769. [Google Scholar] [CrossRef]
- Iwasaki, I.; Utsumi, S.; Hagino, K.; Ozawa, T. A New Spectrophotometric Method for the Determination of Small Amounts of Chloride Using the Mercuric Thiocyanate Method. Bull. Chem. Soc. Jpn. 1956, 29, 860–864. [Google Scholar] [CrossRef]
- Imaya, H.; Ishiji, T.; Takahashi, K. Detection properties of electrochemical acidic gas sensors using halide–halate electrolytic solutions. Sens. Actuators B-Chem. 2005, 108, 803–807. [Google Scholar] [CrossRef]
- Wang, L.; Kumar, R.V. Thick film miniaturized HCl gas sensor. Sens. Actuators B-Chem. 2004, 98, 196–203. [Google Scholar] [CrossRef]
- Xie, Y.Z.; Shan, G.G.; Zhou, Z.Y. Schiff-base as highly sensitive and reversible chemosensors for HCl gas. Sens. Actuators B-Chem. 2013, 177, 41–49. [Google Scholar] [CrossRef]
- Hu, J.S.; Li, C.J.; Xu, B.; Tian, W.J. Research Progress of Solid-State Fluorescent Photoswitching Molecules. Chin. J. Org. Chem. 2024, 44, 2425–2440. [Google Scholar] [CrossRef]
- Mach, H.; Volkin, D.B.; Burke, C.J.; Russell Middaugh, C. Ultraviolet absorption spectroscopy. In Protein Stability and Folding: Theory and Practice, 1st ed.; Springer: Berlin, Germany, 1995; pp. 91–114. [Google Scholar]
- Liu, B.; Zhuang, J.; Wei, G. Recent advances in the design of colorimetric sensors for environmental monitoring. Environ. Sci. Nano 2020, 7, 2195–2213. [Google Scholar] [CrossRef]
- Kalimuthu, P.; John, S.A. Optochemical sensing of hydrogen chloride gas using meso-tetramesitylporphyrin deposited glass plate. Anal. Chim. Acta 2008, 627, 247–253. [Google Scholar] [CrossRef]
- Fan, X.; Zhao, L.; Ling, Q.J.; Gu, H.B. Tough, Self-Adhesive, Antibacterial, and Recyclable Supramolecular Double Network Flexible Hydrogel Sensor Based on PVA/Chitosan/Cyclodextrin. Ind. Eng. Chem. Res. 2022, 61, 3620–3635. [Google Scholar] [CrossRef]
- Sánchez-Ponce, L.; Galindo-Riaño, M.D.; Casanueva-Marenco, M.J.; Granado-Castro, M.D.; Díaz-de-Alba, M. Sensing Cd(II) Using a Disposable Optical Sensor Based on a Schiff Base Immobilisation on a Polymer-Inclusion Membrane. Applications in Water and Art Paint Samples. Polymers 2021, 13, 4414. [Google Scholar] [CrossRef]
- Halima, N.B. Poly (vinyl alcohol): Review of its promising applications and insights into biodegradation. RSC Adv. 2016, 6, 39823–39832. [Google Scholar] [CrossRef]
- Xiong, B.; Loss, R.D.; Shields, D.; Pawlik, T.; Hochreiter, R.; Zydney, A.L.; Kumar, M. Polyacrylamide degradation and its implications in environmental systems. NPJ Clean Water 2018, 1, 17. [Google Scholar] [CrossRef]
- Feng, Q.Y.; Zhang, Q.; Lu, X.F.; Wang, H.; Zhou, G.; Wang, Z.-S. Facile and Selective Synthesis of Oligothiophene-Based Sensitizer Isomers: An Approach toward Efficient Dye-Sensitized Solar Cells. ACS Appl. Mater. Interfaces 2013, 5, 8982–8990. [Google Scholar] [CrossRef]
- Olesiejuk, M.; Kudelko, A.; Świątkowski, M. Highly Luminescent 4H-1,2,4-Triazole Derivatives: Synthesis, Molecular Structure and Photophysical Properties. Materials 2020, 13, 5627. [Google Scholar] [CrossRef]
- Schipper, D.J.; Fagnou, K. Direct Arylation as a Synthetic Tool for the Synthesis of Thiophene-Based Organic Electronic Materials. Chem. Mater. 2011, 23, 1594–1600. [Google Scholar] [CrossRef]
- Liu, C.; Ni, Q.; Qiu, J. Very Fast, Ligand-Free and Aerobic Protocol for the Synthesis of 4-Aryl-Substituted Triphenylamine Derivatives. Eur. J. Org. Chem. 2011, 2011, 3009–3015. [Google Scholar] [CrossRef]
- Sheldrick, G.M. SHELXTL, Version 5.1: Software Reference Manual; Bruker AXS: Madison, WI, USA, 1997. [Google Scholar]
- Sheldrick, G.M. SHELXL-97, Program for Crystal Structure Refinement; University of Göttingen: Göttingen, Germany, 1997. [Google Scholar]
- Guo, Y.N.; Hu, X.B.; Zhang, H.G.; Han, Y.F.; Wang, H. Synthesis, Crystal Structure, Photophysical Properties, and Antibacterial Activities of the Copper(II) Complex Derived from 4-Chloro-2-{[(2,6-Dimethylphenyl)Imino]Methyl}Phenol. J. Struct. Chem. 2024, 65, 868–881. [Google Scholar] [CrossRef]
- Adamo, C.; Barone, V. Toward reliable density functional methods without adjustable parameters: The PBE0 mode. J. Chem. Phys. 1999, 110, 6158–6170. [Google Scholar] [CrossRef]
- Levkov, L.L.; Surin, N.M.; Borshchev, O.V.; Titova, Y.O.; Dubinets, N.O.; Svidchenko, E.A.; Shaposhnik, P.A.; Trul, A.A.; Umarov, A.Z.; Anokhin, D.V.; et al. Three Isomeric Dioctyl Derivatives of 2,7-Dithienyl [1]benzo-thieno [3,2-b][1]benzothiophene: Synthesis, Optical, Thermal, and Semiconductor Properties. Materials 2025, 18, 743. [Google Scholar] [CrossRef]
- Karak, A.; Manna, S.K.; Mahapatra, A.K. Triphenylamine-based small-molecule fluorescent probes. Anal. Methods 2022, 14, 972–1005. [Google Scholar] [CrossRef]
- Liu, W.; Liu, Q.; Wang, D.; Tang, B.Z. Fluorescent Porous Materials Based on Aggregation-induced Emission for Biomedical Applications. ACS Nano 2024, 18, 27206–27229. [Google Scholar] [CrossRef]
- Ding, W.; Cheng, B.W.; Wang, M.; Dou, Q.Y.; Li, S.Y.; Zhang, P.; Luo, Q.F. Advances in Aggregation-Induced Emission Molecules Based on Organic Photochromism. Chin. J. Org. Chem. 2022, 42, 363–383. [Google Scholar]
- Zhuang, R.; Wang, X.; Guo, M.; Zhao, Y.R.; El-Farra, N.H.; Palazoglu, A. Waste-to-hydrogen: Recycling HCl to produce H2 and Cl2. Appl. Energy 2020, 259, 114184. [Google Scholar] [CrossRef]
- Wang, Y.; Liu, M.; Fan, F.; Li, G.; Duan, J.X.; Li, Y.M.; Jiang, G.Y.; Yao, W.Q. Enhanced full-spectrum photocatalytic activity of 3D carbon-coated C3N4 nanowires via giant interfacial electric field. Appl. Catal. B Environ. 2022, 318, 121829. [Google Scholar] [CrossRef]
- Wang, J.F.; Meng, Q.Y.; Yang, Y.Y.; Zhong, S.L.; Zhang, R.T.; Fang, Y.H.; Gao, Y.; Cui, X.J. Schiff Base Aggregation-Induced Emission Luminogens for Sensing Applications: A Review. ACS Sens. 2022, 7, 2521–2536. [Google Scholar] [CrossRef]
- Wang, X.; Wang, J.; Si, Y.; Ding, B.; Yu, J.; Sun, G.; Luo, W.; Zheng, G. Nanofiber-net-binary structured membranes for highly sensitive detection of trace HCl gas. Nanoscale 2012, 4, 7585–7592. [Google Scholar] [CrossRef]
- Xue, P.; Chen, P.; Jia, J.; Xu, Q.; Sun, J.; Yao, B.; Zhang, Z.; Lu, R. A triphenylamine-based benzoxazole derivative as a high-contrast piezofluorochromic material induced by protonation. Chem. Commun. 2014, 50, 2569–2571. [Google Scholar] [CrossRef]
- Geltmeyer, J.; Vancoillie, G.; Steyaert, I.; Breyne, B.; Cousins, G.; Lava, K.; Hoogenboom, R.; De Buysser, K.; De Clerck, K. Dye modification of nanofibrous silicon oxide membranes for colorimetric HCl and NH3 sensing. Adv. Funct. Mater. 2016, 26, 5987–5996. [Google Scholar] [CrossRef]
- Hu, M.; Kang, W.; Zhong, Z.; Cheng, B.; Xing, W. Porphyrin-functionalized hierarchical porous silica nanofiber membrane for rapid HCl gas detection. Ind. Eng. Chem. Res. 2018, 57, 11668–11674. [Google Scholar] [CrossRef]
- Thornton, B.T.; Harrison, A.; Pham, A.L.; Castano, C.E.; Tang, C. Polyaniline-functionalized nanofibers for colorimetric detection of HCl vapor. ACS Omega 2018, 3, 3587–3591. [Google Scholar] [CrossRef]
- Li, D.; Yang, Y.; Yang, C.; Zhang, W.; Wang, Y.; Lin, X.; Gao, Y.; Lv, X.; Niu, H.; Wang, W. Aggregation-induced emission enhancement-active triarylamine-based polyamides containing fused ring groups towards electrochromic smart window and sensor for HCl and TNP. Dye. Pigment. 2021, 184, 108799. [Google Scholar] [CrossRef]
- Zhu, Z.H.; Ni, Z.; Zou, H.H.; Feng, G.; Tang, B.Z. Smart metal–organic frameworks with reversible luminescence/magnetic switch behavior for HCl vapor detection. Adv. Funct. Mater. 2021, 31, 2106925. [Google Scholar] [CrossRef]
- Liang, Q.F.; Zheng, H.W.; Yang, D.D.; Zheng, X.J. Zn (II) complexes based on a Schiff base: Mechanochromism-and solvent molecule-dependent acidochromism. Cryst. Growth Des. 2022, 22, 3924–3931. [Google Scholar] [CrossRef]
- Li, M.; Tang, J.; Luo, Y.; Yang, J.; Liu, J.; Peng, J.; Fang, Y. Imine bond-based fluorescent nanofilms toward high-performance detection and efficient removal of HCl and NH3. Anal. Chem. 2023, 95, 2094–2101. [Google Scholar] [CrossRef]


| HOMO | LUMO | Eg/eV | |
|---|---|---|---|
| TPTc-DBD |  | 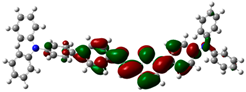 | 2.944 eV |
| TPTc-DBD-H+ |  | 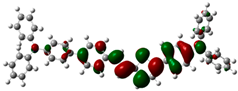 | 1.173 eV |
Disclaimer/Publisher’s Note: The statements, opinions and data contained in all publications are solely those of the individual author(s) and contributor(s) and not of MDPI and/or the editor(s). MDPI and/or the editor(s) disclaim responsibility for any injury to people or property resulting from any ideas, methods, instructions or products referred to in the content. |
© 2025 by the authors. Licensee MDPI, Basel, Switzerland. This article is an open access article distributed under the terms and conditions of the Creative Commons Attribution (CC BY) license (https://creativecommons.org/licenses/by/4.0/).
Share and Cite
Lv, H.; Guo, Y.; Han, Y.; Ye, J.; Xiao, J.; Hu, X. A Fast and Efficient Hydrogen Chloride Sensor Based on a Polymer Composite Film Using a Novel Schiff-Based Triphenylamine Molecule as the Probe. Materials 2025, 18, 2291. https://doi.org/10.3390/ma18102291
Lv H, Guo Y, Han Y, Ye J, Xiao J, Hu X. A Fast and Efficient Hydrogen Chloride Sensor Based on a Polymer Composite Film Using a Novel Schiff-Based Triphenylamine Molecule as the Probe. Materials. 2025; 18(10):2291. https://doi.org/10.3390/ma18102291
Chicago/Turabian StyleLv, Hao, Yaning Guo, Yinfeng Han, Jiaxin Ye, Jian Xiao, and Xiaobing Hu. 2025. "A Fast and Efficient Hydrogen Chloride Sensor Based on a Polymer Composite Film Using a Novel Schiff-Based Triphenylamine Molecule as the Probe" Materials 18, no. 10: 2291. https://doi.org/10.3390/ma18102291
APA StyleLv, H., Guo, Y., Han, Y., Ye, J., Xiao, J., & Hu, X. (2025). A Fast and Efficient Hydrogen Chloride Sensor Based on a Polymer Composite Film Using a Novel Schiff-Based Triphenylamine Molecule as the Probe. Materials, 18(10), 2291. https://doi.org/10.3390/ma18102291