
Effect of Cu/Li Ratio on Mechanical Properties and Corrosion Behavior of Sc-Containing Al-Cu-Li Alloys
Abstract

1. Introduction
2. Materials and Methods
3. Results
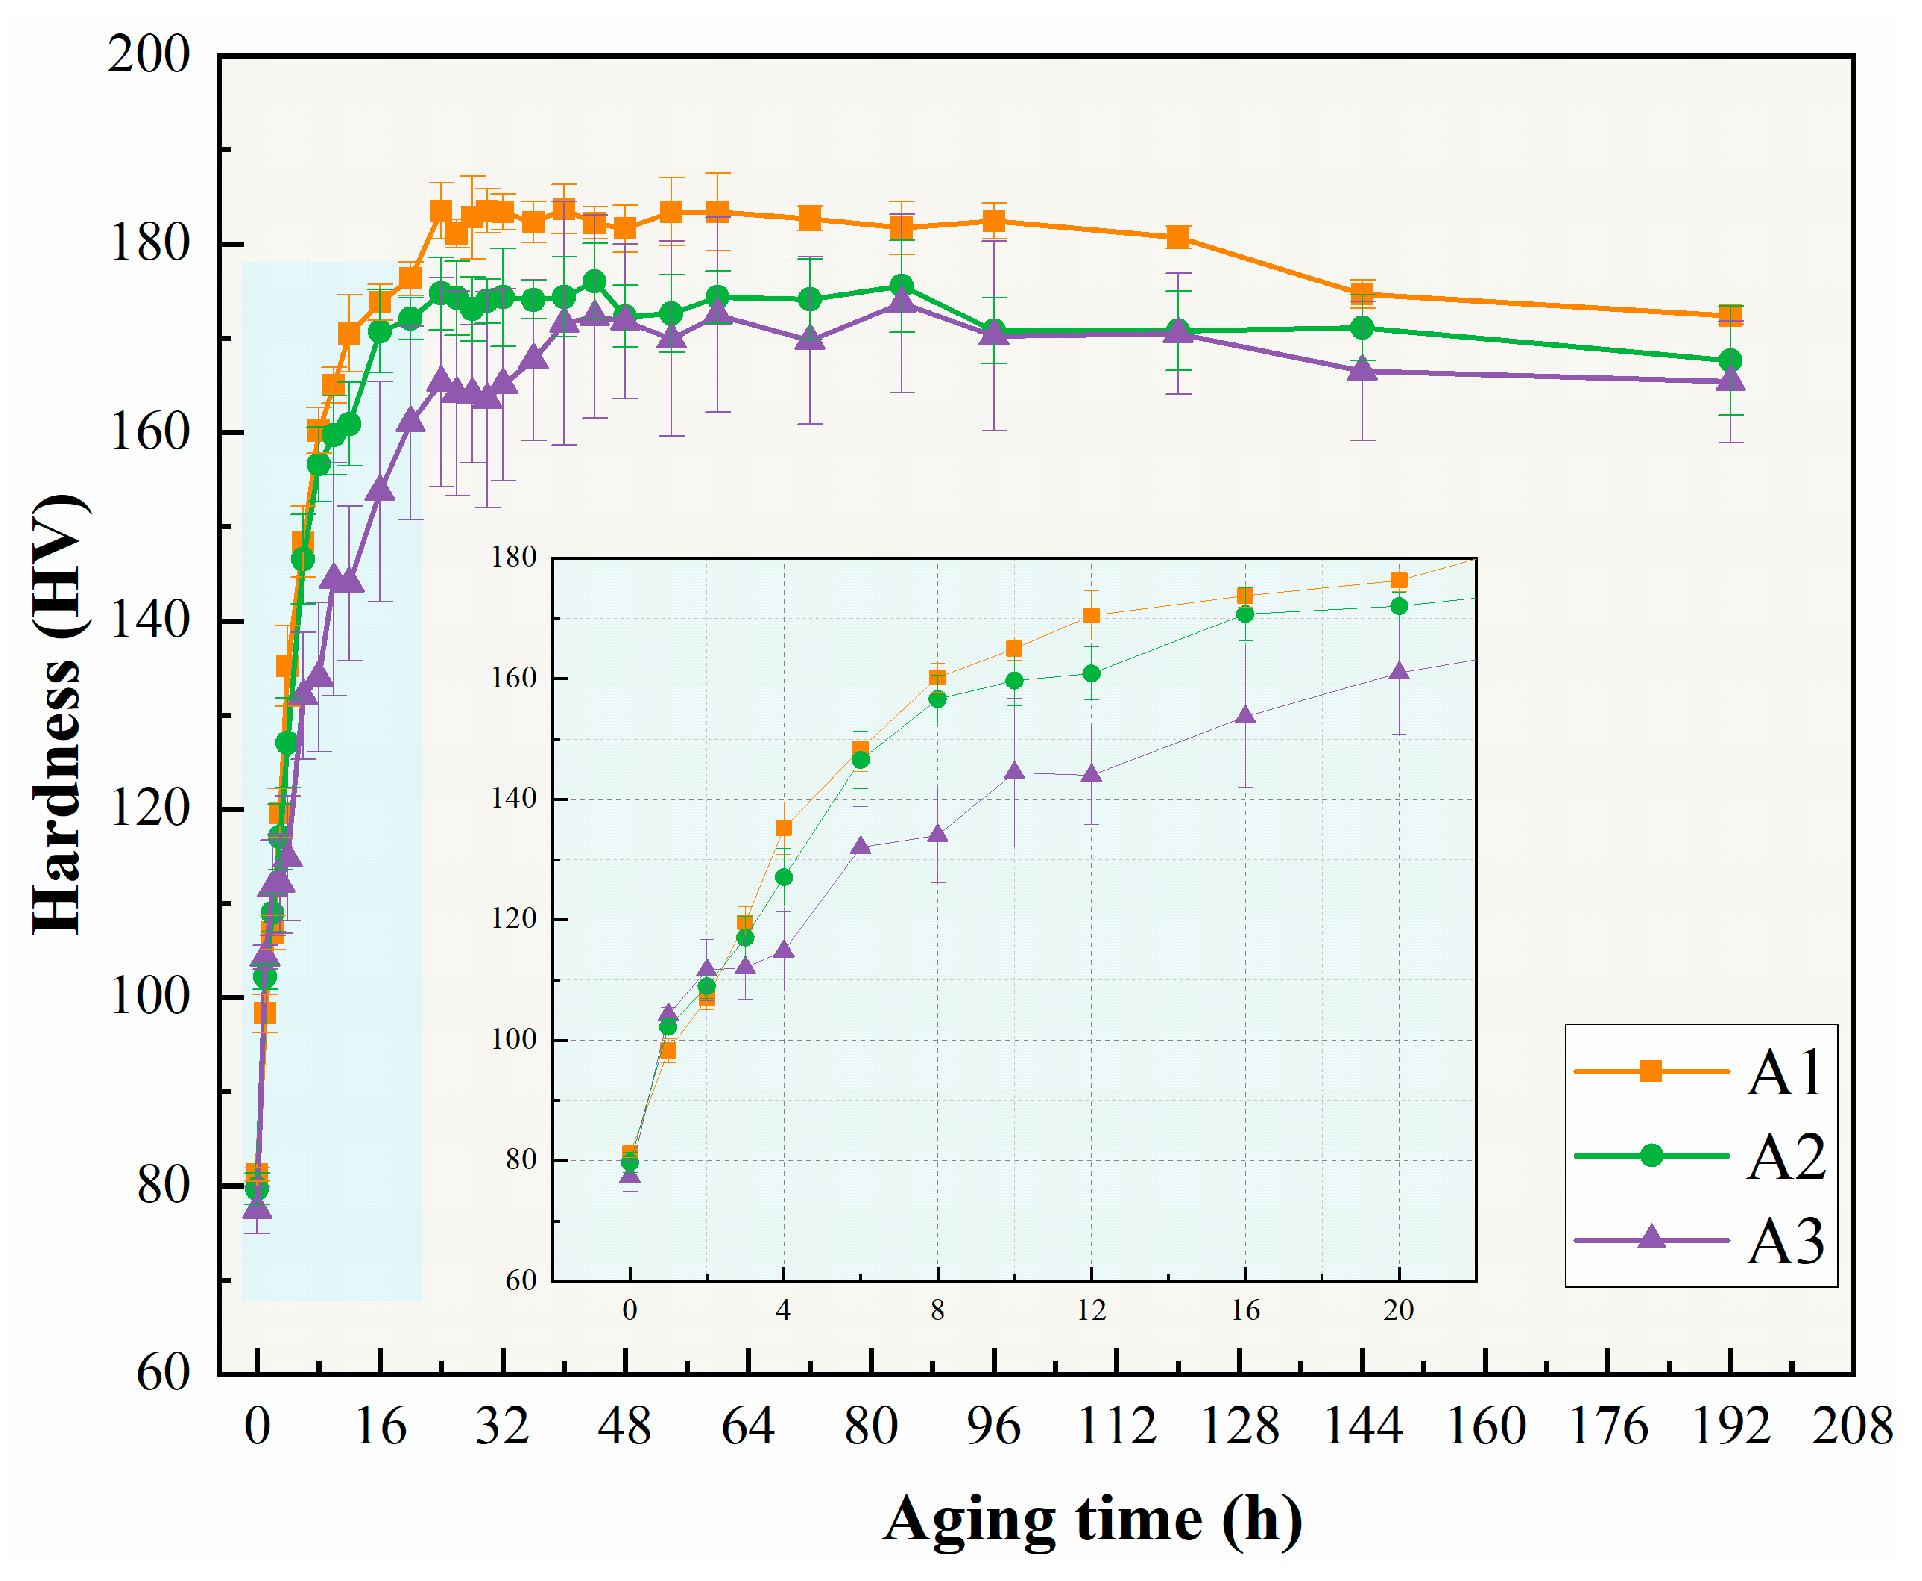
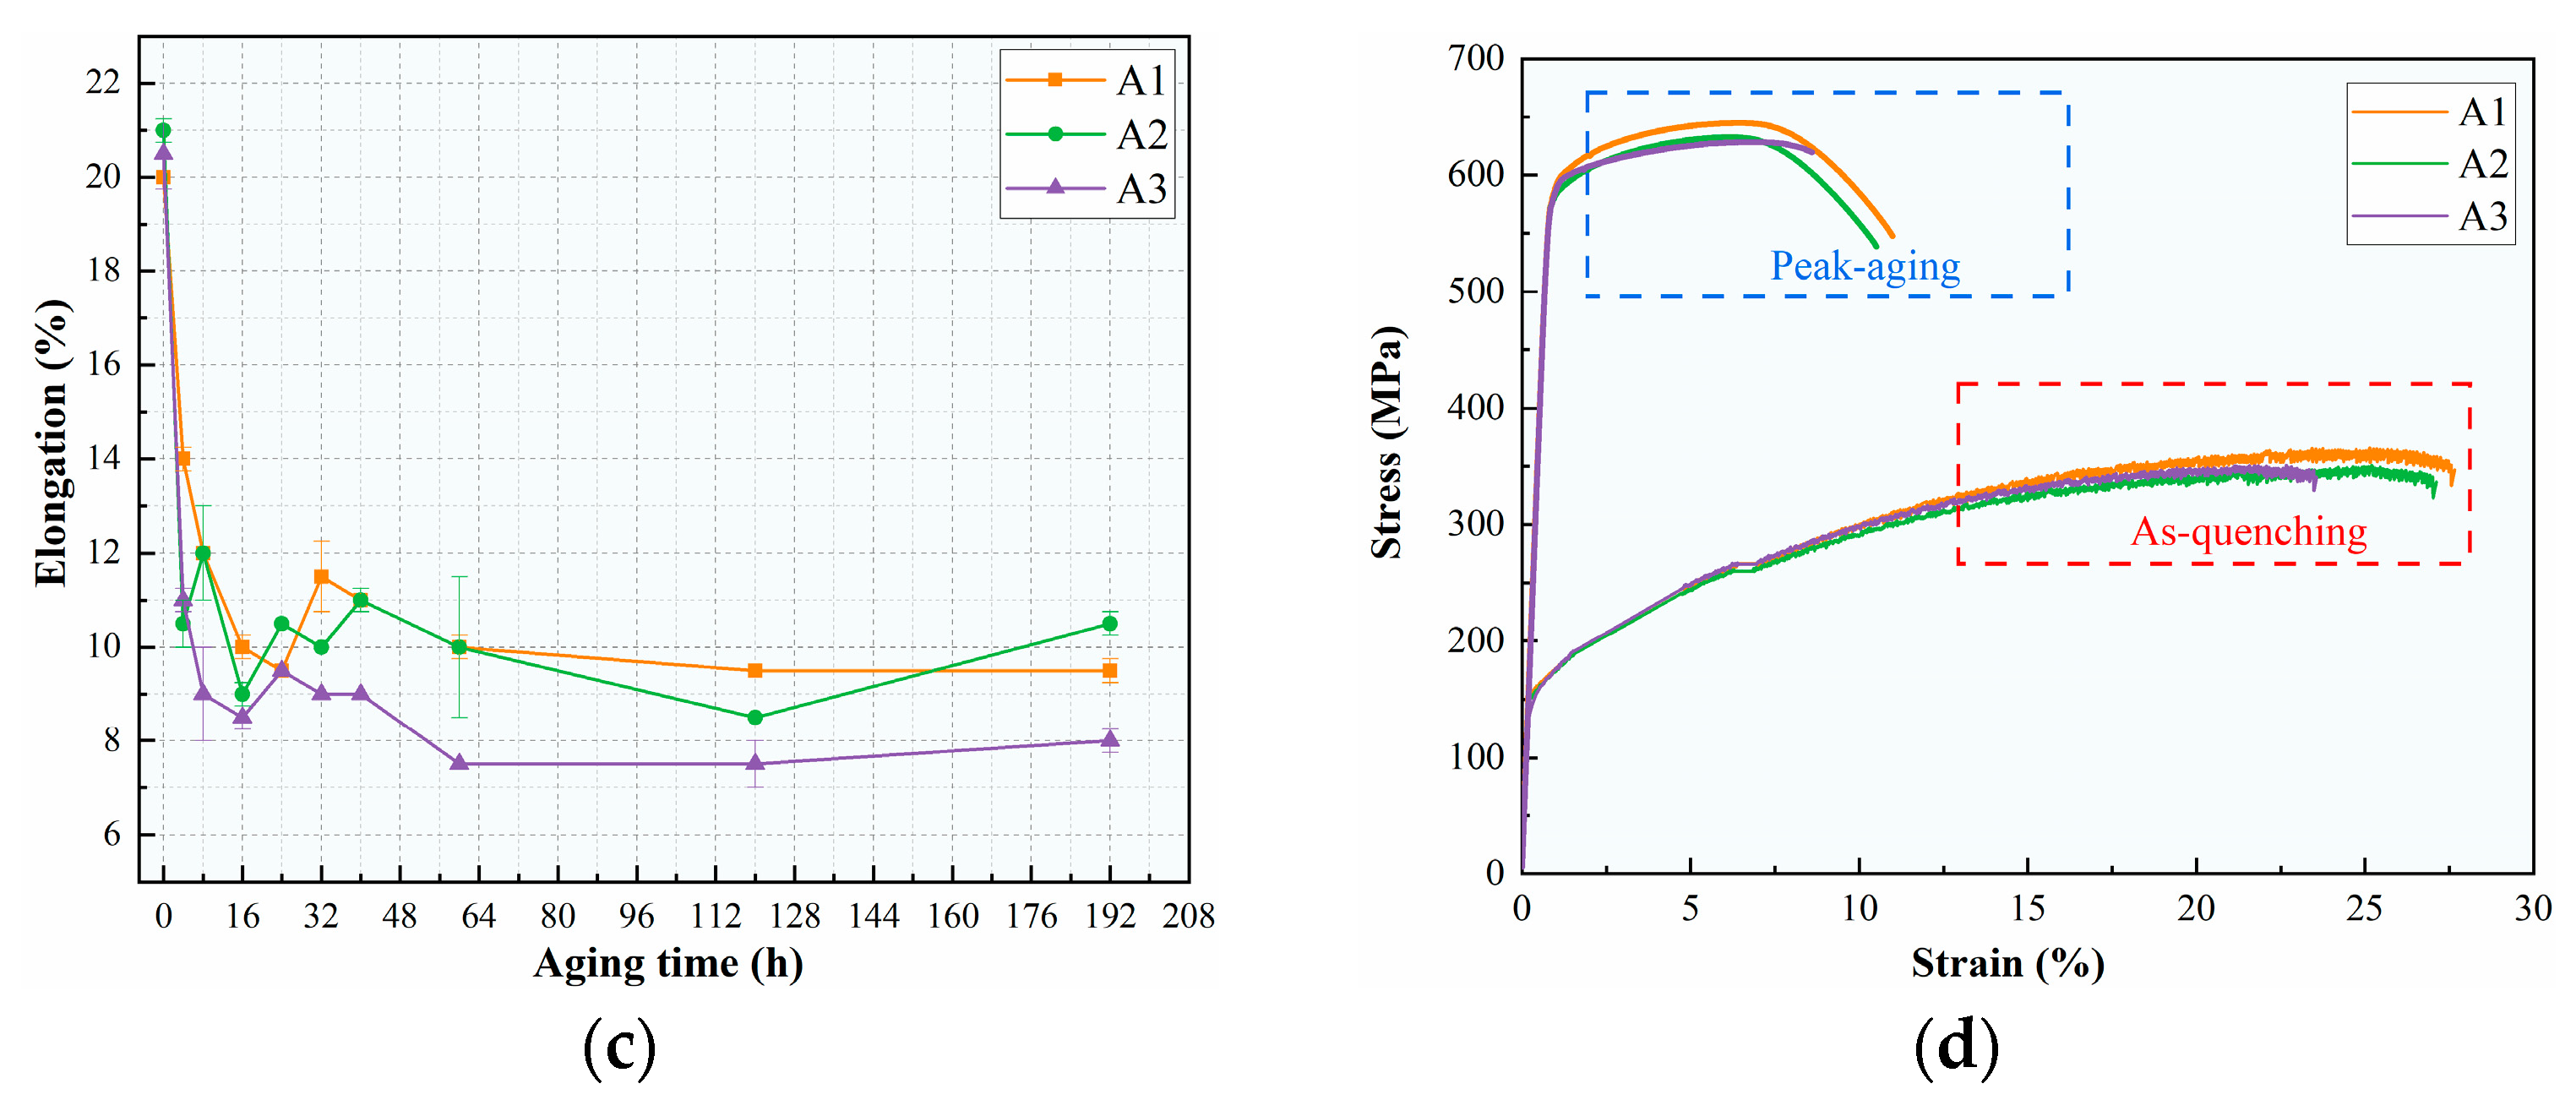
3.1. Age-Hardening Behavior and Mechanical Properties
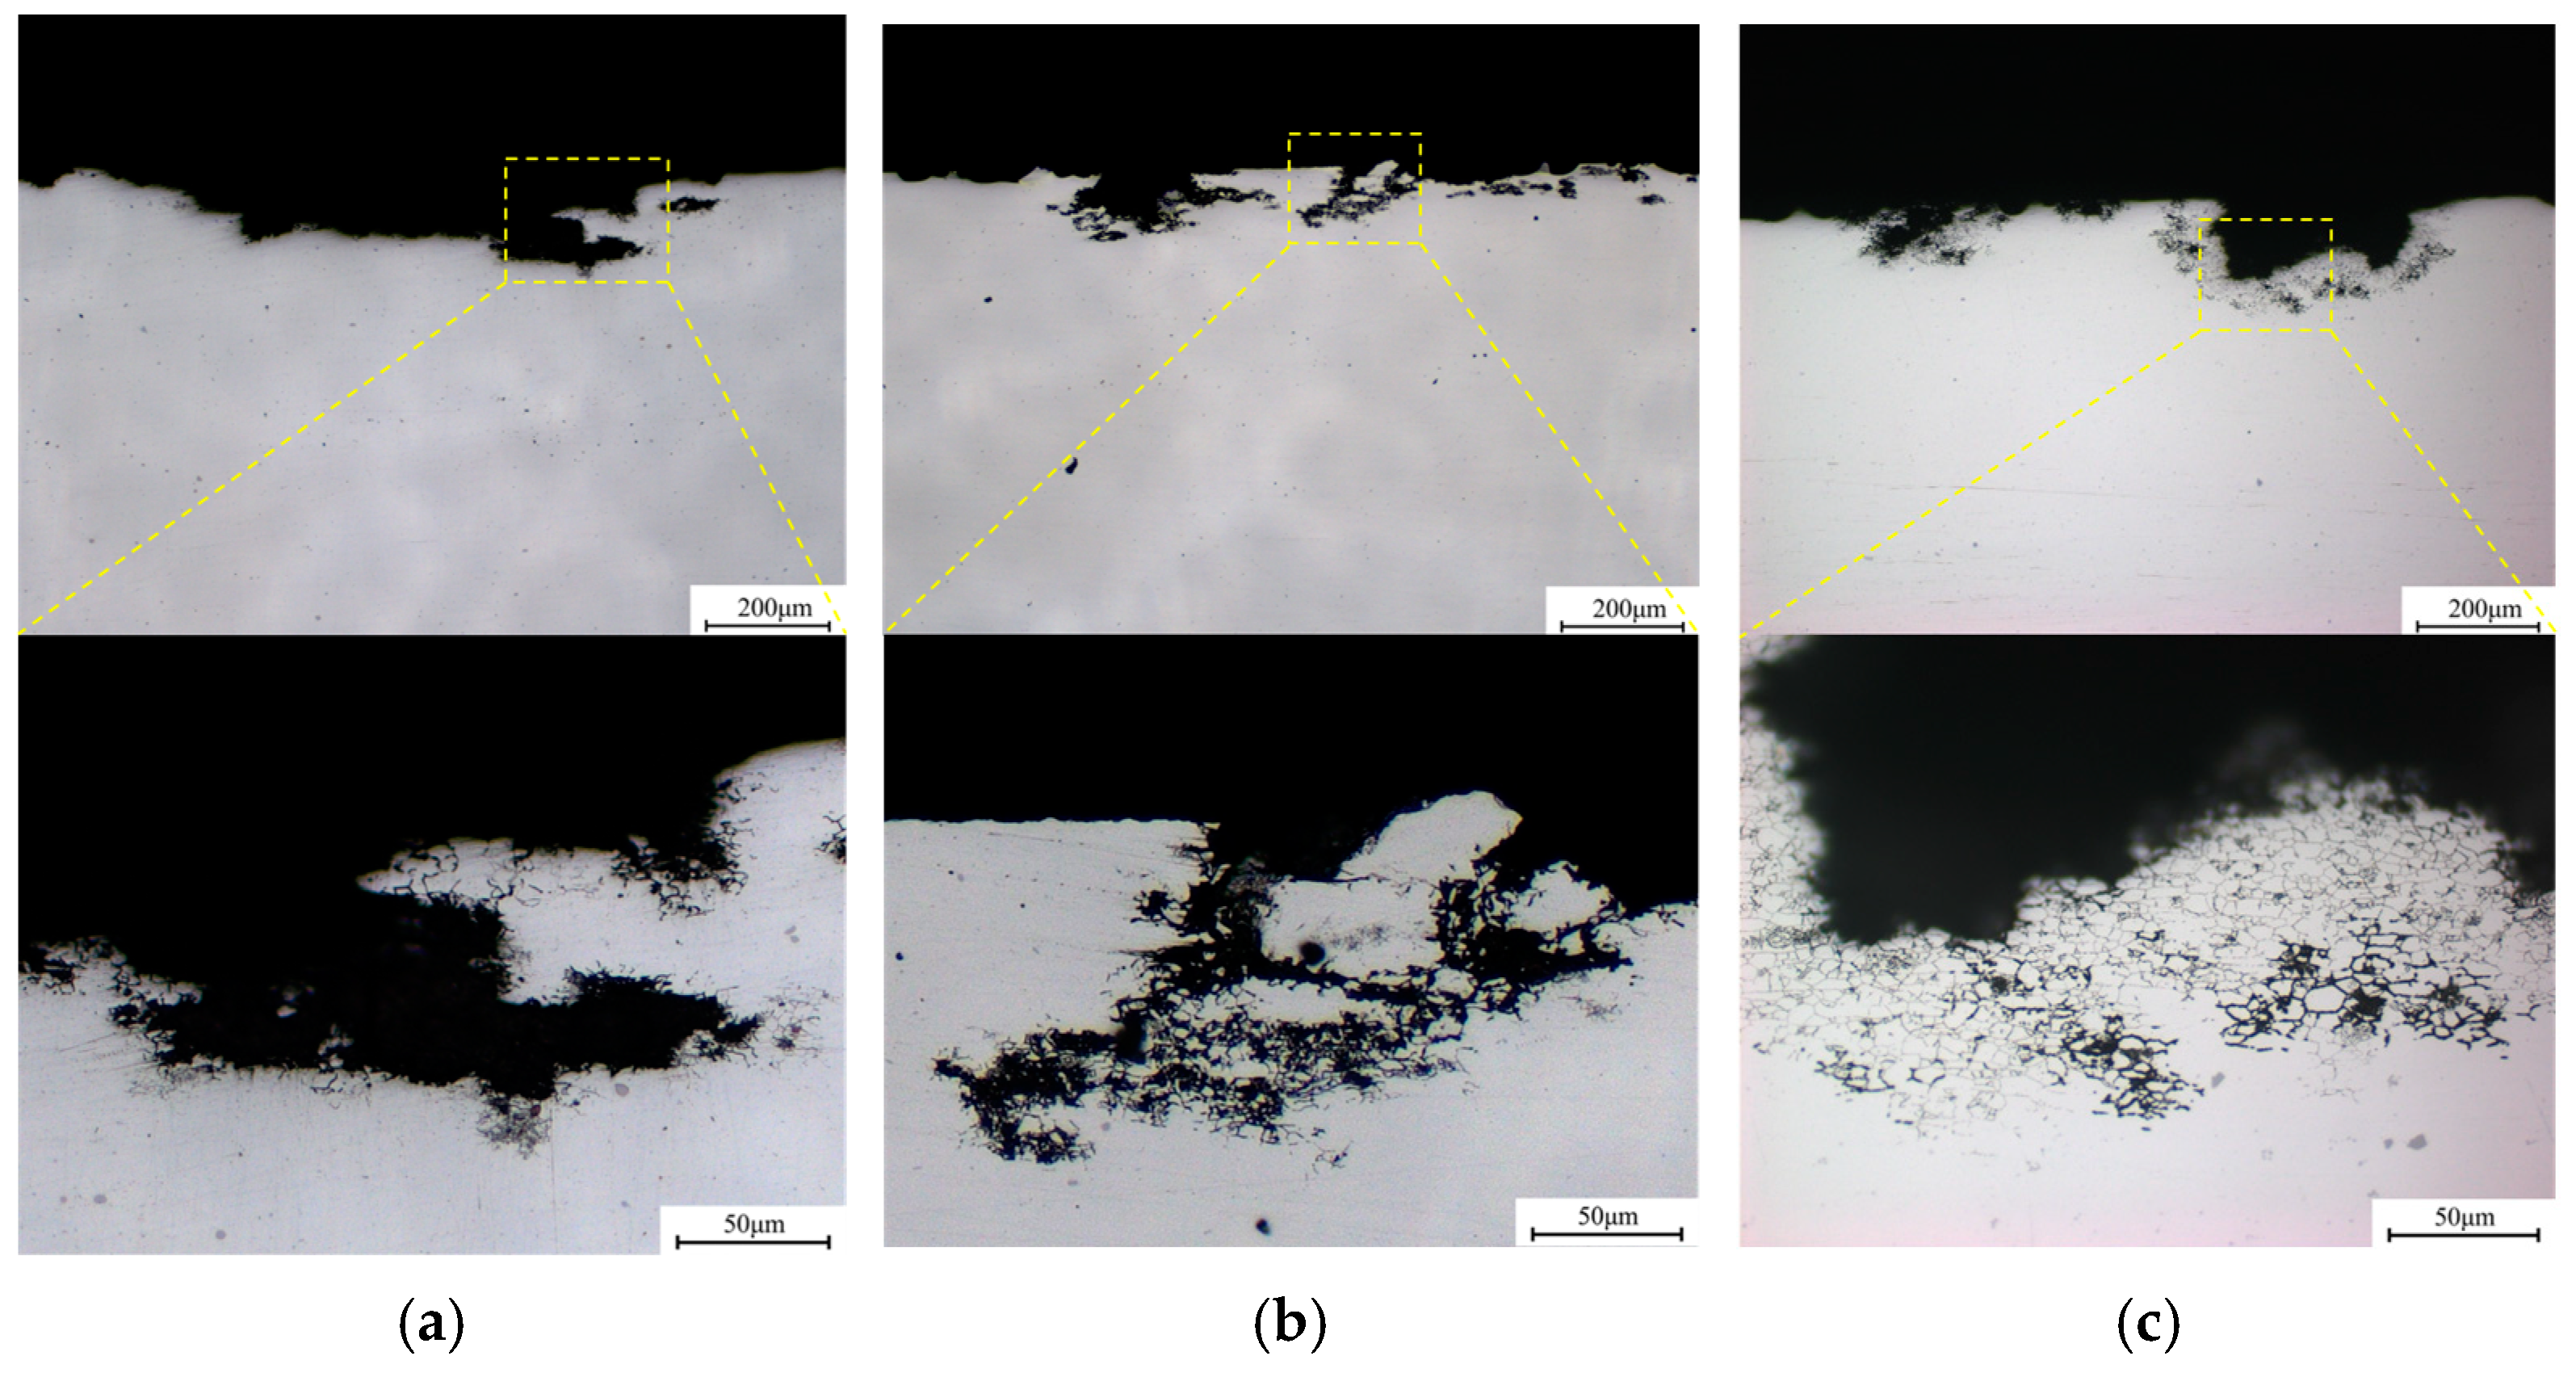
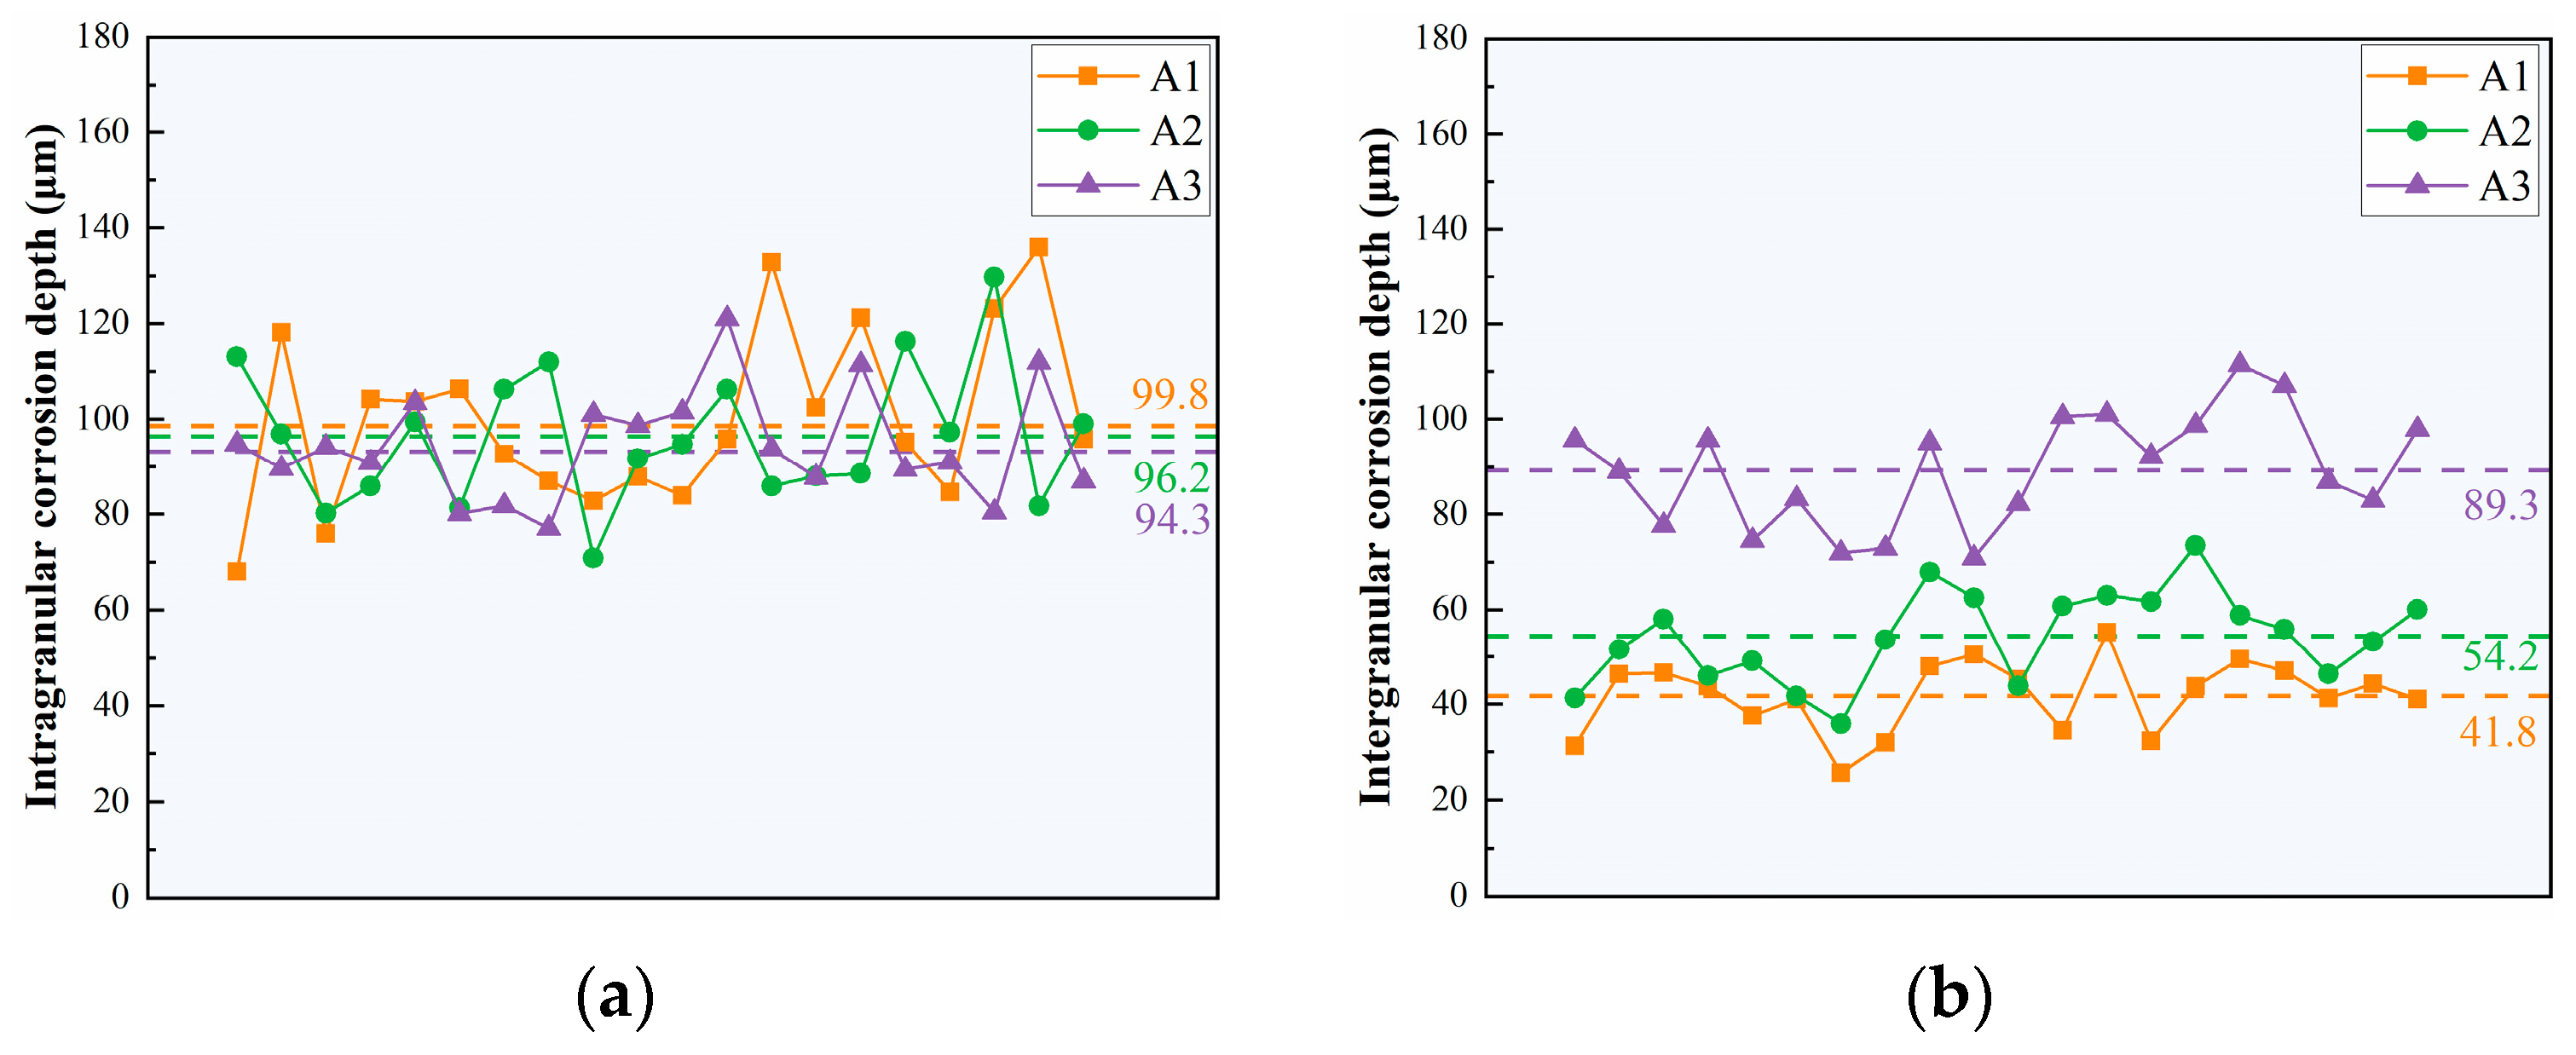
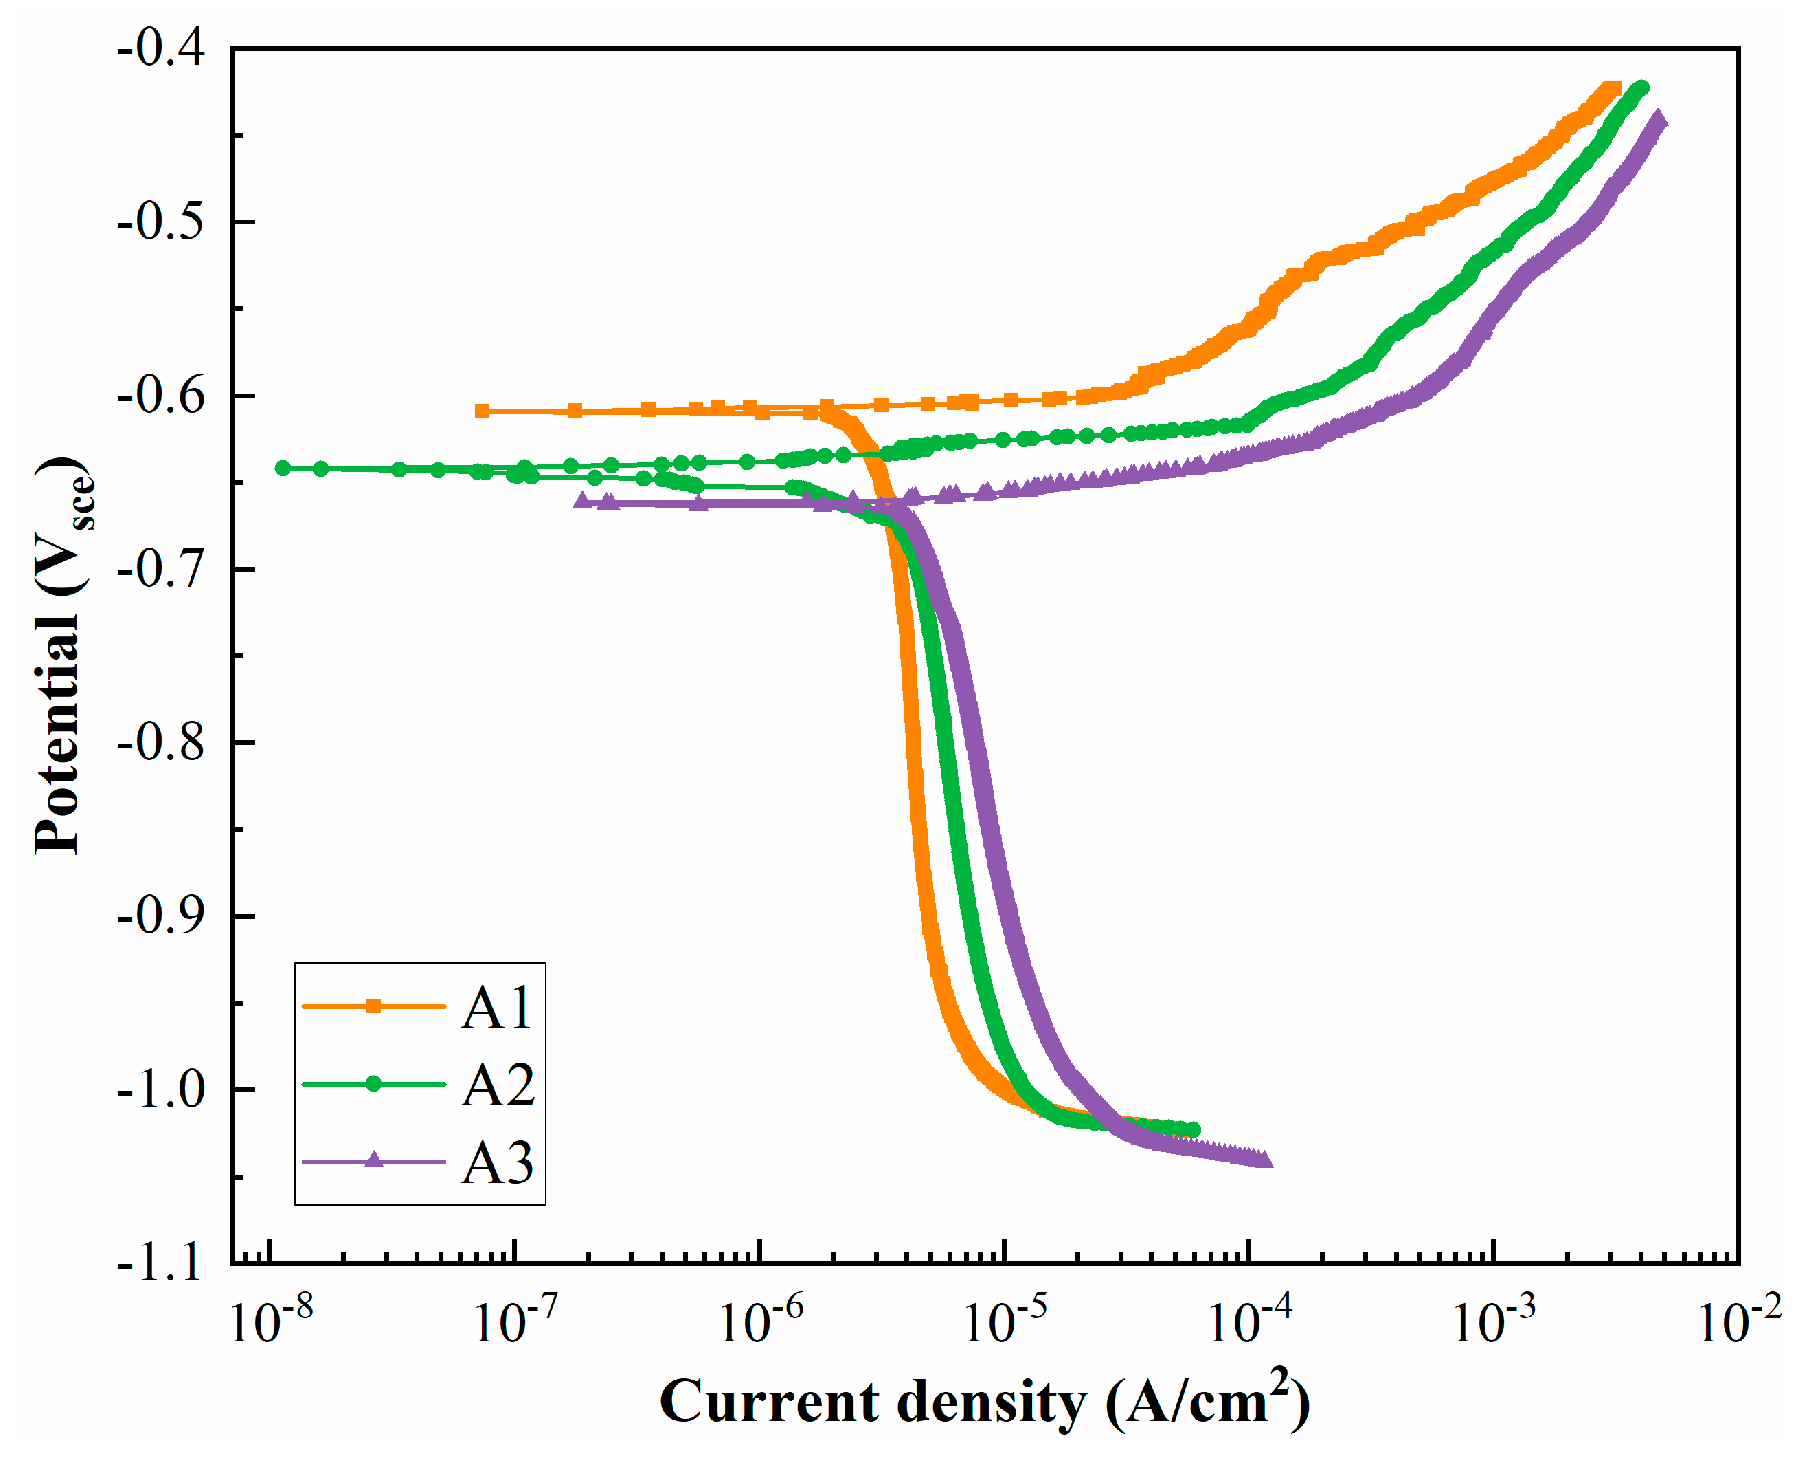
3.2. Intergranular Corrosion and Electrochemical Testing
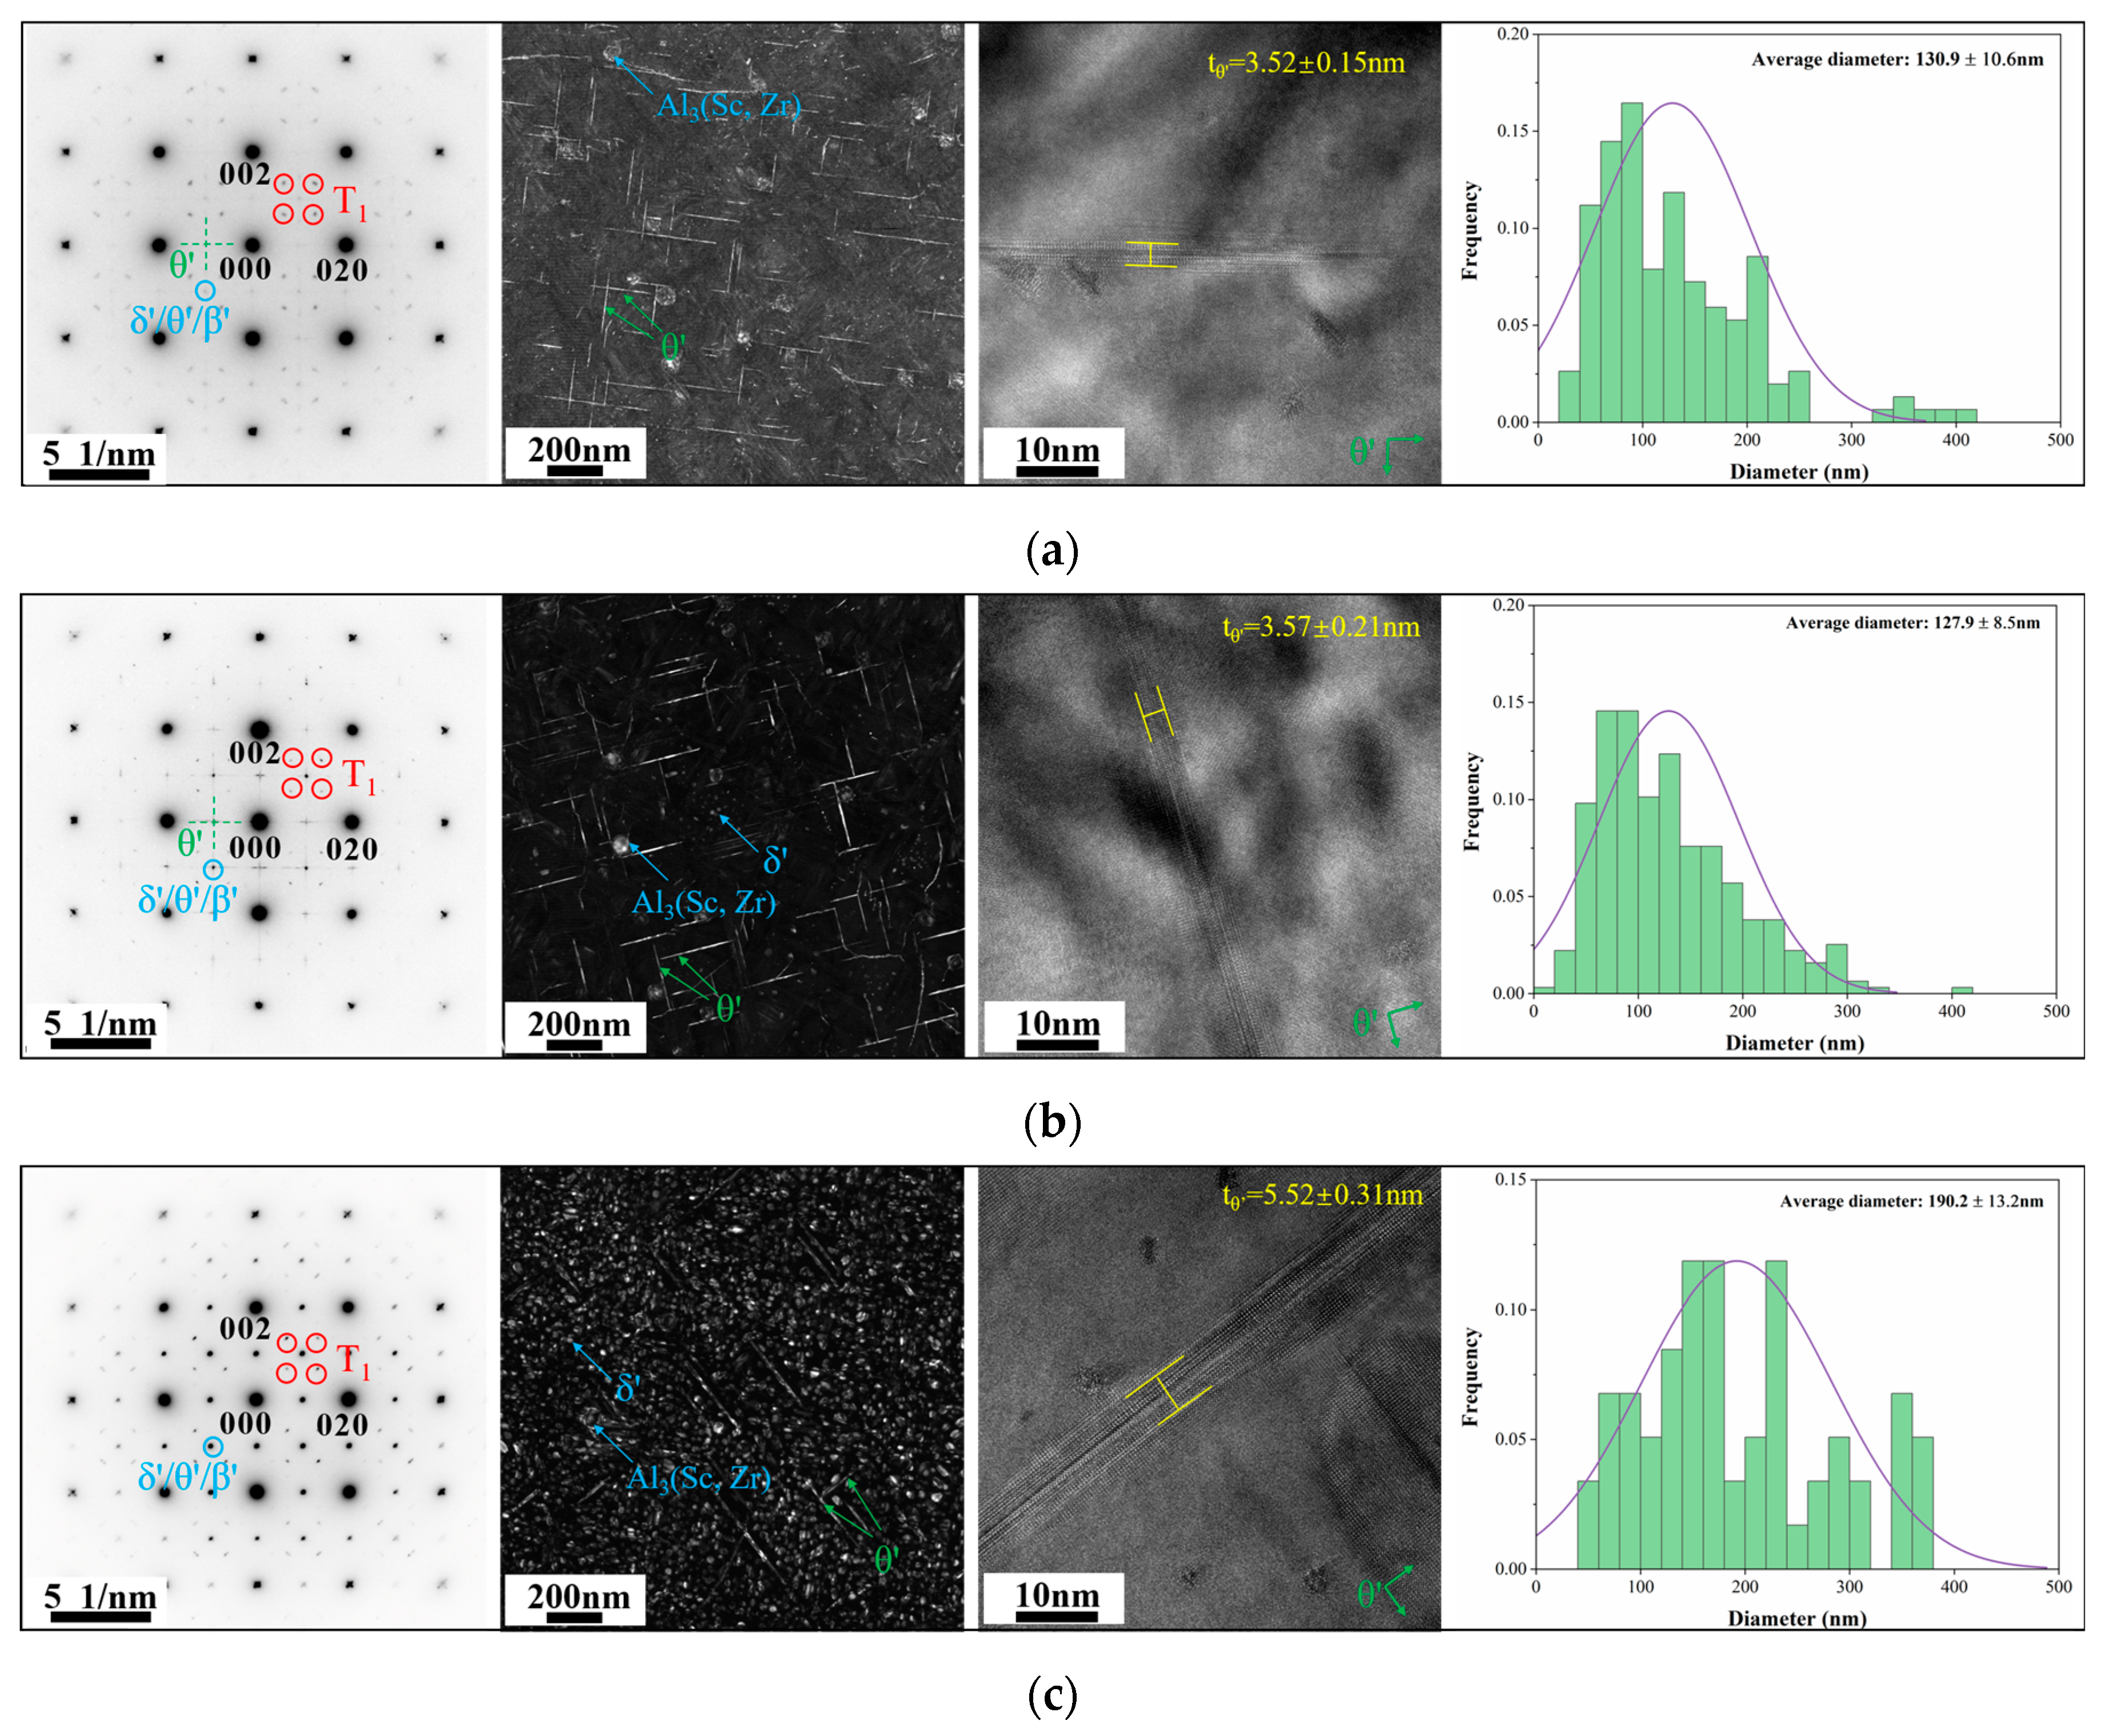
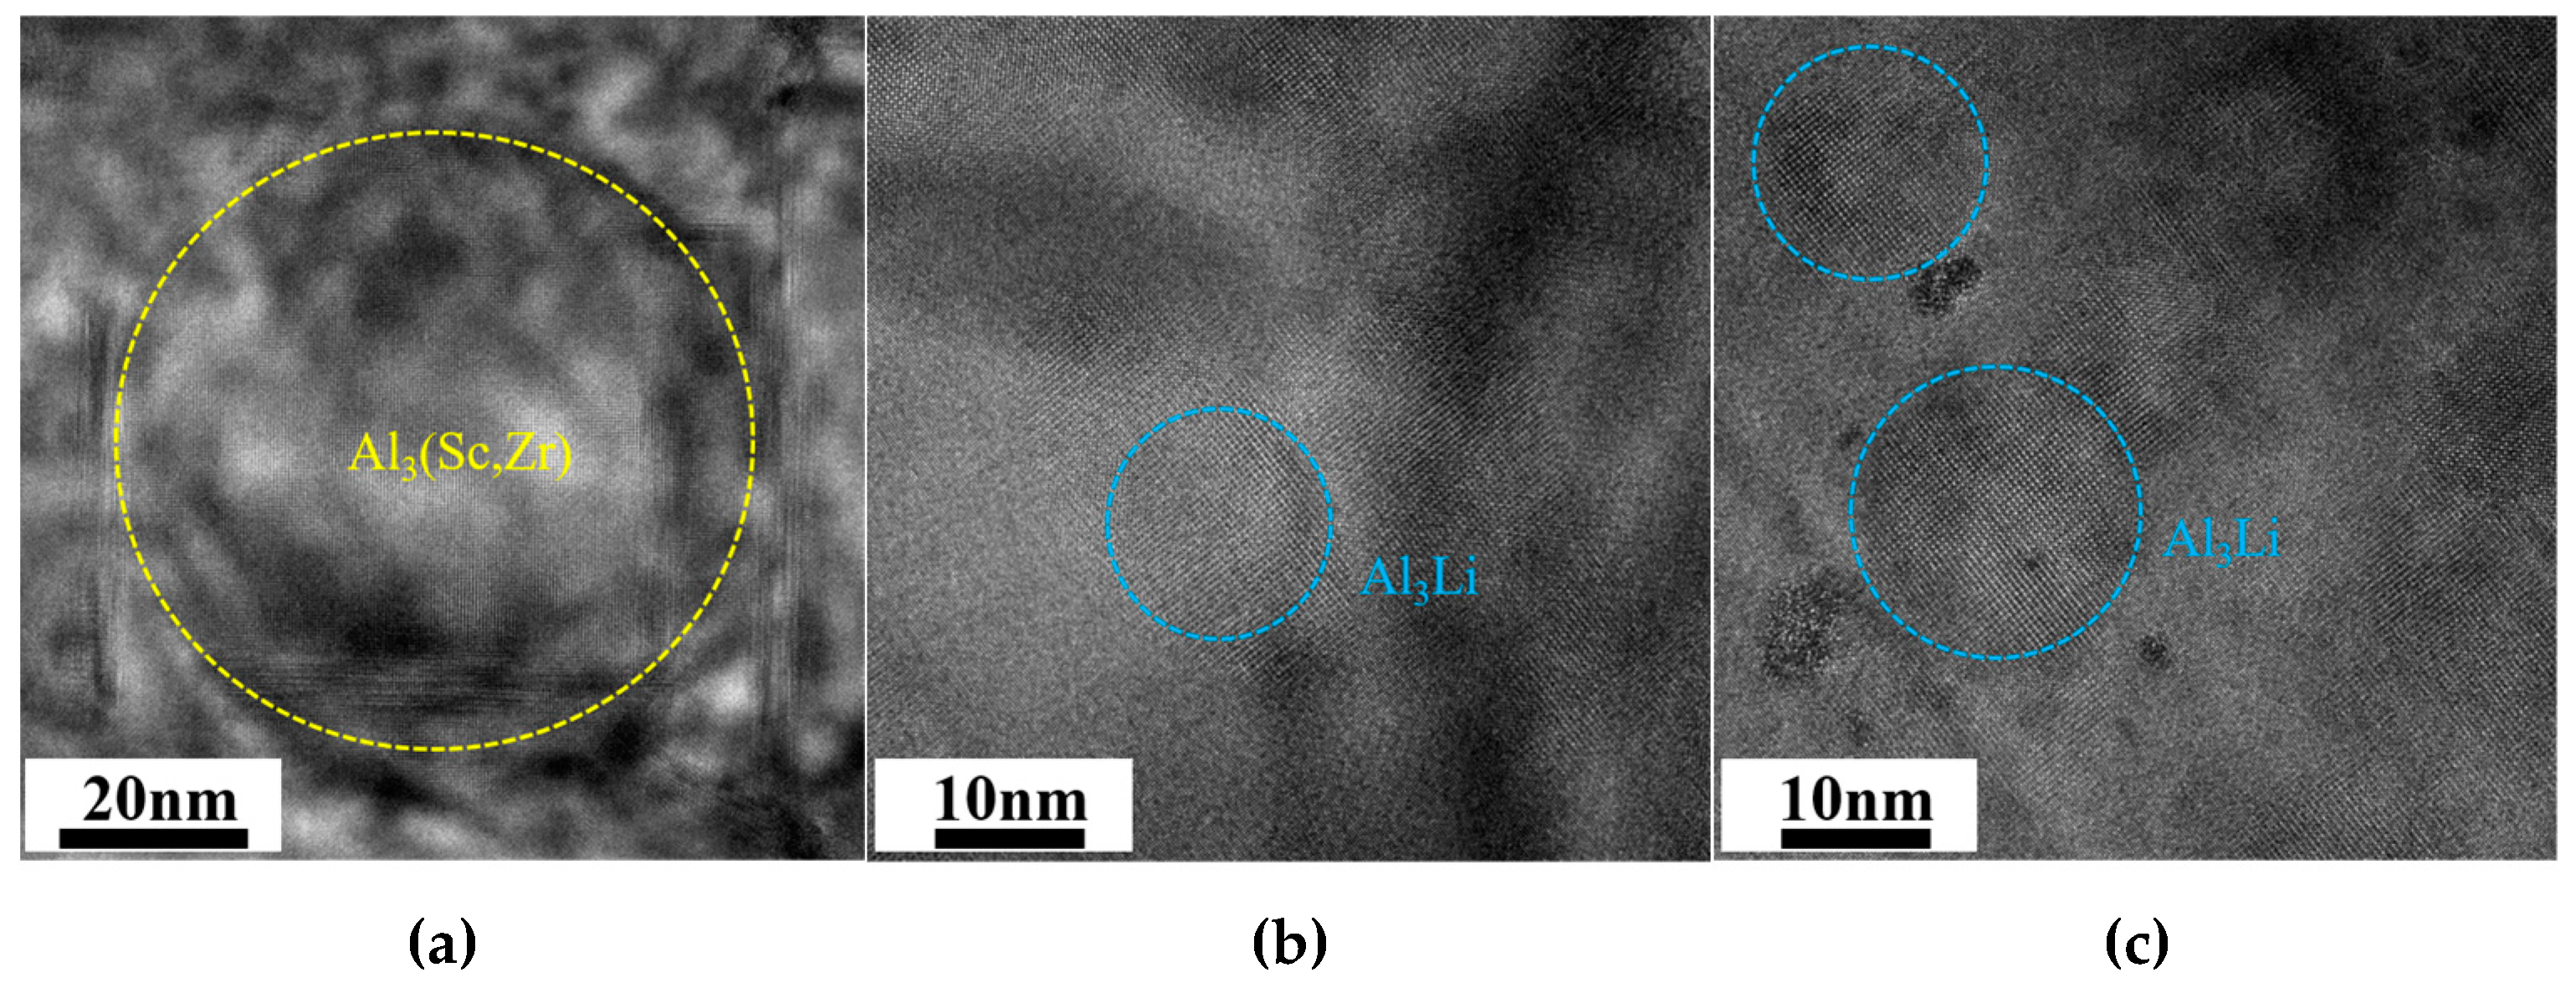
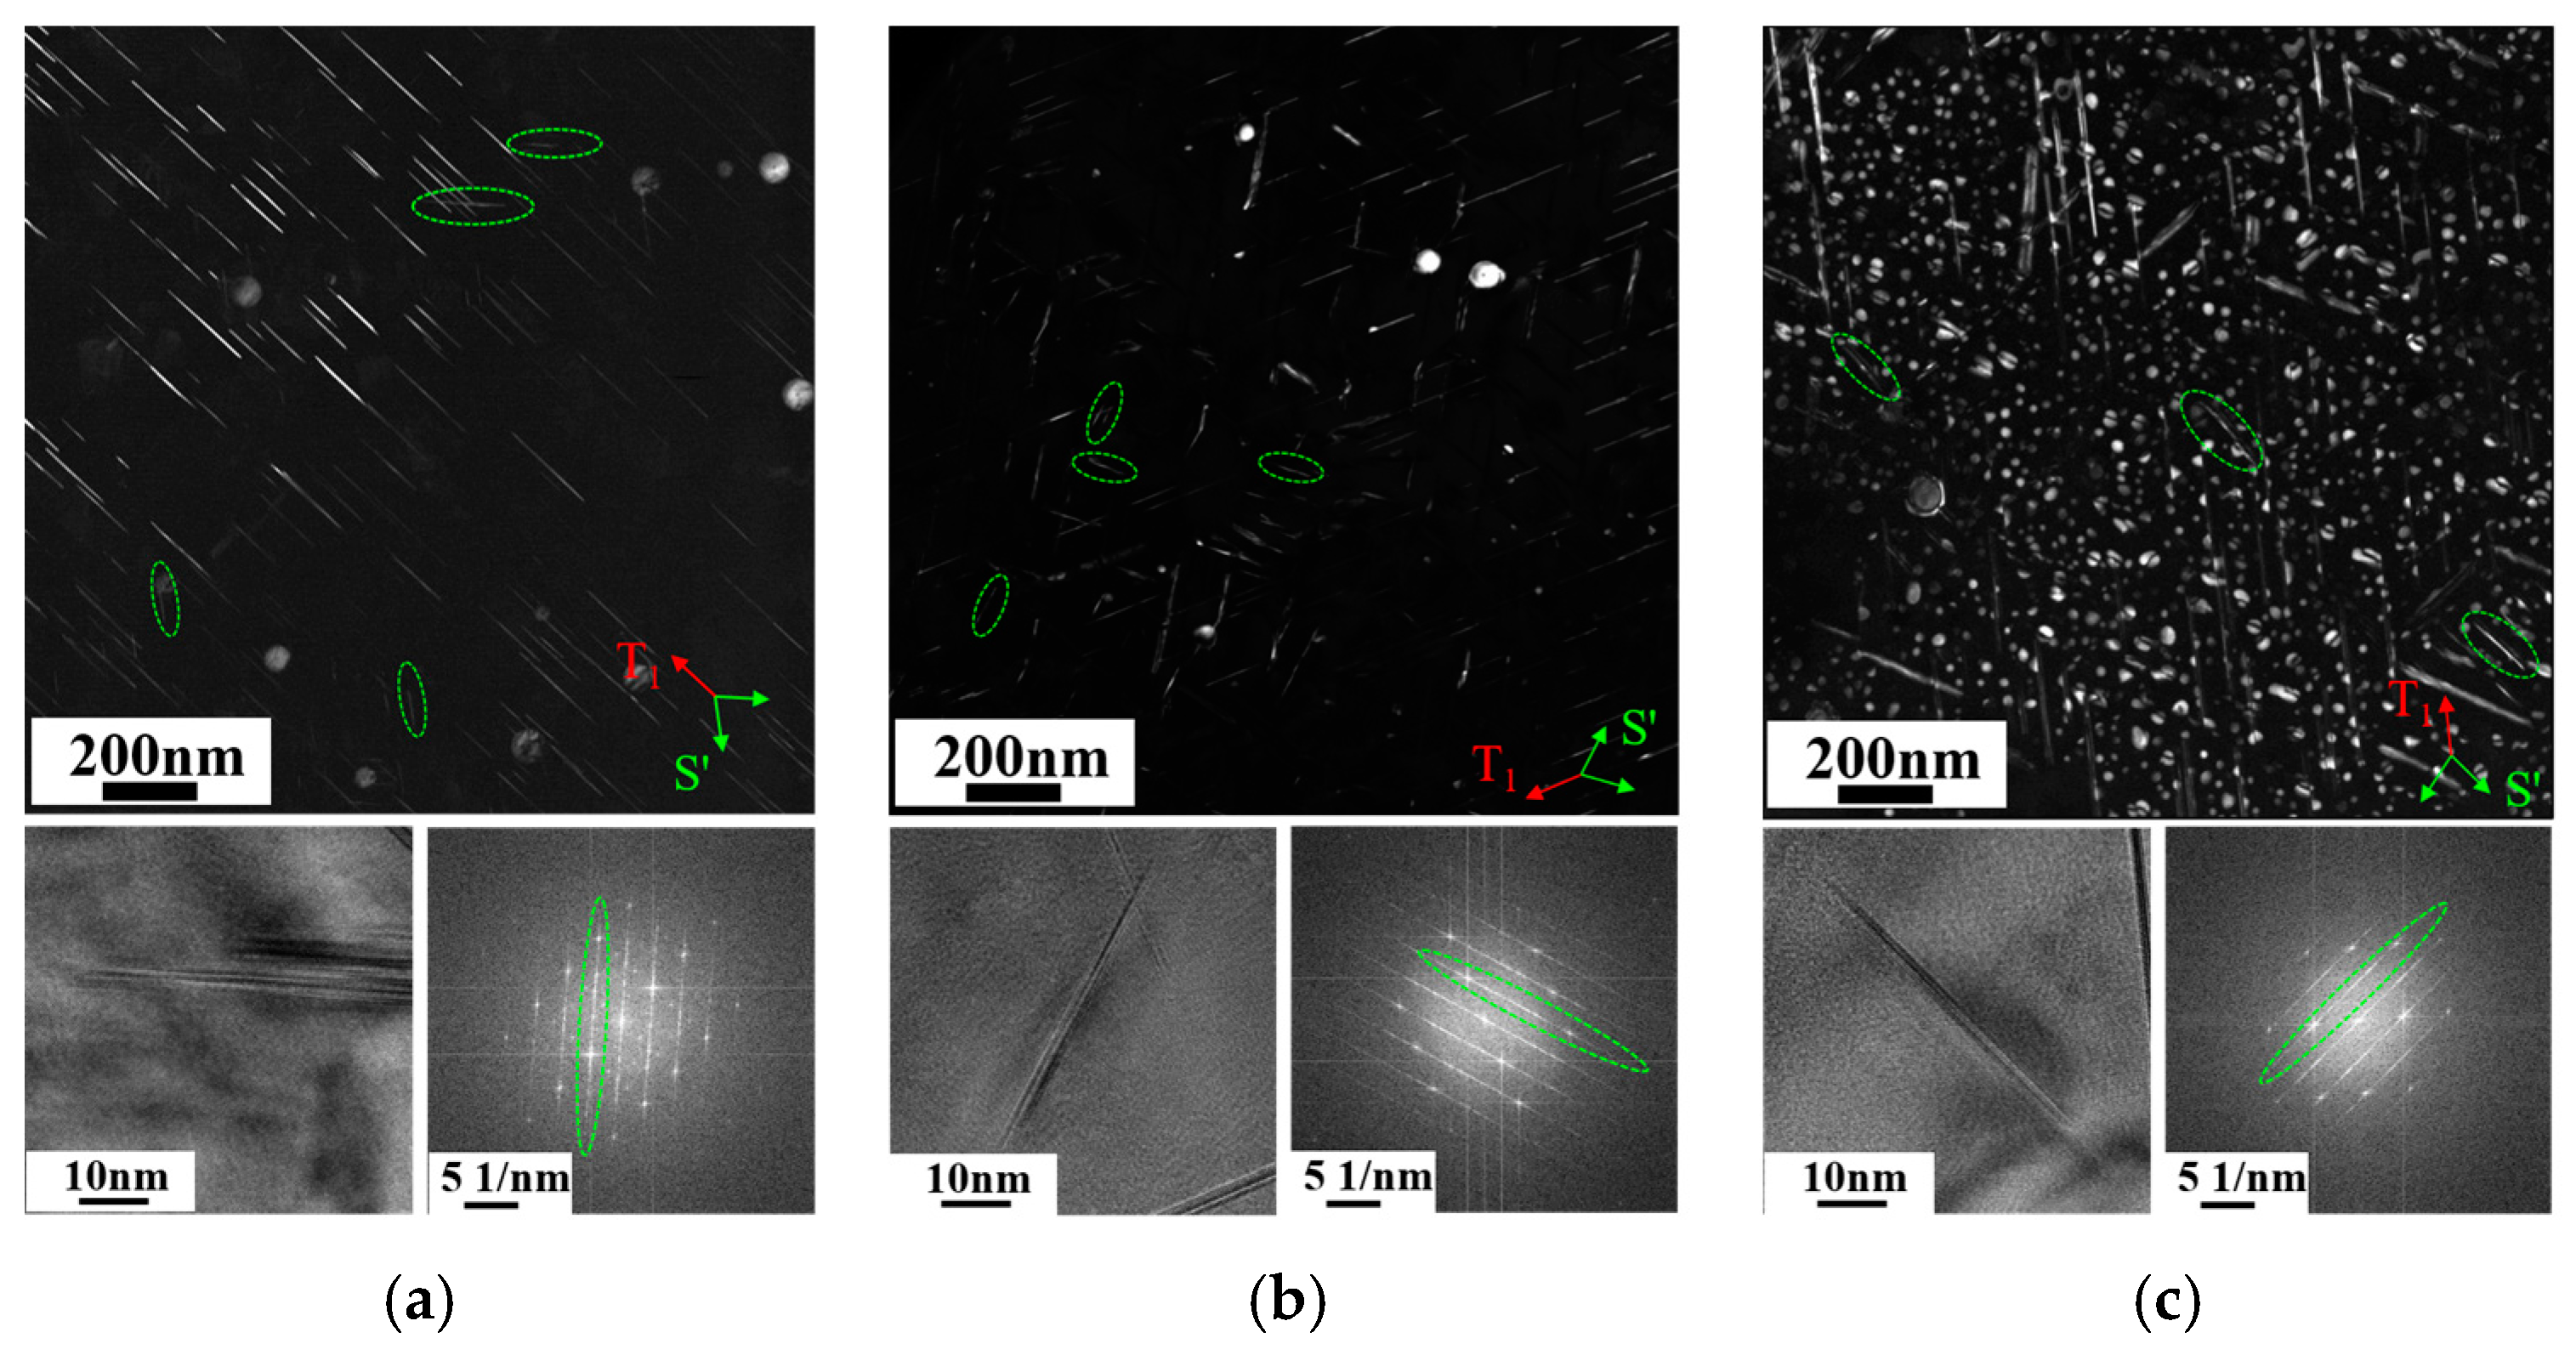
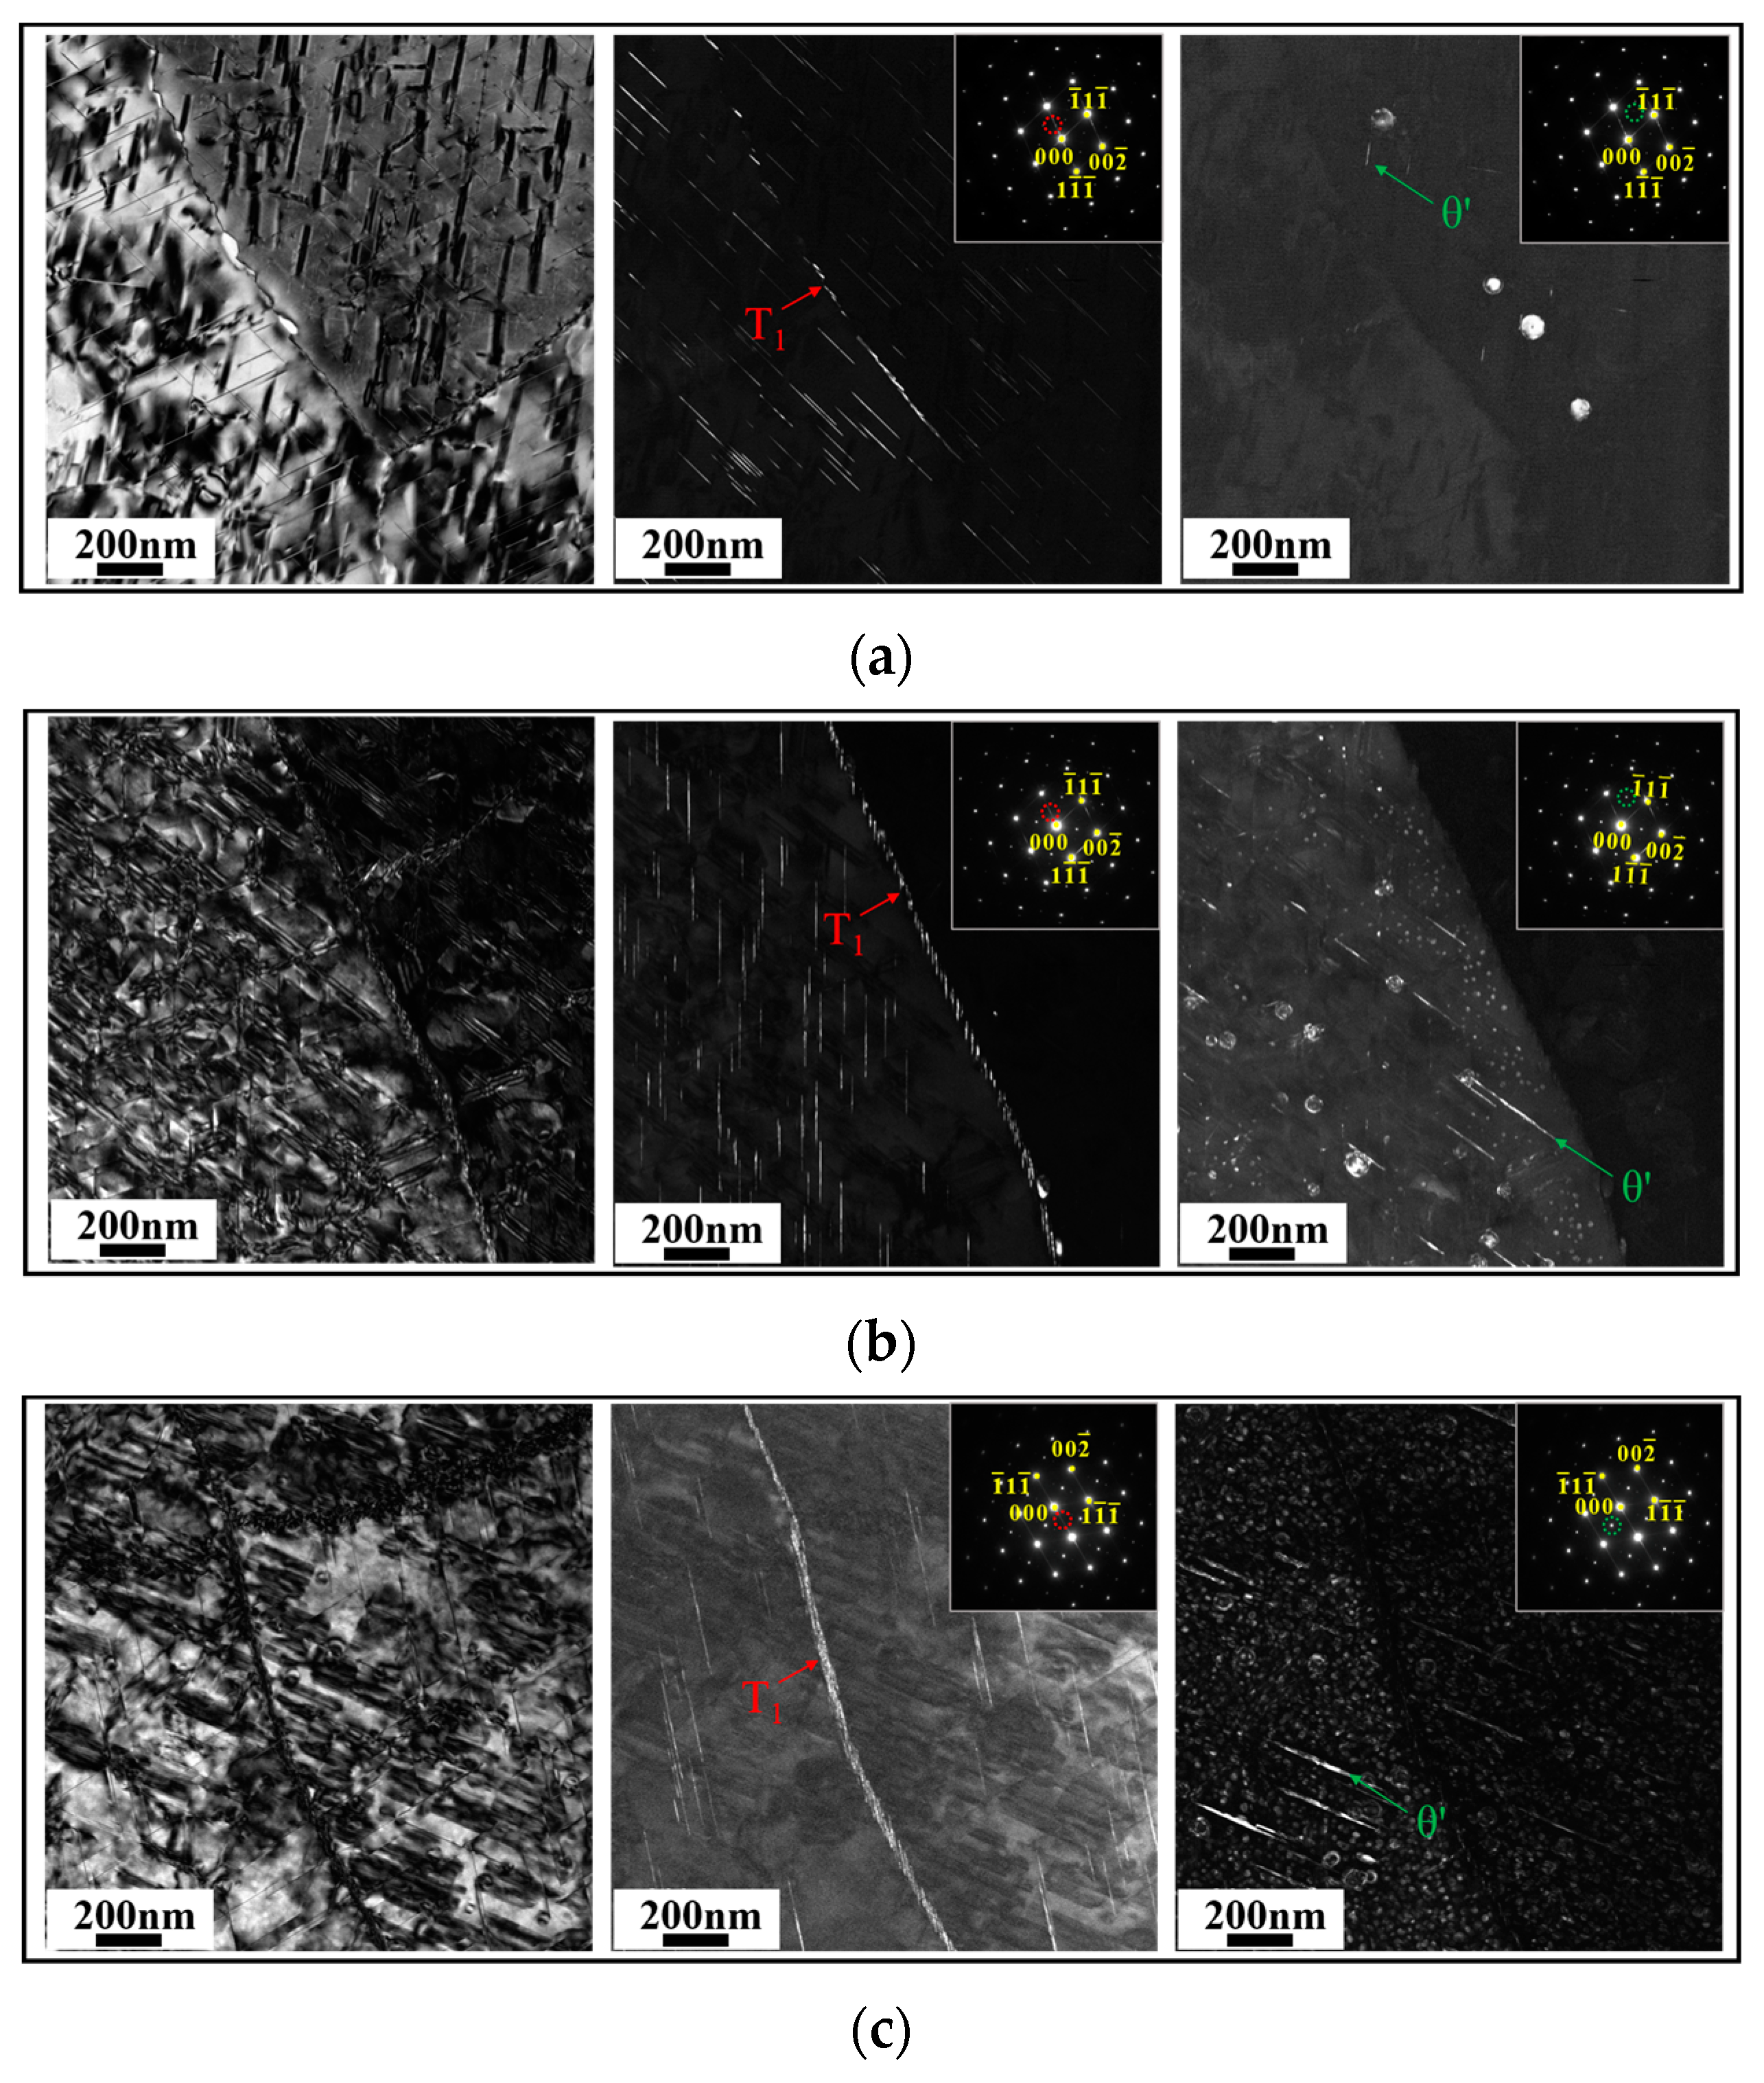
3.3. Characteristics of Intragranular Precipitates
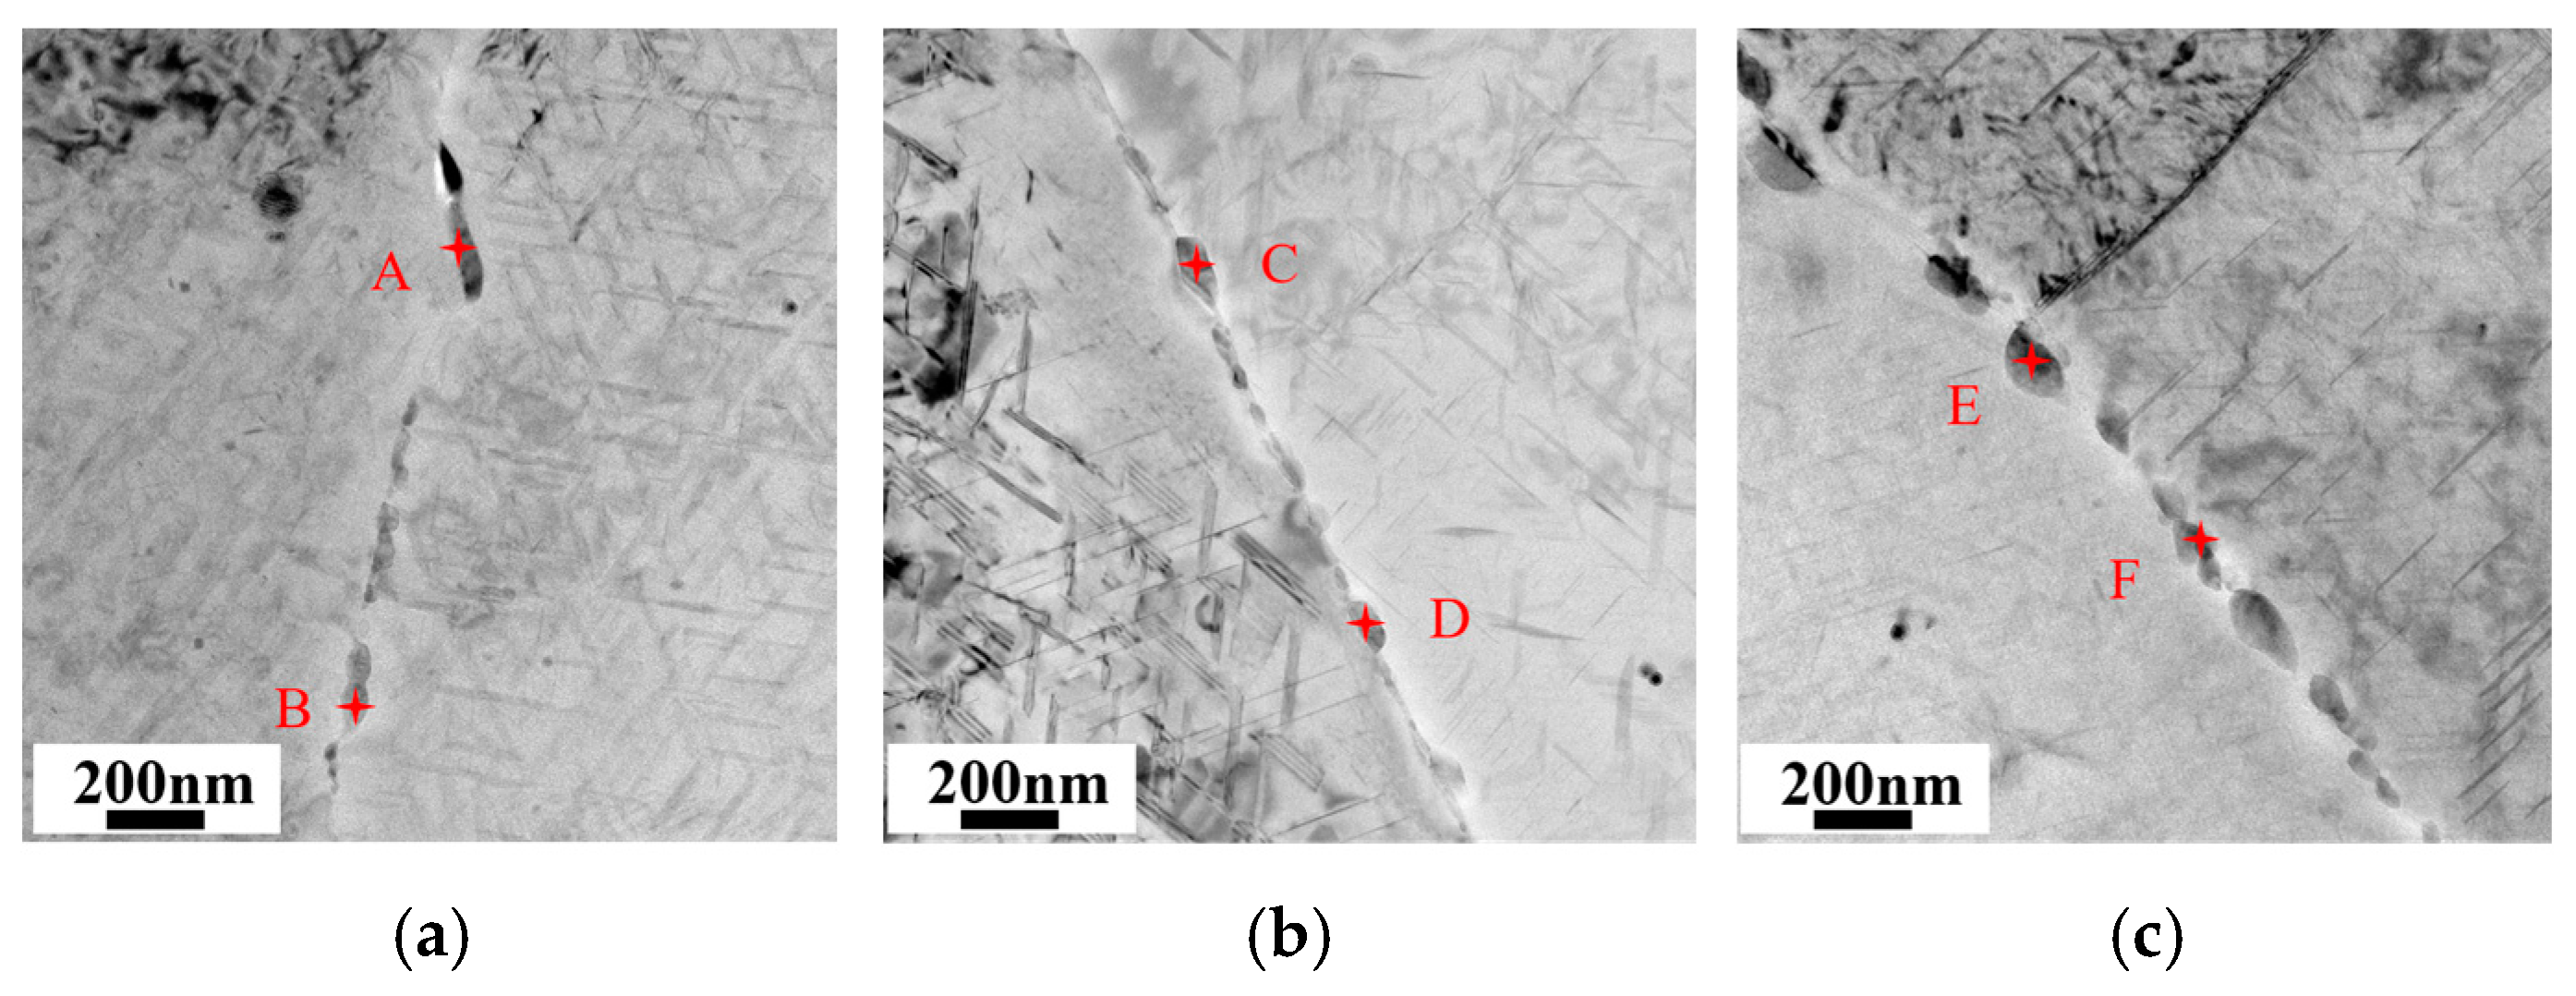
3.4. Characterization of Grain Boundary Precipitates
4. Discussion
4.1. Effect of Cu/Li Ratio on Microstructure
4.2. Effect of Cu/Li Ratio on Mechanical Properties
4.3. Effect of Cu/Li Ratio on Corrosion Behaviors
5. Conclusions
- (1)
- The peak aging strength of the alloys remained relatively consistent but slightly decreased with the decrease in the Cu/Li ratio. The yield strengths were 585 MPa, 578 MPa, and 573 MPa, respectively; however, the elongation of the alloys with low Cu/Li ratios appears to be significantly decreased.
- (2)
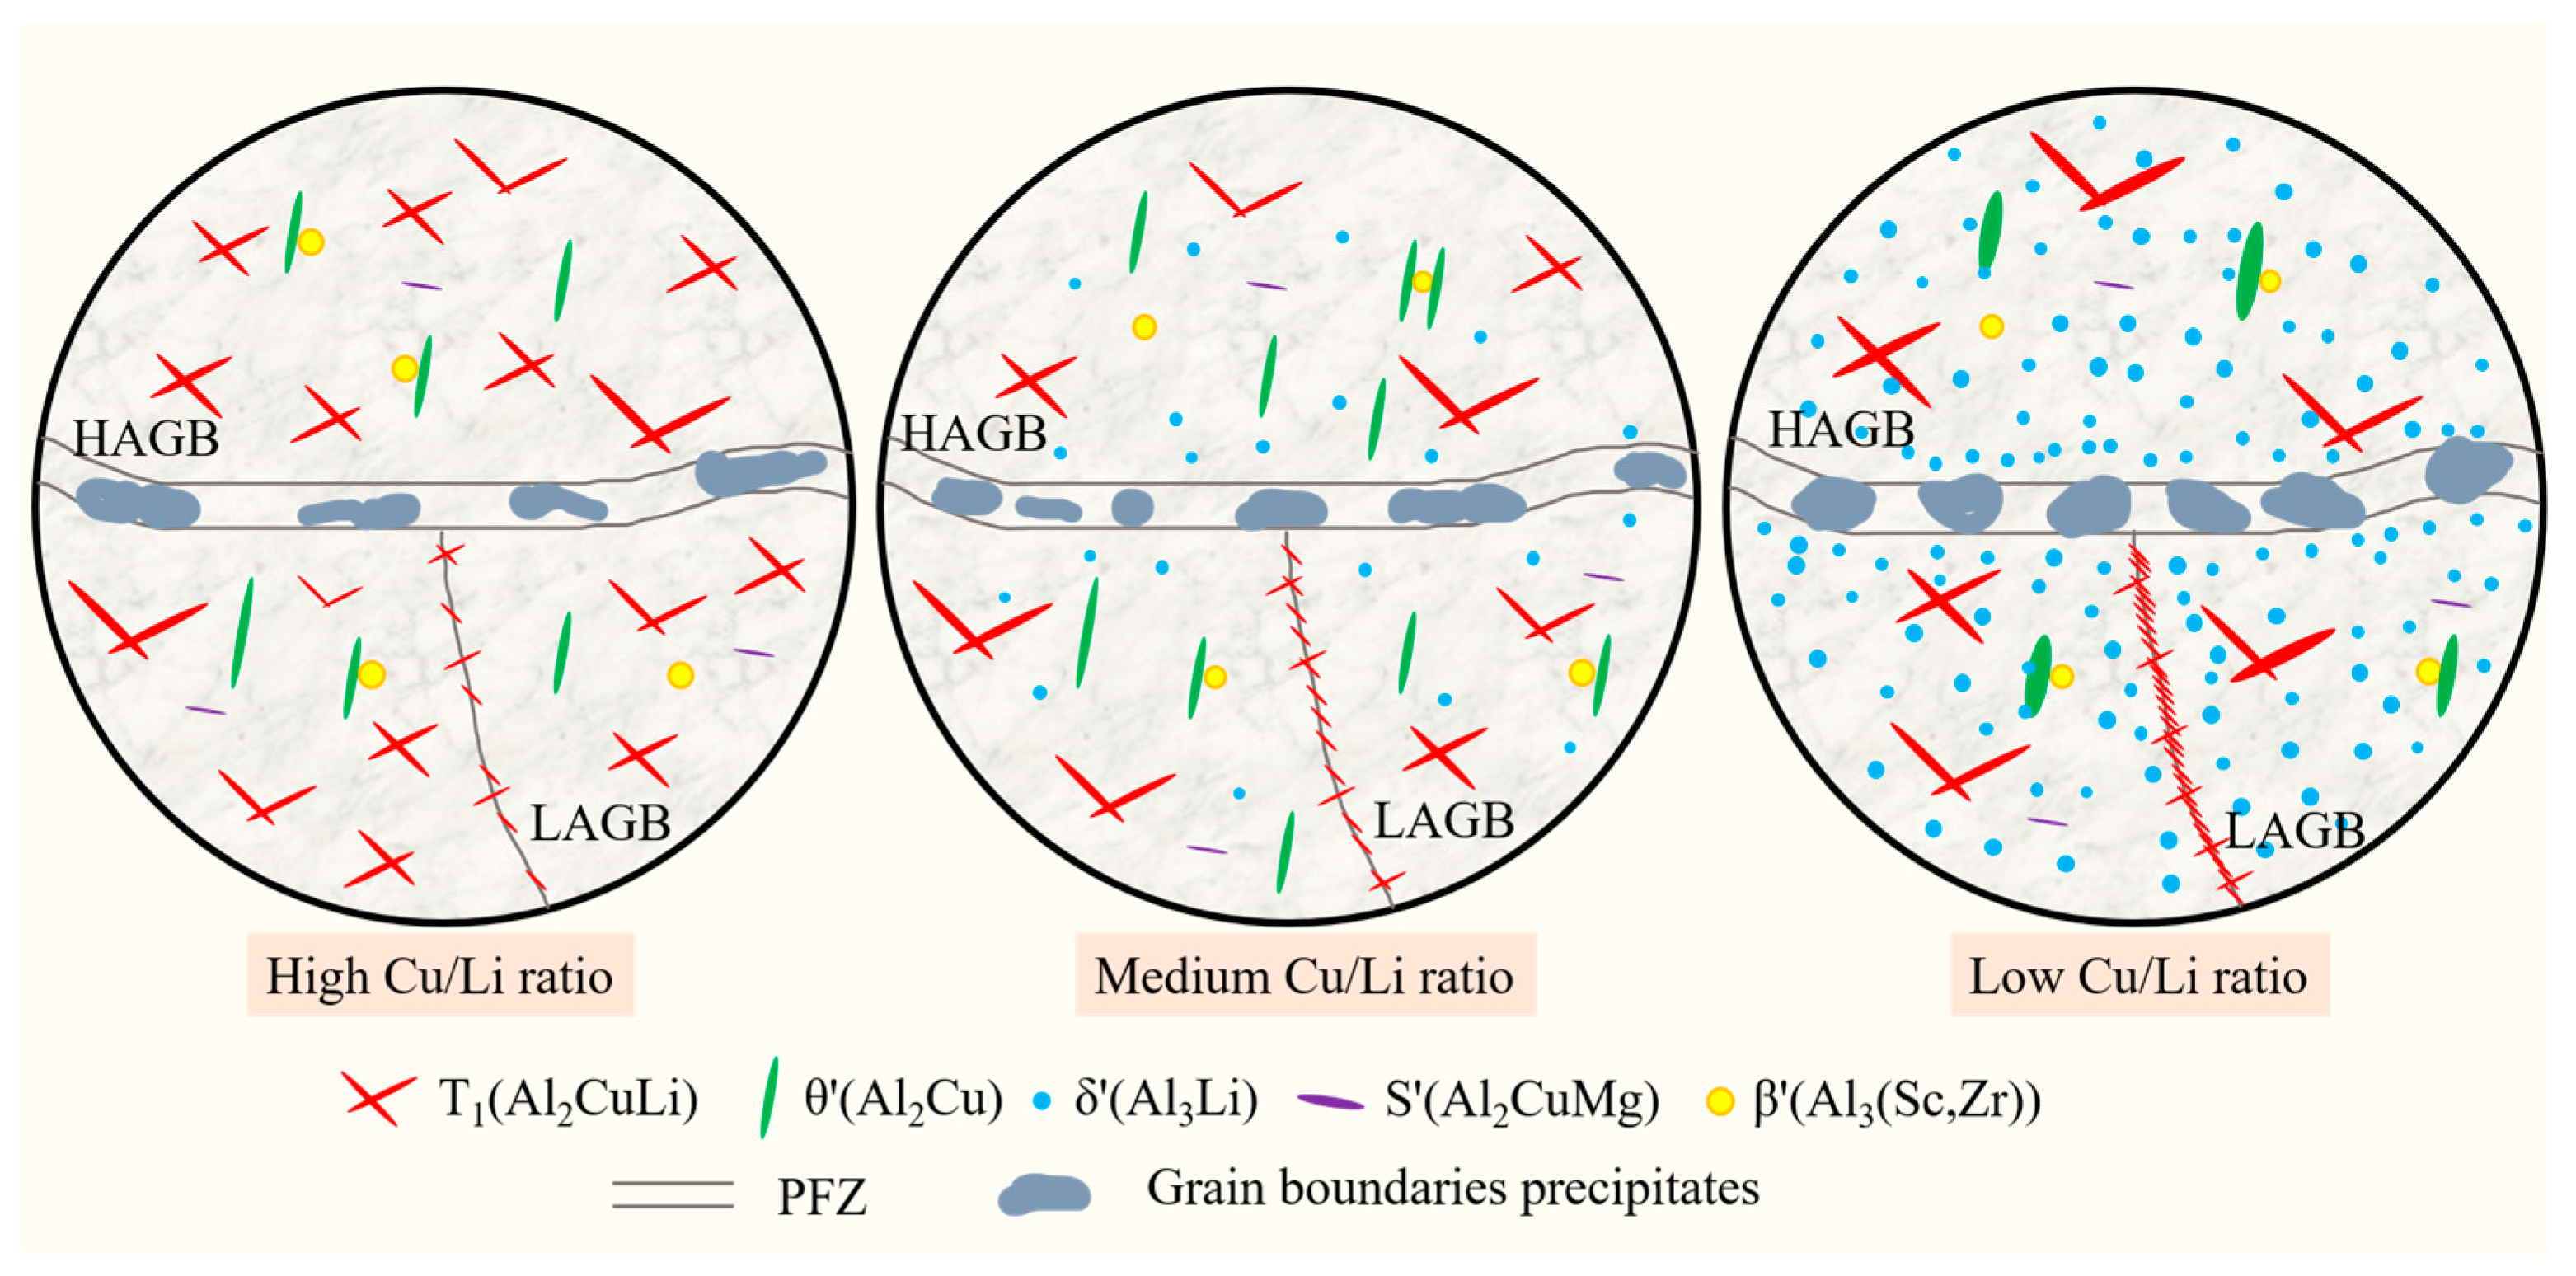
- The changes in the Cu/Li ratio caused different matching patterns of precipitates in the peak aging alloys. The main precipitates of high Cu/Li ratio alloys are T1 and θ′ phases; the main precipitates of medium Cu/Li ratio alloys are T1, θ′ phases, and a small amount of δ′ phases; and the main precipitates of low Cu/Li ratio alloys are δ′ phases, T1 phases, and a small amount of θ′ phases. Meanwhile, minor amounts of the S′ phase are observed in all alloys.
- (3)
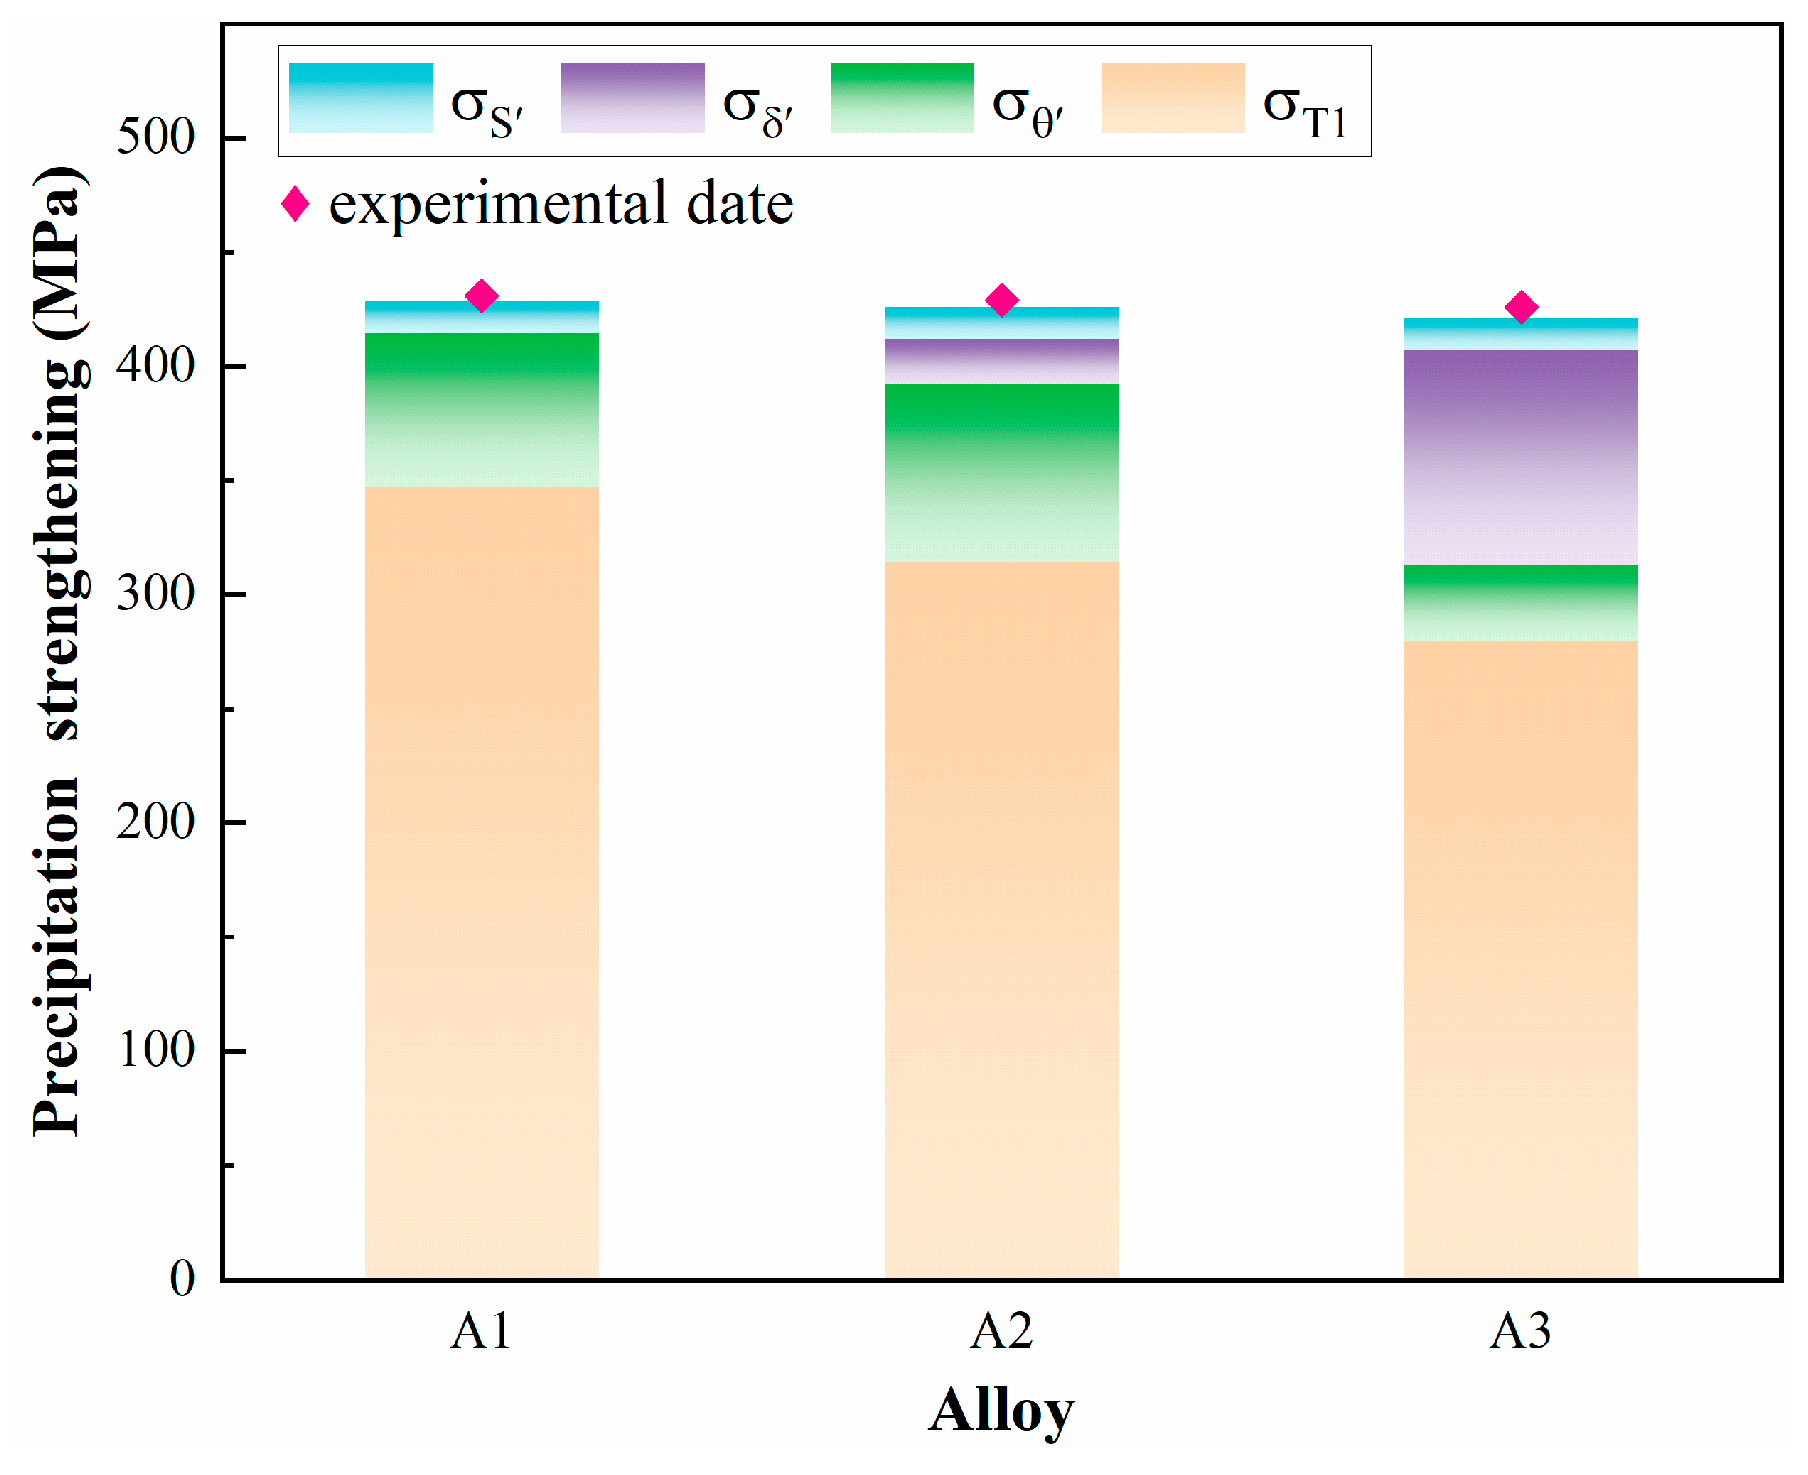
- The cumulative precipitation strengthening by T1, θ′, δ′, and S′ phases is equal within the alloys with different Cu/Li ratios, which are 428 MPa, 426 MPa, and 421 MPa, respectively; however, the strength contribution of the T1 phase decreases from 81% to 66% with the decrease in the Cu/Li ratio.
- (4)
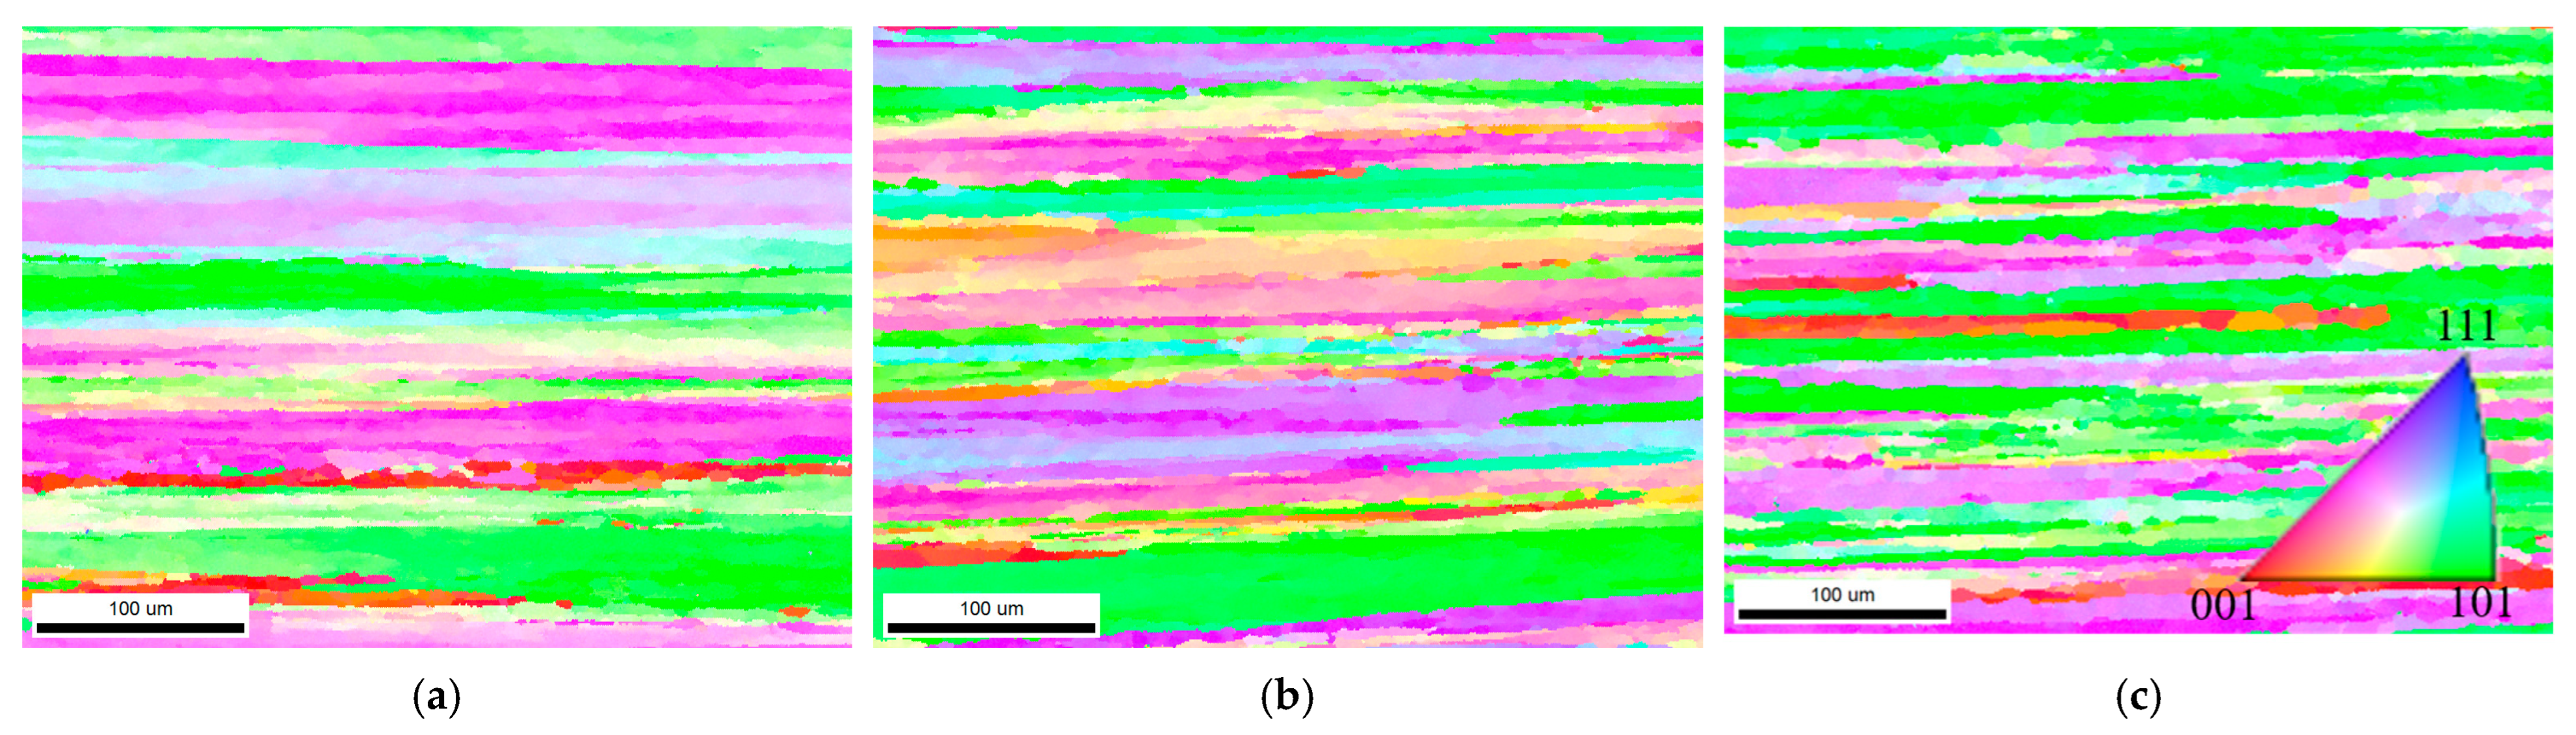
- As the Cu/Li ratio decreases, the precipitates of LAGBs gradually increase in number and are continuously distributed, and the precipitates of HAGBs become larger in size with lower Cu content, all of which leads to a weakening of the IGC resistance within the low Cu/Li ratio alloy.
Author Contributions
Funding
Institutional Review Board Statement
Informed Consent Statement
Data Availability Statement
Conflicts of Interest
References
- El-Aty, A.A.; Xu, Y.; Guo, X.; Zhang, S.H.; Ma, Y.; Chen, D. Strengthening mechanisms, deformation behavior, and anisotropic mechanical properties of Al-Li alloys: A review. J. Adv. Res. 2018, 10, 49–67. [Google Scholar] [CrossRef]
- Dursun, T.; Soutis, C. Recent developments in advanced aircraft aluminium alloys. Mater. Des. 2014, 56, 862–871. [Google Scholar] [CrossRef]
- Rioja, R.J.; Liu, J. The Evolution of Al-Li Base Products for Aerospace and Space Applications. Metall. Mater. Trans. A 2012, 43, 3325–3337. [Google Scholar] [CrossRef]
- Lv, P.; Wang, R.; Peng, C.; Cai, Z. Improved strength and ductility of rapidly solidified 2195 alloy by pre-rolling combined with double aging and interrupted aging. Mater. Sci. Eng. A 2023, 873, 145023. [Google Scholar] [CrossRef]
- Chen, P.C.; Li, X.W.; Yao, Y.; Shi, G.H.; Wen, K.; Li, Z.H.; Zhang, Y.A.; Xiong, B.Q. Hot Deformation Analysis and Microstructure Evolution of a Novel Al-Cu-Li Alloy by Isothermal Compression. Adv. Eng. Mater. 2023, 25, 2201884. [Google Scholar] [CrossRef]
- Liu, D.; Ma, Y.; Li, J.; Liu, C.; Du, Y.; Chen, Y.; Zhang, X.; You, W.; Zhang, R. Quench sensitivity and microstructure evolution of the 2060 Al-Cu-Li alloy with a low Mg content. Mater. Charact. 2021, 177, 111156. [Google Scholar] [CrossRef]
- Liu, S.; Xu, G.; Li, Y.; Tang, L.; Li, H.; Peng, X. Enhanced strength and corrosion resistance of creep-aged AA2050 Al-Li alloy by pre-rolling deformation. Mater. Des. 2023, 226, 111621. [Google Scholar] [CrossRef]
- Xun, C.Y.; Li, X.W.; Wen, K.; Geng, L.; Chen, P.; You, W.; Li, Y.; Li, Z.; Zhang, Y.A.; Xiong, B.Q. Precipitation of Al3Zr Dispersoids under Various Homogenization and Its Effect on Recrystallization in 2198 Al-Cu-Li Alloy. Adv. Eng. Mater. 2023, 25, 2300673. [Google Scholar] [CrossRef]
- Hajjioui, E.A.; Bouchaâla, K.; Faqir, M.; Essadiqi, E. A review of manufacturing processes, mechanical properties and precipitations for aluminum lithium alloys used in aeronautic applications. Heliyon 2023, 9, e12565. [Google Scholar] [CrossRef]
- Zhang, X.; Wu, G.; Zhang, L.; Shi, C. Effects of Mg and Sc additions on the microstructure, mechanical properties, and thermal stability of a cast Al-2Li-2Cu-0.2Zr alloy after thermal exposure. J. Alloys Compd. 2019, 788, 367–382. [Google Scholar] [CrossRef]
- Gumbmann, E.; Lefebvre, W.; Geuser, F.D.; Sigli, C.; Deschamps, A. The effect of minor solute additions on the precipitation path of an Al Cu Li alloy. Acta Mater. 2016, 115, 104–114. [Google Scholar] [CrossRef]
- Decreus, B.; Deschamps, A.; Geuser, F.D.; Donnadieu, P.; Sigli, C.; Weyland, M. The influence of Cu/Li ratio on precipitation in Al-Cu-Li-x alloys. Acta Mater. 2013, 61, 2207–2218. [Google Scholar] [CrossRef]
- Xu, X. Regulation of precipitation behavior among T1, S’, and θ’ phases in Al-Cu-Li-(Mg-Ag) alloys by optimizing Ag/Mg ratios. Mater. Sci. Eng. A 2023, 876, 145158. [Google Scholar] [CrossRef]
- Xie, Y.; Liu, S.; Guo, X.; Deng, Y. Development of ultra-high strength Al-Cu-Li alloys containing high Mg through the combination of pre-stretching and age-hardening. Mater. Sci. Eng. A 2024, 896, 146289. [Google Scholar] [CrossRef]
- Liu, D.Y.; Li, J.F.; Lin, Y.C.; Ma, P.C.; Chen, Y.L.; Zhang, X.H.; Zhang, R.F. Cu/Li Ratio on the Microstructure Evolution and Corrosion Behaviors of Al-xCu-yLi-Mg Alloys. Acta Metall. Sin. 2020, 33, 1201–1216. [Google Scholar] [CrossRef]
- Huang, J.Y.; Ming, W.Q.; Wu, C.L. Effect of microstructure on corrosion behaviour of Al-Cu-Li alloys. Mater. Charact. 2022, 194, 112416. [Google Scholar] [CrossRef]
- Ma, J.; Liu, X.C.; Yan, D.S.; Rong, L.J. A novel GP-Li precursor and the correlated precipitation behaviors in Al-Cu-Li alloys with different Cu/Li ratio. Acta Mater. 2023, 243, 118442. [Google Scholar] [CrossRef]
- Li, J.; Liu, P.; Chen, Y.; Zhang, X.; Zheng, Z. Microstructure and mechanical properties of Mg, Ag and Zn multi-microalloyed Al–(3.2–3.8)Cu–(1.0–1.4)Li alloys. Trans. Nonferrous Met. Soc. China 2015, 25, 2103–2112. [Google Scholar] [CrossRef]
- Xu, X.; Wu, G.H.; Zhang, L.; Tong, X. New insight into enhancing the comprehensive mechanical performance in non-stretched Al-Cu-Li-(Mg)-(Ag)-Mn-Zr alloys. Mater. Lett. 2024, 360, 135899. [Google Scholar] [CrossRef]
- Xie, Y.K.; Liu, S.; Guo, X.; Liang, C.; Deng, Y. Enhancing the strength of Sc-containing Al-Cu-Li alloys by modifying the precipitation behavior through plastic deformation and heat treatment. Mater. Charact. 2024, 207, 113558. [Google Scholar] [CrossRef]
- Wang, Y.; Wu, G.; Zhang, L.; Guo, Y.; Wang, C.; Li, L.; Xiong, X. Enhanced strength and ductility in sand-cast Al-Li-Cu-Mg-Zr alloy via synergistic microalloying with Sc and Ti. J. Alloys Compd. 2023, 962, 170954. [Google Scholar] [CrossRef]
- Li, C.L.; Li, X.W.; Zhang, Y.A.; Wen, K.; Xiao, W.; Li, Y.; Yu, M.Y.; Gao, G.; Li, Z.H.; Xiong, B.Q. Effect of Sc content on microstructure characteristics and evolution of W phase in Al-Cu-Li alloys under as-cast and homogenization conditions. J. Mater. Res. Technol. 2023, 25, 7335–7352. [Google Scholar] [CrossRef]
- Deng, P.; Mo, W.; Ouyang, Z.; Tang, C.; Luo, B.; Bai, Z. Mechanical properties and corrosion behaviors of (Sc, Zr) modified Al-Cu-Mg alloy. Mater. Charact. 2023, 196, 112619. [Google Scholar] [CrossRef]
- Wang, Y.; Zhang, S.; Wu, R.; Turakhodjaev, N.; Hou, L.; Zhang, J.; Betsofen, S. Coarsening kinetics and strengthening mechanisms of core-shell nanoscale precipitates in Al-Li-Yb-Er-Sc-Zr alloy. J. Mater. Sci. Technol. 2021, 61, 197–203. [Google Scholar] [CrossRef]
- Yu, T.; Li, B.; Medjahed, A.; Hou, L.; Wu, R.; Zhang, J.; Sun, J.; Zhang, M. Impeding effect of the Al3(Er,Zr,Li) particles on planar slip and intergranular fracture mechanism of Al-3Li-1Cu-0.1Zr-X alloys. Mater. Charact. 2019, 147, 146–154. [Google Scholar] [CrossRef]
- Jiang, B.; Yi, D.; Yi, X.; Zheng, F.; Wang, H.; Wang, B.; Liu, H.; Hu, Z. Effect of trace amounts of added Sc on microstructure and mechanical properties of 2055 aluminum alloy. Mater. Charact. 2018, 141, 248–259. [Google Scholar] [CrossRef]
- Hardy, H.K.; Silock, J.M. The phase sections at 500 and 350 °C of aluminum-rich aluminum-copper-lithium Al-alloys. J. Inst. Met. 1956, 84, 423–428. [Google Scholar]
- Noble, B.; Thompson, G.E. T1(Al2CuLi) Precipitation in Aluminium-Copper-Lithium Alloys. Met. Sci. J. 1972, 6, 167–174. [Google Scholar] [CrossRef]
- Gao, Z.; Liu, J.Z.; Chen, J.H.; Duan, S.Y.; Liu, Z.R.; Ming, W.Q.; Wu, C.L. Formation mechanism of precipitate T1 in AlCuLi alloys. J. Alloys Compd. 2015, 624, 22–26. [Google Scholar] [CrossRef]
- Yoshimura, R.; Konno, T.J.; Abe, E.; Hiraga, K. Transmission electron microscopy study of the evolution of precipitates in aged Al-Li-Cu alloys: The θ′ and T1 phases. Acta Mater. 2003, 51, 4251–4266. [Google Scholar] [CrossRef]
- Gutiérrez-Urrutia, I. Study of isothermal δ′ (Al3Li) precipitation in an Al-Li alloy by thermoelectric power. J. Mater. Sci. 2011, 46, 3144–3150. [Google Scholar] [CrossRef]
- Duan, S.Y.; Wu, C.L.; Gao, Z.; Cha, L.M.; Fan, T.W.; Chen, J.H. Interfacial structure evolution of the growing composite precipitates in Al-Cu-Li alloys. Acta Mater. 2017, 129, 352–360. [Google Scholar] [CrossRef]
- Li, S.; Wang, Q.; Chen, J.; Wu, C. The effect of thermo-mechanical treatment on the formation of T1 phase and δ′/θ′/δ′ composite precipitate in an Al-Cu-Li-Mg alloy. Mater. Charact. 2021, 176, 111123. [Google Scholar] [CrossRef]
- Nie, J.F.; Muddle, B.C. Microstructural design of high-strength aluminum alloys. J. Phase Equilibria 1998, 19, 543–551. [Google Scholar] [CrossRef]
- Dorin, T.; Deschamps, A.; Geuser, F.D.; Sigli, C. Quantification and modelling of the microstructure/strength relationship by tailoring the morphological parameters of the T1 phase in an Al-Cu-Li alloy. Acta Mater. 2014, 75, 134–146. [Google Scholar] [CrossRef]
- Dorin, T.; Geuser, F.D.; Lefebvre, W.; Sigli, C.; Deschamps, A. Strengthening mechanisms of T1 precipitates and their influence on the plasticity of an Al-Cu-Li alloy. Mater. Sci. Eng. A 2014, 605, 119–126. [Google Scholar] [CrossRef]
- Zeng, G.; Li, H.; Deng, S.; Ma, P.; Chen, Y.; Liu, T.; Li, J.; Liu, D.; Xu, G. Detailed investigation on microstructure and strengthening contribution of Al-xCu-1.3Li-X alloy sheets. Mater. Charact. 2023, 205, 113278. [Google Scholar] [CrossRef]
- Zhang, Z.; Lin, W.; Zheng, C. Co-strengthening contribution of δ′ and T1 precipitates in Al-Li alloys 2090 and 2090+ Ce. Rare Met. 2006, 25, 197–201. [Google Scholar]
- Yang, X.; Wang, J.; Wang, S.; Li, X.; Xue, C.; Tian, G.; Zhang, Y.; Ke, Y.; Xie, Z. Quantifying the kinetics of δ′ precipitates in a novel Al-Li-Cu-Mg alloy during two-step aging by small-angle neutron scattering. Mater. Sci. Eng. A 2023, 872, 144963. [Google Scholar] [CrossRef]
- Krug, M.E.; Mao, Z.; Seidman, D.N.; Dunand, D.C. Comparison between dislocation dynamics model predictions and experiments in precipitation-strengthened Al-Li-Sc alloys. Acta Mater. 2014, 79, 382–395. [Google Scholar] [CrossRef]
- GB/T 7998-2023; Method for Evaluating the Susceptibility to Intergranular Corrosion of Aluminum Alloys. National Standard of the People’s Republic of China: Beijing, China, 2023.
- Norman, A.F.; Hyde, K.; Costello, F.; Thompson, S.; Birley, S.; Prangnell, P.B. Examination of the effect of Sc on 2000 and 7000 series aluminium alloy castings: For improvements in fusion welding. Mater. Sci. Eng. A 2003, 354, 188–198. [Google Scholar] [CrossRef]
- Lee, S.L.; Wu, C.T.; Chen, Y.D. Effects of Minor Sc and Zr on the Microstructure and Mechanical Properties of Al-4.6Cu-0.3Mg-0.6Ag Alloys. J. Mater. Eng. Perform. 2015, 24, 1165–1172. [Google Scholar] [CrossRef]
- Liu, Q.; Fan, G.; Tan, Z.; Li, Z.; Zhang, D.; Wang, J.; Zhang, H. Precipitation of Al3Zr by two-step homogenization and its effect on the recrystallization and mechanical property in 2195 Al-Cu-Li alloys. Mater. Sci. Eng. A 2021, 821, 141637. [Google Scholar] [CrossRef]
- Radmilovic, V.; Ophus, C.; Marquis, E.A.; Rossell, M.D.; Tolley, A.; Gautam, A.; Asta, M.; Dahmen, U. Highly monodisperse core-shell particles created by solid-state reactions. Nat. Mater. 2011, 10, 710–715. [Google Scholar] [CrossRef]
- He, J.; Hu, M.; Zhou, Z.; Li, C.; Sun, Y.; Zhu, X. Effect of initial grain size on hot deformation behavior and recrystallization mechanism of Al-Zn-Mg-Cu alloy. Mater. Charact. 2024, 212, 114012. [Google Scholar] [CrossRef]
- Wang, X.; Li, G.; He, Q.; Jiang, J.; Li, D.; Shao, W.; Zhen, L. Intergranular corrosion of an Al-Cu-Li alloy: The influence from grain structure. Corros. Sci. 2023, 211, 110845. [Google Scholar] [CrossRef]
- Rodgers, B.I.; Prangnell, P.B. Quantification of the influence of increased pre-stretching on microstructure-strength relationships in the Al-Cu-Li alloy AA2195. Acta Mater. 2016, 108, 55–67. [Google Scholar] [CrossRef]
- Ghosh, M.; Miroux, A.; Kestens, L.A. Experimental study and modelling of the role of solutes, precipitates and temperature on the work-hardening of AA6xxx aluminium alloys. Mater. Sci. Eng. A 2021, 805, 140615. [Google Scholar] [CrossRef]
- Cui, S.; Zhang, C.; Liu, M.; Chen, L.; Zhao, G. Precipitation behavior of an Al-Cu-Li-X alloy and competing relationships among precipitates at different aging temperatures. Mater. Sci. Eng. A 2021, 814, 141125. [Google Scholar] [CrossRef]
- Xu, X.; Wu, G.; Zhang, L.; Tong, X.; Zhang, X.; Sun, J.; Li, L.; Xiong, X. Effects of heat treatment and pre-stretching on the mechanical properties and microstructure evolution of extruded 2050 Al-Cu-Li alloy. Mater. Sci. Eng. A 2022, 845, 143236. [Google Scholar] [CrossRef]
- Zhu, A.W.; Starke, E.A. Strengthening effect of unshearable particles of finite size: A computer experimental study. Acta Mater. 1999, 47, 3263–3269. [Google Scholar] [CrossRef]
- Deng, S.X.; Li, J.F.; Ning, H.; Lu, D.D.; Zeng, G.J.; Liu, Z.Z.; Xiang, H.; Que, J.R.; Liu, D.Y. Effect of Zr addition on the microstructure evolution and mechanical properties of extruded Al-Cu-Li-Mn alloys. Mater. Charact. 2023, 202, 113011. [Google Scholar] [CrossRef]
- Zhao, Z.L.; Chen, Z.; Liu, L. The Effect of Precipitates on Anisotropy of Al-Li Alloys 2090 and 2090+ Ce. Int. Conf. Manuf. Sci. Eng. 2009, 101, 496–499. [Google Scholar] [CrossRef]
- Styles, M.J.; Hutchinson, C.R.; Chen, Y.; Deschamps, A.; Bastow, T.J. The coexistence of two S (Al2CuMg) phases in Al-Cu-Mg alloys. Acta Mater. 2012, 60, 6940–6951. [Google Scholar] [CrossRef]
- Khan, I.N.; Starink, M.J.; Yan, J.L. A model for precipitation kinetics and strengthening in Al-Cu-Mg alloys. Mater. Sci. Eng. A 2008, 472, 66–74. [Google Scholar] [CrossRef]
- Wu, L.; Wang, Q.; Shu, S.; Li, Y.; Li, X.; Wang, H. Interactions between cadmium and Al3Li precipitates: A new mechanism of accelerating dissolution and transformation of phases in Al-Li-Cu alloy. Mater. Sci. Eng. A 2021, 806, 140607. [Google Scholar] [CrossRef]
- Wei, B.; Pan, S.; Liao, G.; Ali, A.; Wang, S. Sc-containing hierarchical phase structures to improve the mechanical and corrosion resistant properties of Al-Mg-Si alloy. Mater. Des. 2022, 218, 110699. [Google Scholar] [CrossRef]
- Chen, X.; Ma, X.; Zhao, G.; Wang, Y.; Xu, X. Effects of re-solution and re-aging treatment on mechanical property, corrosion resistance and electrochemical behavior of 2196 Al-Cu-Li alloy. Mater. Des. 2021, 204, 109662. [Google Scholar] [CrossRef]
- Liu, D.; Ma, Y.; Li, J.; Zhang, R.; Iwaoka, H.; Hirosawa, S. Precipitate microstructures, mechanical properties and corrosion resistance of Al-1.0 wt%Cu-2.5 wt% Li alloys with different micro-alloyed elements addition. Mater. Charact. 2020, 167, 110528. [Google Scholar] [CrossRef]


| Alloys | Cu | Li | Sc | Mg | Ag | Zr | Mn | Al | Cu + Li | Cu/Li | Cu (at.%) | Li (at.%) |
|---|---|---|---|---|---|---|---|---|---|---|---|---|
| A1 | 3.90 | 1.28 | 0.11 | 0.37 | 0.30 | 0.12 | 0.22 | Bal. | 5.18 | 3.05 | 1.64 | 4.92 |
| A2 | 3.44 | 1.67 | 0.11 | 0.39 | 0.29 | 0.11 | 0.21 | Bal. | 5.11 | 2.06 | 1.43 | 6.42 |
| A3 | 3.03 | 2.11 | 0.11 | 0.38 | 0.29 | 0.11 | 0.21 | Bal. | 5.14 | 1.44 | 1.27 | 8.11 |
| Alloy | Condition | UTS (MPa) | YS (MPa) | EL (%) | ΔYS (MPa) |
|---|---|---|---|---|---|
| A1 | As-quenching | 354 ± 8 | 154 ± 4 | 20.0 ± 0 | 431 |
| Peak-aging | 630 ± 12 | 585 ± 11 | 9.5 ± 0 | ||
| A2 | As-quenching | 341 ± 10 | 149 ± 8 | 21.0 ± 0.25 | 429 |
| Peak-aging | 624 ± 8 | 578 ± 9 | 10.5 ± 0 | ||
| A3 | As-quenching | 343 ± 7.5 | 148 ± 5 | 20.5 ± 0.75 | 426 |
| Peak-aging | 618 ± 9 | 573 ± 12 | 7.5 ± 0 |
| Alloys | Ecorr (V) | Icorr (A/cm2) |
|---|---|---|
| A1 | −0.609 | 2.52 × 10⁻⁵ |
| A2 | −0.642 | 3.15 × 10⁻⁵ |
| A3 | −0.662 | 4.03 × 10⁻⁵ |
| Alloys | Average Diameter (nm) | Number Density (×1021 m−3) | Average Thickness (nm) | Volume Fraction (%) |
|---|---|---|---|---|
| A1 | 104.9 ± 5.1 | 1.73 ± 0.08 | 1.51 ± 0.15 | 2.25 |
| A2 | 107.1 ± 2.2 | 1.52 ± 0.10 | 1.58 ± 0.16 | 2.13 |
| A3 | 161.1 ± 8.5 | 0.67 ± 0.15 | 2.31 ± 0.19 | 3.17 |
| Alloys | θ′ (Al2Cu) | δ′ (Al3Li) | |||||
|---|---|---|---|---|---|---|---|
| Average Diameter (nm) | Number Density (×1020 m−3) | Average Thickness (nm) | Volume Fraction (%) | Average Diameter (nm) | Number Density (×1021 m−3) | Volume Fraction (%) | |
| A1 | 130.9 ± 10.6 | 1.89 ± 0.12 | 3.52 ± 0.15 | 0.89 | |||
| A2 | 127.9 ± 8.5 | 2.37 ± 0.14 | 3.57 ± 0.21 | 1.08 | 14.0 ± 0.9 | 0.52 ± 0.06 | 0.07 |
| A3 | 190.2 ± 13.2 | 0.24 ± 0.09 | 5.52 ± 0.31 | 0.50 | 16.1 ± 1.2 | 6.71 ± 0.18 | 1.46 |
| Point | Al | Cu | Mg | Ag |
|---|---|---|---|---|
| A | 65.60 | 34.27 | 0.08 | 0.05 |
| B | 72.83 | 19.34 | 6.62 | 1.21 |
| C | 78.08 | 17.93 | 3.23 | 0.76 |
| D | 69.09 | 24.04 | 5.78 | 1.09 |
| E | 85.28 | 11.32 | 3.09 | 0.09 |
| F | 86.99 | 9.90 | 0.78 | 0.29 |
| Alloys | LAGBs (%) | HAGBs (%) | Recrystallisation Ratio (%) | Average Taylor Factor |
|---|---|---|---|---|
| A1 | 71.8 | 28.2 | 7.2 | 3.31 |
| A2 | 72.3 | 27.7 | 6.9 | 3.35 |
| A3 | 55.5 | 44.5 | 15.3 | 3.15 |
Disclaimer/Publisher’s Note: The statements, opinions and data contained in all publications are solely those of the individual author(s) and contributor(s) and not of MDPI and/or the editor(s). MDPI and/or the editor(s) disclaim responsibility for any injury to people or property resulting from any ideas, methods, instructions or products referred to in the content. |
© 2025 by the authors. Licensee MDPI, Basel, Switzerland. This article is an open access article distributed under the terms and conditions of the Creative Commons Attribution (CC BY) license (https://creativecommons.org/licenses/by/4.0/).
Share and Cite
Li, C.; Li, X.; Zhang, Y.; Wen, K.; Yan, L.; Li, Y.; Li, Y.; Yu, M.; Gao, G.; Yan, H.; et al. Effect of Cu/Li Ratio on Mechanical Properties and Corrosion Behavior of Sc-Containing Al-Cu-Li Alloys. Materials 2025, 18, 2254. https://doi.org/10.3390/ma18102254
Li C, Li X, Zhang Y, Wen K, Yan L, Li Y, Li Y, Yu M, Gao G, Yan H, et al. Effect of Cu/Li Ratio on Mechanical Properties and Corrosion Behavior of Sc-Containing Al-Cu-Li Alloys. Materials. 2025; 18(10):2254. https://doi.org/10.3390/ma18102254
Chicago/Turabian StyleLi, Changlin, Xiwu Li, Yongan Zhang, Kai Wen, Lizhen Yan, Ying Li, Yanan Li, Mingyang Yu, Guanjun Gao, Hongwei Yan, and et al. 2025. "Effect of Cu/Li Ratio on Mechanical Properties and Corrosion Behavior of Sc-Containing Al-Cu-Li Alloys" Materials 18, no. 10: 2254. https://doi.org/10.3390/ma18102254
APA StyleLi, C., Li, X., Zhang, Y., Wen, K., Yan, L., Li, Y., Li, Y., Yu, M., Gao, G., Yan, H., Li, Z., & Xiong, B. (2025). Effect of Cu/Li Ratio on Mechanical Properties and Corrosion Behavior of Sc-Containing Al-Cu-Li Alloys. Materials, 18(10), 2254. https://doi.org/10.3390/ma18102254