1. Introduction
Human activities have significantly increased the amount of greenhouse gases in the atmosphere [
1]. Cement is an important component of building materials, and its production process is one of the main sources of greenhouse gases. The cement industry releases 5–8% of global anthropogenic carbon dioxide emissions [
2,
3,
4,
5,
6,
7,
8]. To reduce carbon emissions from the cement industry, researchers have used supplementary cementitious materials (SCMs) with volcanic ash properties to replace cement and reduce cement content, thereby reducing carbon dioxide emissions and energy consumption [
9].
Calcium carbide slag (CS) is an industrial by-product of acetylene production. Acetylene (C
2H
2) is usually produced by the reaction of calcium carbide with water. This process produces a large amount of CS [
10,
11,
12]. The reaction process is as follows:
The main component of solid waste carbide slag is calcium hydroxide (CH). If it is not handled properly, it can easily lead to problems such as soil salinization and groundwater pollution [
13]. Its application in cement and concrete is mainly due to its chemical composition, calcium hydroxide (CH): CS can act as an alkali activator in the cement hydration process, reacting with other cementitious materials to generate additional C-S-H and other hydrated compounds. These additional C-S-H fill the pores in the mixture by promoting pore refinement and thickening of the cementitious matrix, thereby improving the density and durability of the material.
China’s coal production accounts for about 50% of the world’s coal production [
14]. As one of the main solid wastes in the coal mining process, coal gangue (CG) accounts for 10% to 20% of coal production [
15,
16]. From 2010 to 2020, China has produced a total of about 6 billion tons of CG [
17]. The accumulation of CG not only occupies a large amount of land resources, but also the heavy metal elements it contains may seep into groundwater, posing a potential threat to the ecosystem and human health [
18]. The total amount of CG in China is still increasing year by year. In China, the utilization rate of CG (about 60%) is much lower than that of developed countries (greater than 90%). The annual output exceeds the utilization, indicating that the utilization rate of CG still needs to be improved [
19]. The annual output of CG is much higher than the utilization, indicating that the utilization rate of CG still needs to be improved [
19]. CG itself is difficult to react with substances in cement, but the calcined coal gangue (CCG) obtained after fine grinding and heat treatment is active. During the calcination heat treatment process, kaolin removes hydroxyl groups to form metakaolin, thereby increasing the reaction activity [
20,
21]. Most previous studies have focused on replacing aggregates in concrete with CG [
22,
23,
24]. At present, some researchers have found the potential of CG or CCG to replace cement [
25,
26,
27]. However, research on the interaction between CCG and other SCMs in cementitious systems still needs to be supplemented.
Because of previous studies’ shortcomings, this paper’s innovation is summarized as follows: First, previous studies have mostly focused on using CG as a substitute for aggregate, and the research on CG replacing cement after activation treatment needs to be further supplemented. Second, existing studies are mostly based on macroscopic physical properties, and the research on the microscopic properties of CCG and its influence on the performance of cement-based materials still needs to be strengthened. Finally, this study explores the effect of mixing CS and CCG and analyzes the possible interactions and effects of this mixed cementitious material.
The variables considered in this study are the dosage of CS and CCG. Experimental studies on mortar specimens and neat paste samples include compressive strength, ultrasonic pulse velocity (UPV), electrical resistivity (ER), X-ray diffraction (XRD), thermogravimetric analysis, and scanning electron microscopy (SEM). Based on these experimental results, the macroscopic properties and microstructure of the samples and the correlation between the experimental results are analyzed.
3. Results
3.1. Workability
As shown in
Figure 5, the fluidity of the paste decreases from 258 mm to 214 mm as the CS replacement ratio increases, exhibiting a downward trend. This is attributed to the high specific surface area of CS, which adsorbs free water and reduces the effective water–binder ratio, thereby decreasing fluidity. After partial replacement of cement with CCG, the fluidity of cement mortar is significantly reduced. This can be ascribed to the fact that CCG still contains trace amounts of coal and organic materials, which can absorb 30–65% of water by their own weight, leading to a lower actual water–binder ratio and reduced fluidity [
32]. Additionally, after calcination, kaolinite is transformed into metakaolinite, resulting in a more porous structure and higher water absorption, which further reduces the fluidity of the mortar [
33].
Figure 5 shows that using CCG reduces the mortar’s fluidity a bit more. Hence, to match OPC’s performance, groups with CCG need more water-reducing admixture.
3.2. Compressive Strength
Figure 6 shows the compressive strength test results of the mortar specimens at 1 day, 3 days, 7 days, and 28 days. The experimental results show that compressive strength increases with the extension of the curing time. This is because the hydration reaction continues, the number of hydration products increases, and the cement becomes denser.
By comparing the compressive strength results of each group, it can be found that the compressive strength of the mortar specimens does not decrease significantly with the increase in CCG substitution. The main reason for this phenomenon is that CCG’s amorphous phase metakaolinite (AS
2) has a high reactivity [
34]. AS
2 can react with CH produced by cement hydration in the early hydration stage. The reaction equations are Equations (2) and (3) [
34].
where
is portlandite,
is amorphous phase metakaolinite, and
is water. The reaction produces additional hydration products, such as C-S-H and C-S-A-H, which can promote strength development.
In addition, it can be observed that the use of CS to replace cement will reduce the compressive strength of the CS experimental group. At 1, 3, 7, and 28 days, they decreased by 50.59%, 17.5%, 25.7%, and 21.5%. This is mainly because the main substance in CS is CH. When cement is partially replaced, the number of hydration products decreases, resulting in a decrease in strength. This can be attributed to the dilution effect of CCS, which leads to a reduction in strength [
35]. The compressive strength of the 10-CS-10-CCG group reached a level comparable to that of the control group. This is mainly because the CH in CS can react with AS
2 in CCG to produce (2) and (3). The C-S-H and C-S-A-H produced by the reaction can fill the capillary tubes in concrete [
36,
37]. Therefore, mixing CS and CCG can effectively promote the development of strength.
3.3. UPV
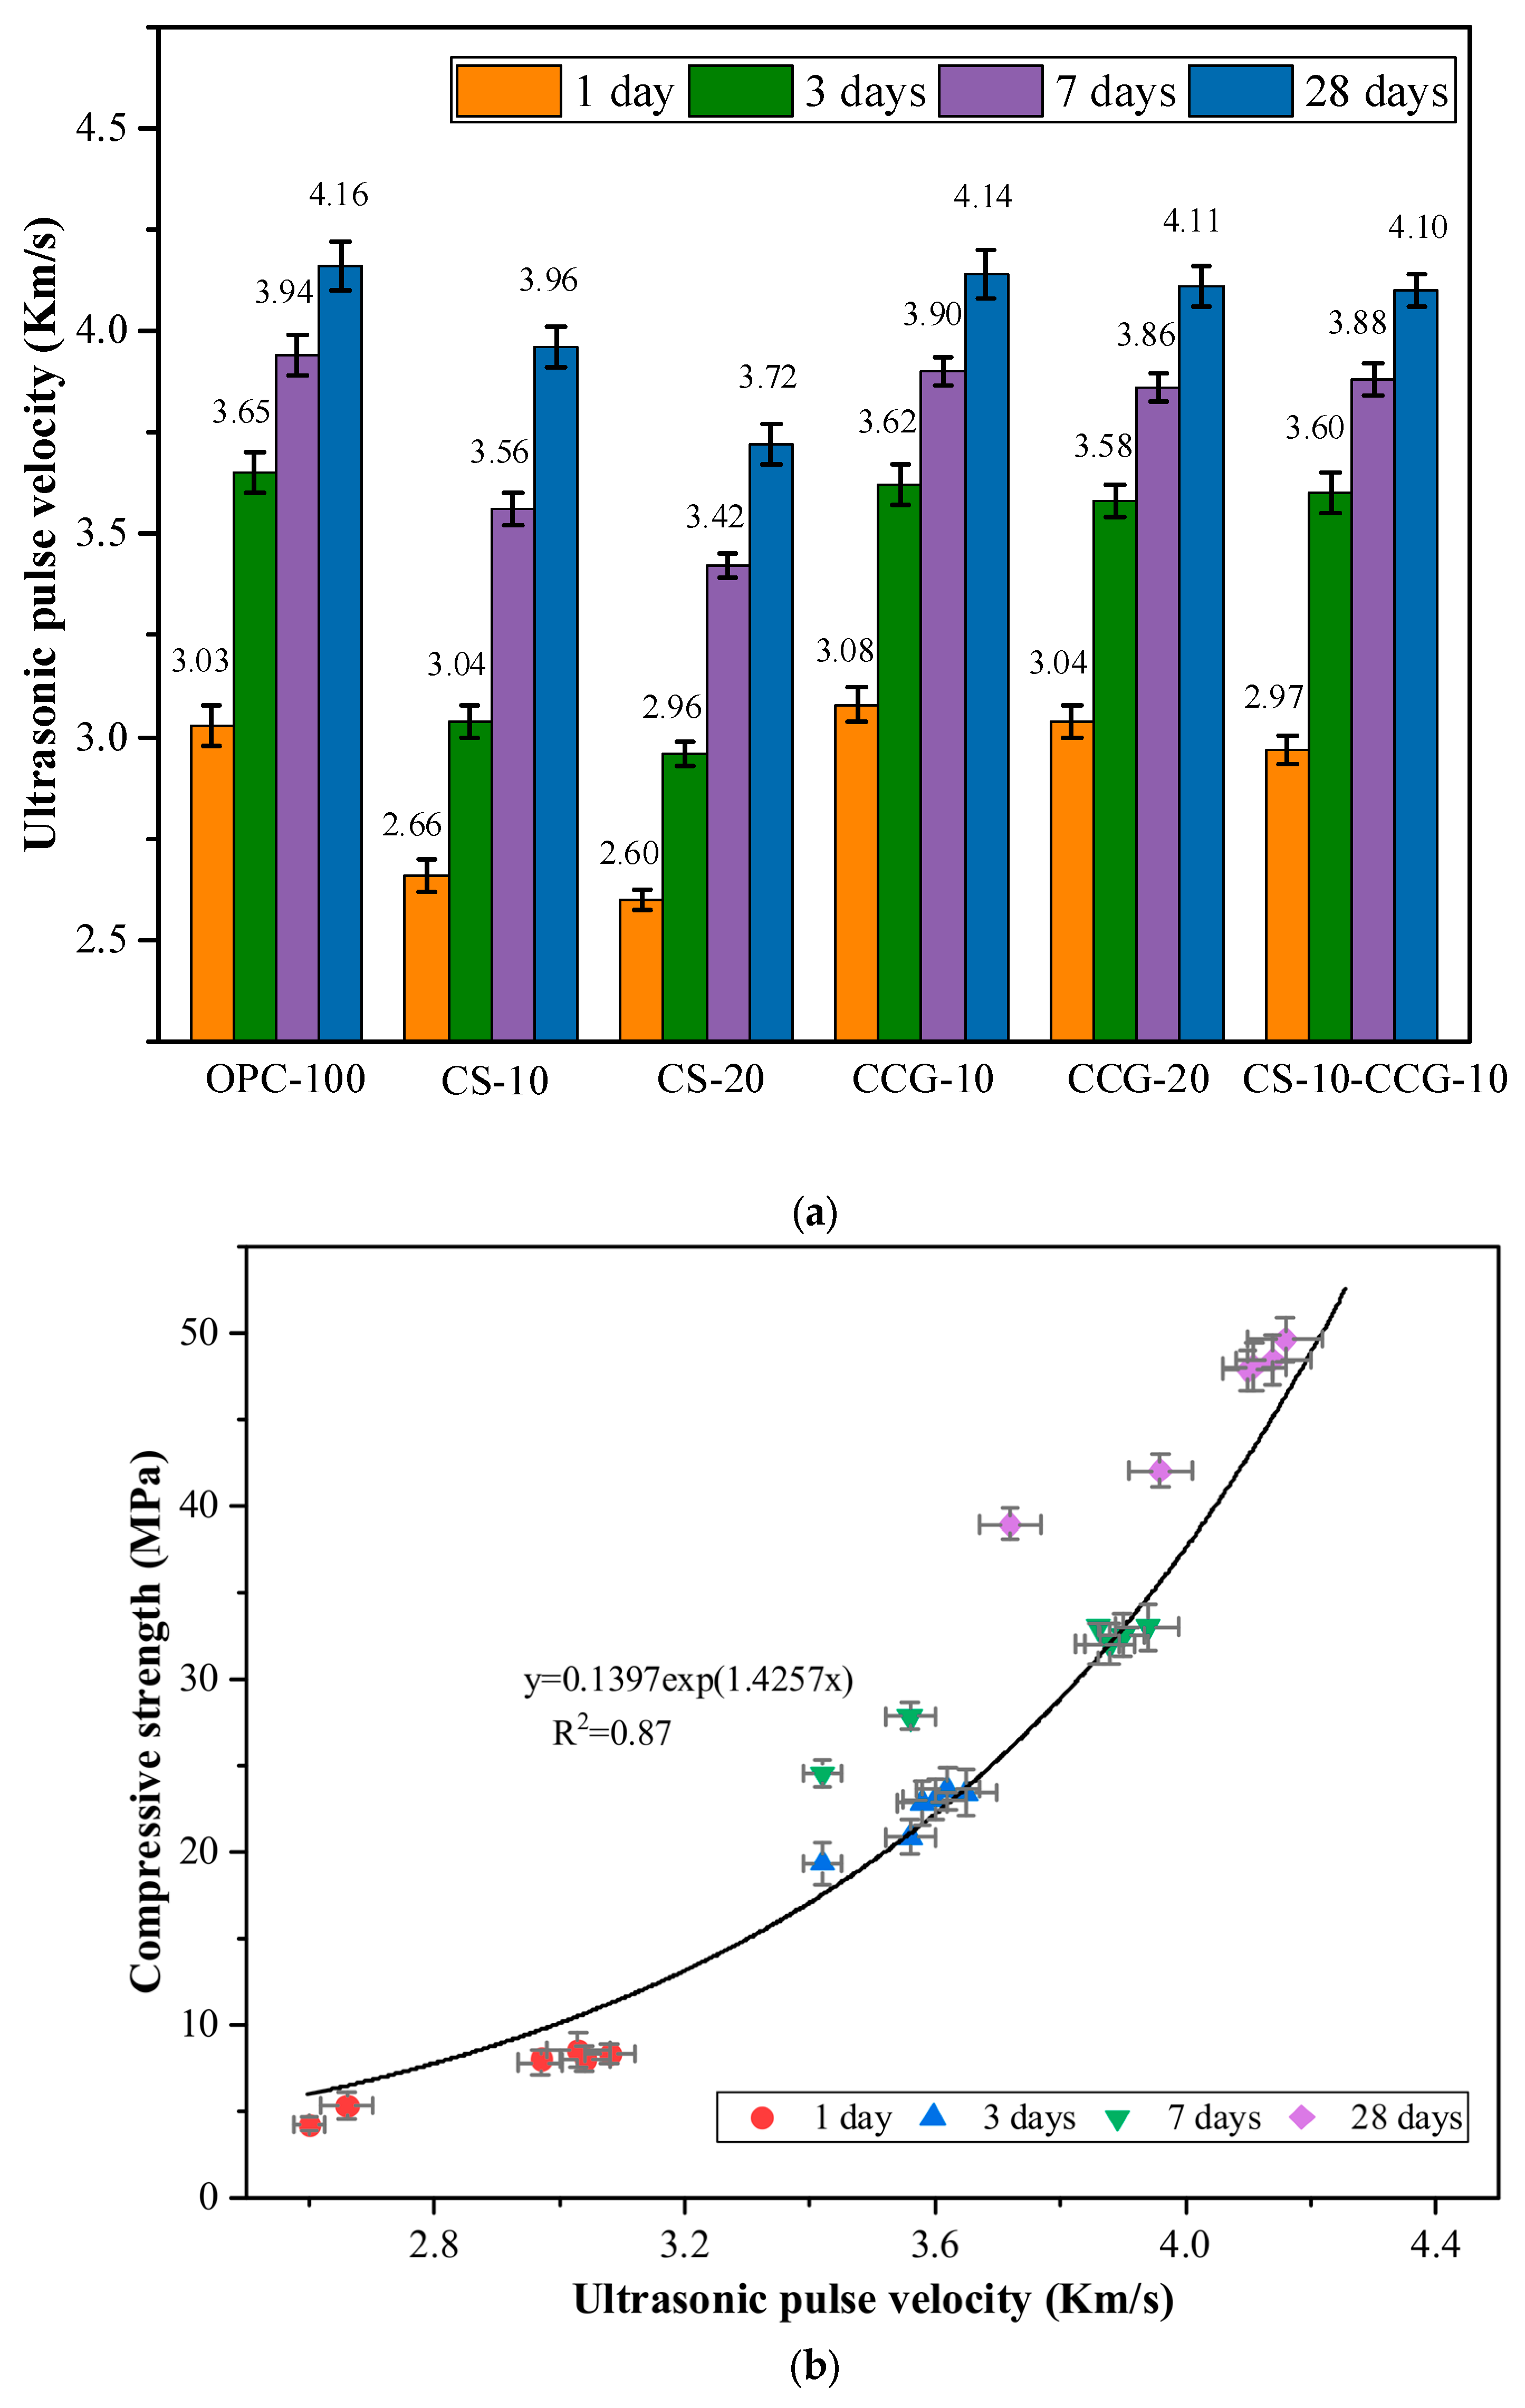
Figure 7a shows the UPV test results of each group of mortar specimens. The UPV test results of OPC-100 (control group) at 1, 3, 7, and 28 days were 3.03, 3.65, 3.94, and 4.16 km/s, respectively. The main reason for the rapid increase in UPV at 1 day was the rapid hydration reaction of C
3S and C
2S in cement to form CH and C-S-H [
38]. However, after 3 days of curing, the cement hydration reaction and the increase in UPV test results slowed down significantly [
35].
By comparing the UPV data of each group, it can be seen that the UPV values of the groups added with CCG have not decreased significantly compared with the control group. This is because, in the early stage of hydration, the high reactivity of CCG can react with CH produced by the hydration of cement clinkers. The hydration products generated by the reaction can fill the internal pores and promote the growth of UPV. In addition, the literature pointed out that the crystallinity of CG will be significantly reduced after calcination [
29]. The crystallinity is related to the arrangement of molecular chains. The higher the crystallinity, the more orderly the molecular arrangement, which may make the reaction more difficult. The crystallinity of CG after calcination is reduced so that CG can obtain higher reactivity.
The test results of CS-10 and CS-20 mortar specimens were smaller than those of the control group. For example, the value of the CS-20 group was 14.20% lower than that of the control group at 1 day. It was 10.58% lower than that of the control group at 28 days. This is because CS contains a large amount of CH, and as the curing age increases, its reactants are limited, and more hydration products cannot be generated. When CS and CCG are mixed, the CH in CS can react with the silicon aluminum oxide in CCG, promoting the growth of UPV value.
Factors that affect the UPV value, such as the amount of hydration products and pore size, also have a crucial impact on the compressive strength [
39]. UPV can be used to evaluate and predict the compressive strength of concrete in practical engineering. Previous studies have revealed a strong correlation between UPV and compressive strength, and there is an exponential correlation between the two [
39,
40]. The correlation analysis between UPV and compressive strength of the mixed mortar in this study is shown in
Figure 7b, with R
2 = 0.87.
3.4. Electrical Resistivity
The ER is an important factor in evaluating the durability of cement-based mixtures. The larger the ER of the mortar, the lower the corrosion rate of the steel bars inside it.
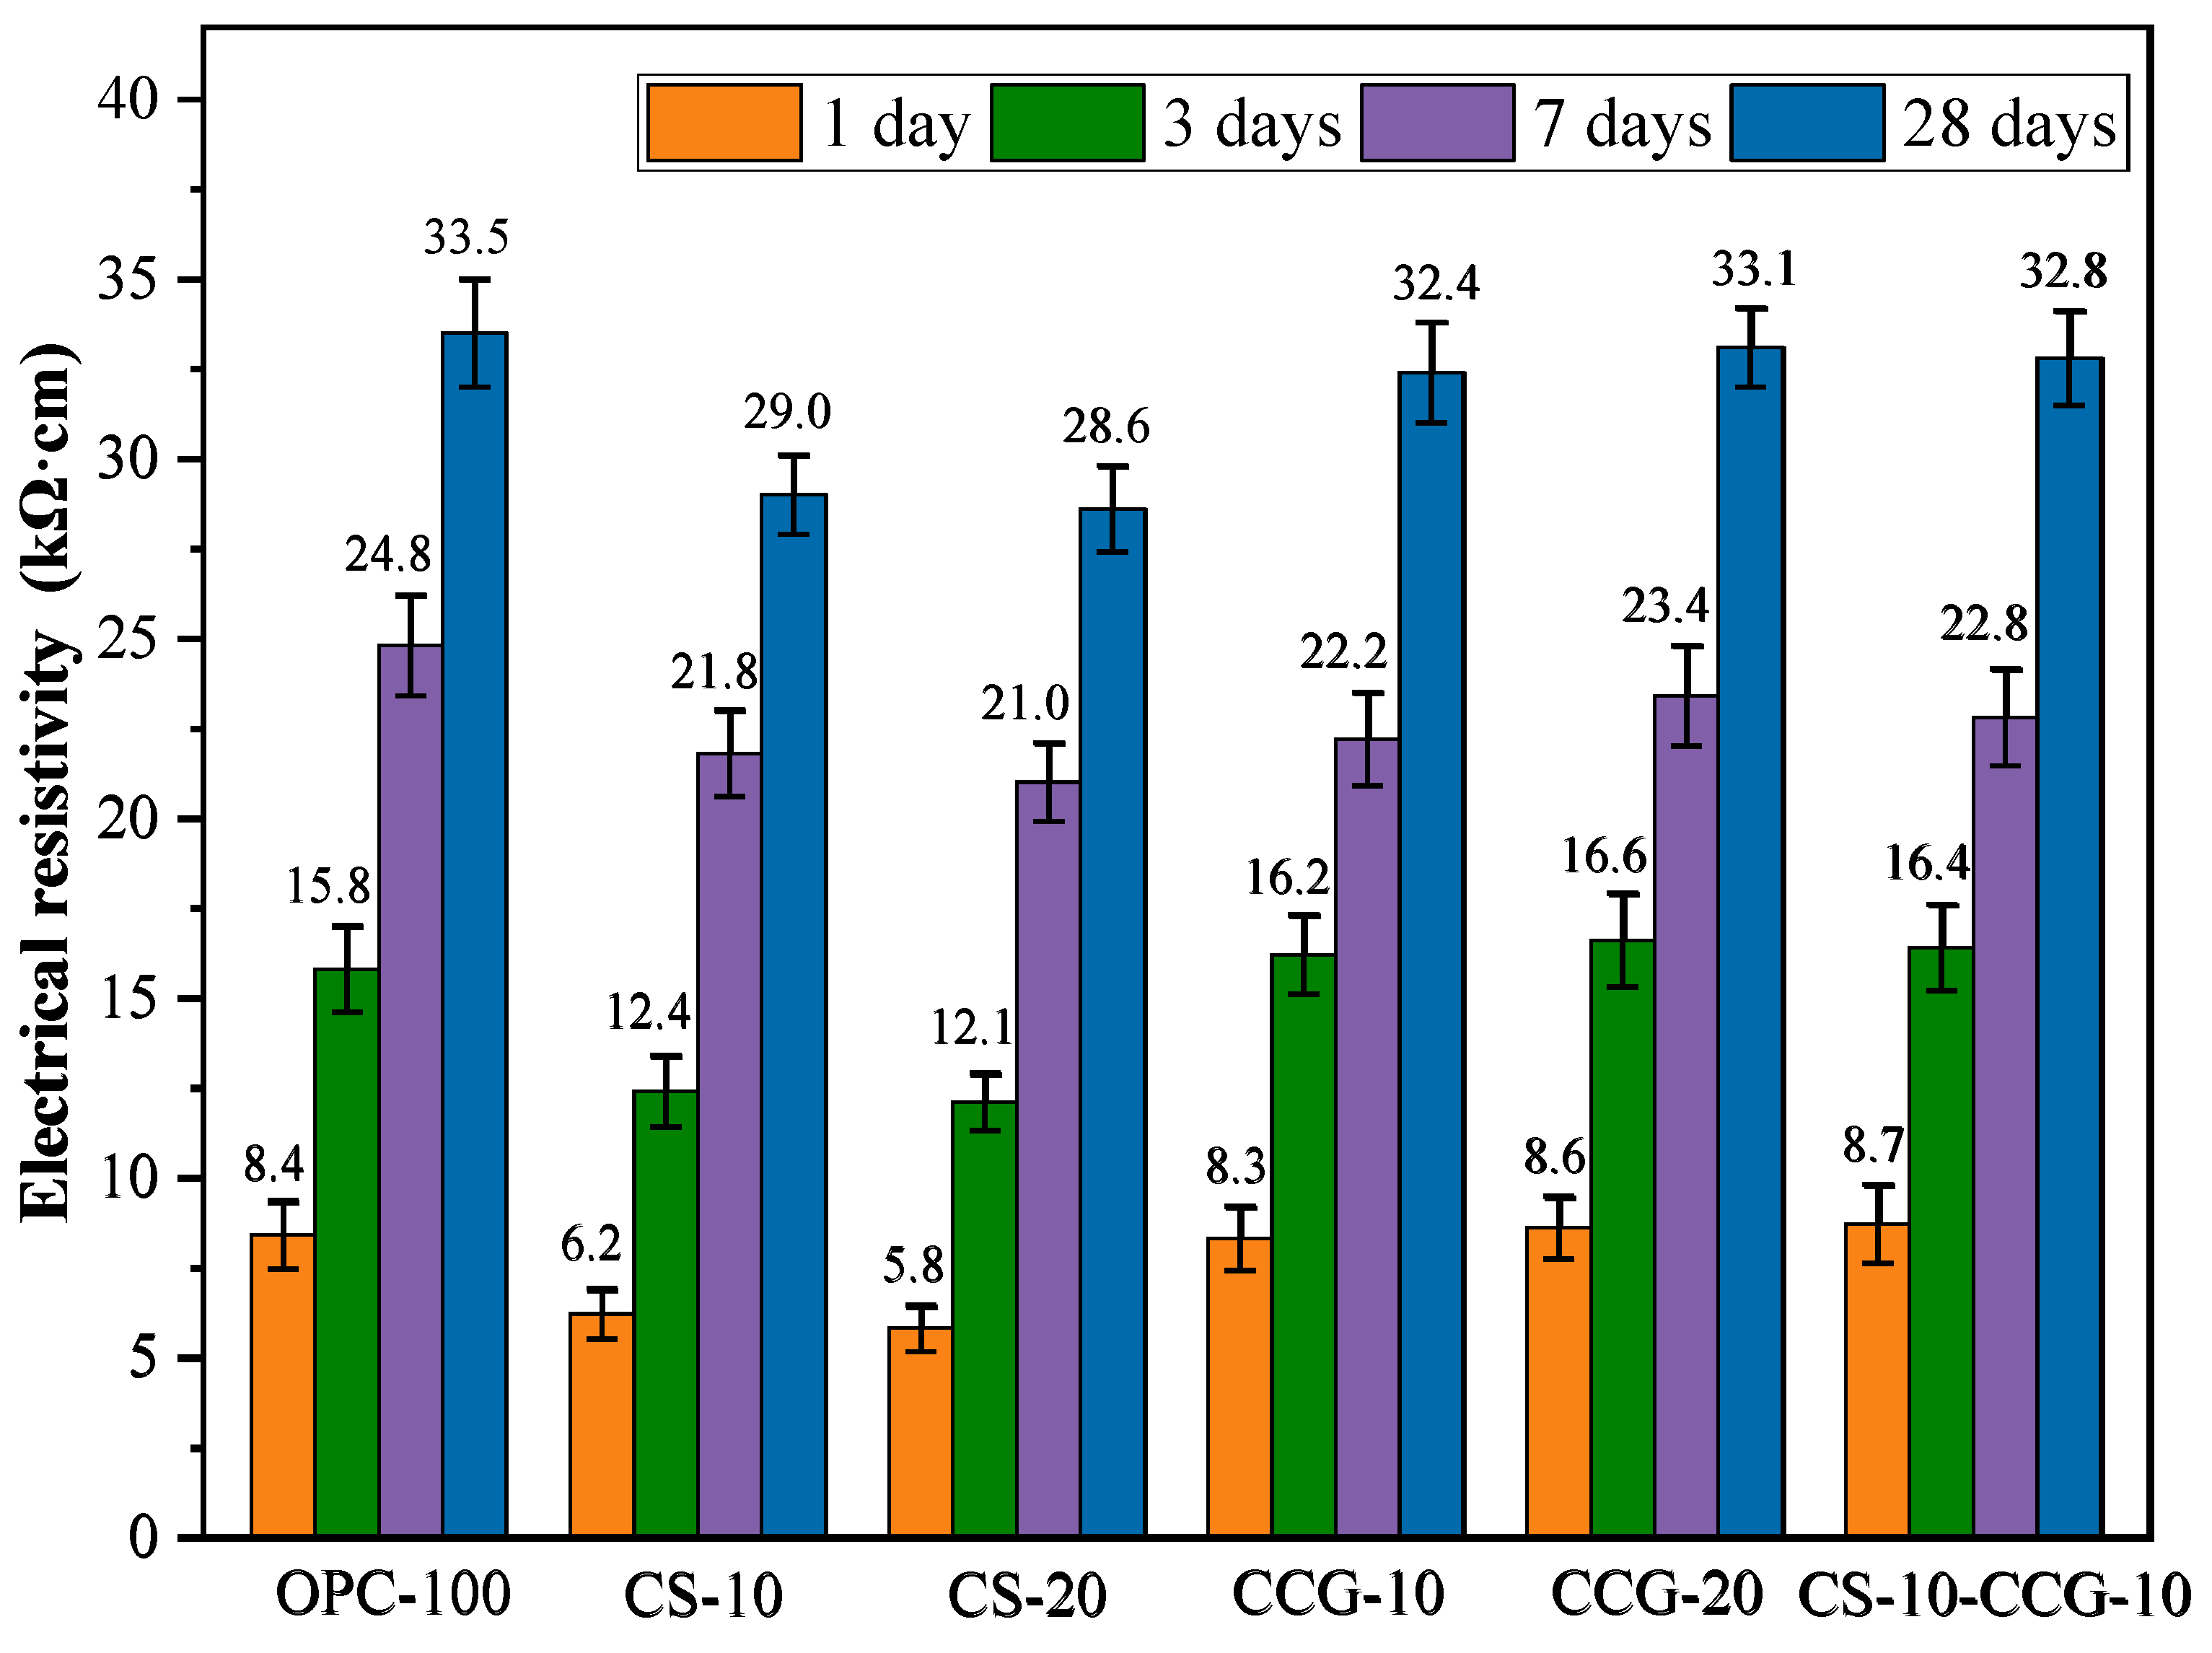
Figure 8 shows the ER of the mortar specimens at various ratios at 1, 3, 7, and 28 days. The ER value increases with age. This is because as the hydration reaction proceeds, the pores in the mortar are filled, and the interior becomes denser.
At all test time points, the ER values of the mortar containing CCG were comparable to those of the control group. This indicates that the use of CCG to partially replace cement will not cause a significant decrease in the ER value. This indicates that the density and durability of the cement system are enhanced in the presence of CCG, mainly because CCG can participate in the reaction to produce C-S-H and C-A-S-H. The ER values of the CS-20 group at 1, 3, 7, and 28 days were significantly lower than those of the control group. For example, the ER values of the CS-20 group at 1, 3, 7, and 28 days decreased by 30.95%, 23.41%, 15.30%, and 14.63%, respectively, compared with the control group. The volcanic ash effect of CS and CCG is manifested in that SiO2 and Al2O3 react with CS and cement CH in the cementitious system to generate cementitious materials such as C-S-H and C-S-A-H, which improves the density and volume stability of the matrix and makes the penetration of chloride ions more difficult.
Numerous studies have investigated the relationship between the ER value of concrete and its resistance to chloride ion corrosion [
41]. The findings indicate a correlation between the ER value and the concrete’s ability to resist chloride ion penetration, suggesting that the ER test can effectively evaluate this resistance. It has been noted that if the ER value exceeds 20,000 Ωcm, the likelihood of corrosion is considered low [
42]. Based on the test results presented in
Figure 8, we can conclude that all test groups show a low probability of corrosion after 7 days of curing.
3.5. X-Ray Diffraction Analysis
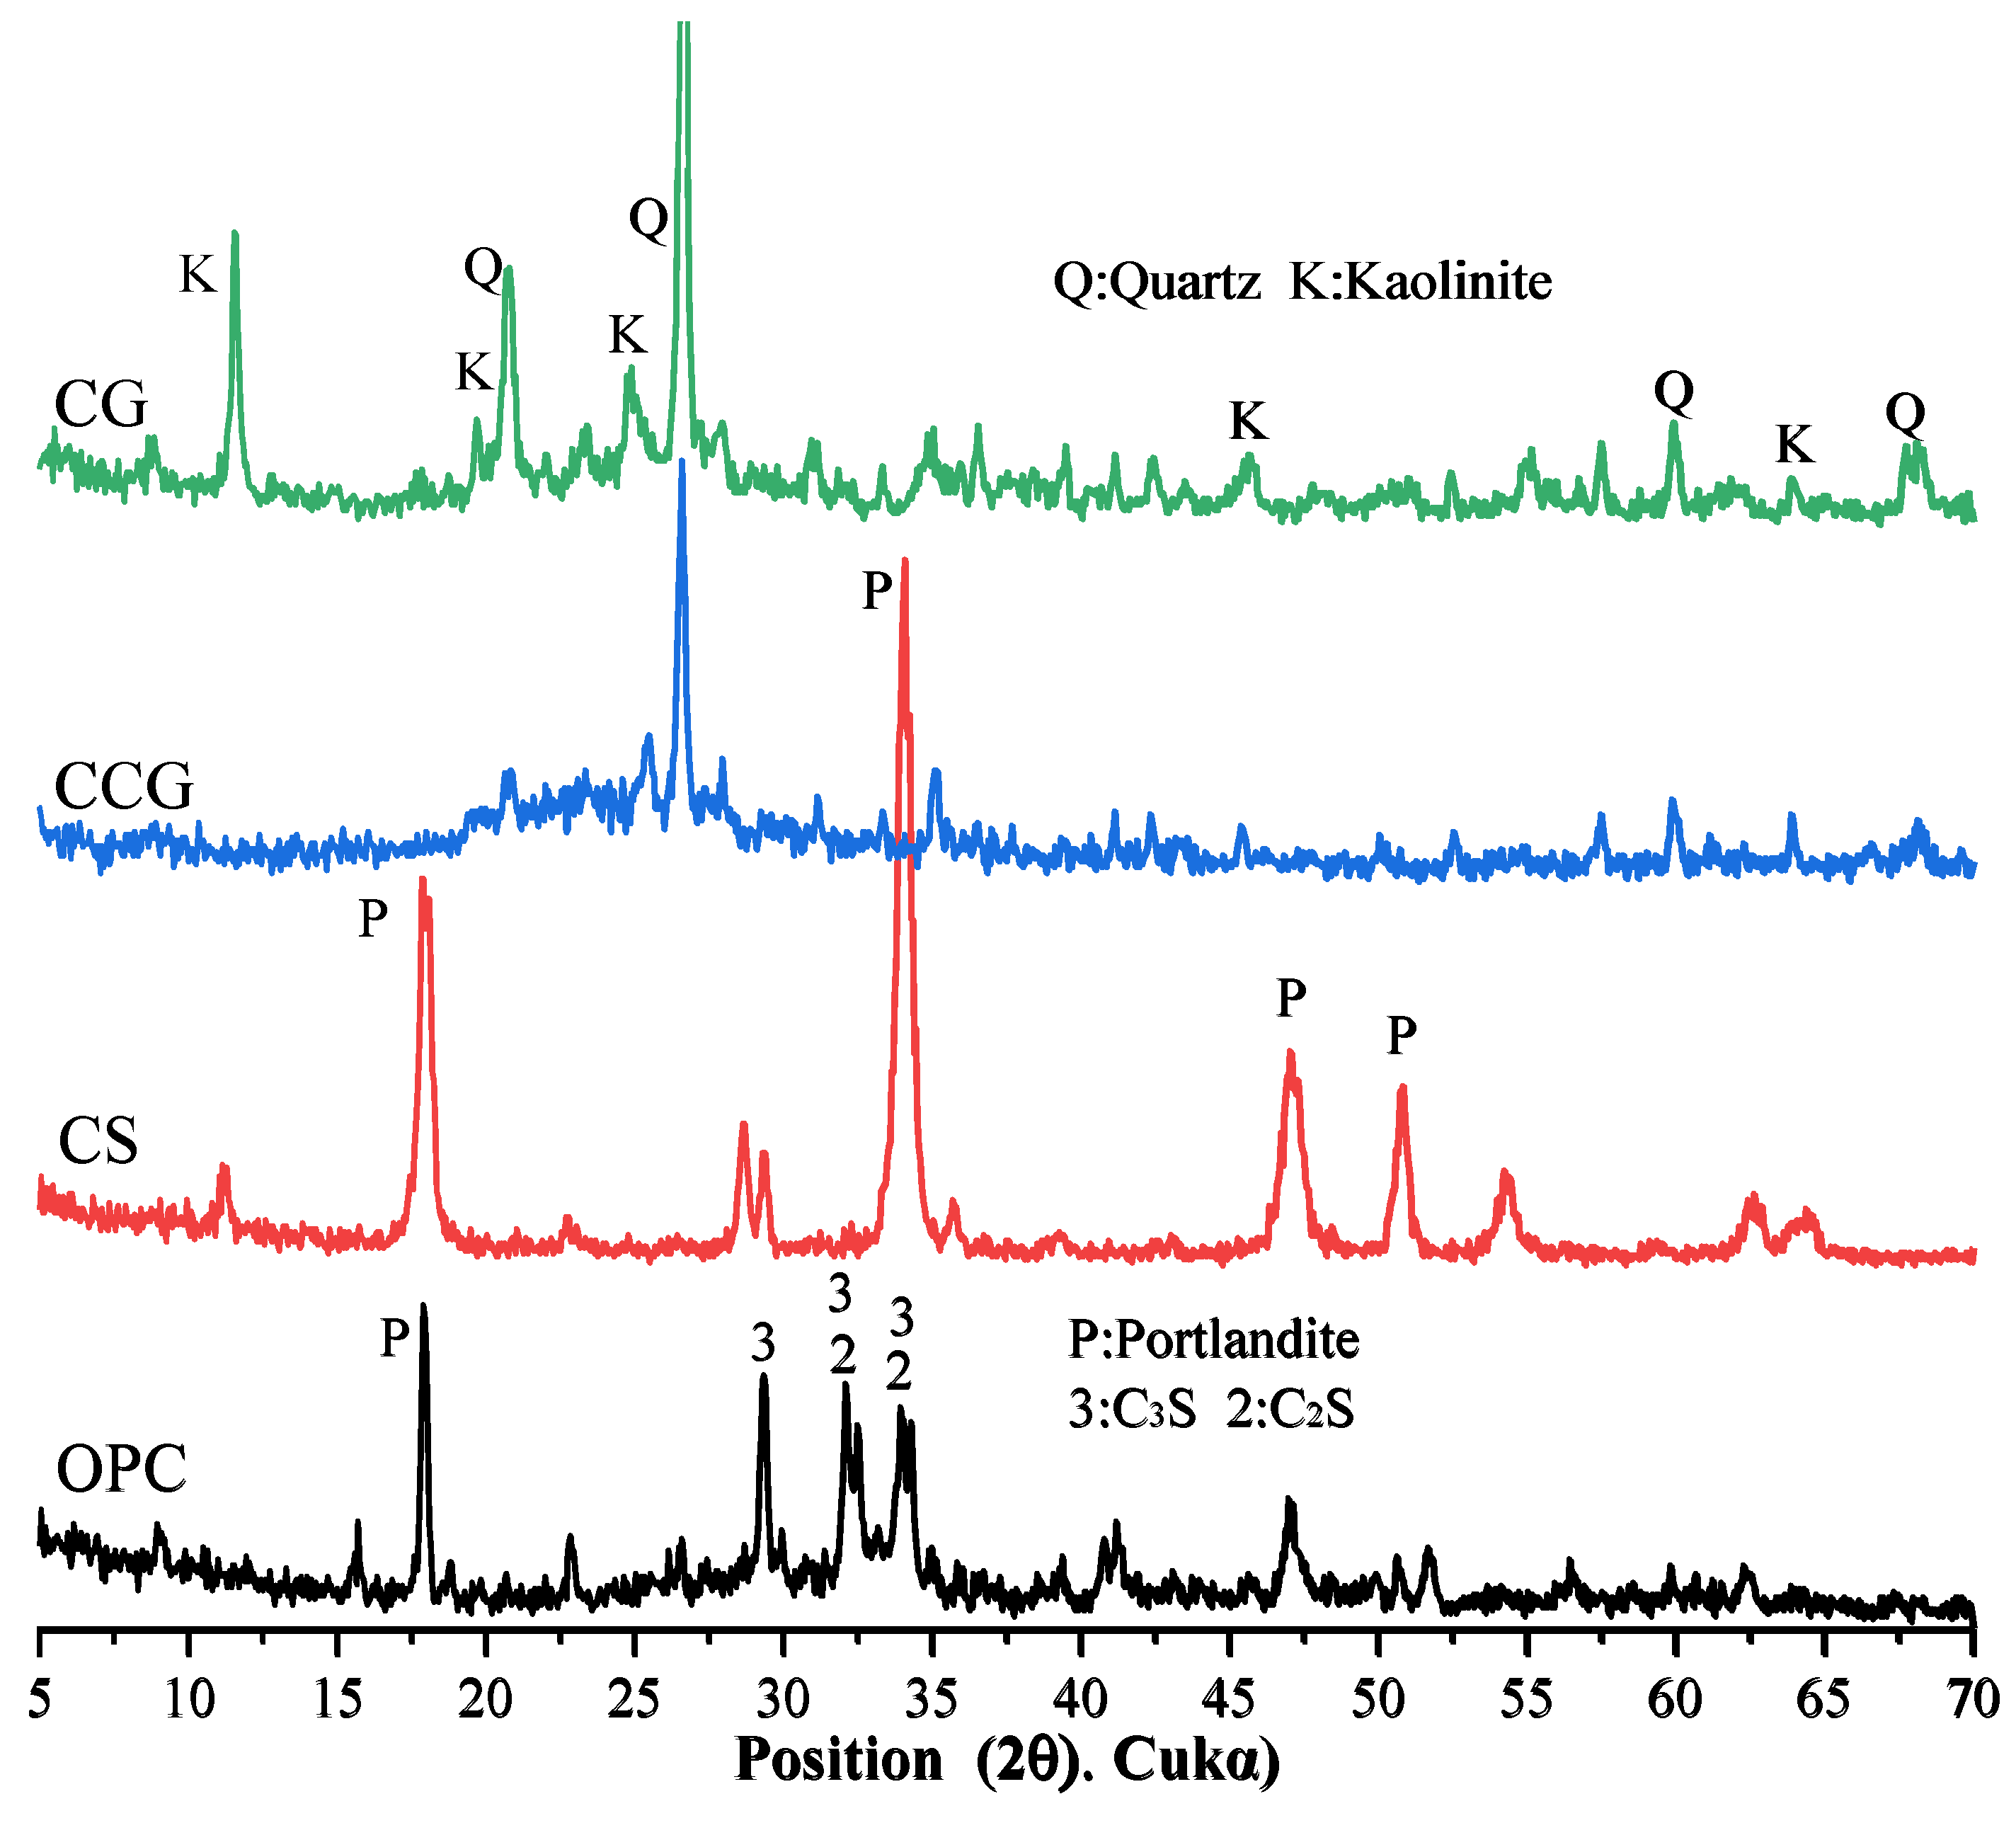
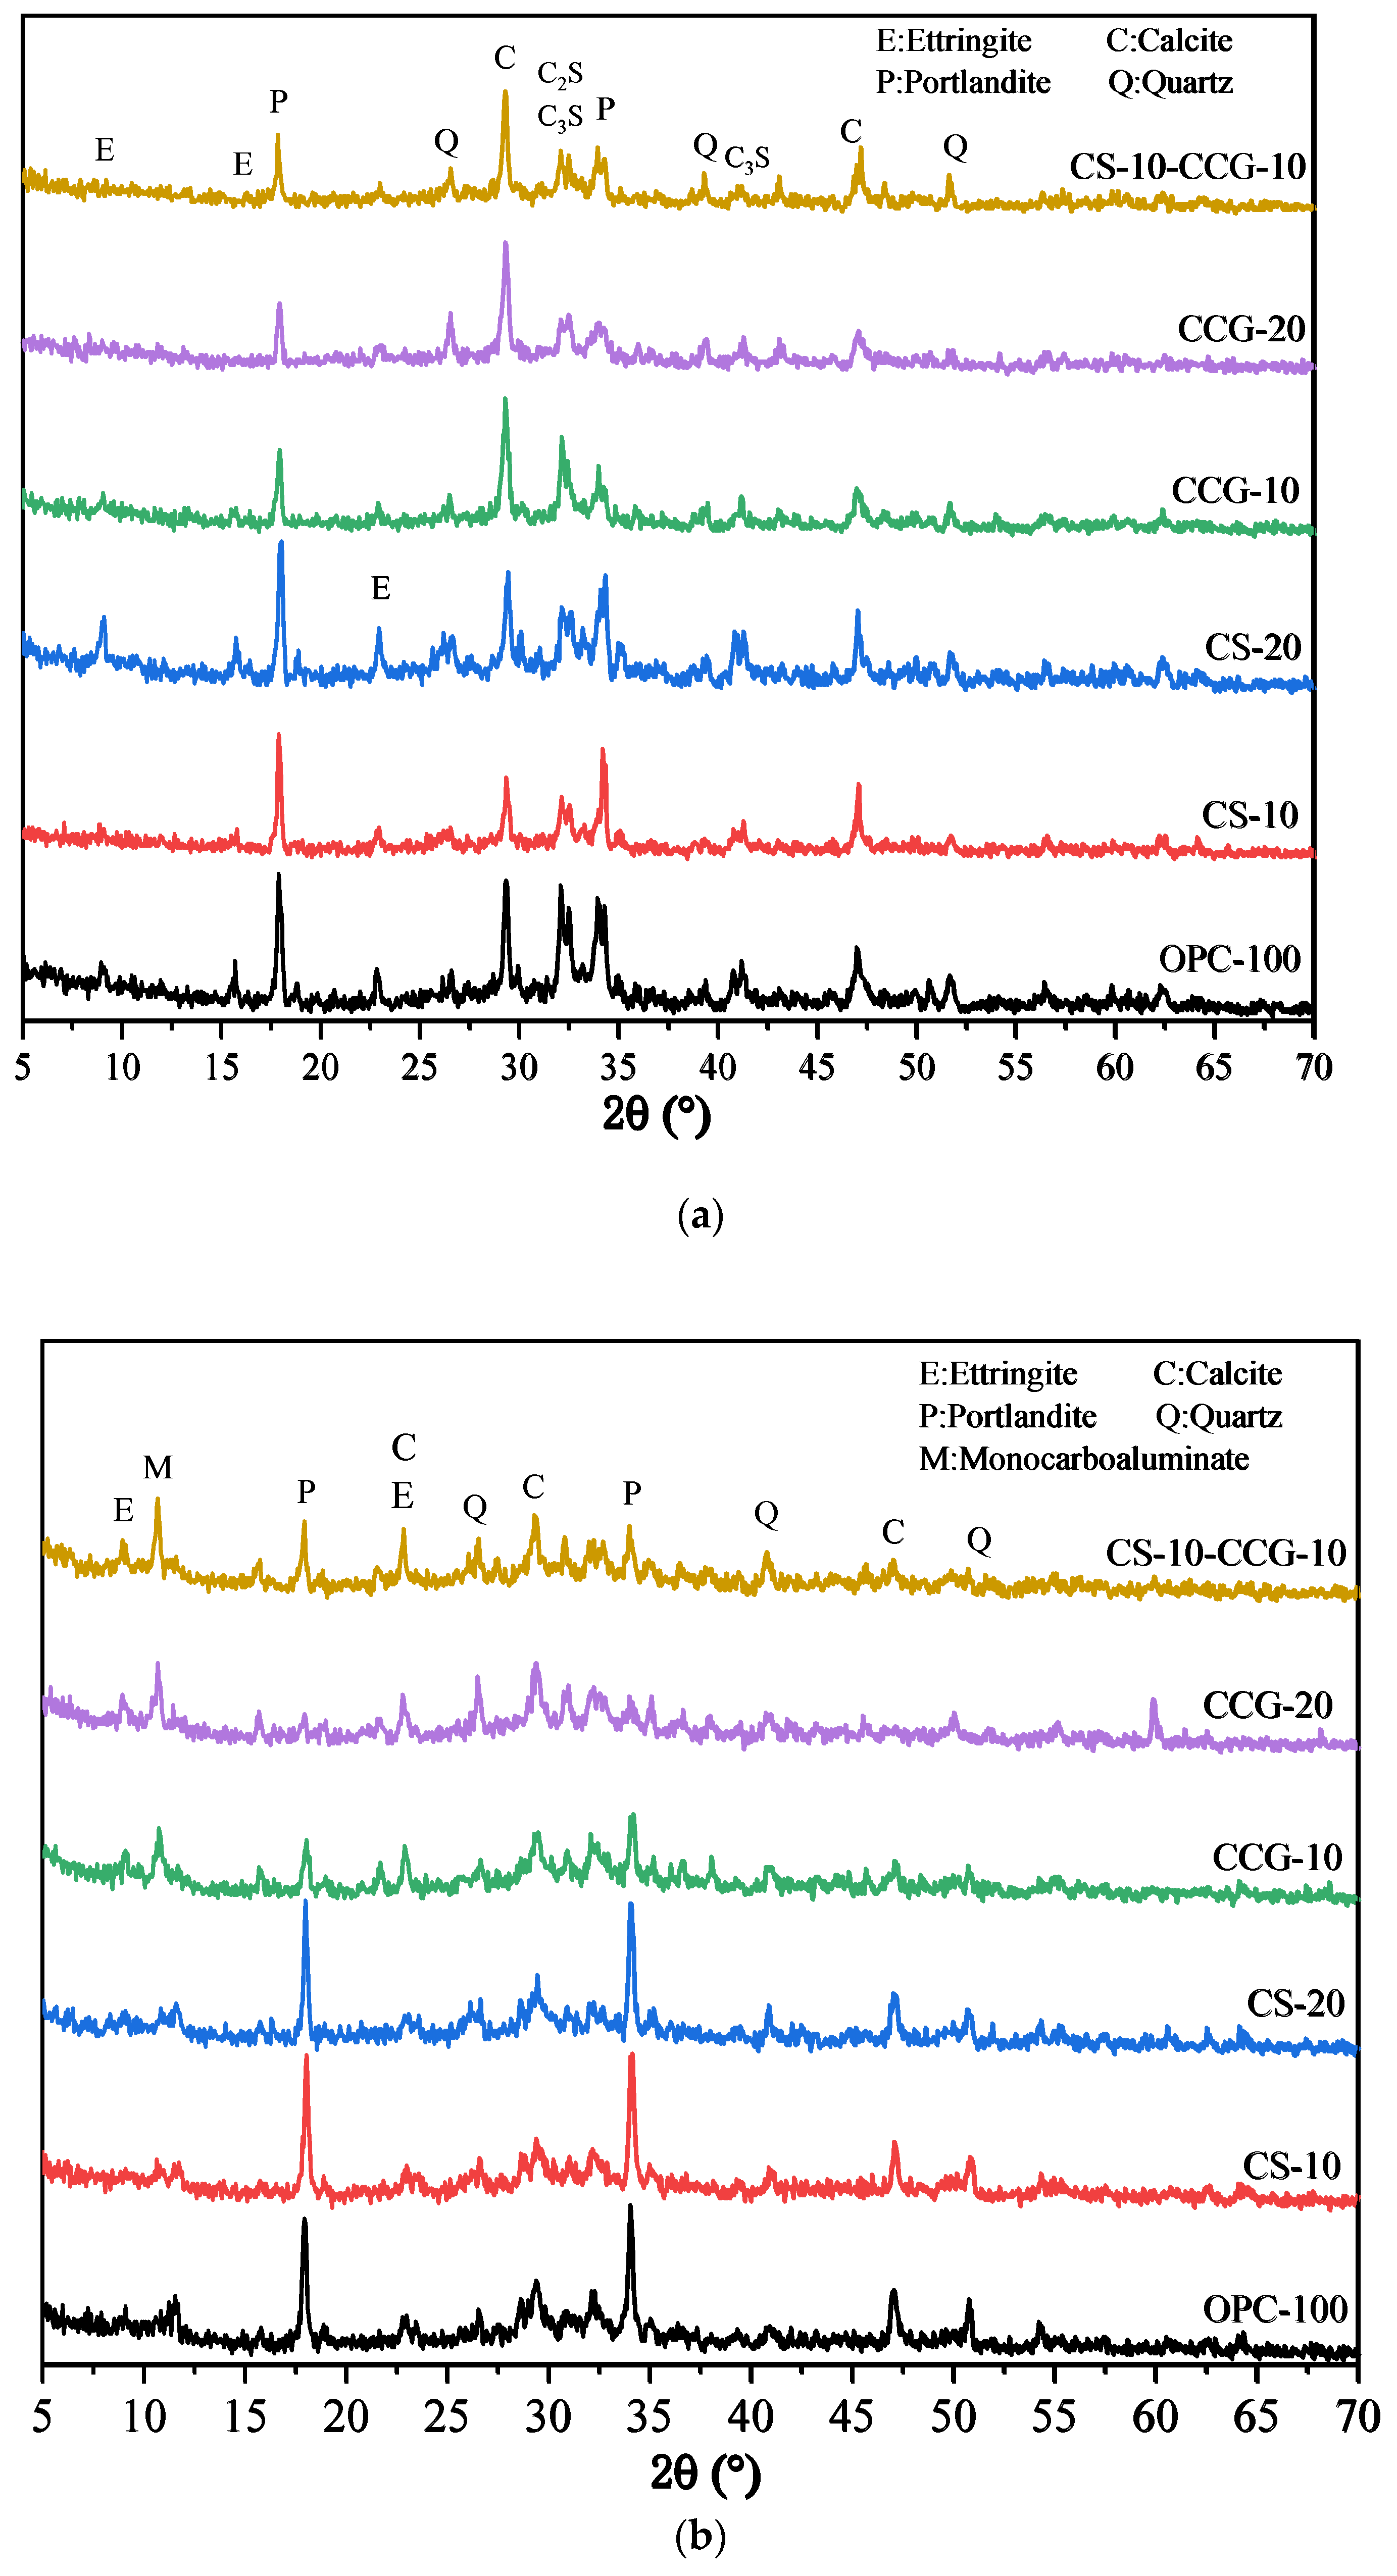
Figure 9a,b show the XRD test results of all samples at 1 day and 28 days. The relevant characteristic peaks are summarized in
Table 3. It can be observed from the figure that after the addition of the two cementitious materials, the main types of products of the hydration reaction did not change significantly. In addition, the peak of calcium carbonate (2θ = 46.5°) was detected in the cement system because the cement used contained limestone [
43]. It can be observed in
Figure 9a that the peaks of C
3S and C
2S are higher than those in
Figure 9b, which is due to the fact that the C
3S and C
2S in the early hydration reaction are not yet fully formed. When the reaction proceeds to 28 days, the peaks of C
3S and C
2S drop significantly because, after 28 days of hydration, the C
3S and C
2S in the system react to generate other hydration products.
By comparing
Figure 9a and
Figure 9b, it can be found that the P peak of the group with CS addition is very obvious, which is mainly because the CH in CS is not fully reacted and is detected. In addition, it can be found that the M peak at 11.7° of the component doped with CCG from the 1st day to the 28th day of the reaction is more obvious than that of other groups, while the peak of calcium carbonate decreases more significantly. This is because the calcium carbonate in the mixture reacts with aluminate to generate M. The reaction equation for the generation of M is shown in Equation (4) [
35].
where
is portlandite,
is calcium carbonate,
is water, and
is the aluminum phase in cement.
By analyzing this equation and the principle of chemical reaction, this is because CCG contains more Al elements, which can provide aluminum sources for the reaction, thereby promoting the generation of M. It can also be found from
Figure 9b that the CH peak intensity at 18° in the CCG-doped group is significantly reduced, which indicates that CCG is a raw material with high chemical activity and is easy to react with CH generated by cement hydration.
3.6. Thermogravimetry
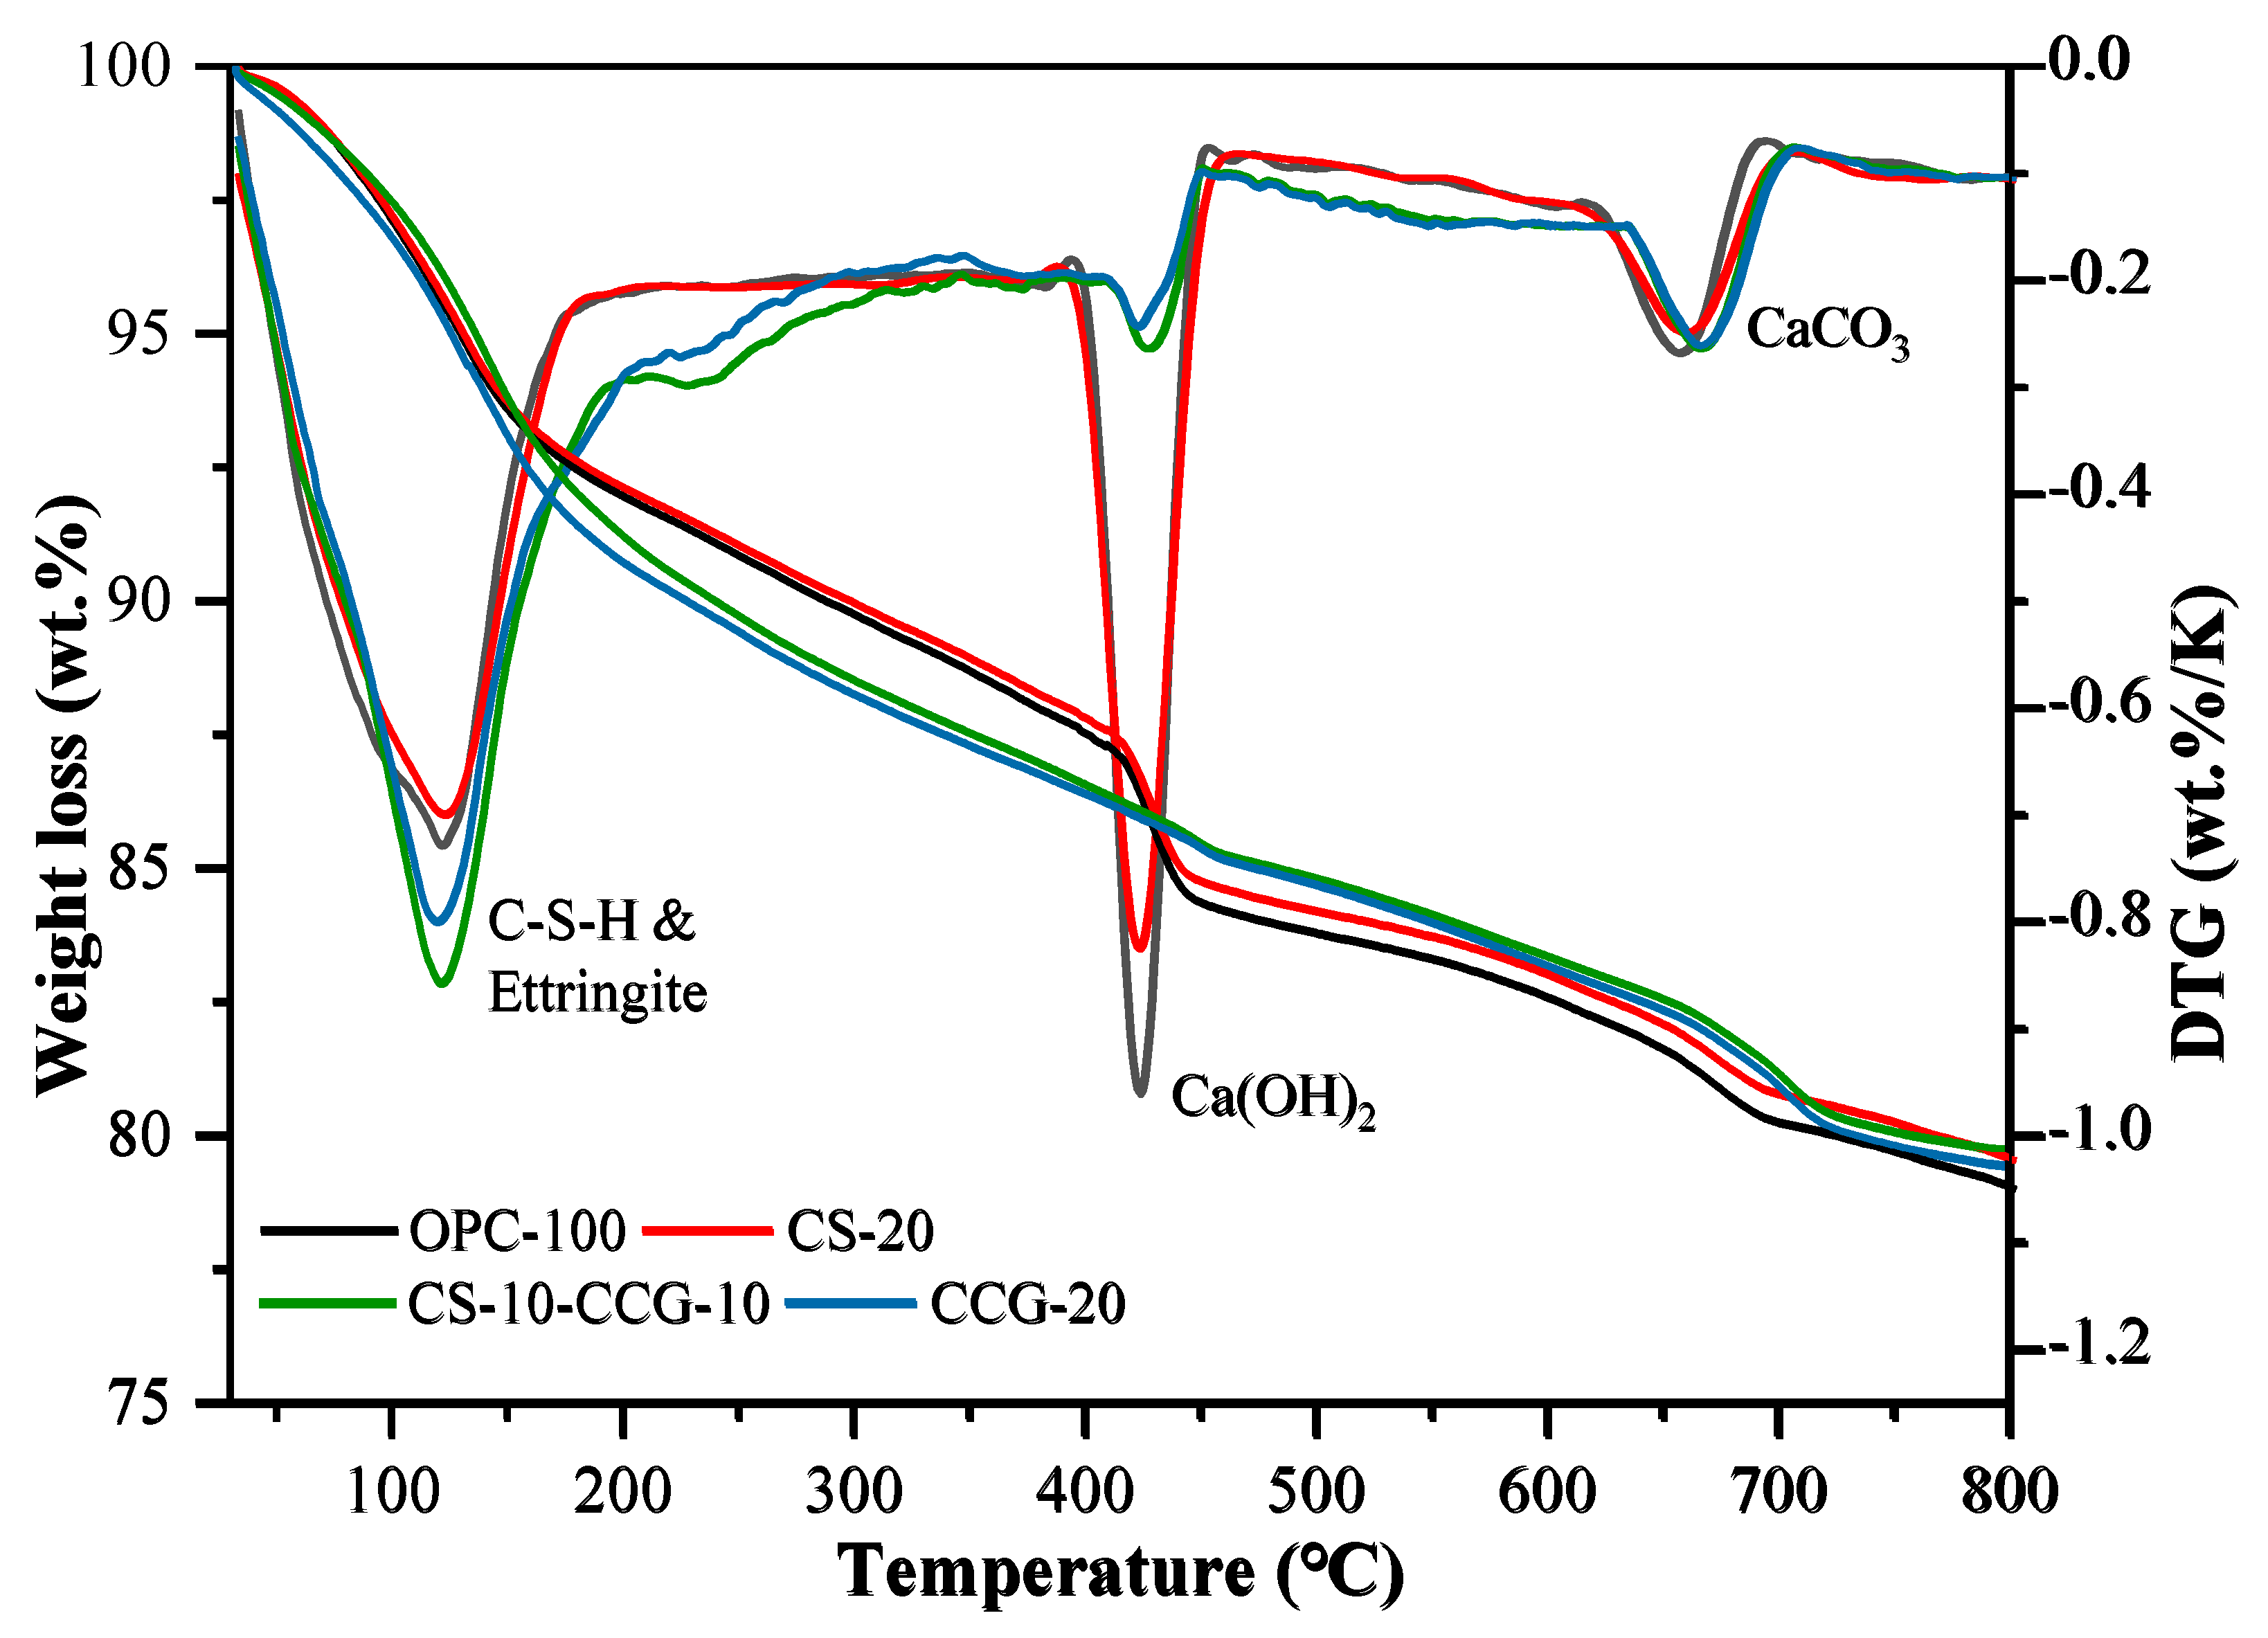
Figure 10 shows the TG and DTG curves of OPC-100, CCG-20, CS-20, and CS-10-CCG-10 samples. The following three different peaks were observed in all samples, each corresponding to a different material decomposition process: 1. The low-temperature peak (105–300 °C) is due to the dehydration of C-S-H, C-S-A-H, AFt, and M [
44,
45]. 2. The medium temperature peak (400–500 °C) is related to the decomposition of CH [
46,
47]. 3. The high temperature peak (500–800 °C) is related to the decomposition of calcium carbonate [
48,
49].
Table 4 shows the percentage of mass loss in these four stages.
From the calculation results in
Table 4, it can be seen that the addition of CCG powder reduces the content of CH. This result is consistent with the change in the CH peak intensity observed in the XRD image of the component added to CCG. There are two main reasons for this fact. First, with the replacement of cement with CCG, the content of active clinkers will decrease in the same proportion, and the CH produced by clinker hydration will also decrease. On the other hand, CCG reacts with CH, and Si
4+ and Al
3+ in CCG react with CH to form C-S-H and C-A-S-H, which is also the reason for the higher compressive strength in the later period [
34]. In addition, it can be found that the CH content of the CS-20 group is higher than that of other groups, and it decomposes less in the low-temperature range. This is mainly because the CH contained in the reactant CS decomposes at high temperatures, and there are fewer reactive silicon and aluminum substances. The calcium carbonate that decomposed in the high-temperature peak mainly comes from the limestone in the cement.
3.7. SEM
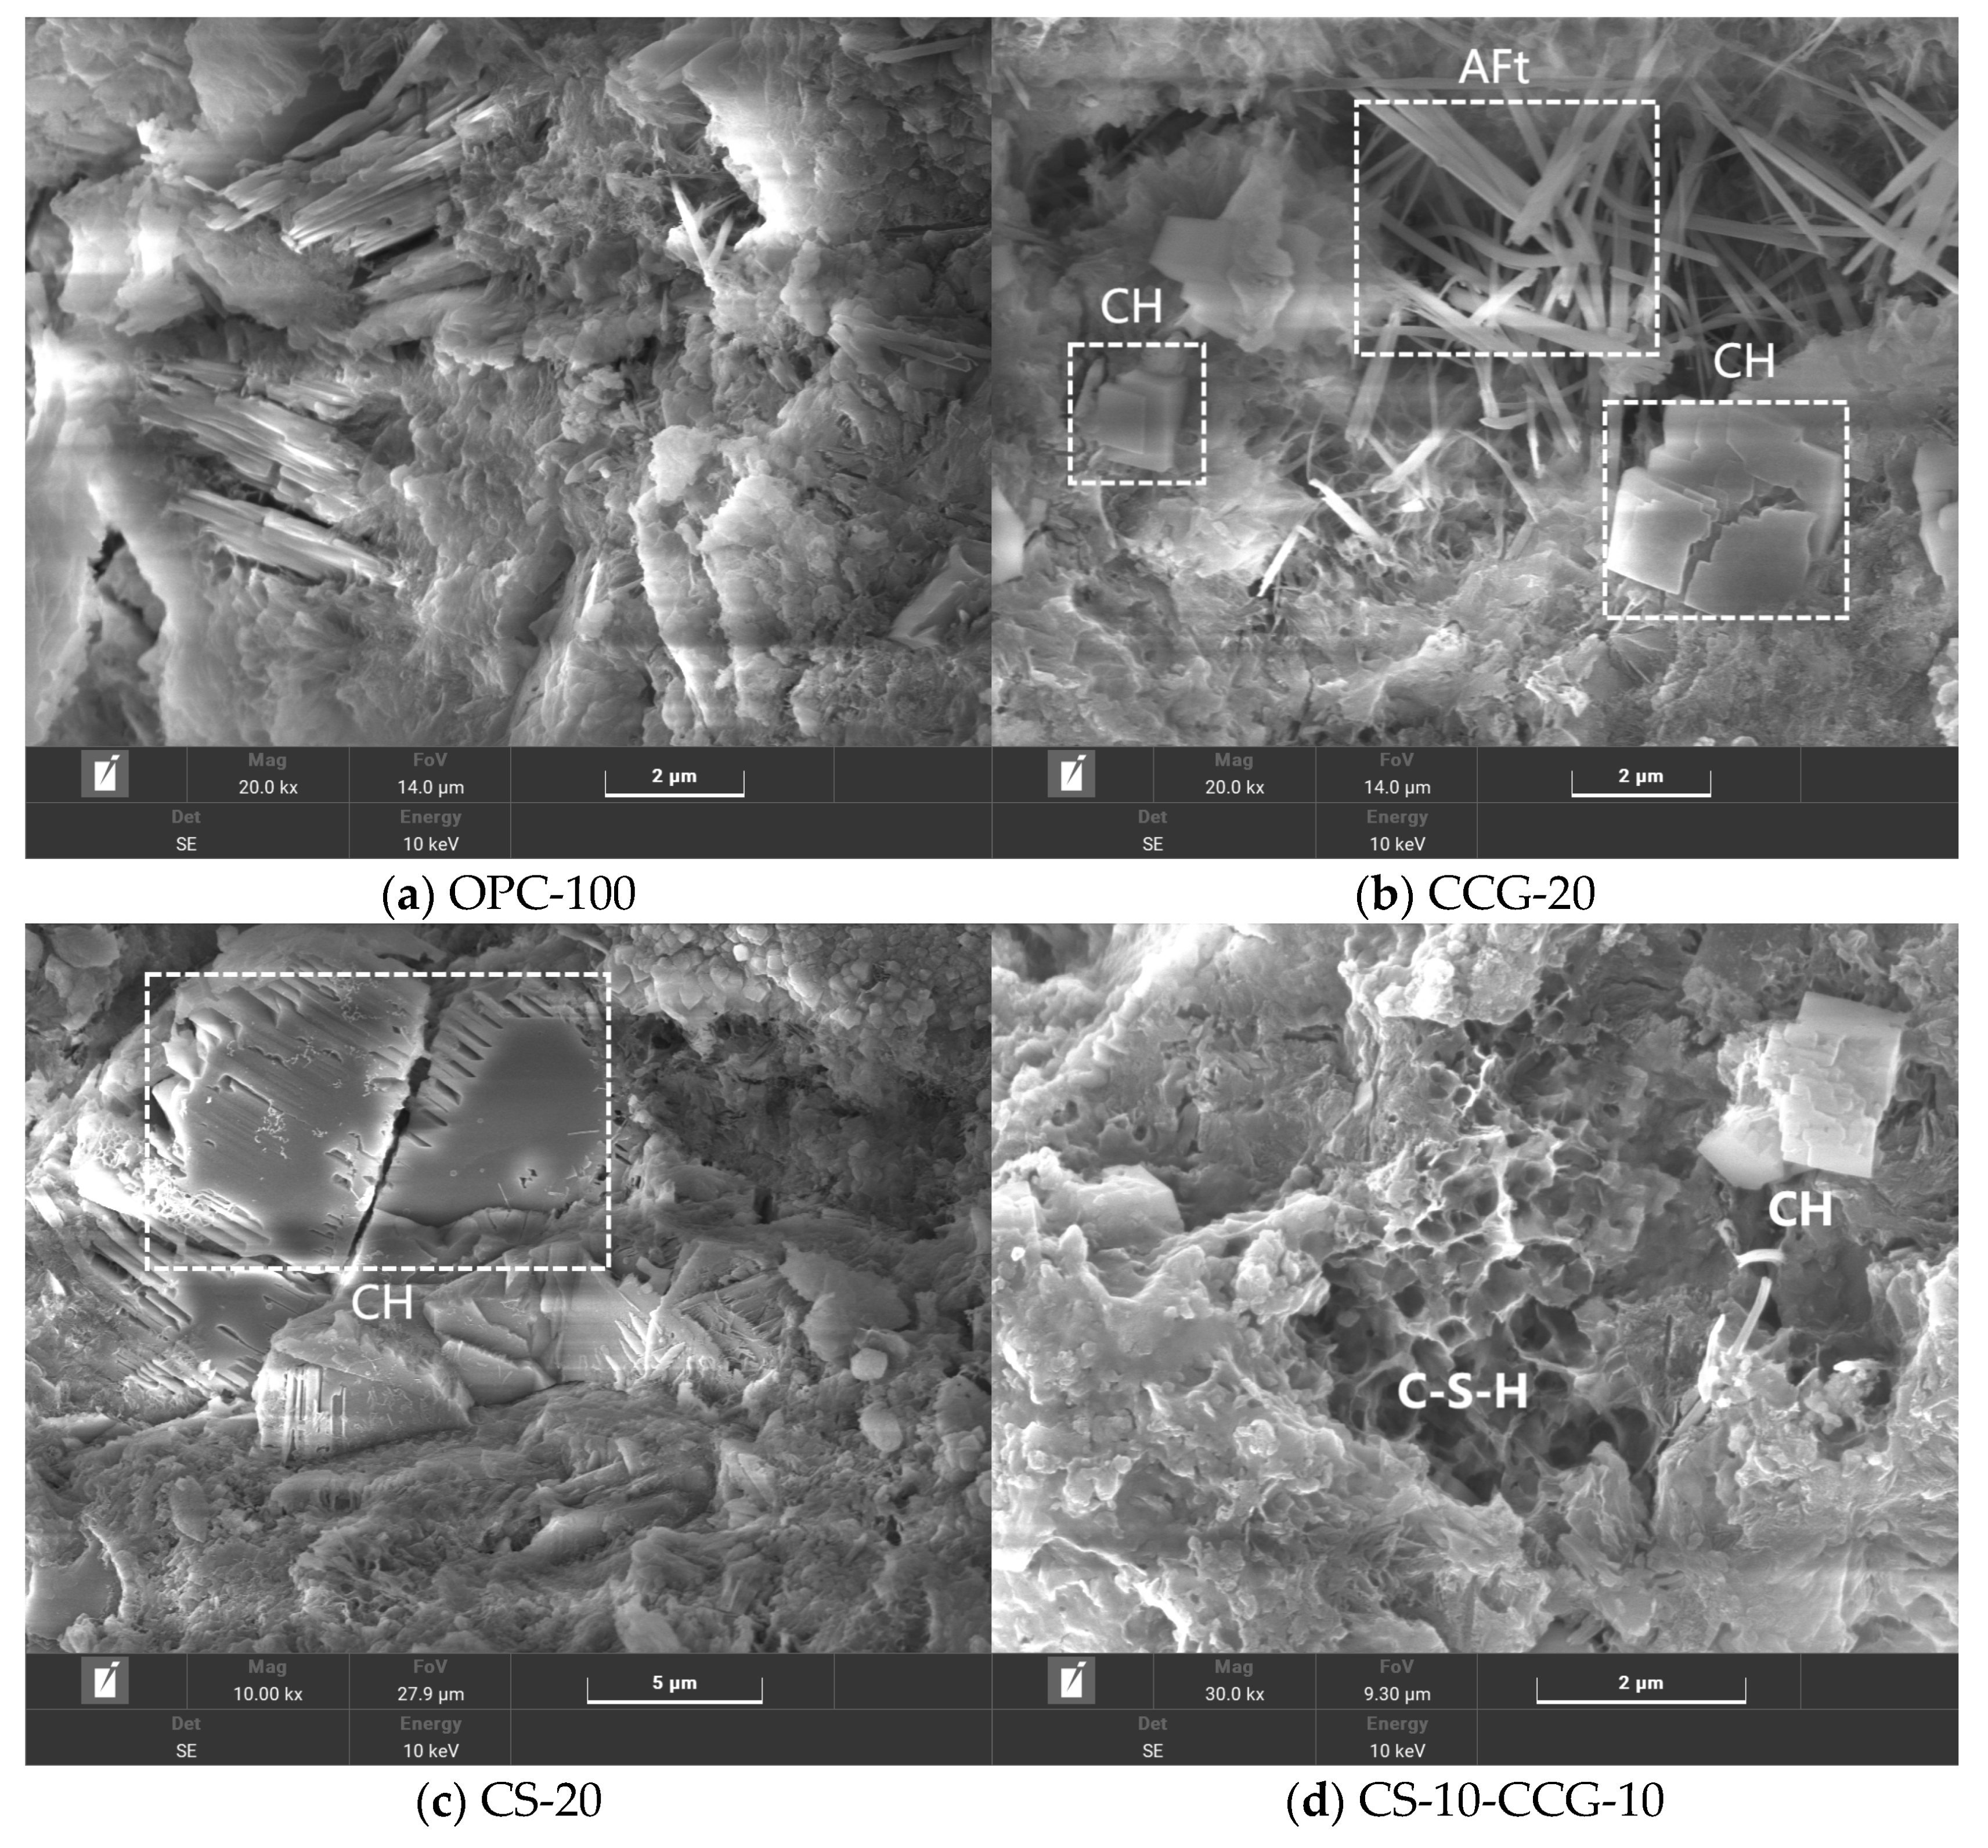
Figure 11 shows the microstructure of OPC-100, CS-20, CCG-20, and CS-10-CCG-10 paste samples at 28 days. In OPC-100, common hydration products such as needle-shaped AFt, as well as CH crystals of different morphologies (e.g., flat, prismatic, and long crystals, or plate-like and hexagonal structures), can be observed. These hydration products fill the pores inside the cement and are the main reason for the hardening and strength development of cement.
Figure 11b–d show the SEM images of CS-20, CCG-20, and CS-10-CCG-10 samples, respectively. By comparing these three images, it can be found that there are a large number of CH crystals in CS-20, which indicates that the use of CS to replace cement may lead to a shortage of reactants, and the excess CH in CS exists in the cement cementitious system in the form of crystals. In contrast, when CCG partially replaces cement (as seen in the CCG-20 group), needle-like AFt can be observed within the samples. This can be attributed to the chemical reactions between the reactive substances present in CCG (such as SiO
2 and Al
2O
2) and CH in CS and cement. This is consistent with the intensity pattern shown by the AFt chemical peak in XRD tests.
3.8. Carbon Emission Analysis
In recent years, the continuous growth of global carbon emissions has become one of the key factors driving climate change [
34,
35,
36]. The greenhouse effect caused by carbon emissions has led to significant changes in the global climate, which in turn has caused a series of environmental problems, including frequent extreme weather events and rising sea levels [
37]. These problems not only pose a serious threat to the stability of the ecosystem but also pose a huge challenge to the sustainable development of human society. In order to achieve the goal of sustainable development and ensure the healthy development of ecology and society, it has become particularly urgent to take effective carbon emission reduction measures. Therefore, this study calculated the carbon dioxide emissions generated by the production of one cubic meter of mortar. In the calculation process, only the carbon dioxide emissions under the experimental mix ratio were considered, and the carbon emissions generated during transportation and mixing were ignored.
Table 5 shows the material mass required to produce 1 cubic meter of experimental mortar,
Table 6 shows the carbon dioxide emission factor (CO
2 kg/kg) per unit mass of the raw materials used in this experiment, and
Table 7 shows the calculation results of carbon emissions. Equation (5) limits the total volume of each mortar component (OPC, CS, CCG, sand, and water) to 1 m
3.
where
represents the raw material density;
is the raw material unit volume density (kg/m
3), n = 5; and
represents each component in the raw material mixture (OPC, CS, CCG, sand, and water).
According to Equation (6):
The CO2 emissions and energy consumption per unit volume were calculated, where “CO2P” is the CO2 emissions per cubic meter of mortar and mi is the mass of each raw material per unit mass (tonnes) of mortar mix. “CO2” is the CO2 emission factor of the raw material (CO2 kg/kg).
Table 6.
Carbon footprint of raw materials used in this investigation [
50,
51,
52].
Table 6.
Carbon footprint of raw materials used in this investigation [
50,
51,
52].
| Raw Materials | OPC | CS | CCG | Sand | Water |
|---|
| GWP(CO2 kg/kg) | 0.86 | 0 | 0.079 | 0.0026 | 0.000196 |
Table 7.
Carbon consumption of raw materials used in this investigation results.
Table 7.
Carbon consumption of raw materials used in this investigation results.
| Group | OPC-100 | CS-10 | CS-20 | CCG-10 | CCG-20 | CS-10-CCG-10 |
|---|
| CO2 (kg) | 545 | 488 | 432 | 493 | 442 | 437 |
The calculation results in
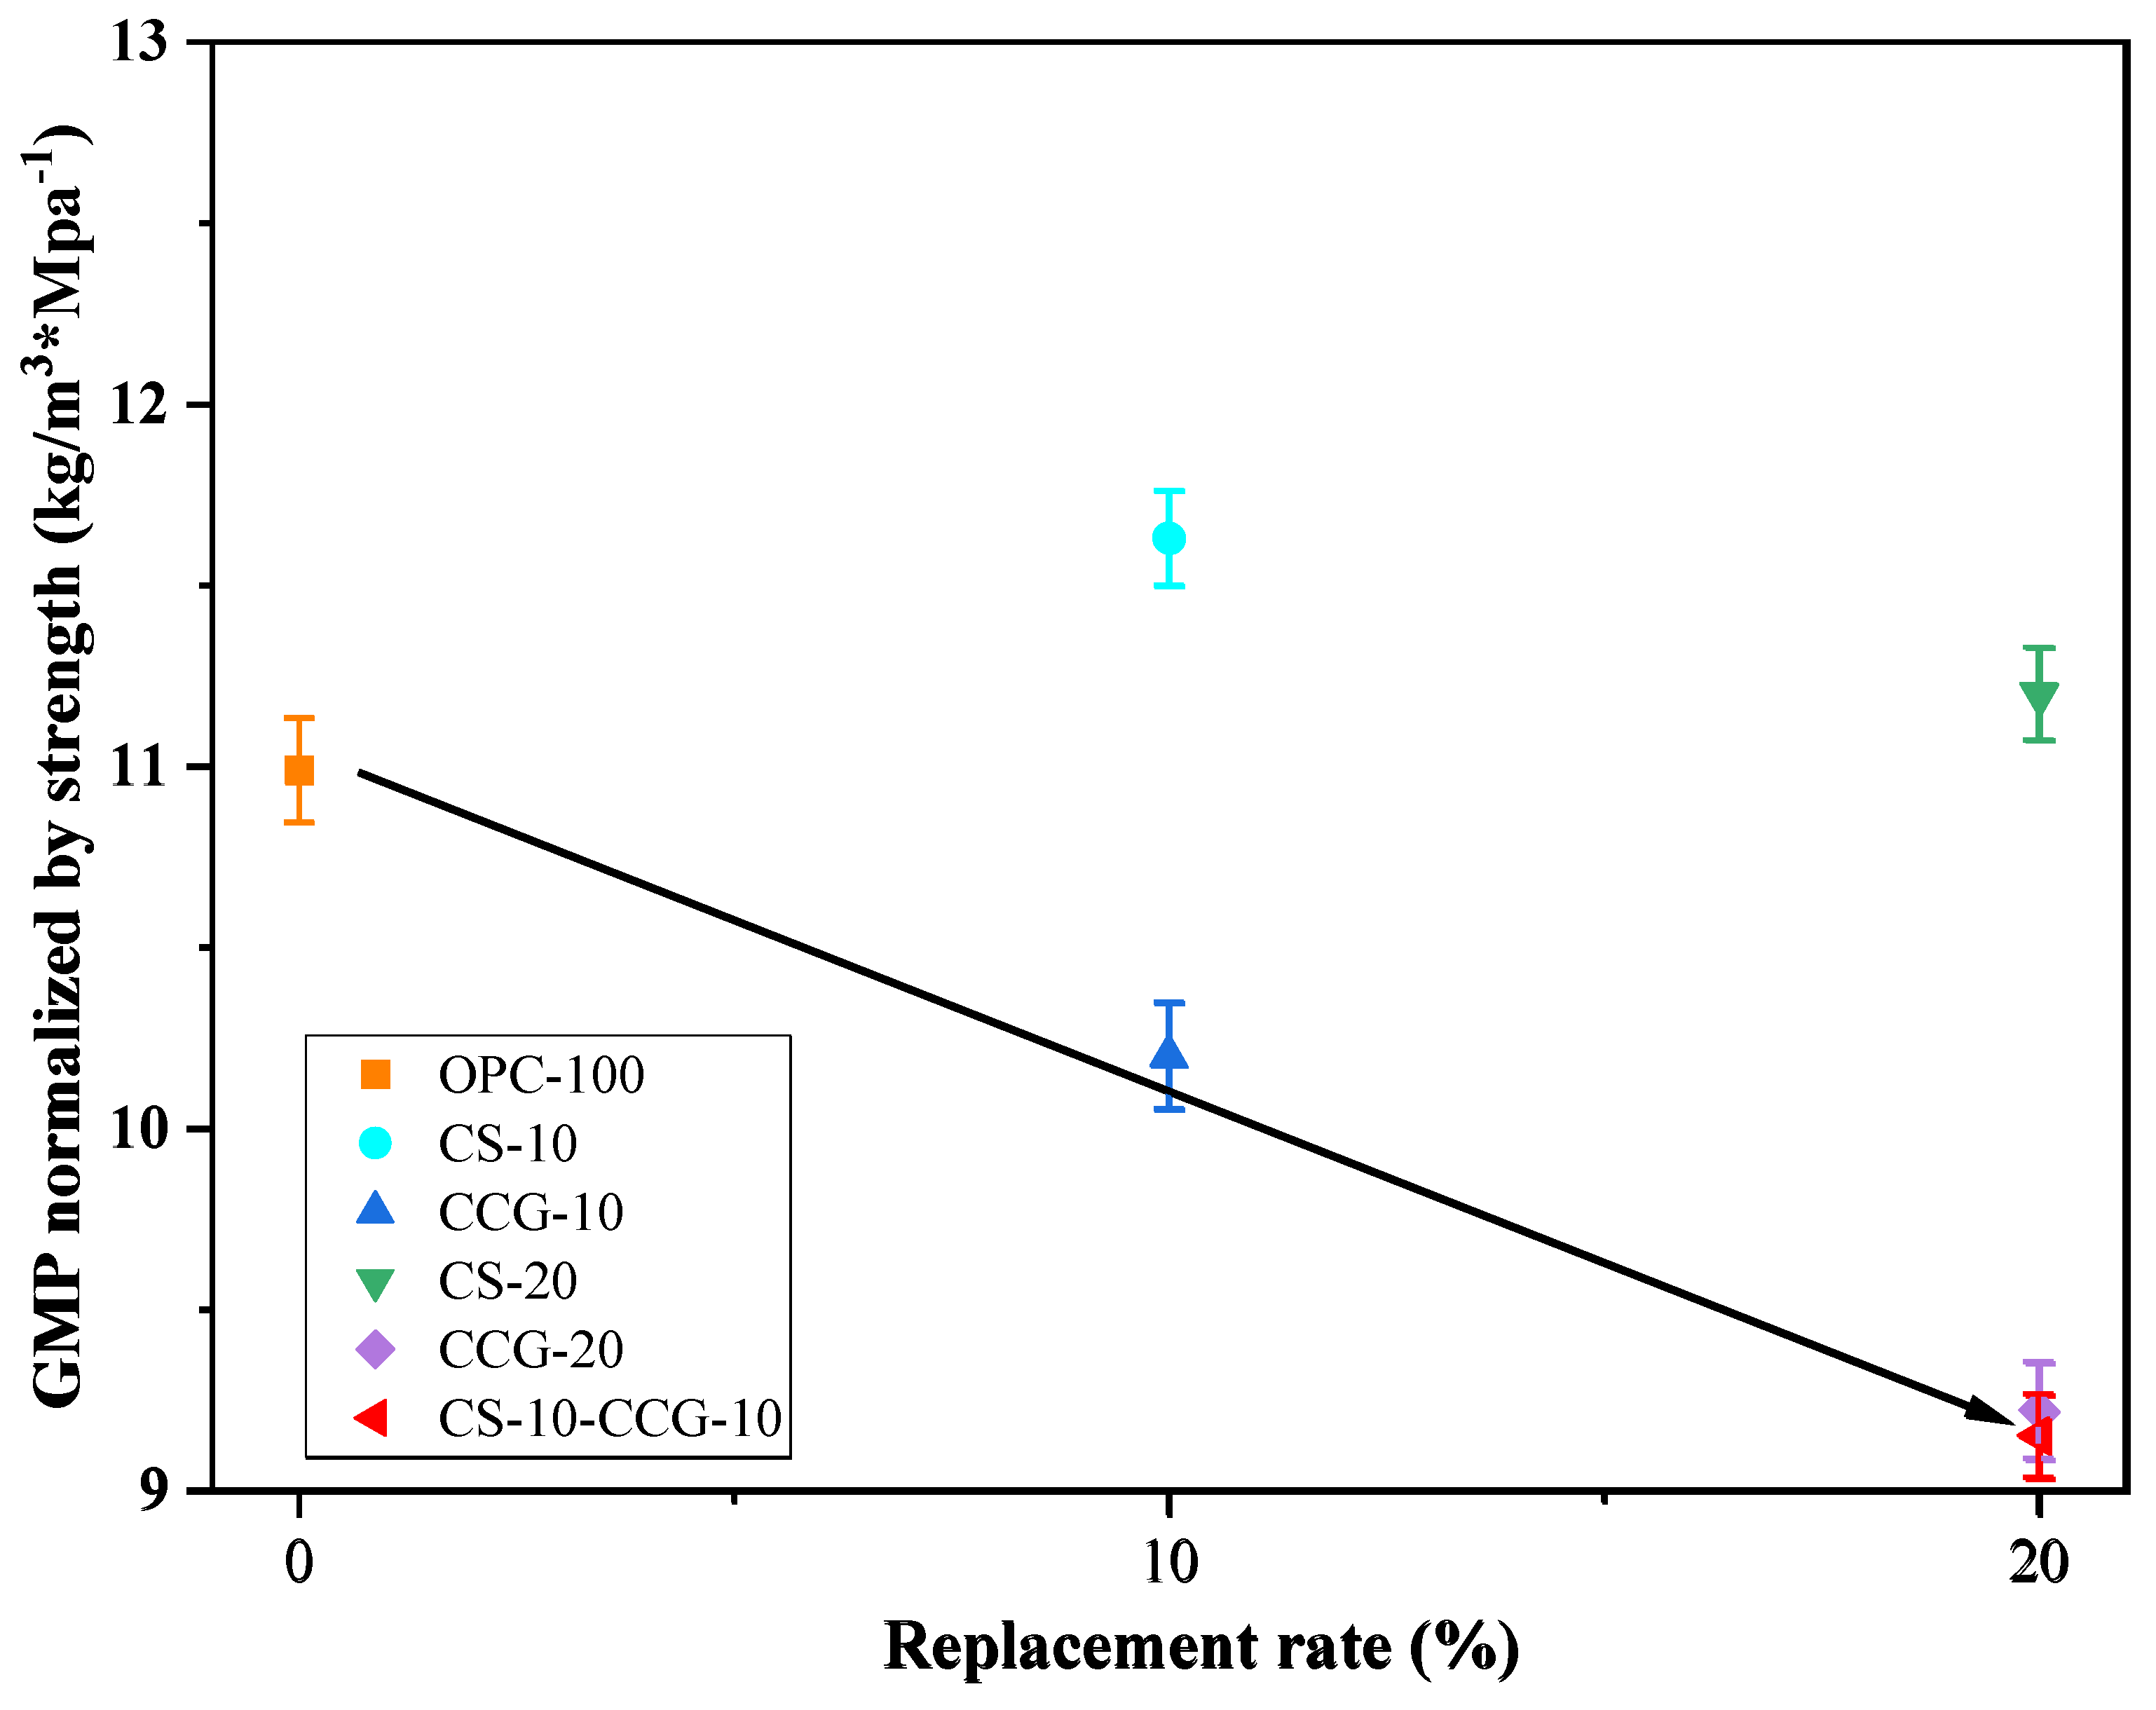
Table 7 show that as the proportion of cement replaced by these two materials increases, the carbon dioxide emissions per unit volume of mortar decrease significantly. The largest reduction is in the CS-20 group, which is 20.66%. This is because CS is regarded as an industrial by-product, so its carbon emissions are regarded as zero.
In actual engineering applications, while considering the reduction of CO
2 emissions, we should also consider the changes in cement mix proportions and the changes in cement product strength that will result. According to Equation (7) [
50], the 28-day compressive strength of each group of sample mortar is normalized to CO
2 emissions.
where
is the CO
2 emission per unit compressive strength of 28 days (kg·CO
2/MPa);
is the compressive strength of the mortar sample after 28 days of curing; and
is the calculated CO
2 emission per unit volume. From the results in
Figure 12, it can be found that when considering compressive strength, the use of CS does not have a good effect compared to the use of CS. However, when the two are mixed, the carbon dioxide emissions per unit of compressive strength are reduced to a greater extent. The mixed group shows the best result in these data, i.e., 9.15 kg·CO
2/MPa.
4. Conclusions
This paper aims to investigate the use of CCG and CS as cement-based supplementary materials to improve the sustainability of construction practices. Specifically, this study partially replaced cement with CCG or CS and focused on the compressive strength, UPV, ER, XRD, TGA, SEM, and carbon emissions of the samples. The conclusions drawn from the experiments are as follows:
- 1.
The compressive strength, UPV, and ER test results show that when the cement part is replaced by CS, the compressive strength, UPV, and ER of the mortar specimens decrease. However, when the cement part is replaced by CCG, the compressive strength, UPV, and ER of the mortar specimens will not decrease significantly. This is mainly related to the high reactivity of CCG.
- 2.
The XRD experimental results show that when part of the cement is replaced by CCG, the silicon and aluminum components in CCG will react with the cement hydration to produce CH and be consumed. In addition, the XRD experiment also shows that when the cement is replaced by CS, the CH content in the sample will increase.
- 3.
The TG experimental results show that when part of the cement is replaced by CCG, the CH content in the sample decreases, and the content of other hydration products increases. This is mainly because after CCG is used to replace cement, the CH in the sample will react with CCG and be consumed.
- 4.
SEM images show that the samples with CCG added produce hydration products to fill the pores, and these additional hydration products can improve the interface between CCG and cement, which is attributed to the reactivity of CCG. However, there is a large amount of CH inside the samples with CS added.
- 5.
The analysis of carbon emissions indicates that the use of both materials is beneficial for reducing carbon emissions. Furthermore, when considering the relationship between carbon emissions and 28-day compressive strength, the results of using CCG alone or mixing CCG with CS are superior to using CS alone.
This paper conducted a feasibility study on the utilization of CS and CCG, which provides a promising solution for treating CG produced by coal and CS produced as a byproduct of acetylene production and reducing the environmental burden of cement products without affecting the performance of cement products. In this study, we have also identified several areas for improvement: The environmental assessment method is relatively simple. Future research should incorporate more factors, such as life-cycle assessment and cost, to conduct a more comprehensive evaluation. Furthermore, the carbon dioxide emission value produced after the calcination of CG at a temperature of 750 °C has not been subject to actual measurement but has rather been directly cited, and this value is relatively small.
