Abstract
As a critical factor for the magnetic properties of grain-oriented silicon steel, the orientation accuracy of shear bands is closely related to the matrix orientation deviation from {111}<112>. This work investigates the orientation rotation of shear bands in {111}<112> matrices with various types of deviation during cold rolling, using a visco-plastic self-consistent model that incorporates a two-dimensional inclined angle of the shear band dependent on matrix orientation. When the matrix orientation deviates from {111}<112> along φ1, φ2, or both axes, the φ1 deviation of the shear band decreases, and the φ2 deviation is larger than φ1. Compared with a uniaxially deviated {111}<112> matrix, a biaxially deviated matrix along φ1 and φ2 axes produces a higher shear band deviation from Goss due to the increased φ2 deviation. This suggests that improving the orientation accuracy of the shear band is necessary to decrease the matrix deviation from {111}<112> in the φ1 and especially φ2 axes.
1. Introduction
Grain-oriented silicon steel is an important soft magnetic material primarily used in transformer cores. Its exceptional magnetic properties stem from the development of sharp Goss texture ({110}<001>, in which {110} parallels the normal direction and <001> parallels the rolling direction) after secondary recrystallization, characterized by <001> easy magnetization direction along the rolling direction (RD) [1,2,3]. Shear bands, locally strained thin regions during cold rolling, serve as preferential nucleation sites for recrystallized Goss grains [4,5,6,7]. Consequently, the orientation deviation of the shear band from Goss is critical for texture control of grain-oriented silicon steel.
Shear bands are mainly distributed in {111}<112> deformed matrix in silicon steel; thus, the matrix deviation from {111}<112> affects the orientation of the shear band and recrystallized grains. It is found that the accurate Goss shear band forms in the exact {111}<112> matrix with an inclined angle of 29°–36° to RD [8,9,10]. The orientation of the shear band rotates around RD//<001> when the {111}<112> deformed matrix rotates around <001> axis [11]. As the deviation angle of {111}<112> matrix around the normal direction (ND)/<111> axis increases, the recrystallized Goss texture weakens and gradually rotates toward the cubic texture [12,13,14]. The orientation accuracy and intensity of Goss texture decrease with the increasing diffusion angle of {111}<112> matrix [15,16,17]. It is therefore essential to systematically investigate how the deviation of {111}<112> matrix affects the deviation angle of the shear band.
Crystal plasticity simulation has been used to explore the orientation relationship between the deformed matrix and shear band in silicon steel by different methods with fixed inclination angles. Y. H. Sha reported the orientation of the shear band depending on the matrix by crystal plastic finite element method with a shear band system of fixed inclination angle [10]. Shear bands in exact {111}<112> matrix exhibit Goss orientation in the simulation using a visco-plastic self-consistent (VPSC) model by incorporating the experimentally observed inclined angle of the shear band [18]. The VPSC model is a mean-field crystal plasticity model with self-consistent schemes to account for the interaction between orientations [19,20]. Actually, the deviated {111}<112> matrix can influence the inclined angle and the orientation rotation path of the shear band [21]. However, the inclined angle and orientation of the shear band in deviated {111}<112> matrix have not been quantitatively analyzed.
In this work, shear band orientation in {111}<112> matrix with various types of deviation angle during cold rolling of grain-oriented silicon steel was investigated using the VPSC model and experimental measurement. The new 2D inclined angle of the shear band, which is dependent on matrix orientation, was incorporated in the VPSC model. The orientation rotation rate in the shear band was further calculated to analyze the deviation angle variation of the shear band. This study provides a theoretical basis for understanding the deviation origin of shear band orientation in grain-oriented silicon steel.
2. Simulation Method
2.1. VPSC Model
- (1)
- Kinematics
Based on the theory of Asaro and Rice, deformation gradient can be divided into two parts according to the linear decomposition: elastic deformation gradient and plastic deformation gradient [22]. The elastic deformation part includes lattice distortion and crystal rotation, and the plastic deformation part is accomplished by dislocation slip. The deformation velocity gradient L can be decomposed into elastic and plastic components:
The slip system α can be represented by slip direction vector and slip plane normal vector . Both vectors are unit vectors and satisfy geometric orthogonality:
The plastic deformation velocity gradient can be expressed as:
where denotes the shear strain of the αth slip system, and K denotes the total number of slip systems. P(α) and K(α) can be expressed as:
- (2)
- Slip rate
According to Schmid’s law [23], the slip system is activated when the resolved shear stress τα is greater than a critical value, and the slip rate of the αth slip system is related to the resolved shear stress τα as follows:
is the reference slip rate, n is the inverse of strain rate sensitivity factor, is the critical resolved shear stress. is a symbolic function, when x ≥ 0, and when x < 0.
- (3)
- Strain hardening
The method developed by S.R. Kalidindi et al. [24,25] and Y. Zhou et al. [26] is used. Strain hardening parameters are shown in Equations (9) and (10):
where α, β = 1, 2, 3......N. is the strength of the αth slip system, is the slip rate of the βth slip system, N is the number of slip systems. is the self-hardening and latent-hardening matrices. The latter is defined as follows:
where h0 and a are hardening parameters and τs is the saturation shear stress. qαβ is the asymmetric hardening matrix representing the interaction between slip systems. The elements of this hardening matrix are determined based on four possible geometrical configurations of the αth and βth slip systems: co-planar slip (q1), co-linear slip (q2), perpendicular slip (q3), and the same coefficients assigned to all other configurations (q4). {110}<111> and {112}<111> slip systems are considered with initial shear strengths of 220 MPa and 240 MPa, respectively [27,28,29,30]. By a fitting process [31], the following hardening parameter values are identified for silicon steel: h0 = 244 MPa, a = 0.48, τs= 1137 MPa, q1 = 1.0, q2 = 1.5, q3 = 2.0, q4 = 1.5. ATEX software is used to calculate this VPSC model (version 4.14, ATEX-Université de Lorraine, Metz, France) [32].
2.2. Velocity Gradient Tensor of Shear Band
Previous studies have identified shear band formation as a softening mechanism, where shear bands develop along a specific geometric direction for a matrix orientations [33]. Shear bands were observed in {111}<112> deformed matrix at an inclined angle of approximately 35°, governed by the {110} secondary slip plane [9].
Figure 1 presents the schematic diagram of deviated {111}<112> matrix in φ2 = 45° and φ1 = 90° sections of orientation distribution function (ODF). Rotation of {111}<112> around ND//<111> corresponds to a deviation along the φ1 axis, while rotation around <001> corresponds to a deviation along the φ2 axis. Similarly, rotation of Goss orientation around ND//<110> is equivalent to the deviation along the φ1 axis, whereas the rotation around RD//<001> corresponds to the deviation along the φ2 axis. Figure 2 illustrates the geometrical relationship between the shear band and matrix, where the inclined angle θ of the shear band is determined as {110} secondary slip plane.
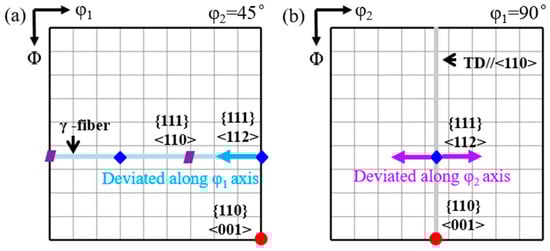
Figure 1.
Schematic diagram of {111}<112> matrix deviated along (a) φ1 and (b) φ2 axis in constant ODF sections.
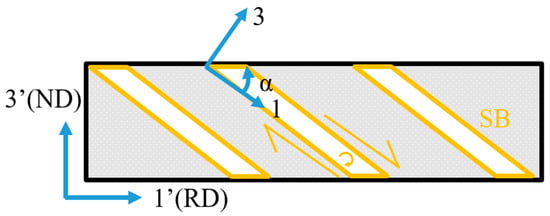
Figure 2.
Schematic diagram of shear band inclined angle.
Based on the simple shear strain in the shear band coordinate system, the velocity gradient tensor of the shear band in the sample coordinate system is expressed as:
where α is the angle between the shear band plane and RD.
2.3. Calculation Scheme
The deviated {111}<112> matrix is categorized into uniaxial and biaxial deviation in Euler space, as shown in Figure 3. The {111}<112> matrix that deviates along the φ1 axis (blue) or the φ2 axis (purple) by 5°, 10°, 15° and 20° is selected as the uniaxial deviation matrix. The {111}<112> matrix with biaxial deviation is selected as 10° (green) or 20° (orange) along the φ2 axis with 5°, 10°, 15°, and 20° along the φ1 axis. Furthermore, the orientation rotation rate of the shear band, the Euler angle change per unit strain, is calculated for different deviated {111}<112> matrices.
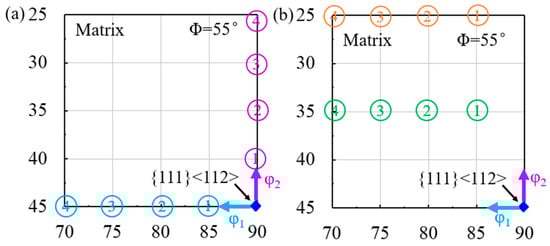
Figure 3.
Schematic diagram of (a) uniaxially and (b) biaxially deviated {111}<112> matrix.
3. Results
3.1. Uniaxial Deviation of {111}<112> Matrix
3.1.1. Deviation Along φ1 Axis
Figure 4 shows the simulated orientation rotation path morphologies of the shear band with the {111}<112> matrix deviated by 5° to 20° (a–d) along the φ1 axis. Solid arrows indicate the angle by which the matrix orientation deviates from exact {111}<112>, while dashed arrows show the angle by which the shear band orientation deviates from exact Goss. Blue arrows represent the deviation along the φ1 axis, and red arrows represent deviation along the φ2 axis. Counterclockwise rotation is designated as positive. From Figure 4a to Figure 4d, the deviation angle of the matrix orientation along the φ1 axis increases from 5° to 20°, while the deviation angle of the shear band orientation along the φ1 axis increases from 2° to 6°. The deviation angle of the shear band along the φ1 axis is always smaller than that of the matrix orientation. The deviation angle of the shear band along the φ2 axis first increases counterclockwise from 1° to 3° and then clockwise to −3°. In all cases, the shear band orientation exhibits a larger deviation along the φ1 axis compared with the φ2 axis.
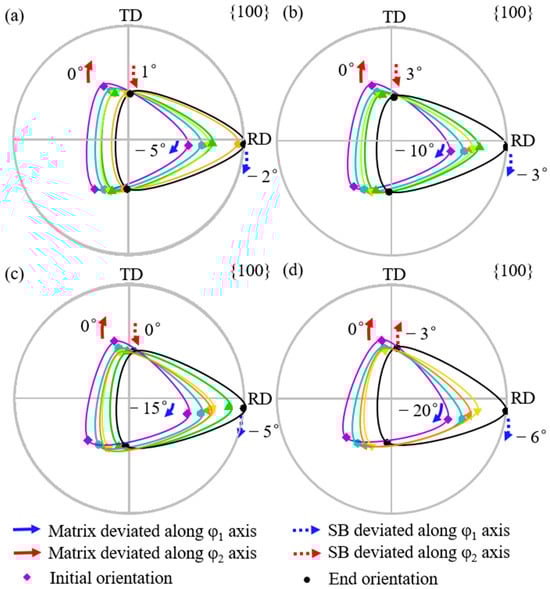
Figure 4.
Simulated orientation rotation process of shear band in {111}<112> matrix deviated along φ1 axis by 5°, 10°, 15°, and 20° (a–d).
Figure 5 shows the rotation path projection of shear band orientation with {111}<112> matrix deviated along the φ1 axis. Each arrow represents the rotation under identical strain. The deviation angle of the shear band along φ1 decreases during rotation, while that along the φ2 axis first increases and then decreases. A larger deviation angle of the matrix produces a more significant decrease in φ1 and φ2 deviation angles of the shear band, respectively.
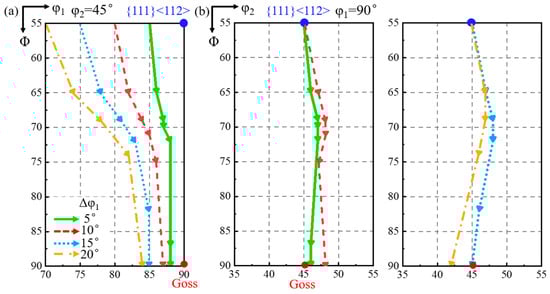
Figure 5.
The rotation path projection of shear band orientation on constant (a) φ2 = 45° and (b) φ1 = 90° ODF sections with the matrix deviated along φ1 axis.
3.1.2. Deviation Along φ2 Axis
Figure 6 shows the simulated orientation rotation path of the shear band when {111}<112> matrix is deviated by 5° to 20° (a–d) along the φ2 axis. From Figure 6a to Figure 6d, with the deviation angle of the matrix along the φ2 axis increasing from 5° to 20°, the shear band deviation along the φ2 axis increases from 1° to 10°. The shear band deviation along the φ2 axis is smaller than the matrix as observed experimentally [11]. In addition, the deviation of shear band orientation along the φ2 axis is greater than or similar to that along the φ1 axis.
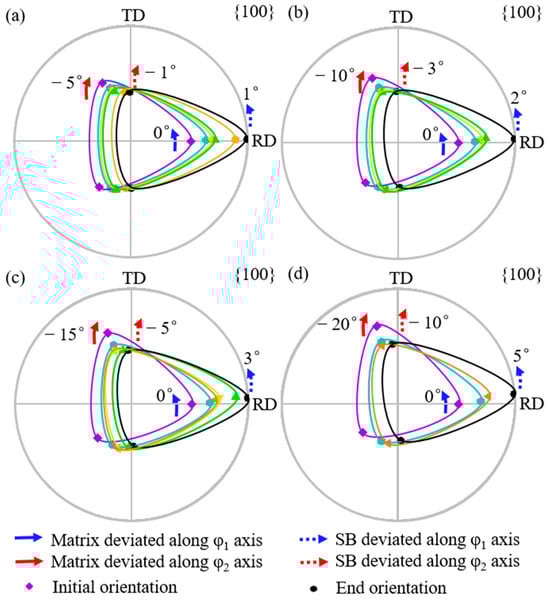
Figure 6.
Simulated orientation rotation path of shear band in {111}<112> matrix deviated along φ2 axis by 5°, 10°, 15°, and 20° (a–d).
Figure 7 shows the projection of the orientation rotation path of the shear band when {111}<112> matrix is deviated along the φ2 axis. As shown in Figure 7a, the φ1 deviation of the shear band initially increases and then decreases slightly during rotation. The larger the matrix deviation along the φ2 axis, the greater the increase in the φ1 deviation of the shear band. According to Figure 7b, the φ2 deviation of the shear band decreases throughout the rotation process. A larger matrix deviation leads to a greater φ1 deviation, but with a more significant decrease in φ2 deviation.
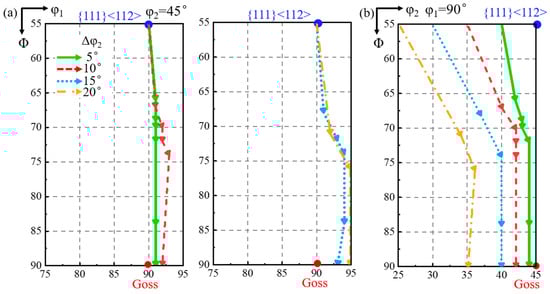
Figure 7.
The projection of orientation rotation path of shear band for matrix deviated along φ2 axis on constant (a) φ2 = 45° and (b) φ1 = 90° ODF sections.
3.2. Biaxial Deviation of {111}<112> Matrix
3.2.1. 10° Deviation Along φ2 Axis
Figure 8 shows the simulated orientation rotation path of the shear band when the matrix is deviated by 10° along the φ2 axis with deviation by 5° to 20° (a–d) along the φ1 axis. For the matrix deviation along the φ1 axis from 5° to 20°, the shear band deviation along the φ1 axis, from 1° counterclockwise to 5° clockwise, is smaller than the matrix, while the shear band deviation along the φ2 axis increases from 3° to 17°. However, when the matrix is deviated by more than 10° along the φ1 axis, the shear band deviates at an angle greater along the φ2 axis than the matrix. The shear band orientation consistently exhibits a greater deviation along the φ2 axis compared with the φ1 axis.
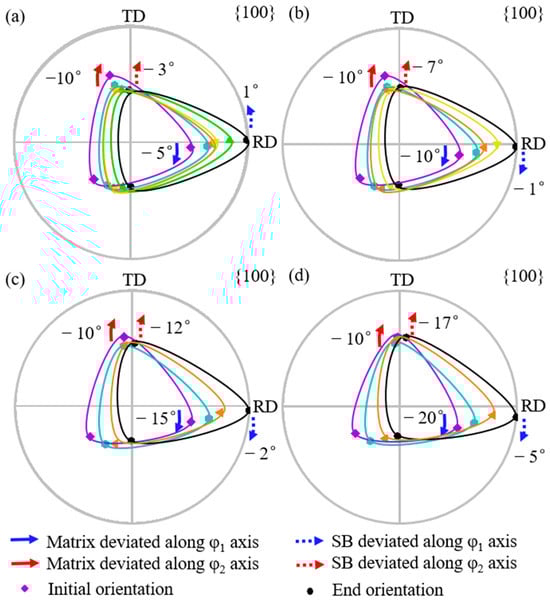
Figure 8.
Simulated orientation rotation path of shear band in the matrix deviated by 10° along φ2 axis and 5°, 10°, 15°, and 20° along φ1 axis (a–d).
As shown in Figure 9, the φ1 deviation of the shear band first decreases and then increases slightly during rotation. When the matrix deviation along the φ1 axis is 5°, the φ1 deviation of the shear band decreases to 0° and then increases in the opposite direction. The shear band deviation along the φ2 axis first decreases and then increases during rotation. When the matrix is deviated by more than 10° along the φ1 axis, the φ2 deviation of the shear band is progressively greater than the φ2 deviation of the matrix.
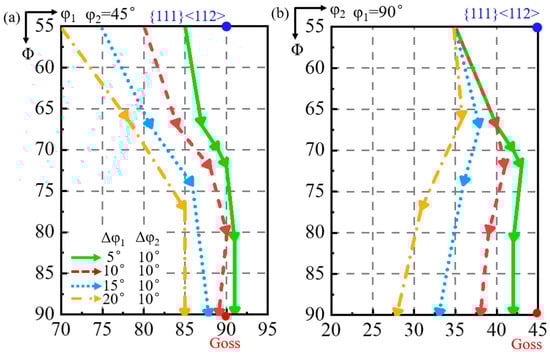
Figure 9.
The projection of orientation rotation path of shear band in the matrix deviated by 10° along φ2 axis and 5°, 10°, 15°, and 20° along φ1 axis at constant (a) φ2 = 45° and (b) φ1 = 90° ODF sections.
3.2.2. 20° Deviation Along φ2 Axis
Figure 10 shows the simulated orientation rotation path of the shear band when the matrix is deviated by 20° deviation along the φ2 axis with deviation by 5° to 20° (a–d) along the φ1 axis. When the matrix deviation along the φ1 axis increases from 5° to 20°, the shear band deviation along the φ1 axis changes from 3° counterclockwise to 6° clockwise, while the shear band deviation along the φ2 axis increases from 15° to 28°. When the matrix is deviated by more than 5° along the φ1 axis, the shear band deviates at an angle greater than the matrix along the φ2 axis. The shear band consistently exhibits a larger deviation along the φ2 axis than the φ1 axis.
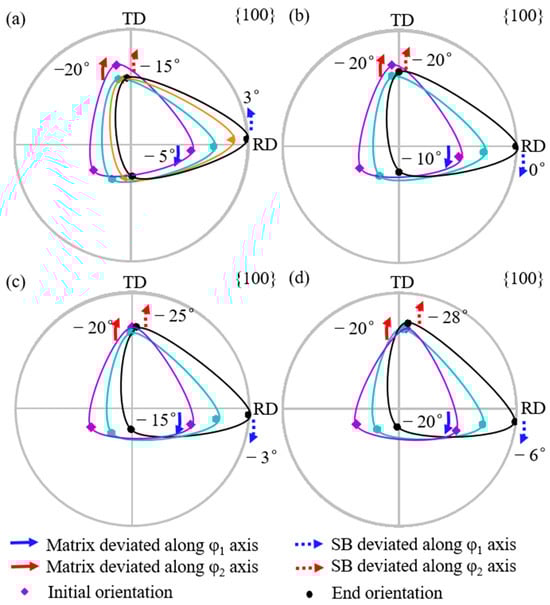
Figure 10.
Simulated orientation rotation path of shear band in the matrix deviated by 20° along φ2 axis and 5°, 10°, 15°, and 20° along φ1 axis (a–d).
Figure 11 shows the projection of the orientation rotation path of the shear band. When the φ1 deviation of the matrix is 5°, that of the shear band decreases to 0° and then increases in the opposite direction, while the φ2 deviation first decreases and then increases. When the matrix is deviated by more than 5° along the φ1 axis, the φ2 deviation of the shear band becomes progressively greater than the φ2 deviation of the matrix.
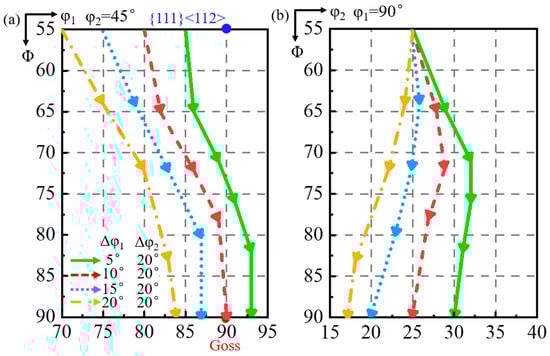
Figure 11.
The projection of orientation rotation path of shear band in the matrix deviated by 20° along φ2 axis and 5°, 10°, 15°, and 20° along φ1 axis at constant (a) φ2 = 45° and (b) φ1 = 90° ODF sections.
According to the above simulation, the orientation deviation type of the matrix evidently affects the rotation path of the shear band. When the matrix is uniaxially deviated from {111}<112> by 10° along the φ1 or φ2 axis, the φ1 deviation of the shear band decreases by 2°. In contrast, the φ2 deviation of the shear band increases by 4° when {111}<112> is deviated by 10° along both axes. When the matrix is uniaxially deviated by 20° along the φ1 or φ2 axis, the φ1 deviation of the shear band remains unchanged, whereas the φ2 deviation of the shear band increases by 18° when {111}<112> is deviated by 20° along both axes. This indicates that, compared with uniaxial deviation, the biaxial deviation of the matrix from {111}<112> results in either a decrease or no change in the φ1 deviation of the shear band, and the shear band deviation along the φ2 axis increases consistently.
3.3. Measurement of Shear Band Deviation
Figure 12 presents the orientations and morphologies of three shear band regions in cold rolled grain-oriented silicon steel. The matrices and shear bands are outlined with black and orange dashed lines, respectively. In {100} pole figures, orientation points of the matrix and shear band are circled with black and orange boxes. In region 1, the matrix has an orientation at (81°, 60°, 49°) with a predominant φ1 uniaxial deviation from {111}<112>, and the shear band has an orientation at (82°, 90°,46°) with an 8° deviation from Goss. Compared with the matrix, the shear band deviation decreases by 1° along the φ1 axis and 3° along the φ2 axis. The simulated shear band orientation is located at (85°, 90°, 48°), deviated by 6° from Goss and 2° from the measurement.
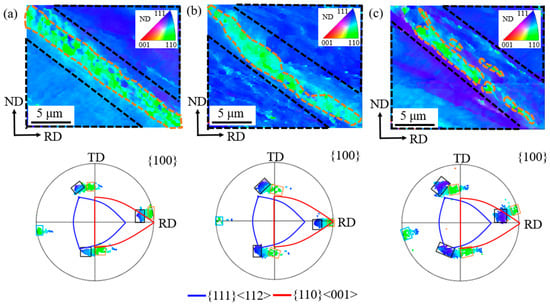
Figure 12.
Orientation morphologies and {100} pole figures of shear band region 1 (a), region 2 (b) and region 3 (c).
In region 2, the matrix zone has an orientation focused at (89°, 62°, 41°), with a predominant φ2 uniaxial deviation from {111}<112>. The shear band zone has an orientation focused at (92°, 90°, 44°), with a 2° deviation from Goss. Relative to the matrix, the shear band deviation first decreases and then increases by 2° along the φ1 axis and decreases by 3° along the φ2 axis. The simulated shear band orientation based on matrix orientation is located at (91°, 90°, 44°), deviated by 1° from Goss and 1° from the measurement.
In region 3, the matrix has an orientation at (80°, 57°, 57°) with a biaxial deviation from {111}<112>. The shear band region has an orientation at (81°, 90°, 46°) with a 9° deviation from Goss. Compared with the matrix, the shear band deviation decreases by 1° along the φ1 axis and 11° along the φ2 axis. The simulated shear band orientation is located at (84°, 90°, 50°) with an 8° deviation from Goss, having only 1° difference from the measurement. This demonstrates that the present simulation effectively predicts the shear band orientation in the matrix deviated from {111}<112>.
4. Discussion
Based on the simulation and measurement, the shear band deviation from Goss along the φ1 and φ2 axes exhibits various dependencies on matrix orientation deviating from {111}<112>. The deviation angle change in the shear band in the rotation path can be attributed to the orientation rotation rate along the φ1 and φ2 axes [34,35].
4.1. Rotation Rate of Shear Band in Uniaxially Deviated Matrix
The orientation rotation rate morphologies of the shear band along the φ1 and φ2 axes in the deviated {111}<112> matrix along the φ1 axis are presented in Figure 13. The φ1 rotation rate decreases along the rotation path, and a larger φ1 deviation of the matrix corresponds to a notably higher rotation rate along the φ1 axis. This enables the φ1 angle to approach 90° with a decreased deviation along the φ1 axis. For the φ1 deviation of the matrix below 10°, the rotation rate of the shear band along the φ2 axis transits from negative to positive, so that the shear band deviation from Goss initially increases and then approaches Goss. However, when the φ1 deviation of the matrix exceeds 15°, the rotation rate of the shear band along the φ2 axis ultimately becomes negative again, and the shear band deviation along φ2 from Goss increases consequently.
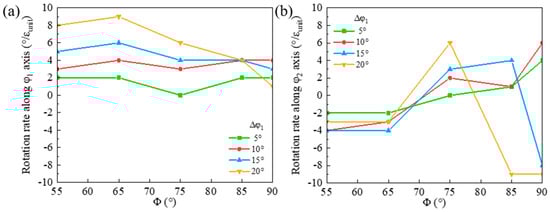
Figure 13.
Variation of orientation rotation rate in shear band along (a) φ1 and (b) φ2 axes for {111}<112> matrix deviated along φ1 axis.
The orientation rotation rates of the shear band along the φ1 and φ2 axes for the {111}<112> matrix deviated along the φ2 axis are shown in Figure 14. A larger φ2 deviation of the matrix results in a higher negative rotation rate along the φ1 axis in the rotation path below Φ = 80° and a higher positive φ1 rotation rate in the range of Φ = 80~90°. Thus, the shear band deviation along the φ1 axis from Goss first increases and then slightly decreases. There is a large rotation rate of the shear band along the φ2 axis especially in the matrix with large deviation along the φ2 axis. However, when Φ > 75°, the rotation rate is relatively low, so the shear band deviation along the φ2 axis from Goss decreases during cold rolling. Furthermore, the larger negative rotation rate of the shear band in the matrix deviated along the φ2 axis leads to a larger shear band deviation from Goss compared with the case of the matrix deviated along the φ1 axis.
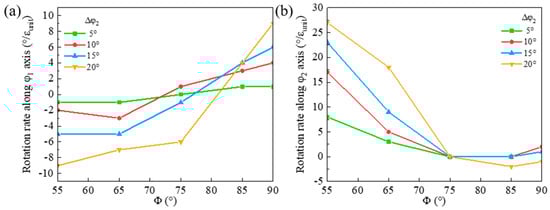
Figure 14.
Variation of orientation rotation rate in shear band along (a) φ1 and (b) φ2 axes for {111}<112> matrix deviated along φ2 axis.
4.2. Rotation Rate of Shear Band in Biaxially Deviated Matrix
The orientation rotation rates of the shear band along the φ1 and φ2 axes in the (90°, 55°, 35°) matrix are shown in Figure 15. The absolute value of the rotation rate along the φ1 axis decreases along the rotation path. A larger matrix deviation along the φ1 axis results in a higher absolute rotation rate along the φ1 axis. However, the absolute rotation rate decreases more significantly as Φ increases, which is responsible for the decrease in φ1 deviation of the shear band. The rotation rate of the shear band along the φ2 axis also decreases during rotation and turns from positive to negative, so that the shear band orientation first rotates toward and then away from Goss. A larger matrix deviation along the φ1 axis corresponds to a lower rotation rate along the φ2 axis, leading to an ultimately increased φ2 deviation of the shear band. Additionally, the reduction in the rotation rate along the φ2 axis from positive to negative is more rapid than the φ1 axis, which leads to a more significant shear band deviation along the φ2 axis.
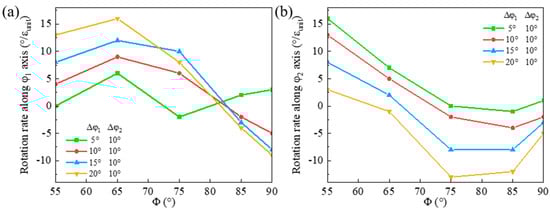
Figure 15.
Variation of orientation rotation rate of shear band along (a) φ1 and (b) φ2 axis in (90°, 55°, 35°) matrix deviated along φ1 axis.
The orientation rotation rates of the shear band in (90°, 55°, 25°) matrix along the φ1 and φ2 axes are similar to the (90°, 55°, 35°) matrix. Compared with the matrix uniaxially deviated along the φ1 or φ2 axis, the shear band orientation in the matrix biaxially deviated along both axes has an larger negative rotation rate along the φ2 axis near Goss orientation. Consequently, the shear band has a larger deviation from Goss along the φ2 axis in the biaxially deviated {111}<112> matrix.
The crystal orientation always rotates to converge towards the orientation with higher stability or to diverge from the orientation with lower stability [36]. The deviation angle of the shear band along the φ1 axis decreases during rolling, indicating that Goss orientation exhibits a greater stability with respect to the φ1 axis deviation compared with the φ2 axis.
4.3. Applications and Limitations of the Model
The orientation deviation of the shear band leads to an orientation deviation of recrystallized Goss grains, and consequently influences the accuracy of secondary recrystallization Goss texture [37,38]. The shear band deviation along the φ1 axis results in the secondary recrystallization texture misaligning with <001> easy magnetization axis along RD, thereby reducing the magnetic properties of the final product. The shear band deviation along the φ2 axis results in the deviated <110> from ND after secondary recrystallization [39], which also degrades the magnetic properties.
In industrial production, parameters such as carbon content and rolling temperature are employed to regulate the activation and number of shear bands [40]. However, the shear band orientation basically relies on matrix orientation, which is more involved in the production process of grain-oriented silicon steel. In the present study, the crystal plasticity simulation with a 2D inclined angle of the shear band depending on matrix orientation can represent the general orientation rotation path in the shear band for different matrices deviated from {111}<112> in actual industrial processes.
The VPSC model and this study assume a homogenized deformation of the shear band, which may overlook the local heterogeneities or variations in shear bands that can influence general orientation diffusion behavior, especially at a smaller scale.
5. Conclusion
Shear band orientation in deviated {111}<112> matrix was investigated using crystal plasticity simulation by introducing a two-dimensional inclination of the shear band plane-dependent matrix orientation as well as experimental measurement.
- (1)
- In uniaxially deviated {111}<112> matrix along the φ1 (or φ2) axis, the shear band deviation in the φ1 (or φ2) axis from Goss decreases during rotation, while the deviation in the φ2 (or φ1) axis either first increases and then decreases or monotonically increases. The larger negative orientation rotation rate of the shear band in the matrix deviated along the φ2 axis results in the larger shear band deviation from Goss compared with the matrix deviated along the φ1 axis.
- (2)
- In the {111}<112> matrix deviated along both φ1 and φ2 axes, the shear band deviation along φ1 decreases throughout the rotation process, while the deviation along φ2 first decreases and then increases. The rapidly decreased rotation rate along the φ2 axis is responsible for the larger shear band deviation from Goss along the φ2 axis than the φ1 axis.
- (3)
- Compared with uniaxially deviated {111}<112> matrix, the biaxially deviated matrix can have a reduced or unchanged deviation along the φ1 axis and an increased deviation along the φ2 axis, resulting in a larger overall deviation in the shear band from Goss. This difference arises from the enhanced rotation rate along the φ1 axis and the decreased rotation rate along the φ2 axis under biaxial deviation of the matrix.
- (4)
- The simulation method used is capable of predicting the general rotation path in the shear band, and can be extended to other BCC metallic materials. However, the present simulation is based on the assumptions that a simple shear strain occurs in the shear band and the orientation rotation in the shear band is uniform. Further simulation work is needed to investigate the orientation dispersion in the shear band due to the microscopic strain heterogeneity.
Author Contributions
Conceptualization, Y.S. and S.C.; methodology, S.C. and X.C.; validation, Y.S. and S.C.; formal analysis, Y.S. and S.C.; investigation, S.C.; resources, L.Z. and Y.S.; data curation, S.C.; writing—original draft preparation, S.C.; writing—review and editing, Y.S. and F.Z.; supervision, F.Z.; project administration, Y.S. All authors have read and agreed to the published version of the manuscript.
Funding
This work is supported by National Natural Science Foundation of China (No. 52371022).
Institutional Review Board Statement
Not applicable.
Informed Consent Statement
Not applicable.
Data Availability Statement
The raw/processed data can be made available by the corresponding author upon reasonable request.
Acknowledgments
The authors extend their gratitude to Y. H. Sun and N. Xiao (Analytical and Testing Center of Northeastern University) for the help with the EBSD technique.
Conflicts of Interest
The authors declare no conflicts of interest.
References
- Xia, Z.; Kang, Y.; Wang, Q. Developments in the production of grain-oriented electrical steel. J. Magn. Magn. Mater. 2008, 320, 3229–3233. [Google Scholar] [CrossRef]
- Moses, A.J. Energy efficient electrical steels: Magnetic performance prediction and optimization. Scr. Mater. 2012, 67, 560–565. [Google Scholar] [CrossRef]
- Lee, S.; Ko, H.-S.; Han, K.; Kim, S.-J. Role of subsurface goss-oriented grains in abnormal grain growth in fe-3% si steel. Mater. Charact. 2021, 180, 111381. [Google Scholar] [CrossRef]
- Wright, T.W.; Wright, T.W. The Physics and Mathematics of Adiabatic Shear Bands; Cambridge University Press: Cambridge, UK, 2002. [Google Scholar]
- Haratani, T.; Hutchinson, W.B.; Dillamore, I.L.; Bate, P. Contribution of shear banding to origin of goss texture in silicon iron. Met. Sci. 1984, 18, 57–66. [Google Scholar] [CrossRef]
- Ushioda, K.; Hutchinson, W. Role of shear bands in annealing texture formation in 3% si–fe (111)[112] single crystals. ISIJ Int. 1989, 29, 862–867. [Google Scholar] [CrossRef]
- Murakami, K.; Morishige, N.; Ushioda, K. The effect of cold rolling reduction on shear band and texture formation in fe-3% si alloy. Mater. Sci. Forum 2012, 715–716, 158–163. [Google Scholar] [CrossRef]
- Dorner, D.; Zaefferer, S. Microstructure and texture of shear bands in cold rolled silicon steel single crystals of goss orientation. Solid State Phenom. 2005, 105, 239–244. [Google Scholar] [CrossRef]
- Dorner, D.; Zaefferer, S.; Raabe, D. Retention of the goss orientation between microbands during cold rolling of an fe3%si single crystal. Acta Mater. 2007, 55, 2519–2530. [Google Scholar] [CrossRef]
- Sha, Y.H.; Sun, C.; Zhang, F.; Patel, D.; Chen, X.; Kalidindi, S.R.; Zuo, L. Strong cube recrystallization texture in silicon steel by twin-roll casting process. Acta Mater. 2014, 76, 106–117. [Google Scholar] [CrossRef]
- Chen, S.; Sha, Y.; Chen, X.; He, Z.; Zhang, F.; Zuo, L. Texture transition of shear bands in initially goss–oriented grains in fe–3 wt% si alloy. J. Magn. Magn. Mater. 2022, 551, 169186. [Google Scholar] [CrossRef]
- Zhang, N.; Yang, P.; He, C.; Mao, W. Effect of {110}<229> and {110}<112> grains on texture evolution during cold rolling and annealing of electrical steel. ISIJ Int. 2016, 56, 1462–1469. [Google Scholar]
- Wang, Y.-P.; Song, H.-Y.; An, L.-Z.; Wang, G.-D.; Liu, H.-T. Correlations between initial goss orientations with different deviation angles and evolution of microstructure and texture in ultrathin grain-oriented silicon steels. Steel Res. Int. 2020, 92, 2000356. [Google Scholar] [CrossRef]
- Ning, X.; Liang, Y.; Wang, Y.; Ye, F.; Lin, J. A quasi-in-situ ebsd study on the formation and development of η-fiber in 0.15 mm ultra-thin fe-4.5 wt. % si sheet. J. Alloys Compd. 2023, 969, 172372. [Google Scholar] [CrossRef]
- Liang, R.-Y.; Yang, P.; Mao, W.-M. Effect of initial goss texture sharpness on texture evolution and magnetic properties of ultra-thin grain-oriented electrical steel. Acta Metall. Sin. (Engl. Lett.) 2017, 30, 895–906. [Google Scholar] [CrossRef]
- Wang, Y.-P.; An, L.-Z.; Song, H.-Y.; Wang, G.-D.; Liu, H.-T. Dependence of recrystallization behavior on initial goss orientation in ultra-thin grain-oriented silicon steels. J. Magn. Magn. Mater. 2020, 499, 166290. [Google Scholar] [CrossRef]
- Meng, L.; Zhang, N.; Zhang, B.; He, C.; Han, Y.; Ma, G.; Chen, X.; Yang, J.; Guo, X.; Zhong, S. Evolution of {0kl} <1 0 0> texture and microstructure in preparation of ultra-thin grain-oriented silicon steel. J. Magn. Magn. Mater. 2021, 523, 167590. [Google Scholar]
- Jain, V.; Modak, P.; Patra, S.; Ghosh, A. Origin of goss texture in grain oriented electrical steel: Role of shear bands. Materialia 2022, 22, 101398. [Google Scholar] [CrossRef]
- Molinari, A.; Canova, G.R.; Ahzi, S. A self consistent approach of the large deformation polycrystal viscoplasticity. Acta Metall. 1987, 35, 2983–2994. [Google Scholar] [CrossRef]
- Lebensohn, R.A.; Tomé, C.N. A self-consistent anisotropic approach for the simulation of plastic deformation and texture development of polycrystals: Application to zirconium alloys. Acta Metall. Mater. 1993, 41, 2611–2624. [Google Scholar] [CrossRef]
- Chen, Q.; Quadir, M.; Duggan, B. Shear band formation in if steel during cold rolling at medium reduction levels. Philos. Mag. 2006, 86, 3633–3646. [Google Scholar] [CrossRef]
- Asaro, R.J.; Rice, J.R. Strain localization in ductile single crystals. J. Mech. Phys. Solids 1977, 25, 309–338. [Google Scholar] [CrossRef]
- Schmid, E.; Boas, W. Plasticity of Crystals with Special Reference to Metals; Hughes: London, UK, 1950. [Google Scholar]
- Kalidindi, S.R.; Anand, L. An approximate procedure for predicting the evolution of crystallographic texture in bulk deformation processing of fcc metals. Int. J. Mech. Sci. 1992, 34, 309–329. [Google Scholar] [CrossRef]
- Kalidindi, S.R.; Bronkhorst, C.A.; Anand, L. Crystallographic texture evolution in bulk deformation processing of fcc metals. J. Mech. Phys. Solids 1992, 40, 537–569. [Google Scholar] [CrossRef]
- Zhou, Y.; Neale, K.W.; Tóth, L.S. A modified model for simulating latent hardening during the plastic deformation of rate-dependent fcc polycrystals. Int. J. Plast. 1993, 9, 961–978. [Google Scholar] [CrossRef]
- Kohsaku, U.; Hutchinson, W.B. Role of shear bands in annealing texture formation in 3%si-fe(111)[112] single crystals. ISIJ Int. 2007, 29, 862–867. [Google Scholar]
- Libovický, S. Two modes of slip systems in iron silicon crystals. Czechoslov. J. Phys. B 1971, 21, 1153–1162. [Google Scholar] [CrossRef]
- Takeuchi, S.; Furubayashi, E.; Taoka, T. Orientation dependence of yield stress in 4.4% silicon iron single crystals. Acta Metall. 1967, 15, 1179–1191. [Google Scholar] [CrossRef]
- Takenaka, M.; Fujita, N.; Hayakawa, Y.; Tsuji, N. Unique effect of carbon addition on development of deformation texture through changes in slip activation and twin deformation in heavily cold-rolled fe-3% si alloys. Acta Mater. 2018, 157, 196–208. [Google Scholar] [CrossRef]
- Klusemann, B.; Svendsen, B.; Vehoff, H. Investigation of the deformation behavior of fe–3%si sheet metal with large grains via crystal plasticity and finite-element modeling. Comput. Mater. Sci. 2012, 52, 25–32. [Google Scholar] [CrossRef]
- Beausir, B.; Fundenberger, J. Analysis Tools for Electron and X-Ray Diffraction; ATEX-Software; Université de Lorraine-Metz: Metz, France, 2017. [Google Scholar]
- Dillamore, I.L.; Roberts, J.G.; Bush, A.C. Occurrence of shear bands in heavily rolled cubic metals. Met. Sci. 1979, 13, 73–77. [Google Scholar] [CrossRef]
- Li, S. Orientation stability in equal channel angular extrusion. Part I: Face-Centered Cubic Body-Centered Cubic materials. Acta Mater. 2008, 56, 1018–1030. [Google Scholar] [CrossRef]
- Chen, X.; Sha, Y.; Chang, S.; Zhang, F.; Zuo, L. Oriented stability and its application in texture control. Philos. Mag. 2020, 100, 3092–3107. [Google Scholar] [CrossRef]
- Toth, L.S.; Gilormini, P.; Jonas, J.J. Effect of rate sensitivity on the stability of torsion textures. Acta Metall. 1988, 36, 3077–3091. [Google Scholar] [CrossRef]
- Park, J.-T.; Szpunar, J.A. Evolution of recrystallization texture in nonoriented electrical steels. Acta Mater. 2003, 51, 3037–3051. [Google Scholar] [CrossRef]
- Xu, Z.; Sha, Y.; He, Z.; Zhang, F.; Liu, W.; Zhang, H.; Zuo, L. Complete goss secondary recrystallization by control of the grain size and texture of primary recrystallization in grain-oriented silicon steel. Materials 2021, 14, 5383. [Google Scholar] [CrossRef] [PubMed]
- Heo, N.H.; Chai, K.H. Correlation between interfacial segregation and surface-energy-induced selective grain growth in 3percent silicon-iron alloy. Acta Mater. 2000, 48, 2901–2910. [Google Scholar] [CrossRef]
- Atake, M.; Barnett, M.; Hutchinson, B.; Ushioda, K. Warm deformation and annealing behaviour of iron–silicon–(carbon) steel sheets. Acta Mater. 2015, 96, 410–419. [Google Scholar] [CrossRef]
Disclaimer/Publisher’s Note: The statements, opinions and data contained in all publications are solely those of the individual author(s) and contributor(s) and not of MDPI and/or the editor(s). MDPI and/or the editor(s) disclaim responsibility for any injury to people or property resulting from any ideas, methods, instructions or products referred to in the content. |
© 2025 by the authors. Licensee MDPI, Basel, Switzerland. This article is an open access article distributed under the terms and conditions of the Creative Commons Attribution (CC BY) license (https://creativecommons.org/licenses/by/4.0/).