
Machine Learning-Assisted Discovery of Empirical Rule for Martensite Transition Temperature of Shape Memory Alloys


Abstract
1. Introduction
2. Methods
3. Results and Discussion
3.1. Dataset
3.2. Feature Engineering
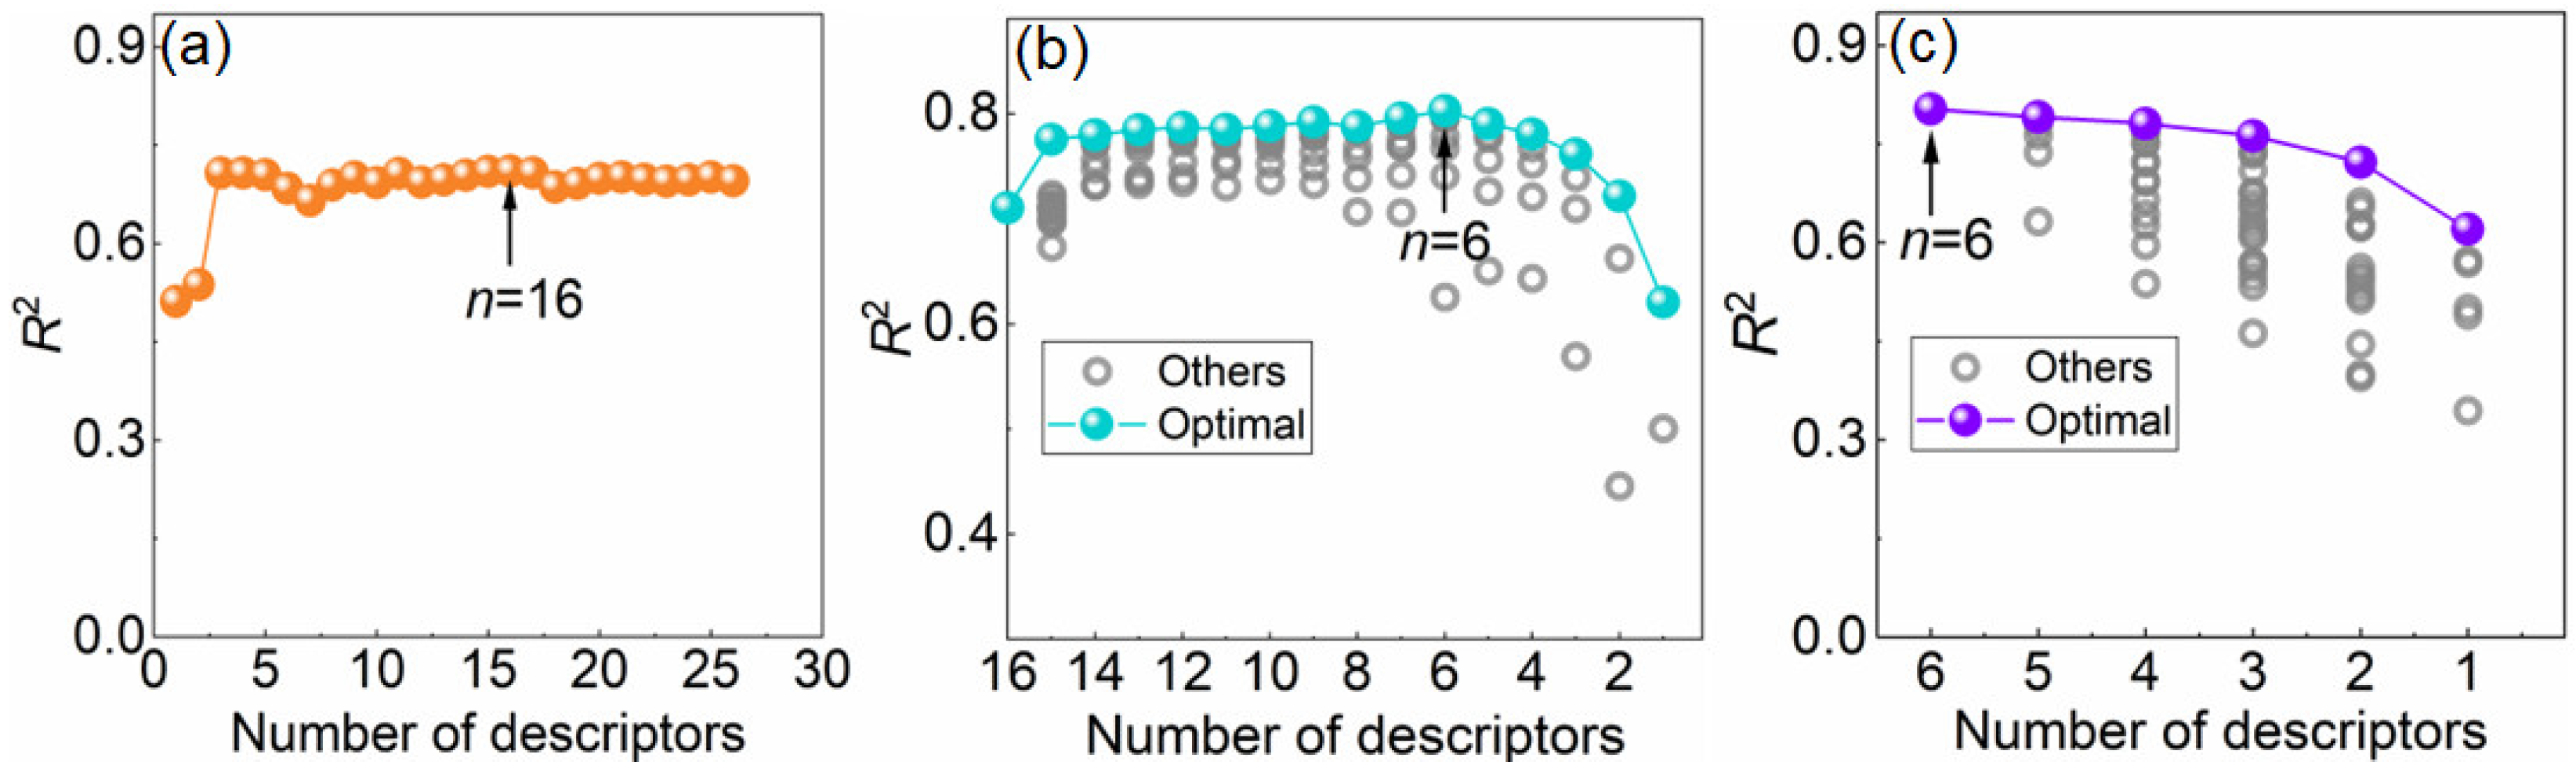
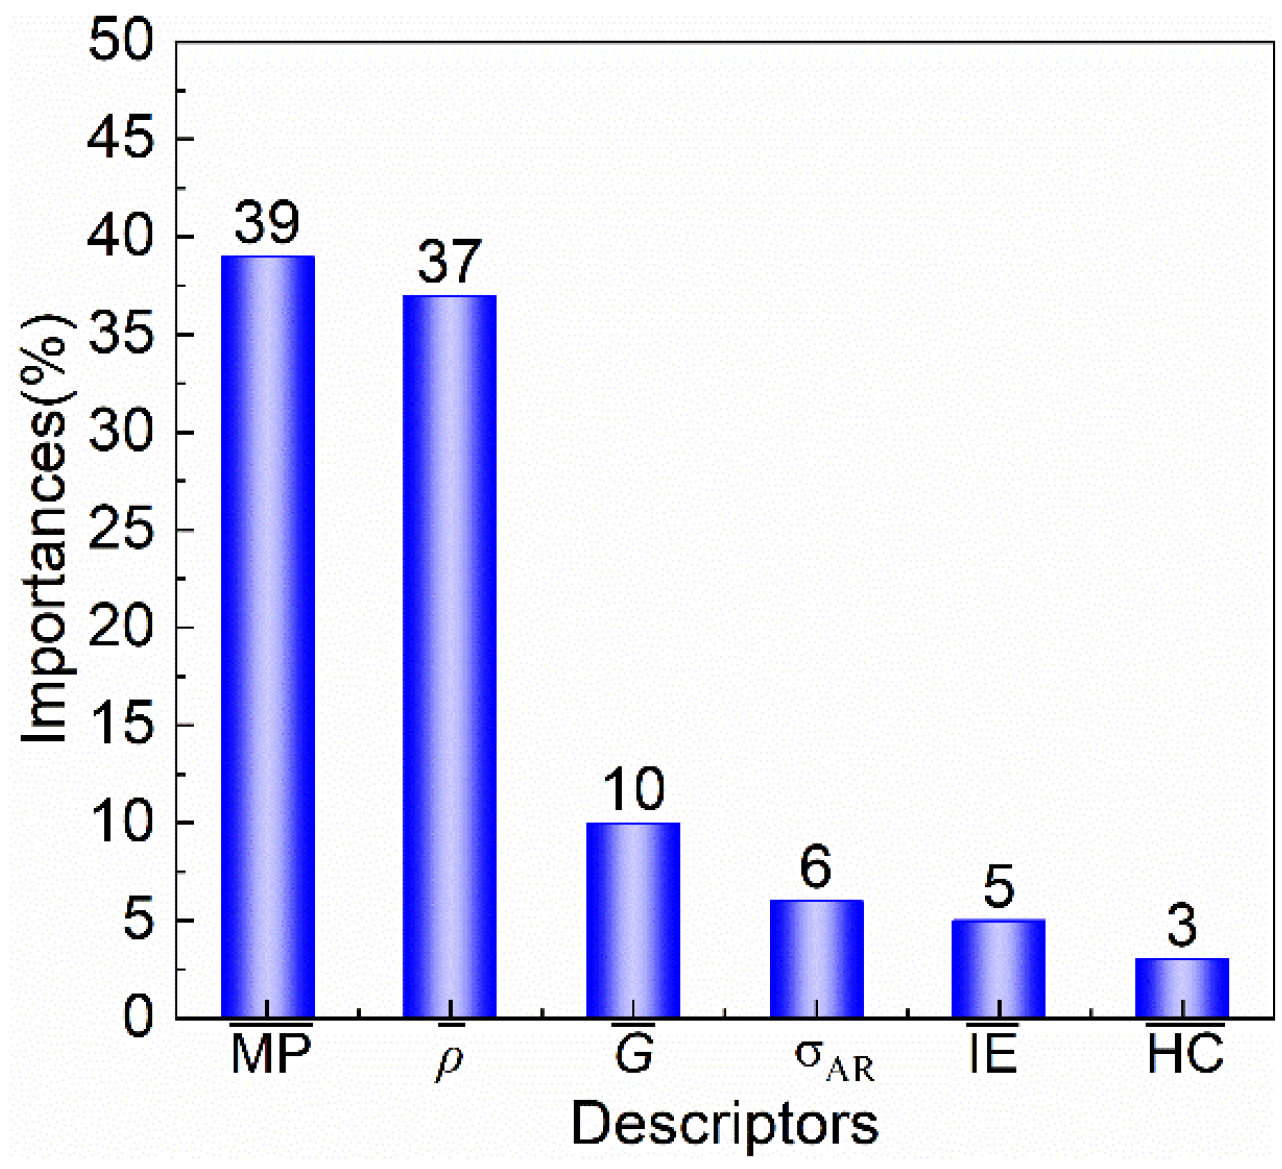
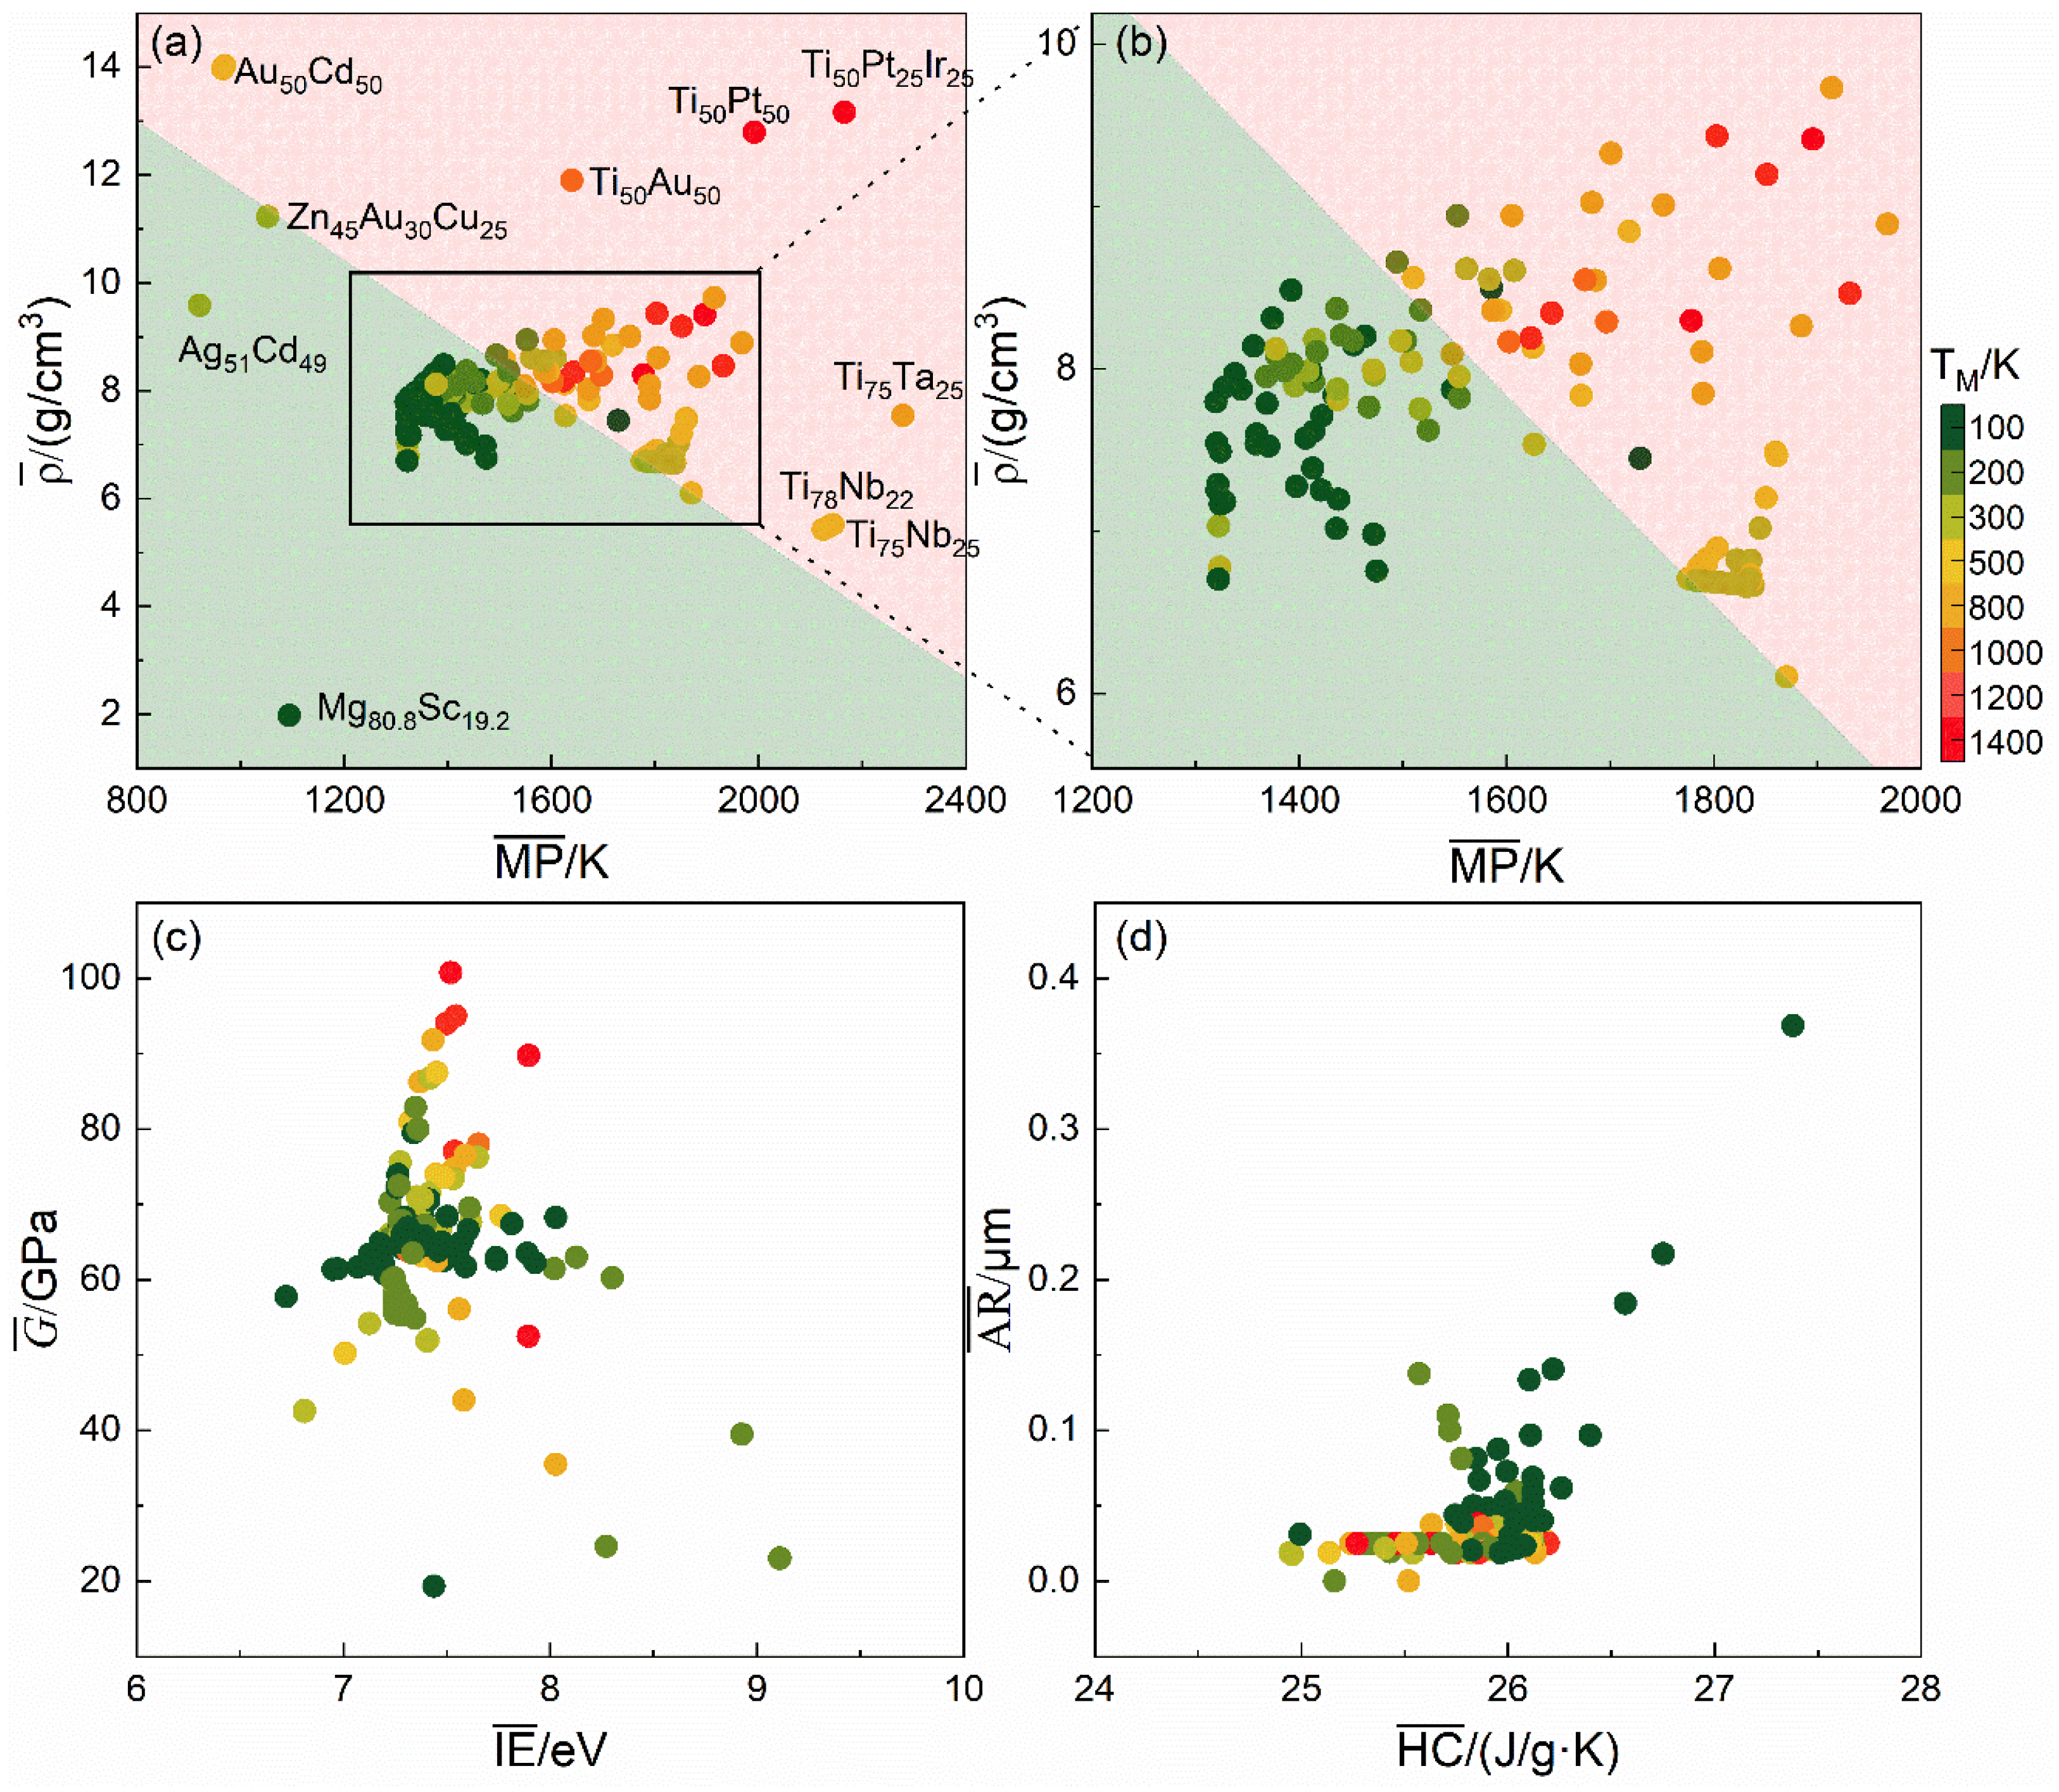
3.3. Screening of Key Features
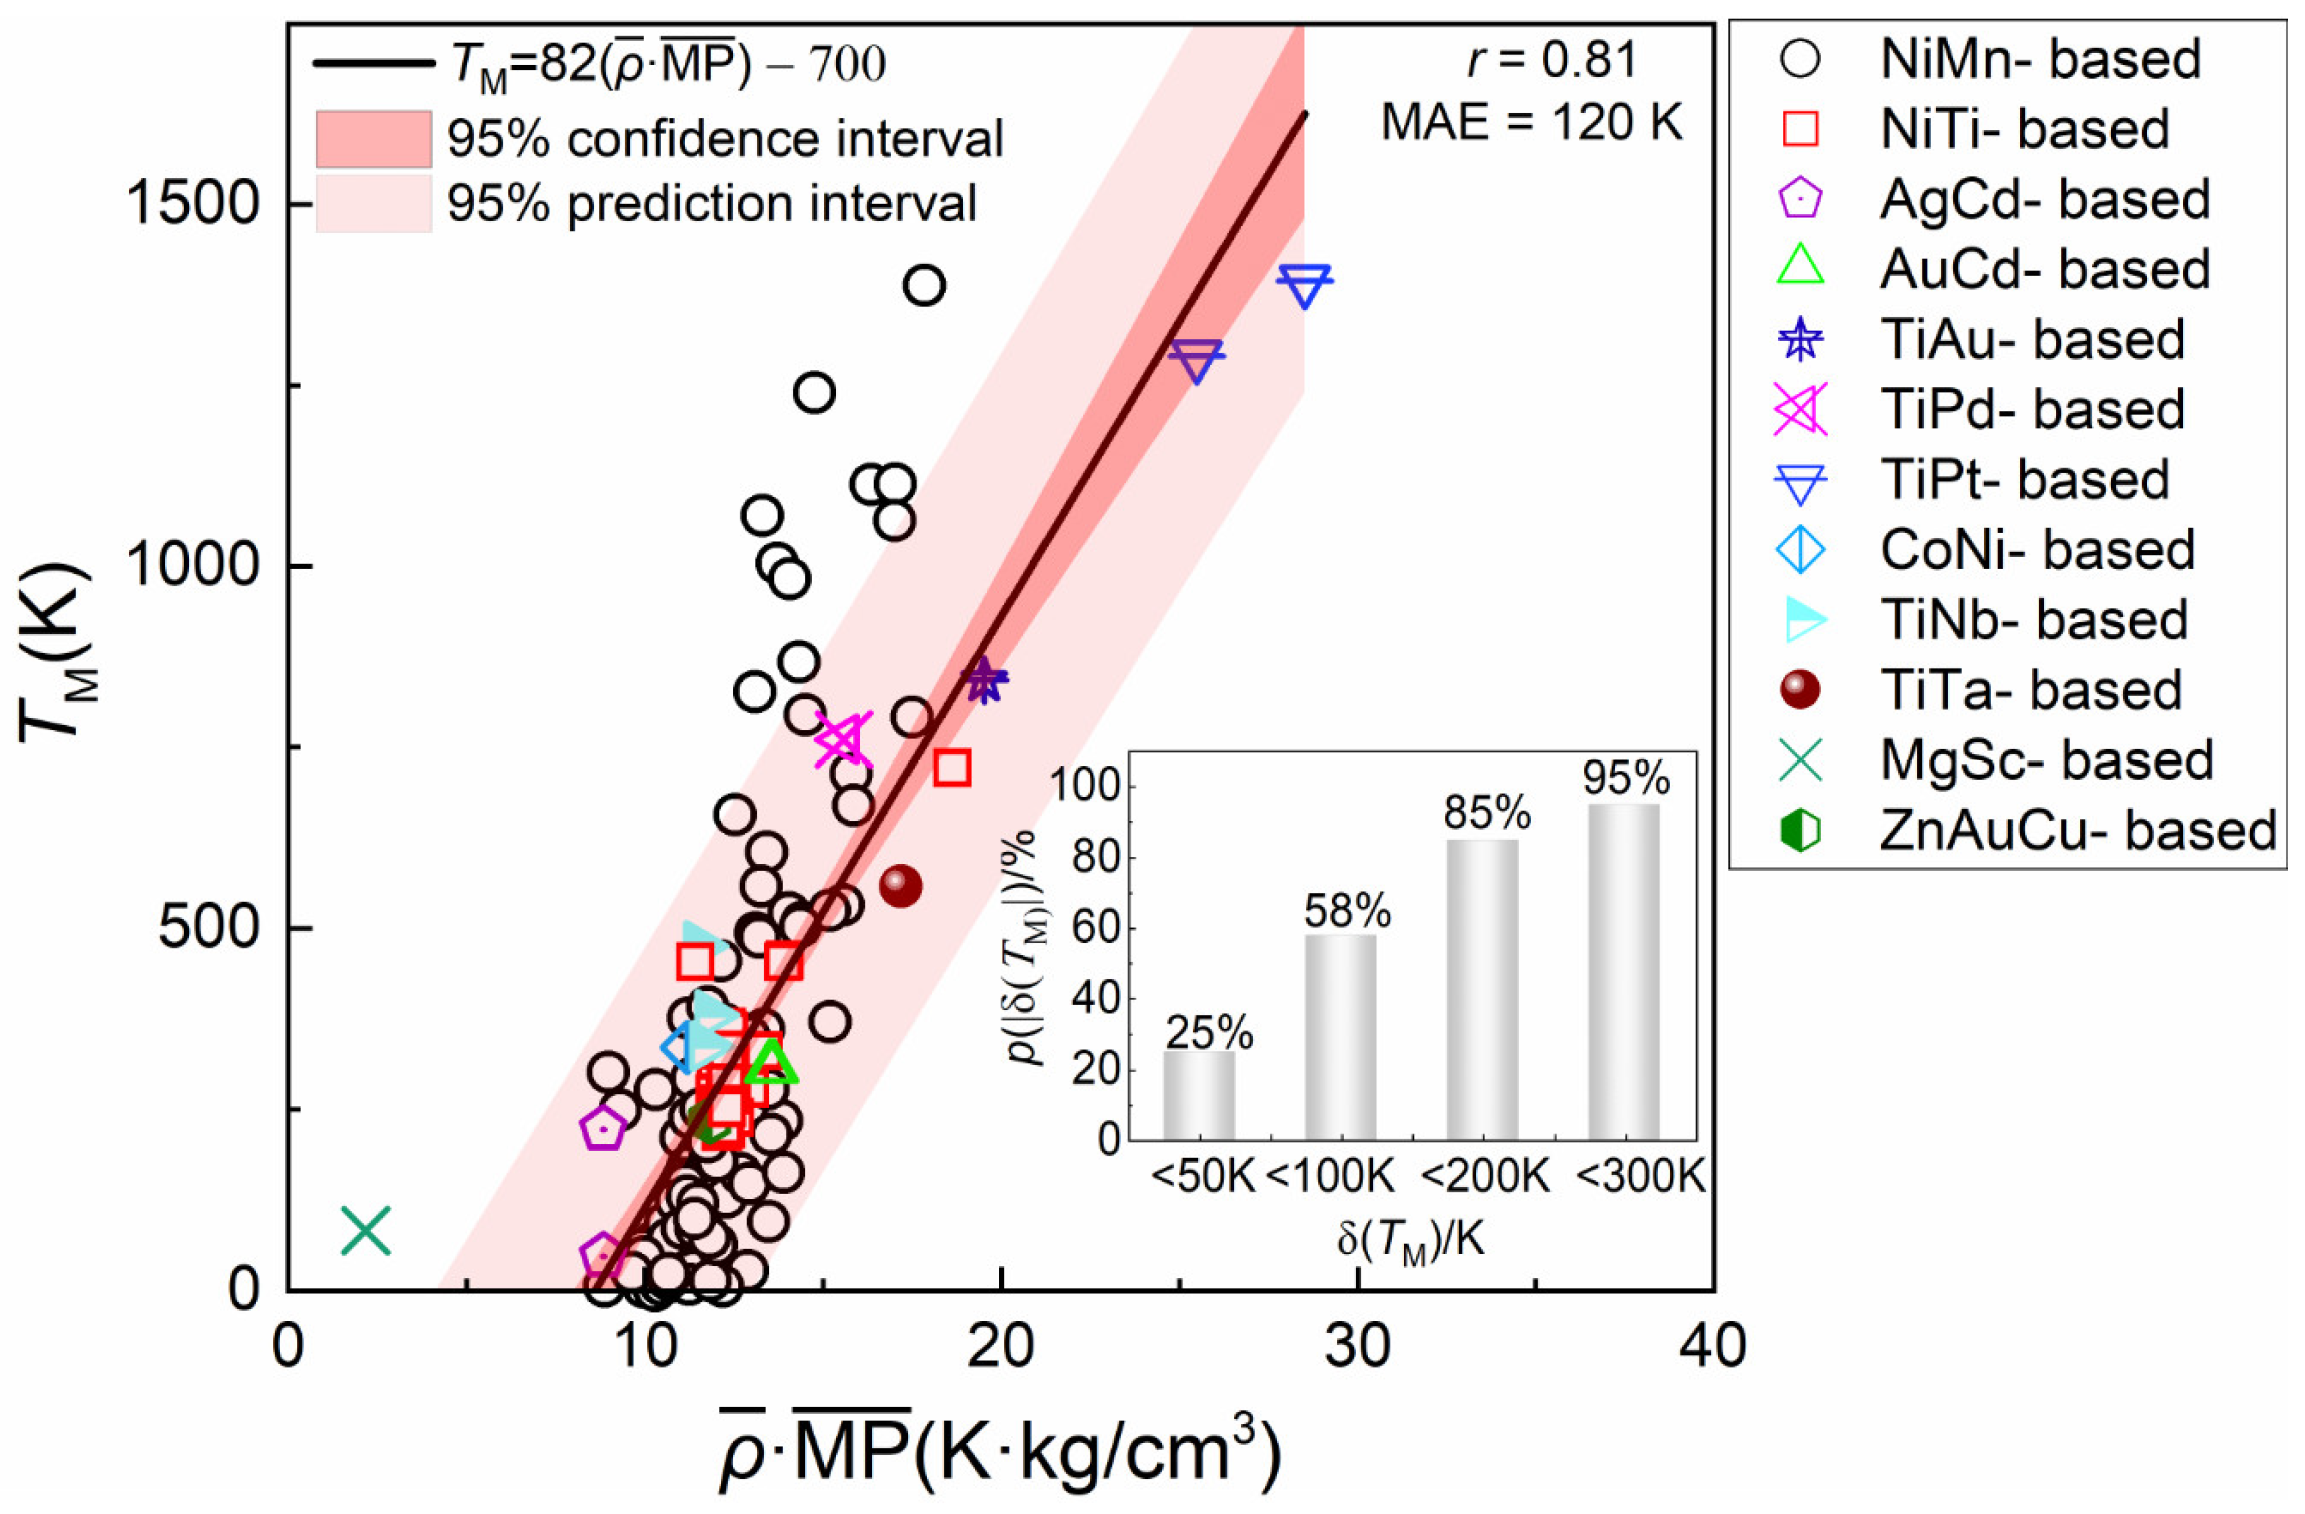
3.4. Linear Relationship Between and TM
4. Conclusions
Author Contributions
Funding
Institutional Review Board Statement
Informed Consent Statement
Data Availability Statement
Conflicts of Interest
Appendix A

| Compositions | TM (K) | Ref. | Compositions | TM (K) | Ref. |
|---|---|---|---|---|---|
| Ti500Ni452Cu10Fe38 | 248 | [14] | Ti500Ni468Cu9Fe20Pd3 | 290 | [14] |
| Ti500Ni444Cu20Fe36 | 239 | [14] | Ti500Ni442Cu19Fe38Pd1 | 243 | [14] |
| Ti500Ni428Cu40Fe32 | 231 | [14] | Ti500Ni467Cu8Fe23Pd2 | 282 | [14] |
| Ti500Ni436Cu30Fe34 | 242 | [14] | Ti500Ni442Cu19Fe39 | 242 | [14] |
| Ti500Ni460Cu0Fe40 | 234 | [14] | Ti500Ni481Cu2Fe15Pd2 | 302 | [14] |
| Ti500Ni445Cu15Fe30Pd10 | 223 | [14] | Ti500Ni445Cu16Fe37Pd2 | 244 | [14] |
| Ti500Ni340Cu130Pd30 | 299 | [14] | Ti500Ni482Cu6Fe9Pd3 | 320 | [14] |
| Ti500Ni340Cu100Pd60 | 303 | [14] | Ti500Ni465Cu11Fe22Pd2 | 284 | [14] |
| Ti500Ni340Cu120Pd40 | 311 | [14] | Ti500Ni483Fe16Pd1 | 302 | [14] |
| Ti500Ni420Cu50Fe30 | 226 | [14] | Ti500Ni490Fe2Pd8 | 358 | [14] |
| Ti500Ni350Cu120Pd30 | 321 | [14] | Ti500Ni486Fe9Pd5 | 332 | [14] |
| Ti500Ni400Pd100 | 279 | [14] | Ti500Ni435Cu20Fe45 | 226 | [14] |
| Ti500Ni340Cu140Pd20 | 319 | [14] | Ti500Ni250Pd250 | 456 | [14] |
| Ti500Ni340Cu160 | 333 | [14] | Ag51Cd49 | 48 | [13] |
| Ti500Ni440Cu10Fe10Pd40 | 239 | [14] | Au505Cd495 | 308 | [13] |
| Ti500Ni340Pd160 | 331 | [14] | Au50Ti50 | 843 | [13] |
| Ti500Ni364Cu120Fe16 | 286 | [14] | Pd50Ti50 | 761 | [13] |
| Ti500Ni412Cu60Fe28 | 220 | [14] | Pt50Ti50 | 1291 | [13] |
| Ti500Ni380Cu100Fe20 | 274 | [14] | Ni50Ti50 | 252 | [13] |
| Ti500Ni348Cu140Fe12 | 271 | [14] | Co50Ni24Ga26 | 336 | [13] |
| Ti500Ni396Cu80Fe24 | 258 | [14] | Ti505Ni245Pd250 | 454 | [13] |
| Ti500Ni500 | 364 | [14] | Ti505Ni245Pt250 | 721 | [13] |
| Ti500Ni440Cu20Fe40 | 220 | [14] | Ti50Pt25Ir25 | 1395 | [13] |
| Ti500Ni445Cu21Fe34 | 248 | [14] | Ni50Mn25Ga25 | 278 | [13] |
| Ti500Ni440Cu23Fe36Pd1 | 241 | [14] | Ti75Nb22 | 476 | [13] |
| Ti500Ni404Cu46Fe10Pd40 | 270 | [14] | Ti75Nb25 | 381 | [13] |
| Ti500Ni457Fe43 | 231 | [14] | Ti75Ta25 | 558 | [13] |
| Ti500Ni458Fe42 | 234 | [14] | Mg81Sc19 | 83 | [13] |
| Ti500Ni428Cu36Fe28Pd8 | 234 | [14] | Ag51Cd49 | 223 | [30] |
| Ti500Ni439Cu21Fe40 | 233 | [14] | Au50Cd50 | 308 | [30] |
| Ti500Ni445Cu17Fe37Pd1 | 245 | [14] | Ti50Au50 | 843 | [30] |
| Ti500Ni457Cu12Fe30Pd1 | 264 | [14] | Zn45Au30Cu25 | 235 | [30] |
| Ti500Ni440Cu23Fe37 | 234 | [14] | Co50Ni24Ga26 | 336 | [30] |
| Ti500Ni451Cu14Fe35 | 248 | [14] | Ti76Nb24 | 338 | [30] |
| Ti500Ni446Cu19Fe34Pd1 | 250 | [14] | Ni50Mn25Ga25 | 278 | [30] |
| Ti500Ni438Cu26Fe36 | 239 | [14] | Ti50Ni50 | 252 | [30] |
| Ti500Ni439Cu15Fe46 | 228 | [14] | Ti50Pd50 | 761 | [30] |
| Ti500Ni445Cu19Fe34Pd2 | 243 | [14] | Ti50Pt50 | 1291 | [30] |
| Ti500Ni460Cu11Fe28Pd1 | 261 | [14] | Ti50.5Ni24.5Pd25 | 454 | [30] |
| Ti500Ni438Cu20Fe41Pd1 | 231 | [14] | Ti50.5Ni24.5Pt25 | 721 | [30] |
| Ti500Ni439Cu20Fe40Pd1 | 232 | [14] | Ti50Pt25Ir25 | 1395 | [30] |
Appendix B
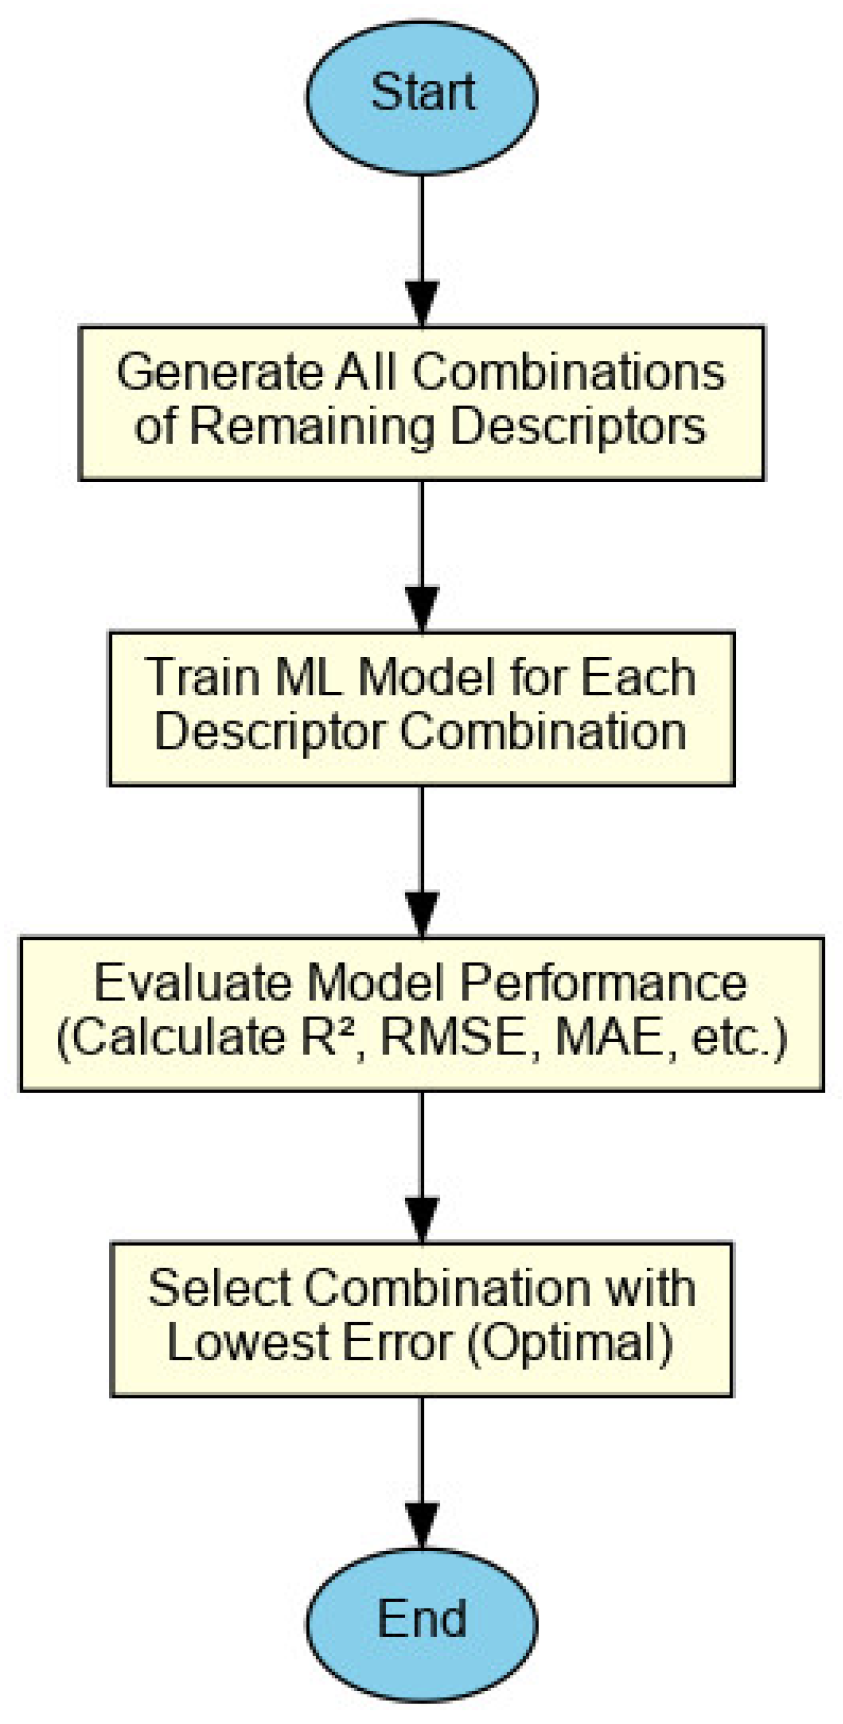
- (i)
- Generate All Combinations of Remaining Descriptors: After eliminating irrelevant features, every possible combination of the remaining descriptors is generated for testing.
- (ii)
- Train ML Model: Each combination of descriptors is used to train a ML model, ensuring a diverse exploration of feature subsets.
- (iii)
- Evaluate Model Performance: The performance of each model is evaluated using standard error metrics like R2, RMSE, and MSE to assess its accuracy.
- (iv)
- Select Optimal Combination: The combination of descriptors that results in the lowest error is chosen as the most significant contributors to the TM prediction.
References
- Adachi, Y.; Kato, M.; Kanomata, T.; Kikuchi, D.; Xu, X.; Umetsu, R.Y.; Kainuma, R.; Ziebeck, K.R.A. The effect of pressure on the magnetic and structural transition temperatures of the shape memory alloys Ni50+x(Mn0.5Fe0.5)25Ga25−x. Phys. B Conden. Matt. 2015, 464, 83–87. [Google Scholar] [CrossRef]
- Chen, H.Y.; Wang, Y.D.; Nie, Z.H.; Li, R.G.; Cong, D.Y.; Liu, W.J.; Ye, F.; Liu, Y.Z.; Cao, P.Y.; Tian, F.Y.; et al. Unprecedented non-hysteretic superelasticity of 001-oriented NiCoFeGa single crystals. Nat. Mater. 2020, 19, 712–718. [Google Scholar] [CrossRef]
- Qu, Y.H.; Cong, D.Y.; Li, S.H.; Gui, W.Y.; Nie, Z.H.; Zhang, M.H.; Ren, Y.; Wang, Y.D. Simultaneously achieved large reversible elastocaloric and magnetocaloric effects and their coupling in a magnetic shape memory alloy. Acta Mater. 2018, 151, 41–55. [Google Scholar] [CrossRef]
- Kumar Pathak, A.; Dubenko, I.; Stadler, S.; Ali, N. The effect of partial substitution of In by Si on the phase transitions and respective magnetic entropy changes of Ni50Mn35In15 Heusler alloy. J. Phys. D Appl. Phys. 2008, 41, 202004. [Google Scholar] [CrossRef]
- Ghosh, S.; Ghosh, S. Role of composition, site ordering, and magnetic structure for the structural stability of off-stoichiometric Ni2MnSb alloys with excess Ni and Mn. Phys. Rev. B 2019, 99, 064112. [Google Scholar] [CrossRef]
- Huang, X.-M.; Wang, L.-D.; Liu, H.-X.; Yan, H.-L.; Jia, N.; Yang, B.; Li, Z.-B.; Zhang, Y.-D.; Esling, C.; Zhao, X.; et al. Correlation between microstructure and martensitic transformation, mechanical properties and elastocaloric effect in Ni–Mn-based alloys. Intermetallics 2019, 113, 106579. [Google Scholar] [CrossRef]
- Unzueta, I.; de R-Lorente, D.A.; Cesari, E.; Sánchez-Alarcos, V.; Recarte, V.; Pérez-Landazábal, J.I.; García, J.A.; Plazaola, F. Experimental observation of vacancy-assisted martensitic transformation shift in Ni-Fe-Ga Alloys. Phys. Rev. Lett. 2019, 122, 165701. [Google Scholar] [CrossRef] [PubMed]
- Sutou, Y.; Imano, Y.; Koeda, N.; Omori, T.; Kainuma, R.; Ishida, K.; Oikawa, K. Magnetic and martensitic transformations of NiMnX(X = In,Sn,Sb) ferromagnetic shape memory alloys. Appl. Phys. Lett. 2004, 85, 4358–4360. [Google Scholar] [CrossRef]
- Zayak, A.T.; Adeagbo, W.A.; Entel, P.; Rabe, K.M. e/a dependence of the lattice instability of cubic Heusler alloys from first principles. Appl. Phys. Lett. 2006, 88, 111903. [Google Scholar] [CrossRef]
- Tan, C.; Tai, Z.; Zhang, K.; Tian, X.; Cai, W. Simultaneous enhancement of magnetic and mechanical properties in Ni-Mn-Sn alloy by Fe doping. Sci. Rep. 2017, 7, 43387. [Google Scholar] [CrossRef]
- Jiang, C.; Feng, G.; Gong, S.; Xu, H. Effect of Ni excess on phase transformation temperatures of NiMnGa alloys. Mater. Sci. Eng. A 2003, 342, 231–235. [Google Scholar] [CrossRef]
- Chernenko, V.A.; Cesari, E.; Kokorin, V.V.; Vitenko, I.N. The development of new ferromagnetic shape memory alloys in Ni-Mn-Ga system. Scr. Metall. Mater. 1995, 33, 1239–1244. [Google Scholar] [CrossRef]
- Li, W.; Zhao, C. Microstructure and Phase Transformation Analysis of Ni50−xTi50Lax Shape Memory Alloys. Crystals 2018, 8, 345. [Google Scholar] [CrossRef]
- Yang, X.; Ma, L.; Shang, J. Martensitic transformation of Ti50(Ni50−xCux) and Ni50(Ti50−xZrx) shape-memory alloys. Sci. Rep. 2019, 9, 3221. [Google Scholar] [CrossRef]
- Kim, H.Y.; Hashimoto, S.; Kim, J.I.; Hosoda, H.; Miyazaki, S. Mechanical Properties and Shape Memory Behavior of Ti-Nb Alloys. Mater. Trans. 2004, 45, 2443–2448. [Google Scholar] [CrossRef]
- Fang, H.; Xu, X.; Zhang, H.; Sun, Q.; Sun, J. Alloying Effect on Transformation Strain and Martensitic Transformation Temperature of Ti-Based Alloys from Ab Initio Calculations. Materials 2023, 16, 6069. [Google Scholar] [CrossRef]
- Minami, D.; Uesugi, T.; Takigawa, Y.; Higashi, K. Artificial neural network assisted by first-principles calculations for predicting transformation temperatures in shape memory alloys. Int. J. Mod. Phys. B 2019, 33, 1950055. [Google Scholar] [CrossRef]
- Xue, D.Z.; Xue, D.Q.; Yuan, R.H.; Zhou, Y.M.; Balachandran, P.V.; Ding, X.D.; Sun, J.; Lookman, T. An informatics approach to transformation temperatures of NiTi-based shape memory alloys. Acta Mater. 2017, 125, 532–541. [Google Scholar] [CrossRef]
- Trehern, W.; Ortiz-Ayala, R.; Atli, K.C.; Arroyave, R.; Karaman, I. Data-driven shape memory alloy discovery using Artificial Intelligence Materials Selection (AIMS) framework. Acta Mater. 2022, 228, 117751. [Google Scholar] [CrossRef]
- Pei, Z.; Yin, J.; Hawk, J.A.; Alman, D.E.; Gao, M.C. Machine-learning informed prediction of high-entropy solid solution formation: Beyond the Hume-Rothery rules. NPJ Comput. Mater. 2020, 6, 50. [Google Scholar] [CrossRef]
- Zhang, H.; Fu, H.; He, X.; Wang, C.; Jiang, L.; Chen, L.-Q.; Xie, J. Dramatically enhanced combination of ultimate tensile strength and electric conductivity of alloys via machine learning screening. Acta Mater. 2020, 200, 803–810. [Google Scholar] [CrossRef]
- Liu, H.-X.; Yan, H.-L.; Jia, N.; Tang, S.; Cong, D.; Yang, B.; Li, Z.; Zhang, Y.; Esling, C.; Zhao, X.; et al. Machine learning informed tetragonal ratio c/a of martensite. Comp. Mater. Sci. 2023, 233, 112735. [Google Scholar] [CrossRef]
- Breiman, L. Random forests. Mach. Learn. 2001, 45, 5–32. [Google Scholar] [CrossRef]
- Singh, K.; Xie, M. Bootstrap method. In International Encyclopedia of Education; Peterson, P., Baker, E., McGaw, B., Eds.; Elsevier: Oxford, UK, 2010; pp. 46–51. [Google Scholar]
- Ward, L.; Agrawal, A.; Choudhary, A.; Wolverton, C. A general-purpose machine learning framework for predicting properties of inorganic materials. NPJ Comput. Mater. 2016, 2, 16028. [Google Scholar] [CrossRef]
- Pearson, K.; Galton, F. VII. Note on regression and inheritance in the case of two parents. Proc. R. Soc. Lond. 1895, 58, 240–242. [Google Scholar]
- Hoque, N.; Bhattacharyya, D.K.; Kalita, J.K. MIFS-ND: A mutual information-based feature selection method. Expert Syst. Appl. 2014, 41, 6371–6385. [Google Scholar] [CrossRef]
- Kraskov, A.; Stögbauer, H.; Grassberger, P. Estimating mutual information. Phys. Rev. E 2004, 69, 066138. [Google Scholar] [CrossRef] [PubMed]
- Guyon, I.; Weston, J.; Barnhill, S.; Vapnik, V. Gene selection for cancer classification using support vector machines. Mach. Learn. 2002, 46, 389–422. [Google Scholar] [CrossRef]
- Blöchl, P.E. Projector augmented-wave method. Phys. Rev. B 1994, 50, 17953–17979. [Google Scholar] [CrossRef]
- Hafner, J. Ab-initio simulations of materials using VASP: Density-functional theory and beyond. J. Comput. Chem. 2008, 29, 2044–2078. [Google Scholar] [CrossRef]
- Perdew, J.P.; Burke, K.; Ernzerhof, M. Generalized gradient approximation made simple. Phys. Rev. Lett. 1996, 77, 3865–3868. [Google Scholar] [CrossRef] [PubMed]
- Kresse, G.; Furthmuller, J. Efficient iterative schemes for ab initio total-energy calculations using a plane-wave basis set. Phys. Rev. B 1996, 54, 11169–11186. [Google Scholar] [CrossRef]
- Monkhorst, H.J.; Pack, J.D. Special points for Brillouin-zone integrations. Phys. Rev. B 1976, 13, 5188–5192. [Google Scholar] [CrossRef]
- Lee, J.; Ikeda, Y.; Tanaka, I. First-principles screening of structural properties of intermetallic compounds on martensitic transformation. NPJ Comput. Mater. 2017, 3, 52. [Google Scholar] [CrossRef]
- Entel, P.; Gruner, M.E.; Comtesse, D.; Wuttig, M. Interaction of phase transformation and magnetic properties of Heusler alloys: A density functional theory study. Jom 2013, 65, 1540–1549. [Google Scholar] [CrossRef]
- Schröter, M.; Herper, H.C.; Grünebohm, A. Tuning the magnetic phase diagram of Ni-Mn-Ga by Cr and Co substitution. J. Phys. D Appl. Phys. 2021, 55, 025002. [Google Scholar] [CrossRef]
- Sun, L.F.; He, Z.F.; Jia, N.; Guo, Y.X.; Jiang, S.; Yang, Y.L.; Liu, Y.X.; Guan, X.J.; Shen, Y.F.; Yan, H.L.; et al. Local chemical order enables an ultrastrong and ductile high-entropy alloy in a cryogenic environment. Sci. Adv. 2024, 10, eadq6398. [Google Scholar] [CrossRef]
- He, Z.F.; Guo, Y.X.; Sun, L.F.; Yan, H.L.; Guan, X.J.; Jiang, S.; Shen, Y.F.; Yin, W.; Zhao, X.L.; Li, Z.M.; et al. Interstitial-driven local chemical order enables ultrastrong face-centered cubic multicomponent alloys. Acta Mater. 2023, 243, 118495. [Google Scholar] [CrossRef]
- Zhao, Y.; Yan, H.L.; Xiang, H.Y.; Jia, N.; Yang, B.; Li, Z.; Zhang, Y.; Esling, C.; Zhao, X.; Zuo, L. Valence electron concentration and ferromagnetism govern precipitation in NiFeGa magnetic shape memory alloys. Acta Mater. 2024, 264, 119592. [Google Scholar] [CrossRef]
- Perez-Checa, A.; Feuchtwanger, J.; Barandiaran, J.M.; Sozinov, A.; Ullakko, K.; Chernenko, V.A. Ni-Mn-Ga-(Co, Fe, Cu) high temperature ferromagnetic shape memory alloys: Effect of Mn and Ga replacement by Cu. Scrip. Mater. 2018, 154, 131–133. [Google Scholar] [CrossRef]
- Lu, Y.; Yu, H.X.; Sisson, R.D. The effect of carbon content on the c/a ratio of as-quenched martensite in Fe-C alloys. Mater. Sci. Eng. A 2017, 700, 592–597. [Google Scholar] [CrossRef]
- Yan, H.-L.; Liu, H.-X.; Zhao, Y.; Jia, N.; Bai, J.; Yang, B.; Li, Z.; Zhang, Y.; Esling, C.; Zhao, X.; et al. Impact of B alloying on ductility and phase transition in the Ni–Mn-based magnetic shape memory alloys: Insights from first-principles calculation. J. Mater. Sci. Technol. 2021, 74, 27–34. [Google Scholar] [CrossRef]
- Yan, H.-L.; Wang, L.-D.; Liu, H.-X.; Huang, X.-M.; Jia, N.; Li, Z.-B.; Yang, B.; Zhang, Y.-D.; Esling, C.; Zhao, X.; et al. Giant elastocaloric effect and exceptional mechanical properties in an all-d-metal Ni–Mn–Ti alloy: Experimental and ab-initio studies. Mater. Des. 2019, 184, 108180. [Google Scholar] [CrossRef]
- Ong, S.P.; Cholia, S.; Jain, A.; Brafman, M.; Gunter, D.; Ceder, G.; Persson, K.A. The materials application programming interface (API): A simple, flexible and efficient API for materials data based on representational state transfer (REST) principles. Comput. Mater. Sci. 2015, 97, 209–215. [Google Scholar] [CrossRef]
- gplearn: Genetic Programming in Python. Available online: https://github.com/trevorstephens/gplearn (accessed on 9 May 2025).
| Feature Category | Feature Description | Abbreviation |
|---|---|---|
| Elemental properties | Atomic number | Z |
| Periodic table column | C | |
| Atomic weight | AW | |
| Mendeleev number | MN | |
| Periodic table row | PR | |
| Atomic radius | AR | |
| Number of s valence electrons | Ns | |
| Number of p valence electrons | Np | |
| Number of d valence electrons | Nd | |
| Number of f valence electrons | Nf | |
| Number of total valence electrons | Nt | |
| Number of unfilled s states | Us | |
| Number of unfilled p states | Up | |
| Number of unfilled d states | Ud | |
| Number of unfilled f states | Uf | |
| Number of total unfilled states | Ut | |
| Simple substance properties | Melting point | MP |
| Boiling point | BP | |
| Heat capacity | HC | |
| Heat fusion | HF | |
| Pauling Electronegativity | EN | |
| Covalent radius | CR | |
| Ionic radius | IR | |
| Density | ||
| Magnetic moment | M | |
| Volume | V | |
| Band gap | Gap | |
| First ionization energy | E | |
| Space group number | SG | |
| Bulk modulus | B | |
| Shear modulus | G | |
| Phase stability properties | Mixing entropy | |
| Atomic size difference |
| Descriptors (Abbr.) | Descriptors (Abbr.) | |||
|---|---|---|---|---|
| Univariate screening | Standard deviation of melting point (σMP) | Weight-average value of p valence electron (p) | ||
| Weight-average value of valence electron () | Weight-average value of s valence electron (s) | |||
| Weight-average value magnetic moment () | Weight-average value of bulk modulus () | |||
| Standard deviation of Mendeleev number (σMN) | Standard deviation of heat fusion (σHF) | |||
| Standard deviation of valence electron (VEsd) | Standard deviation of s valence electron (σVEs) | |||
| Recursive elimination screening | Exhaustive screening | Weight-average value of melting point () | Standard deviation of atomic radius (σAR) | |
| Weight-average value of ionization energy () | Weight-average value of shear modulus () | |||
| Weight-average value of heat capacity () | Weight-average value of density () | |||
Disclaimer/Publisher’s Note: The statements, opinions and data contained in all publications are solely those of the individual author(s) and contributor(s) and not of MDPI and/or the editor(s). MDPI and/or the editor(s) disclaim responsibility for any injury to people or property resulting from any ideas, methods, instructions or products referred to in the content. |
© 2025 by the authors. Licensee MDPI, Basel, Switzerland. This article is an open access article distributed under the terms and conditions of the Creative Commons Attribution (CC BY) license (https://creativecommons.org/licenses/by/4.0/).
Share and Cite
Liu, H.-X.; Yan, H.-L.; Jia, N.; Yang, B.; Li, Z.; Zhao, X.; Zuo, L. Machine Learning-Assisted Discovery of Empirical Rule for Martensite Transition Temperature of Shape Memory Alloys. Materials 2025, 18, 2226. https://doi.org/10.3390/ma18102226
Liu H-X, Yan H-L, Jia N, Yang B, Li Z, Zhao X, Zuo L. Machine Learning-Assisted Discovery of Empirical Rule for Martensite Transition Temperature of Shape Memory Alloys. Materials. 2025; 18(10):2226. https://doi.org/10.3390/ma18102226
Chicago/Turabian StyleLiu, Hao-Xuan, Hai-Le Yan, Nan Jia, Bo Yang, Zongbin Li, Xiang Zhao, and Liang Zuo. 2025. "Machine Learning-Assisted Discovery of Empirical Rule for Martensite Transition Temperature of Shape Memory Alloys" Materials 18, no. 10: 2226. https://doi.org/10.3390/ma18102226
APA StyleLiu, H.-X., Yan, H.-L., Jia, N., Yang, B., Li, Z., Zhao, X., & Zuo, L. (2025). Machine Learning-Assisted Discovery of Empirical Rule for Martensite Transition Temperature of Shape Memory Alloys. Materials, 18(10), 2226. https://doi.org/10.3390/ma18102226