
Optimum Mix of Tunneling Coal Gangue as a Highway Base Material Through Delphi–Entropy Weight–TOPSIS and Microstructure Analysis


 ,
,
Abstract
1. Introduction
2. Materials and Methods
2.1. Materials
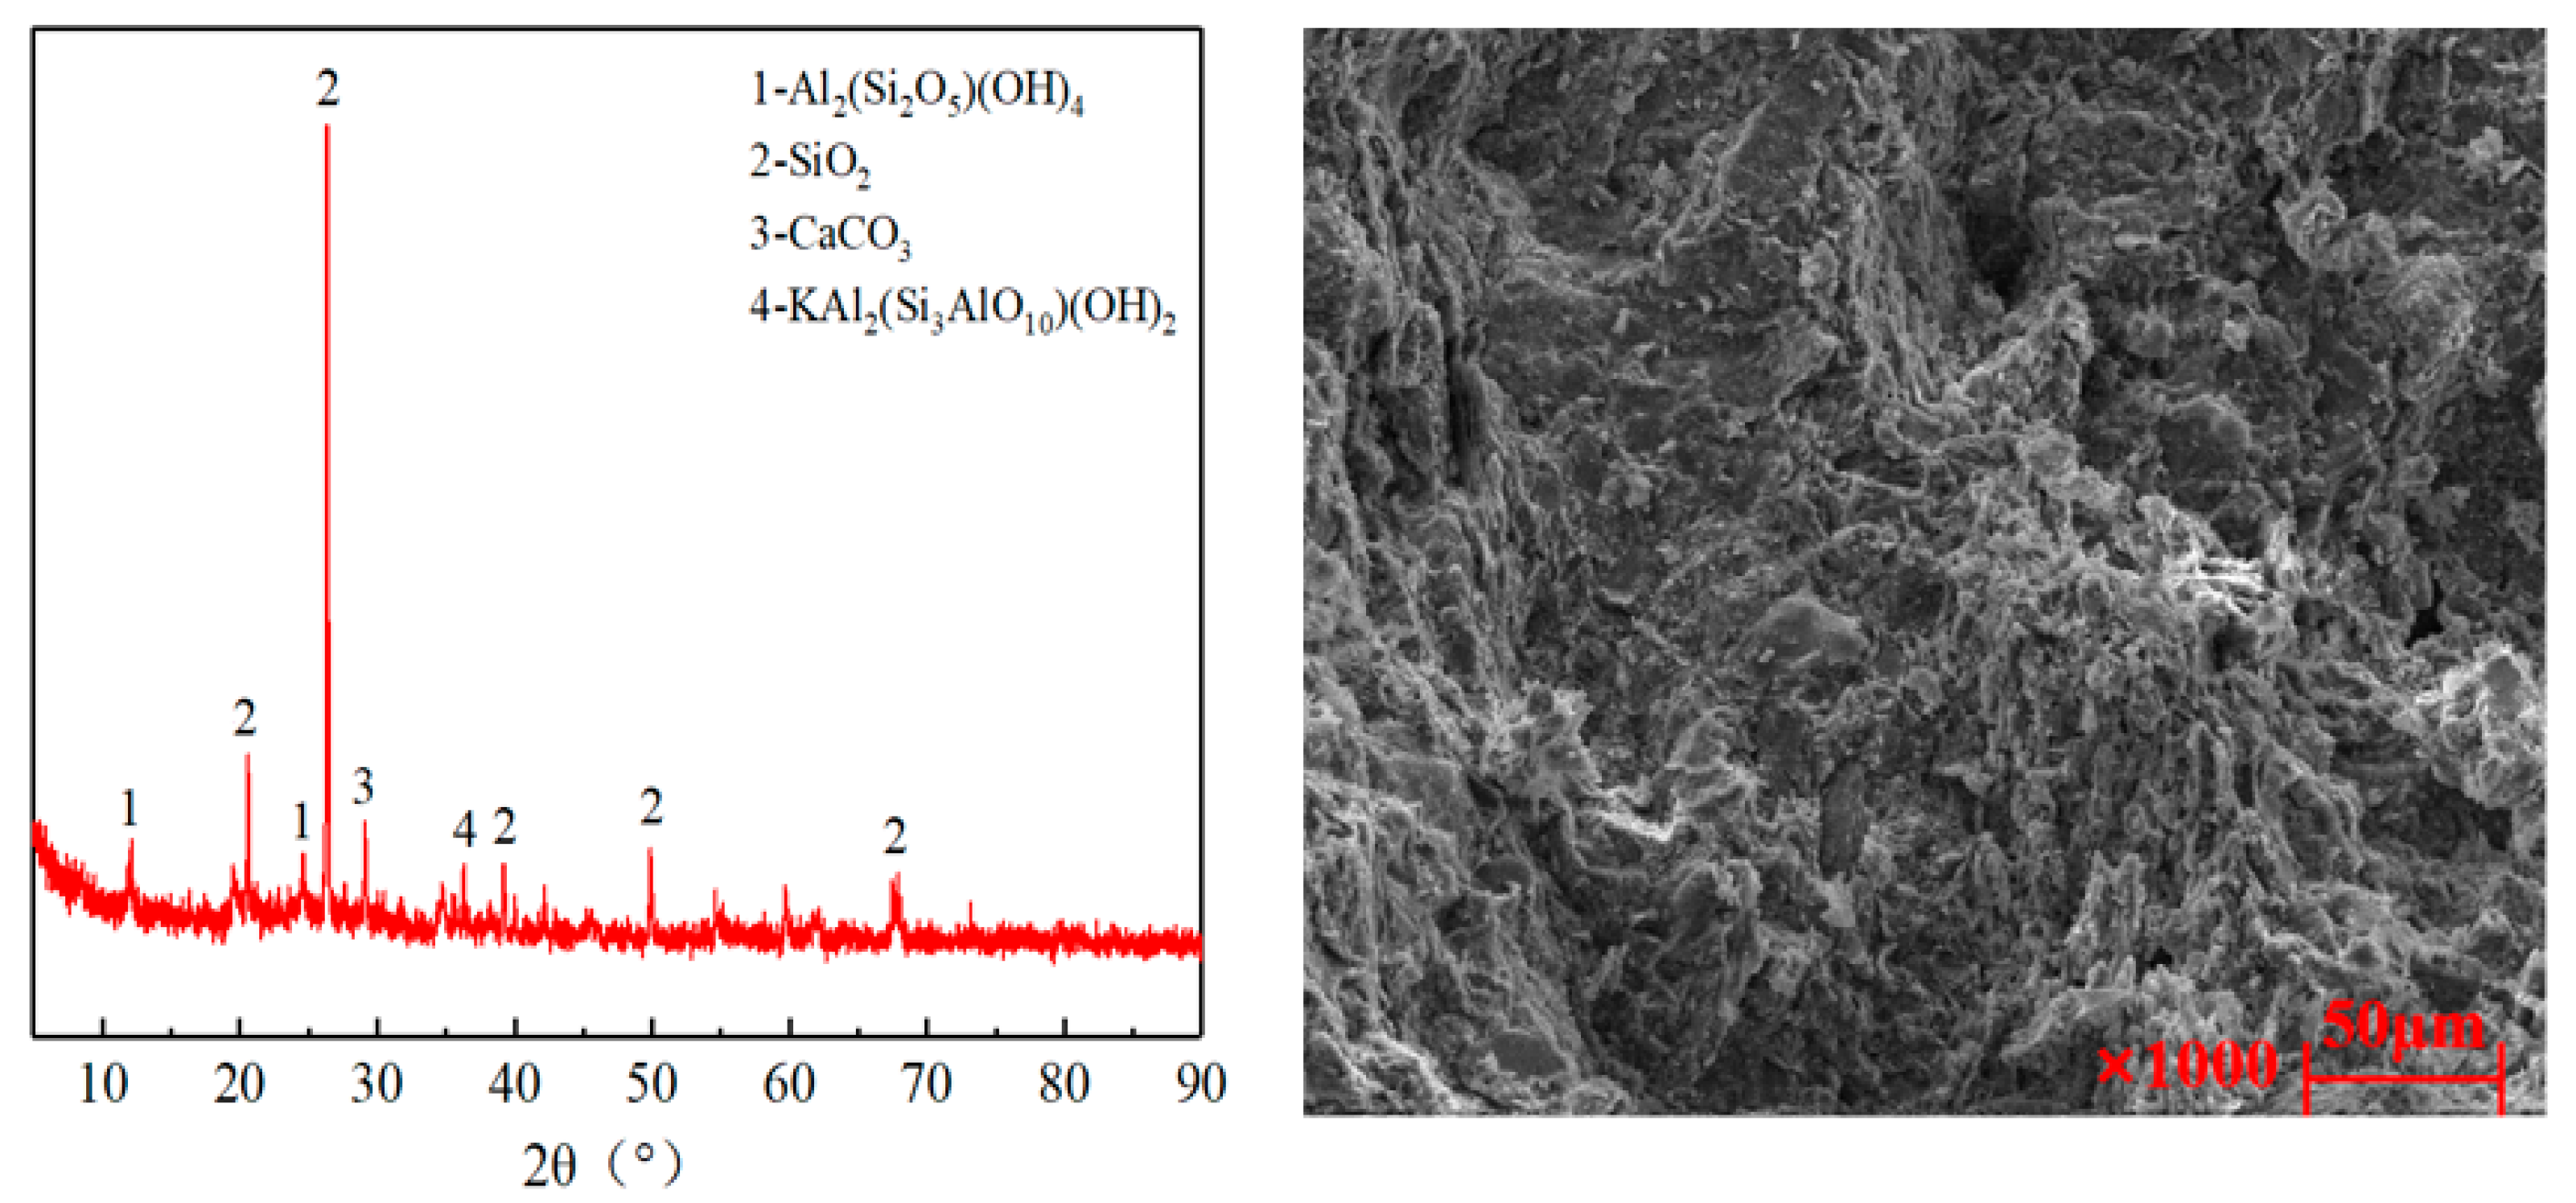
2.1.1. Coal Gangue
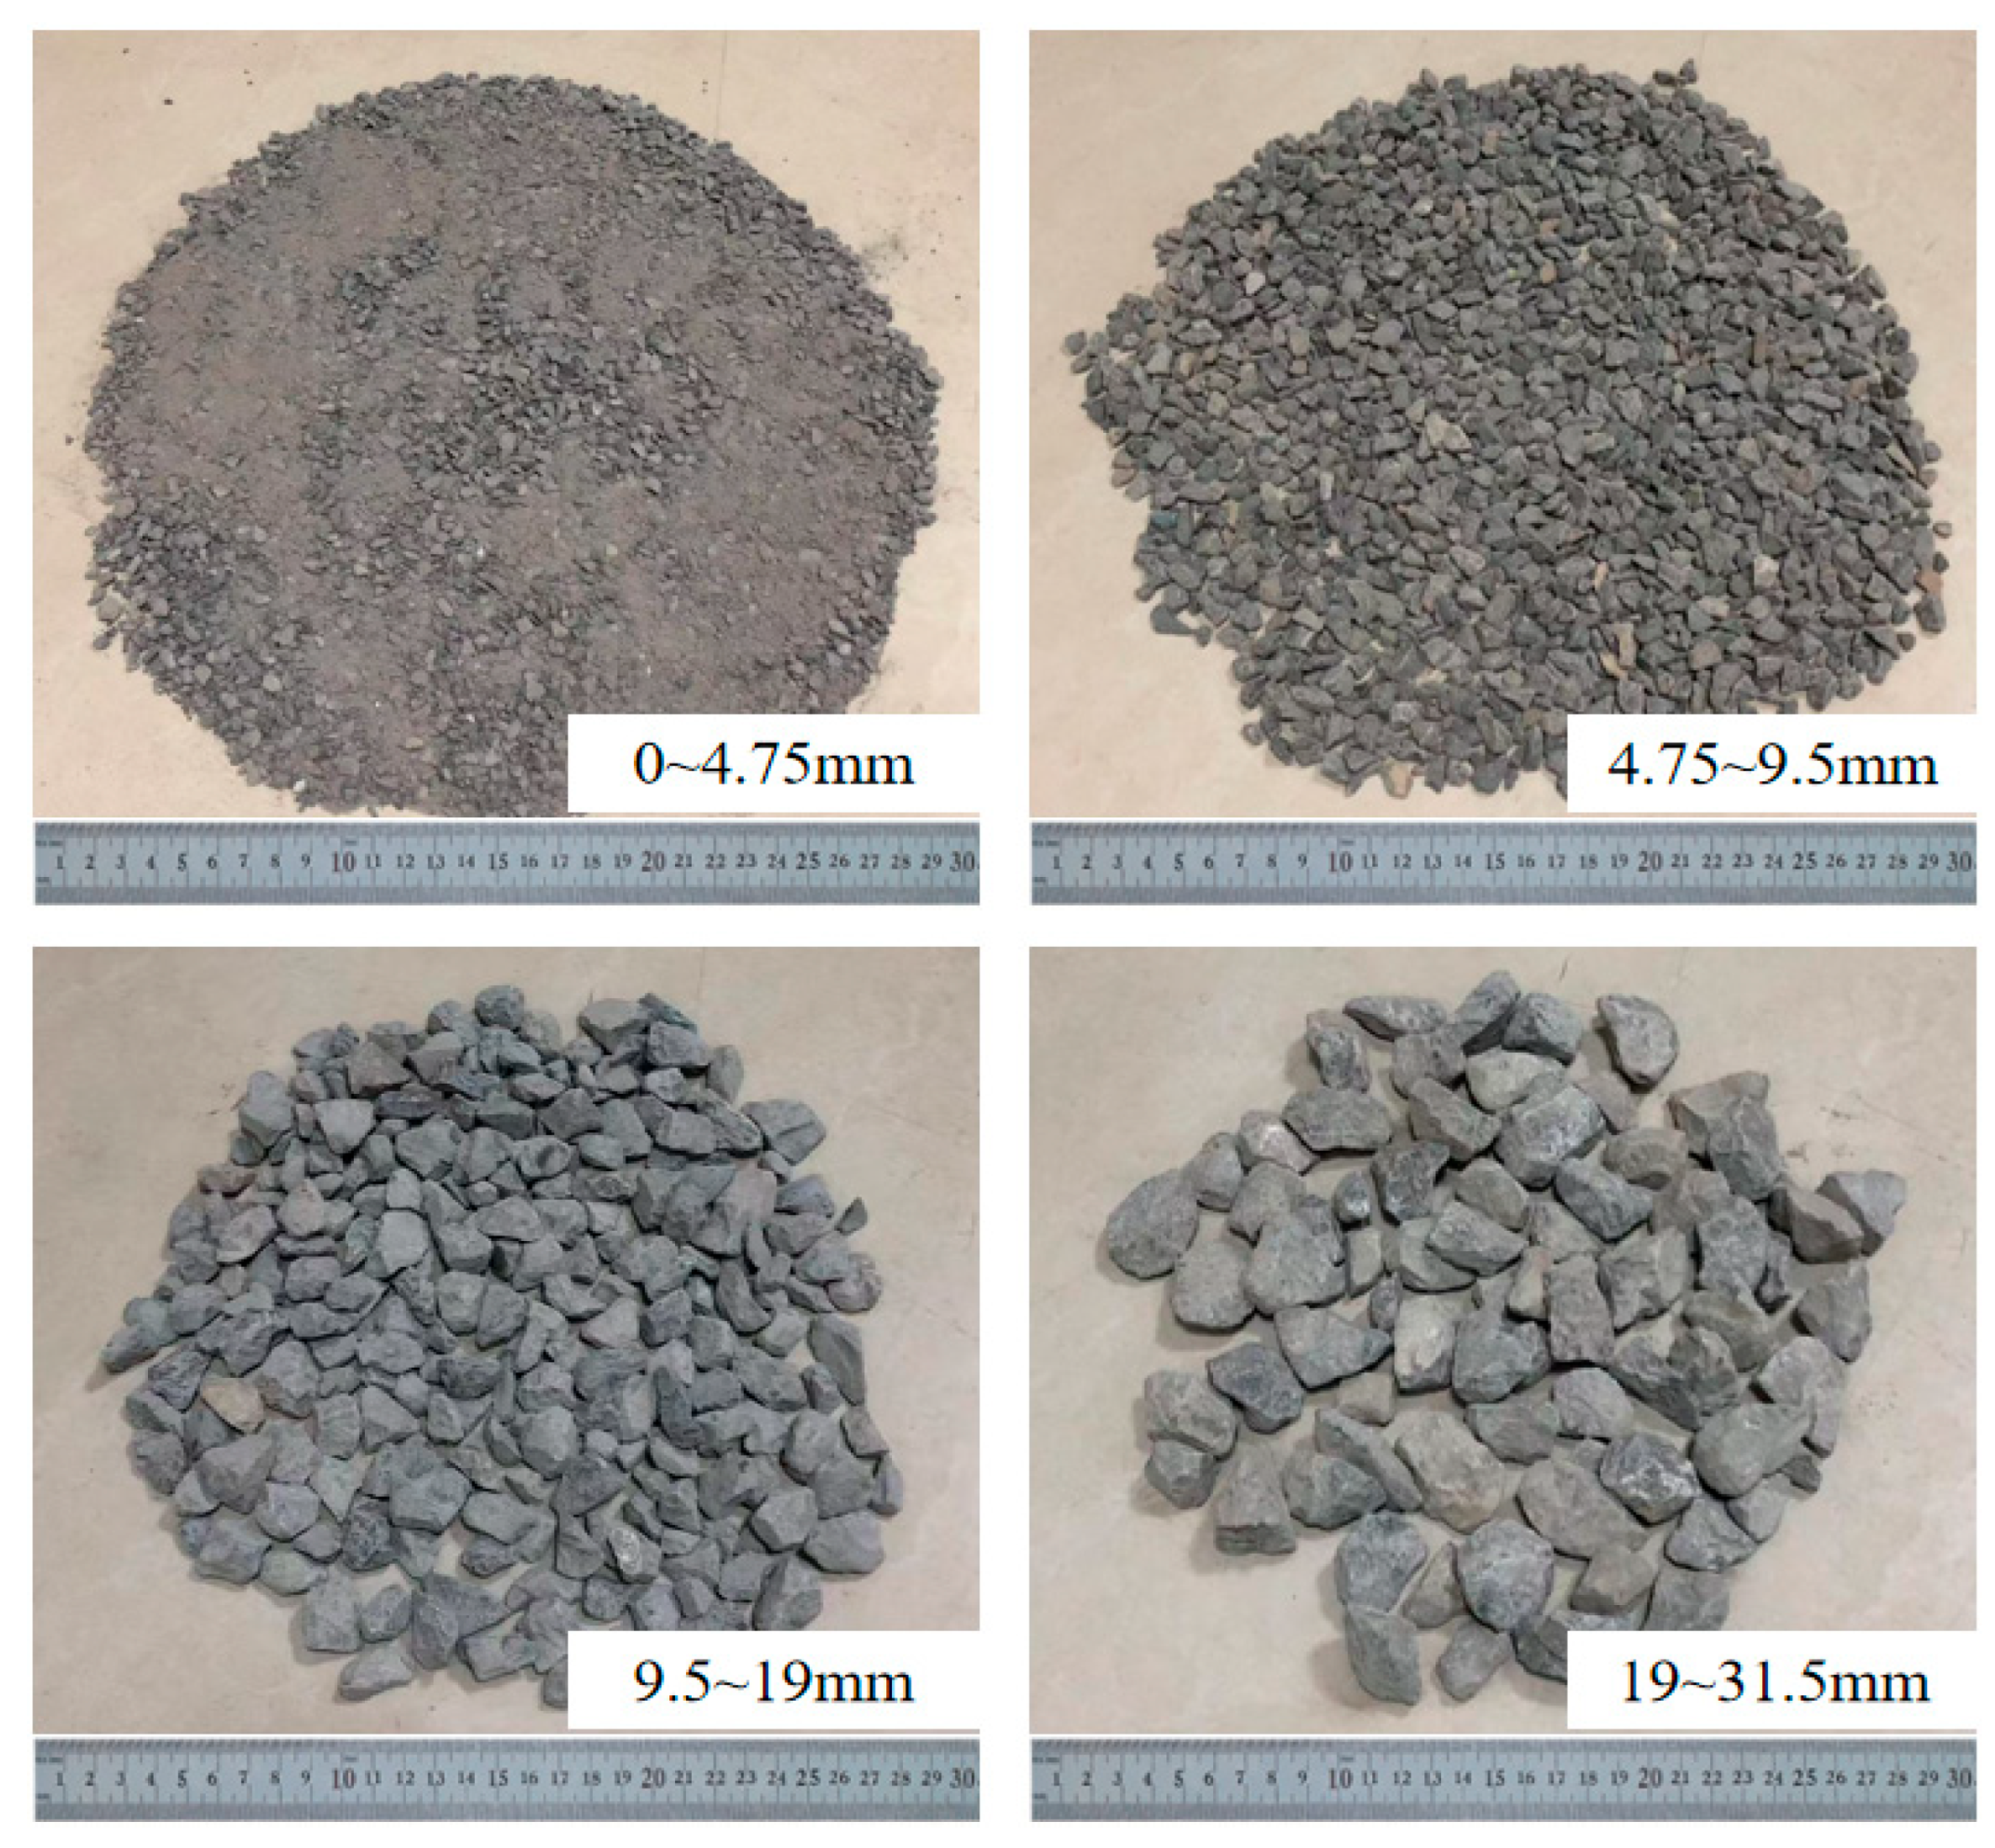
2.1.2. Aggregate
2.1.3. Cement and Water
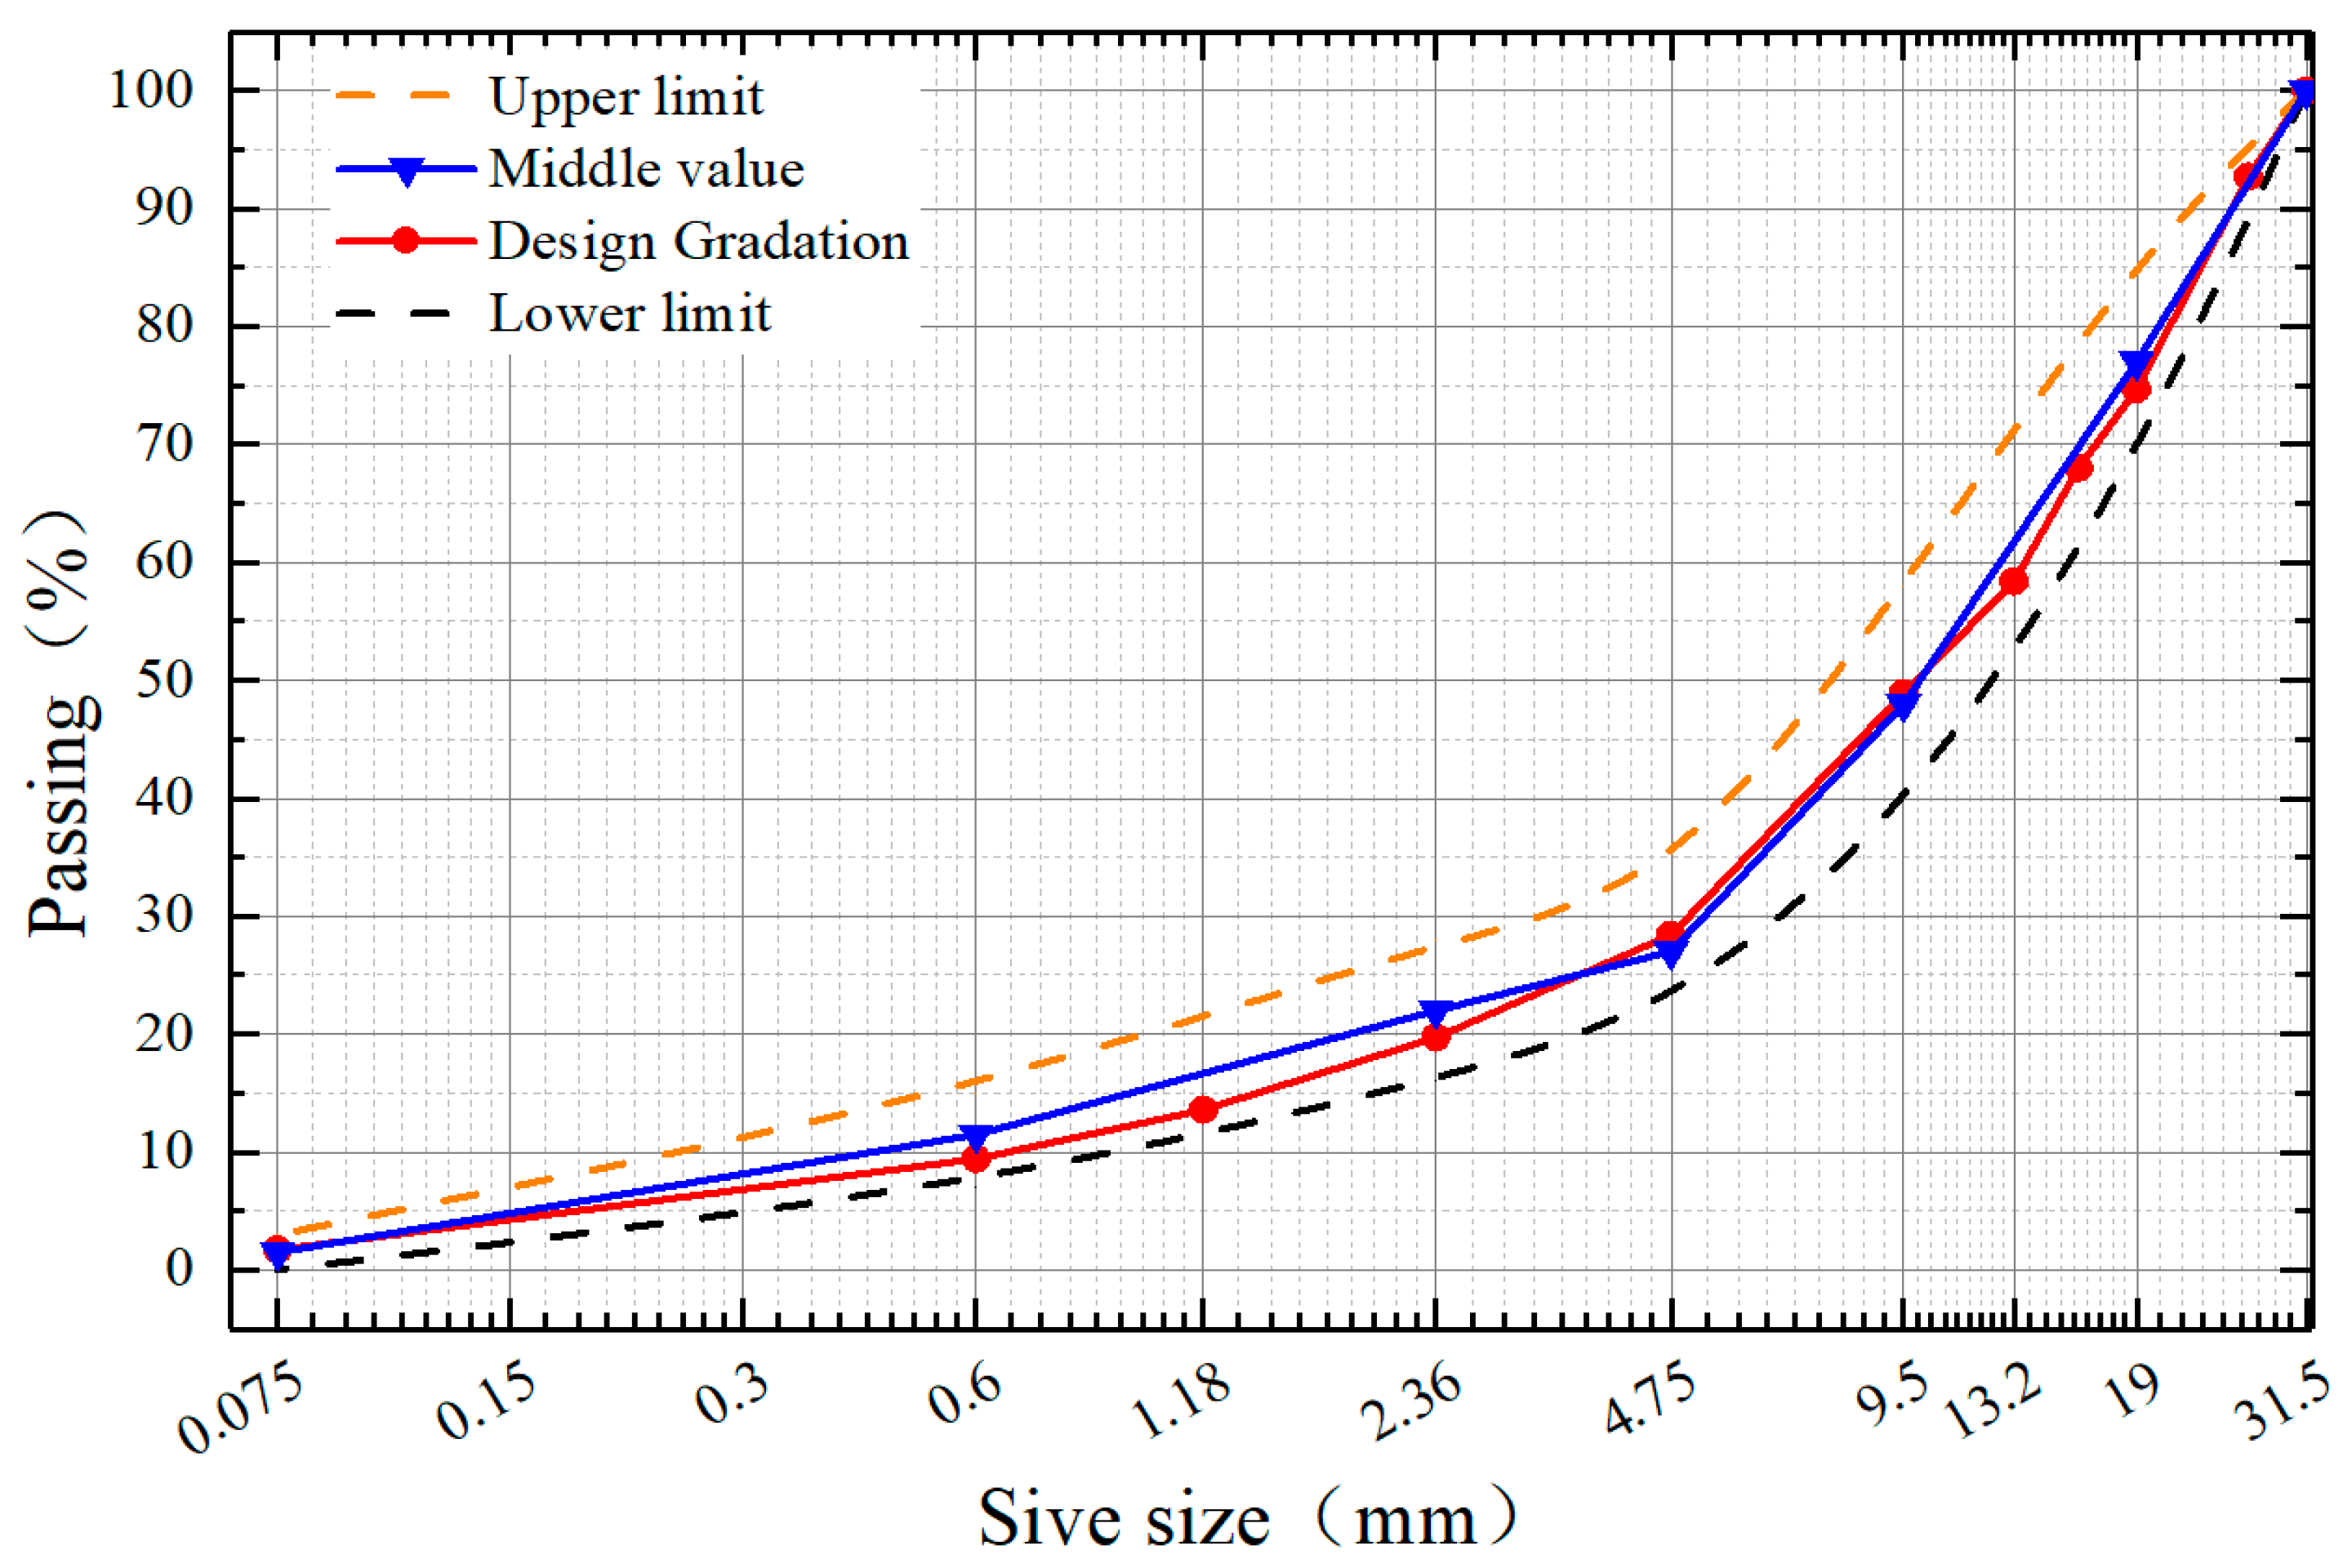
2.2. Gradation Design
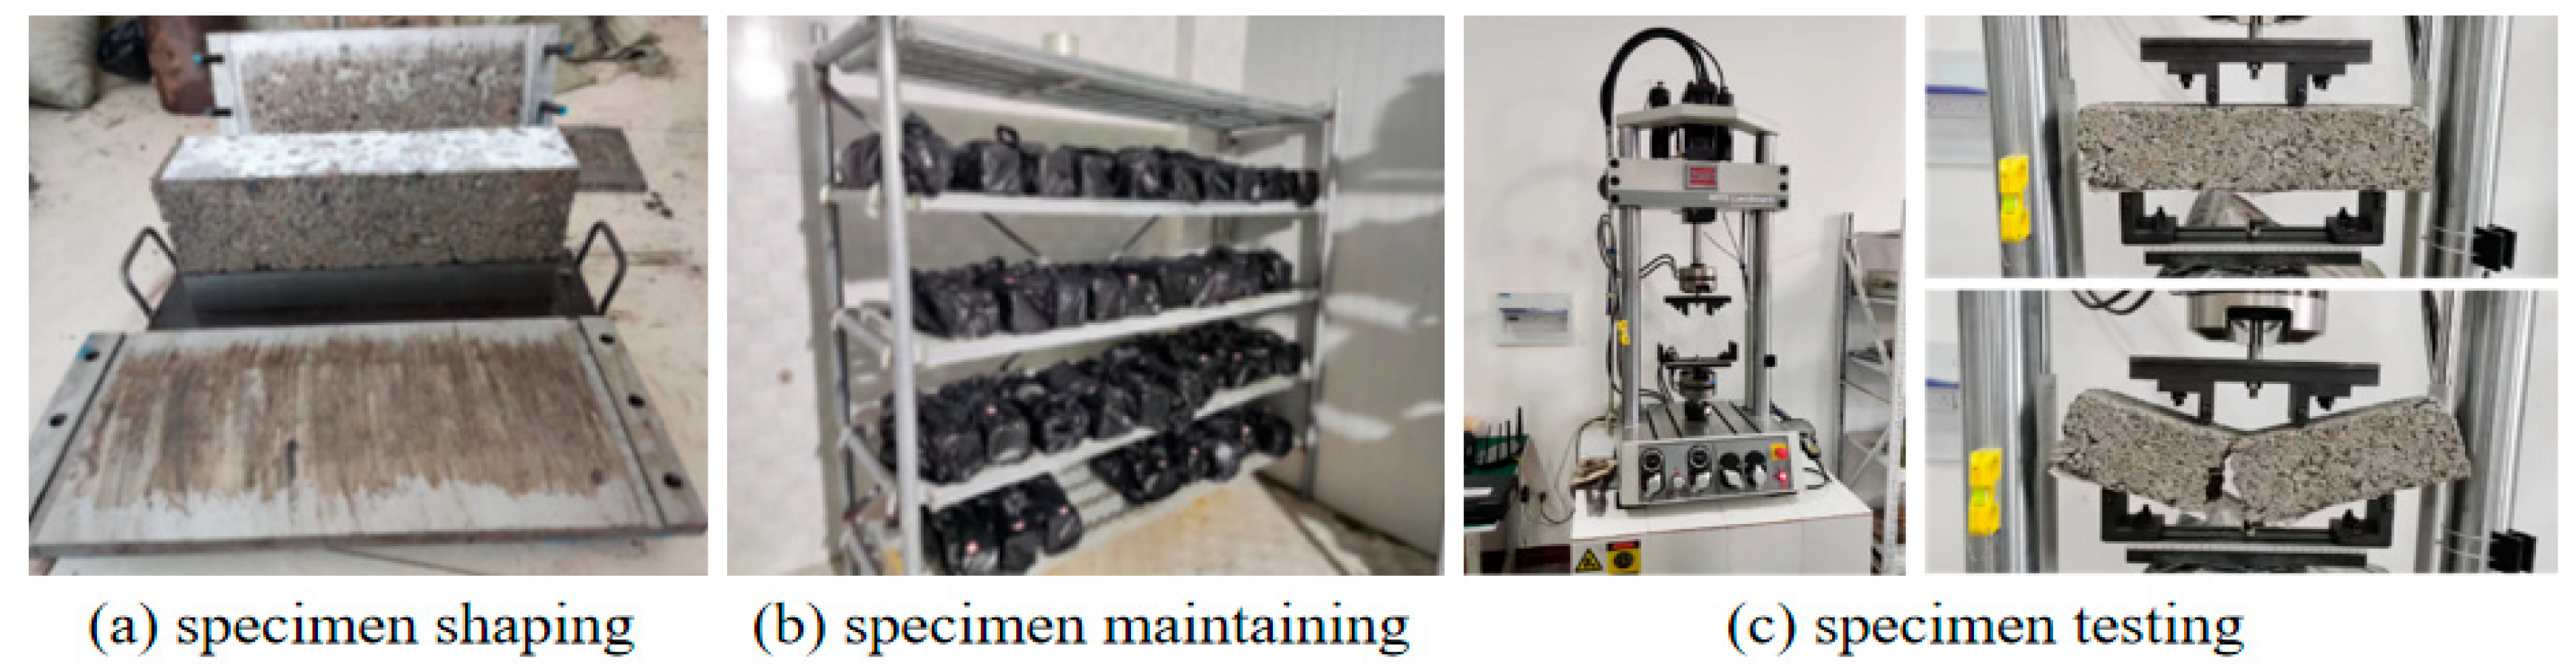
2.3. Testing Methods
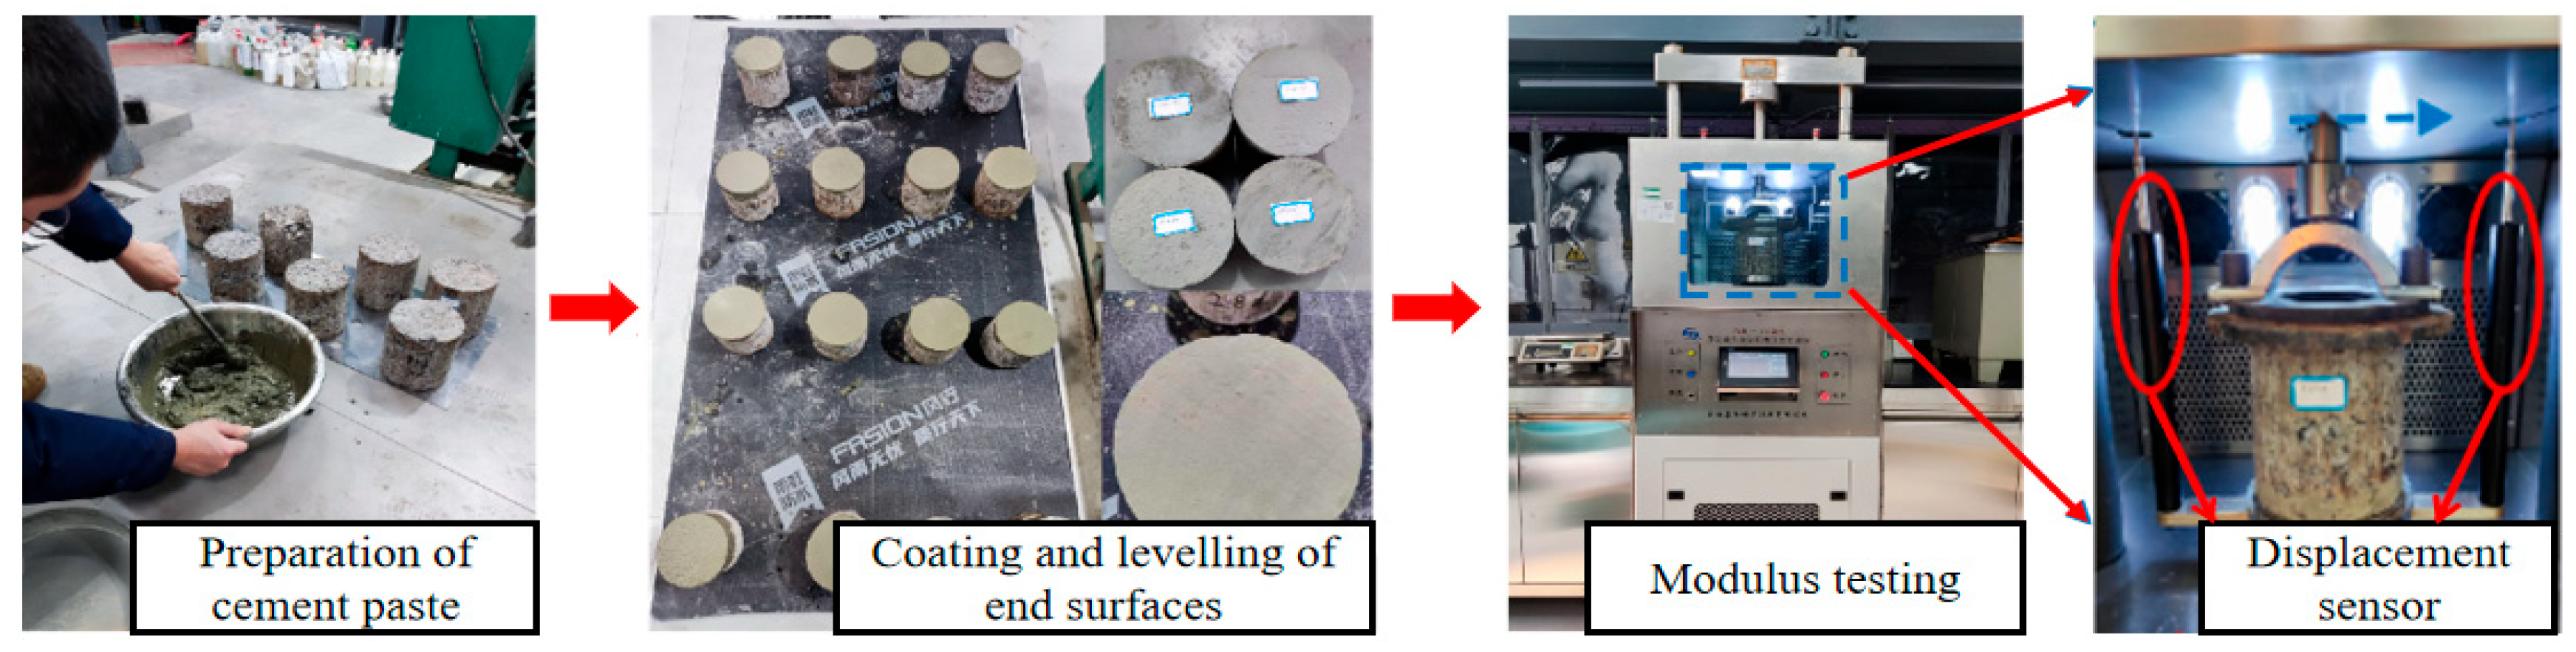
2.3.1. The UCS Test
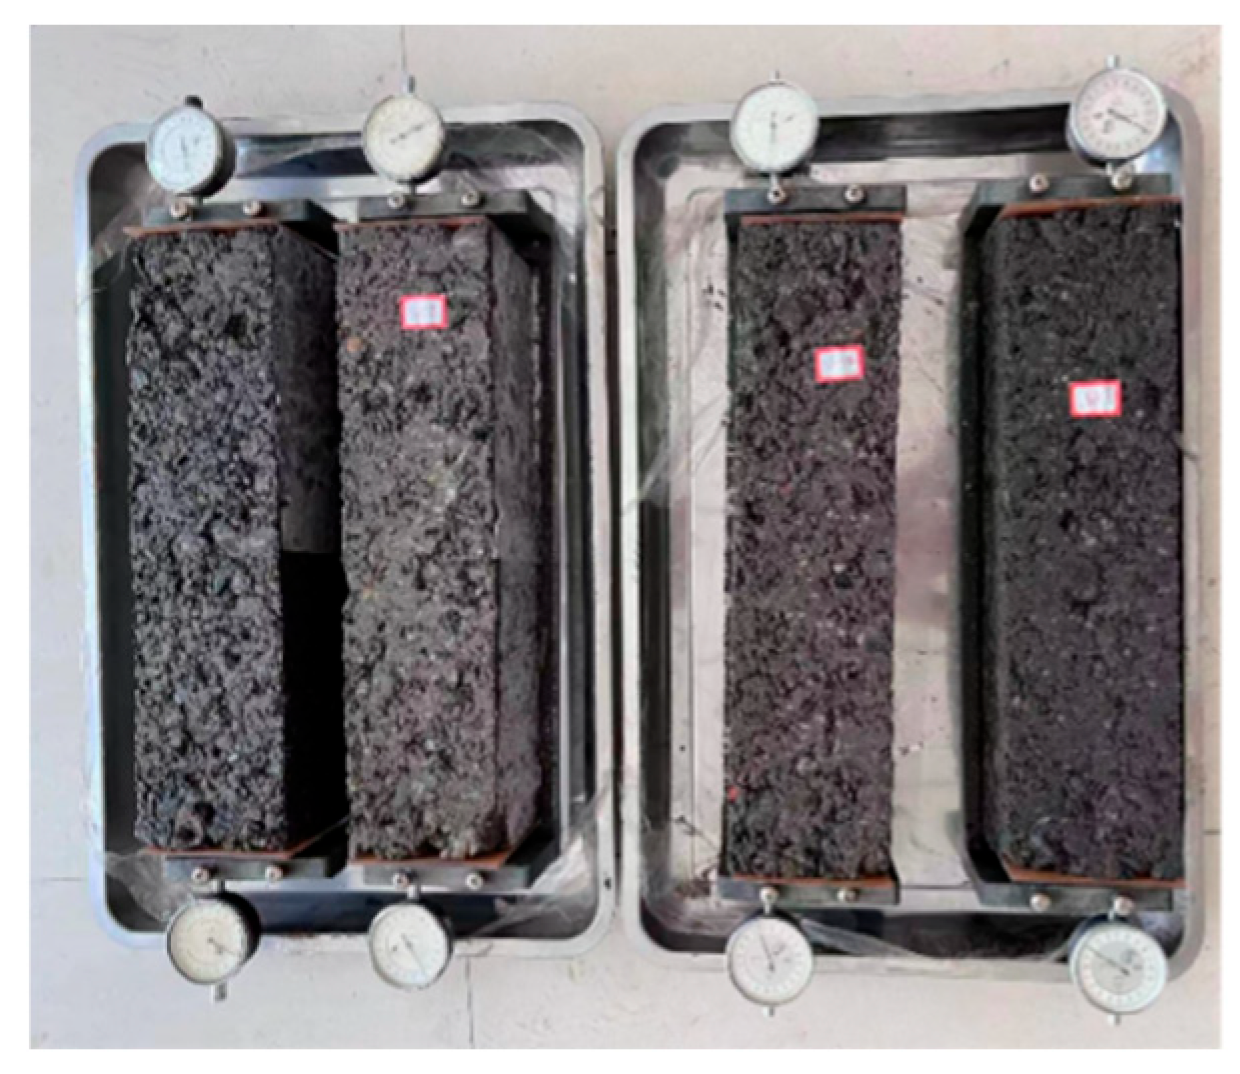
2.3.2. The FTS Test
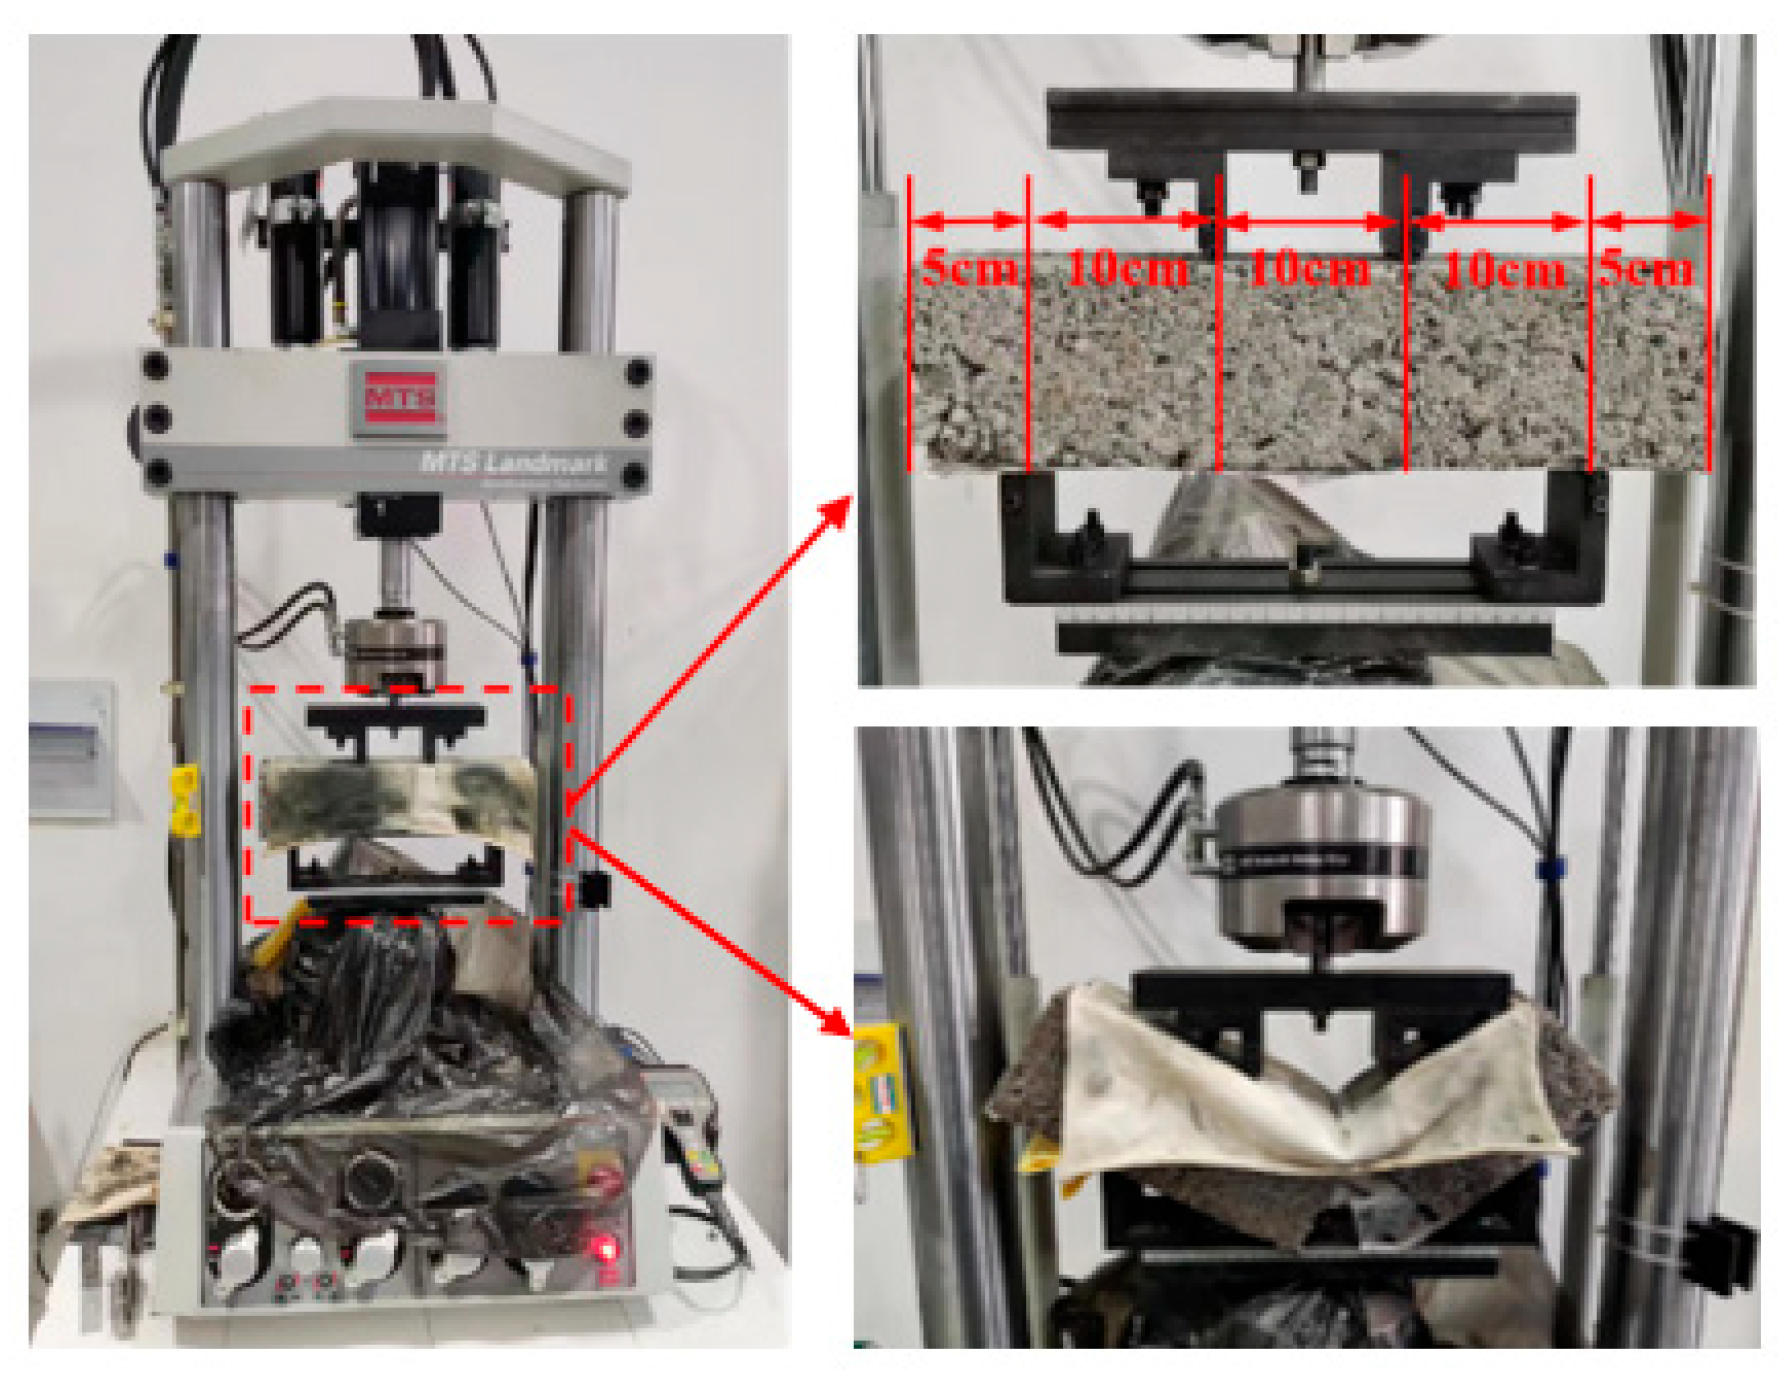
2.3.3. The DCRM Test
2.3.4. The Freeze–Thaw Test
2.3.5. Dry Shrinkage Test
2.3.6. Fatigue Test
2.3.7. Microscopic Test
2.4. DET Evaluation Model
2.4.1. Objective Weight Calculation Using the Entropy Weight Method
- (1)
- Standardization Processing.
- (2)
- Calculation of information entropy for each indicator.
- (3)
- Calculation of the indicator’s information entropy value , information effect value , and evaluation indicator weights.
2.4.2. Subjective Weight Calculation Using the Delphi Method
2.4.3. Combination Weighting Method
2.4.4. TOPSIS Model
- (1)
- Standardization of the decision matrix.
- (2)
- Calculation of the weighted normalized decision matrix.
- (3)
- Determination of the positive ideal solution and the negative ideal solution.
- (4)
- Calculation of the distance from each alternative to the positive ideal point and the distance to the negative ideal point . The distances are calculated as follows:
- (5)
- Calculation of the relative closeness of alternative solutions to the positive ideal solution. The relative closeness of the alternative solutions to the positive ideal solution is calculated as follows:
3. Results and Discussions
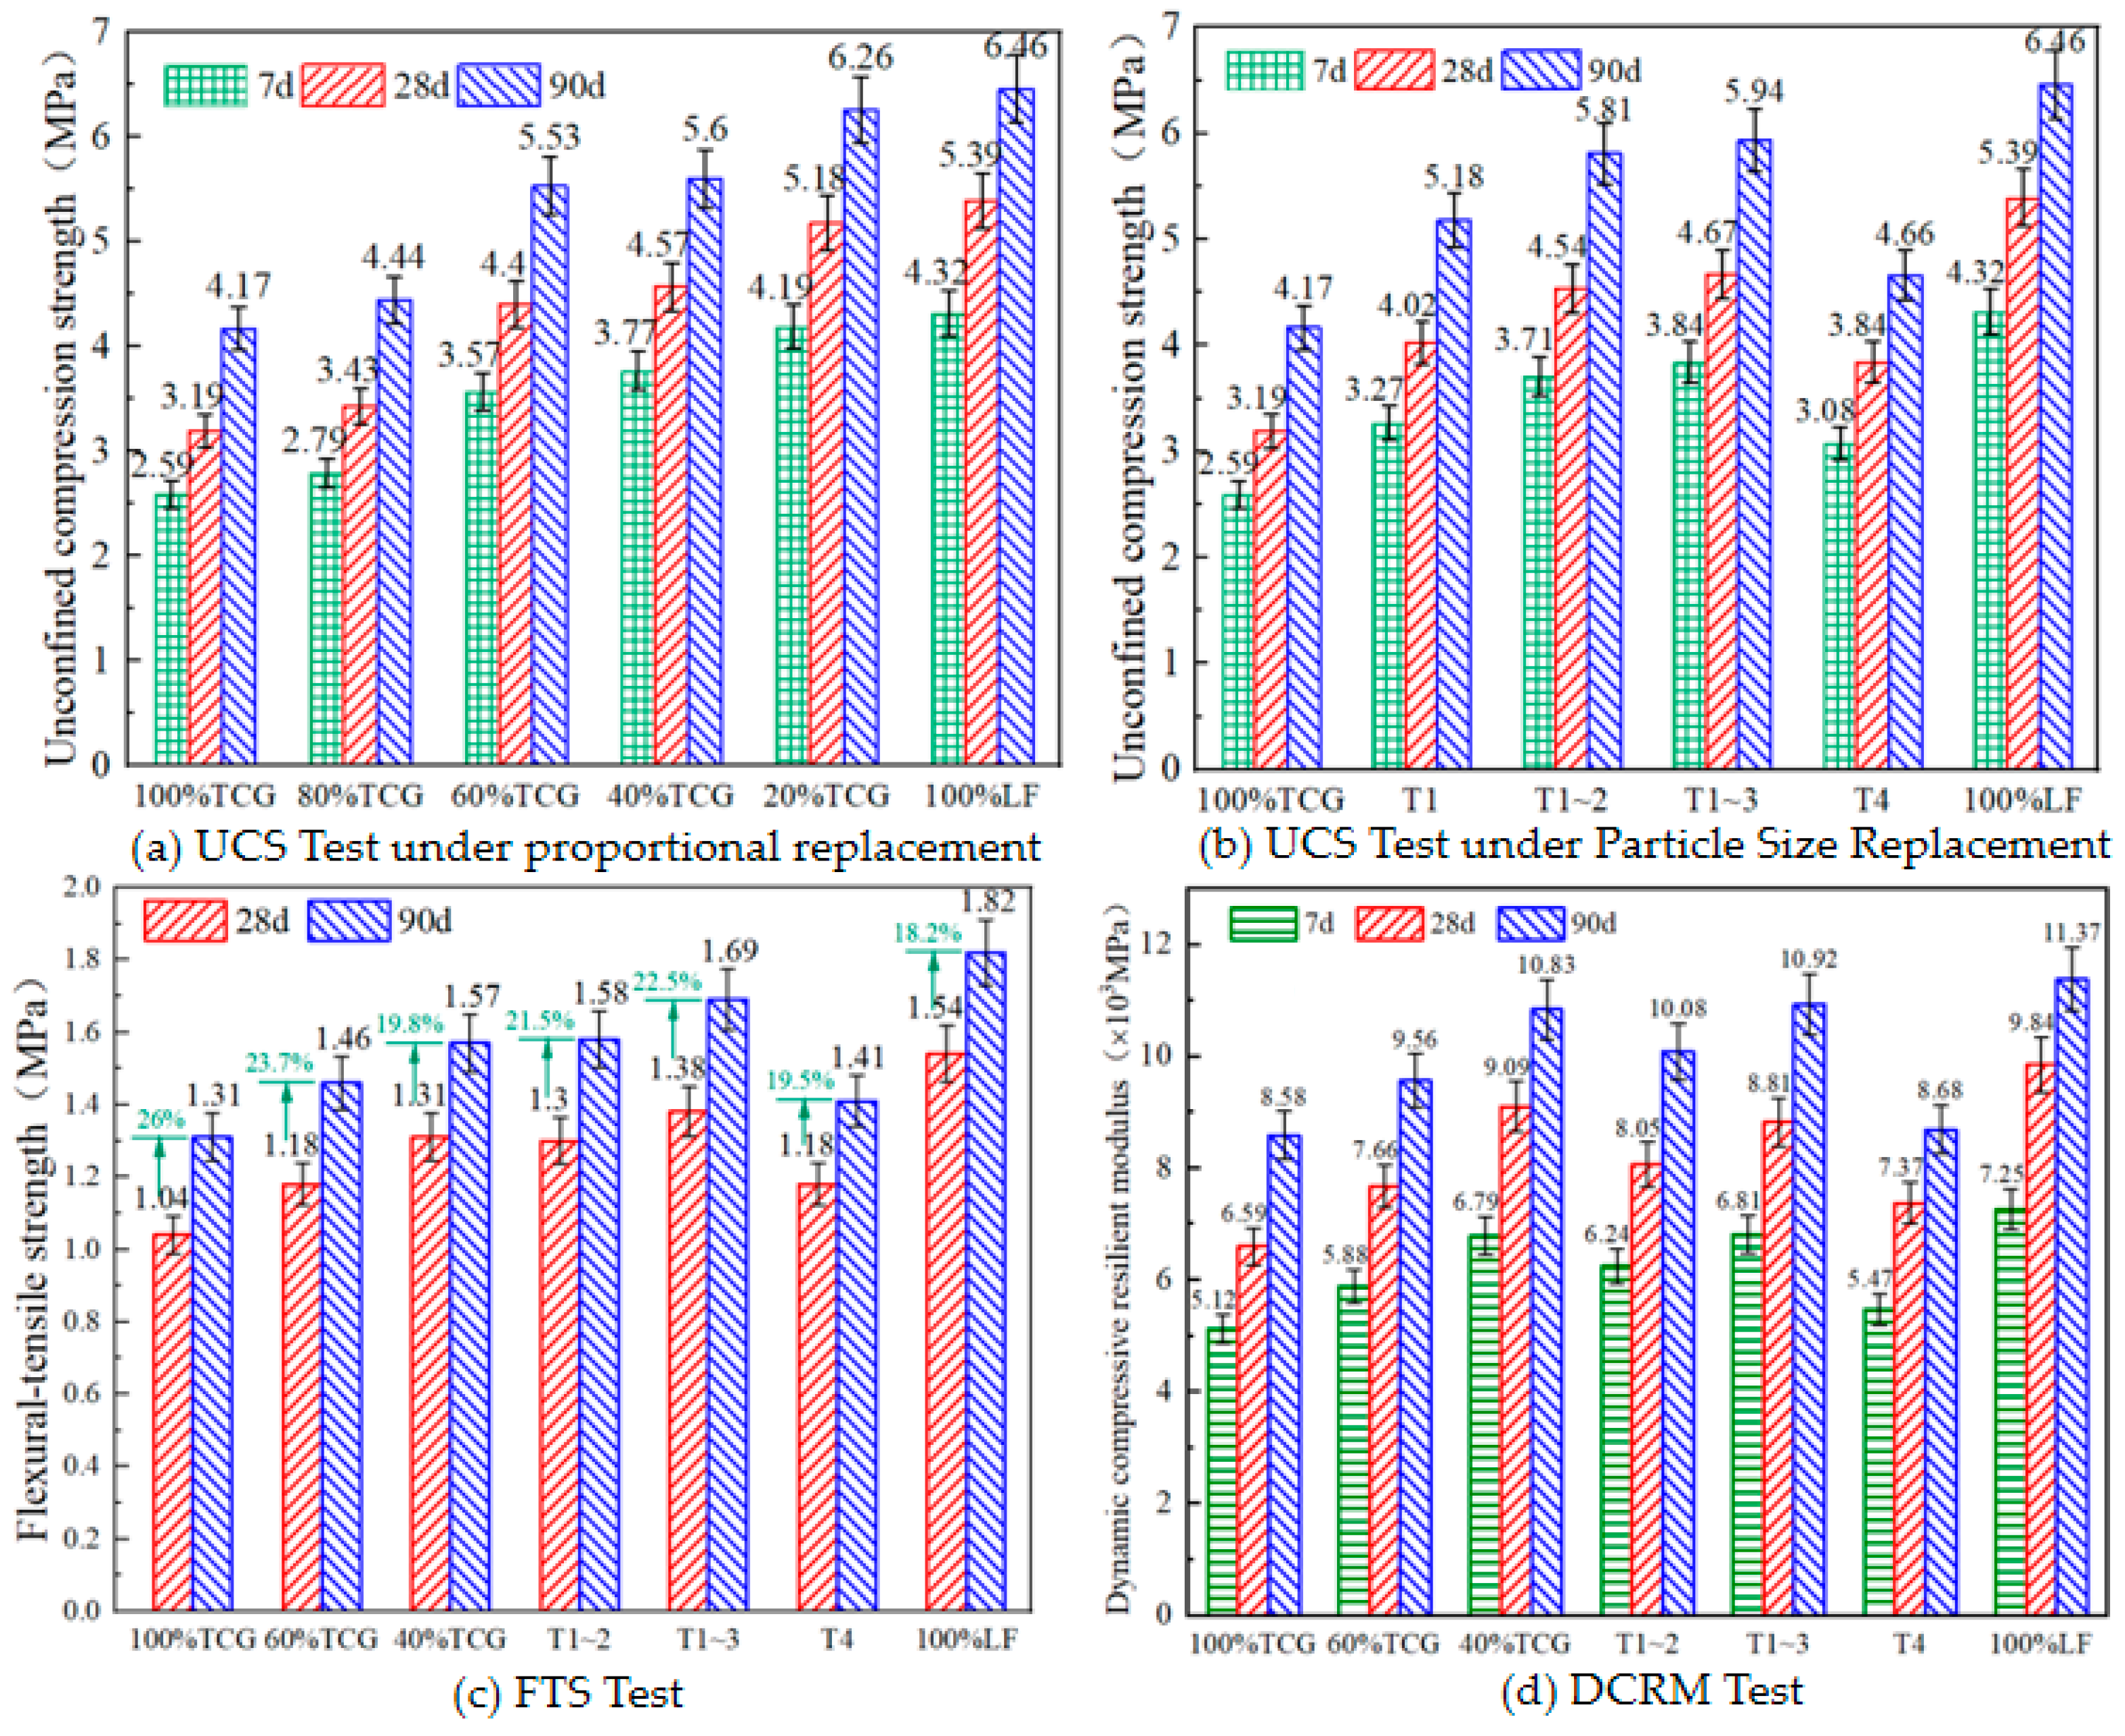
3.1. Mechanical Properties Analysis
3.2. Durability Analysis
- (1)
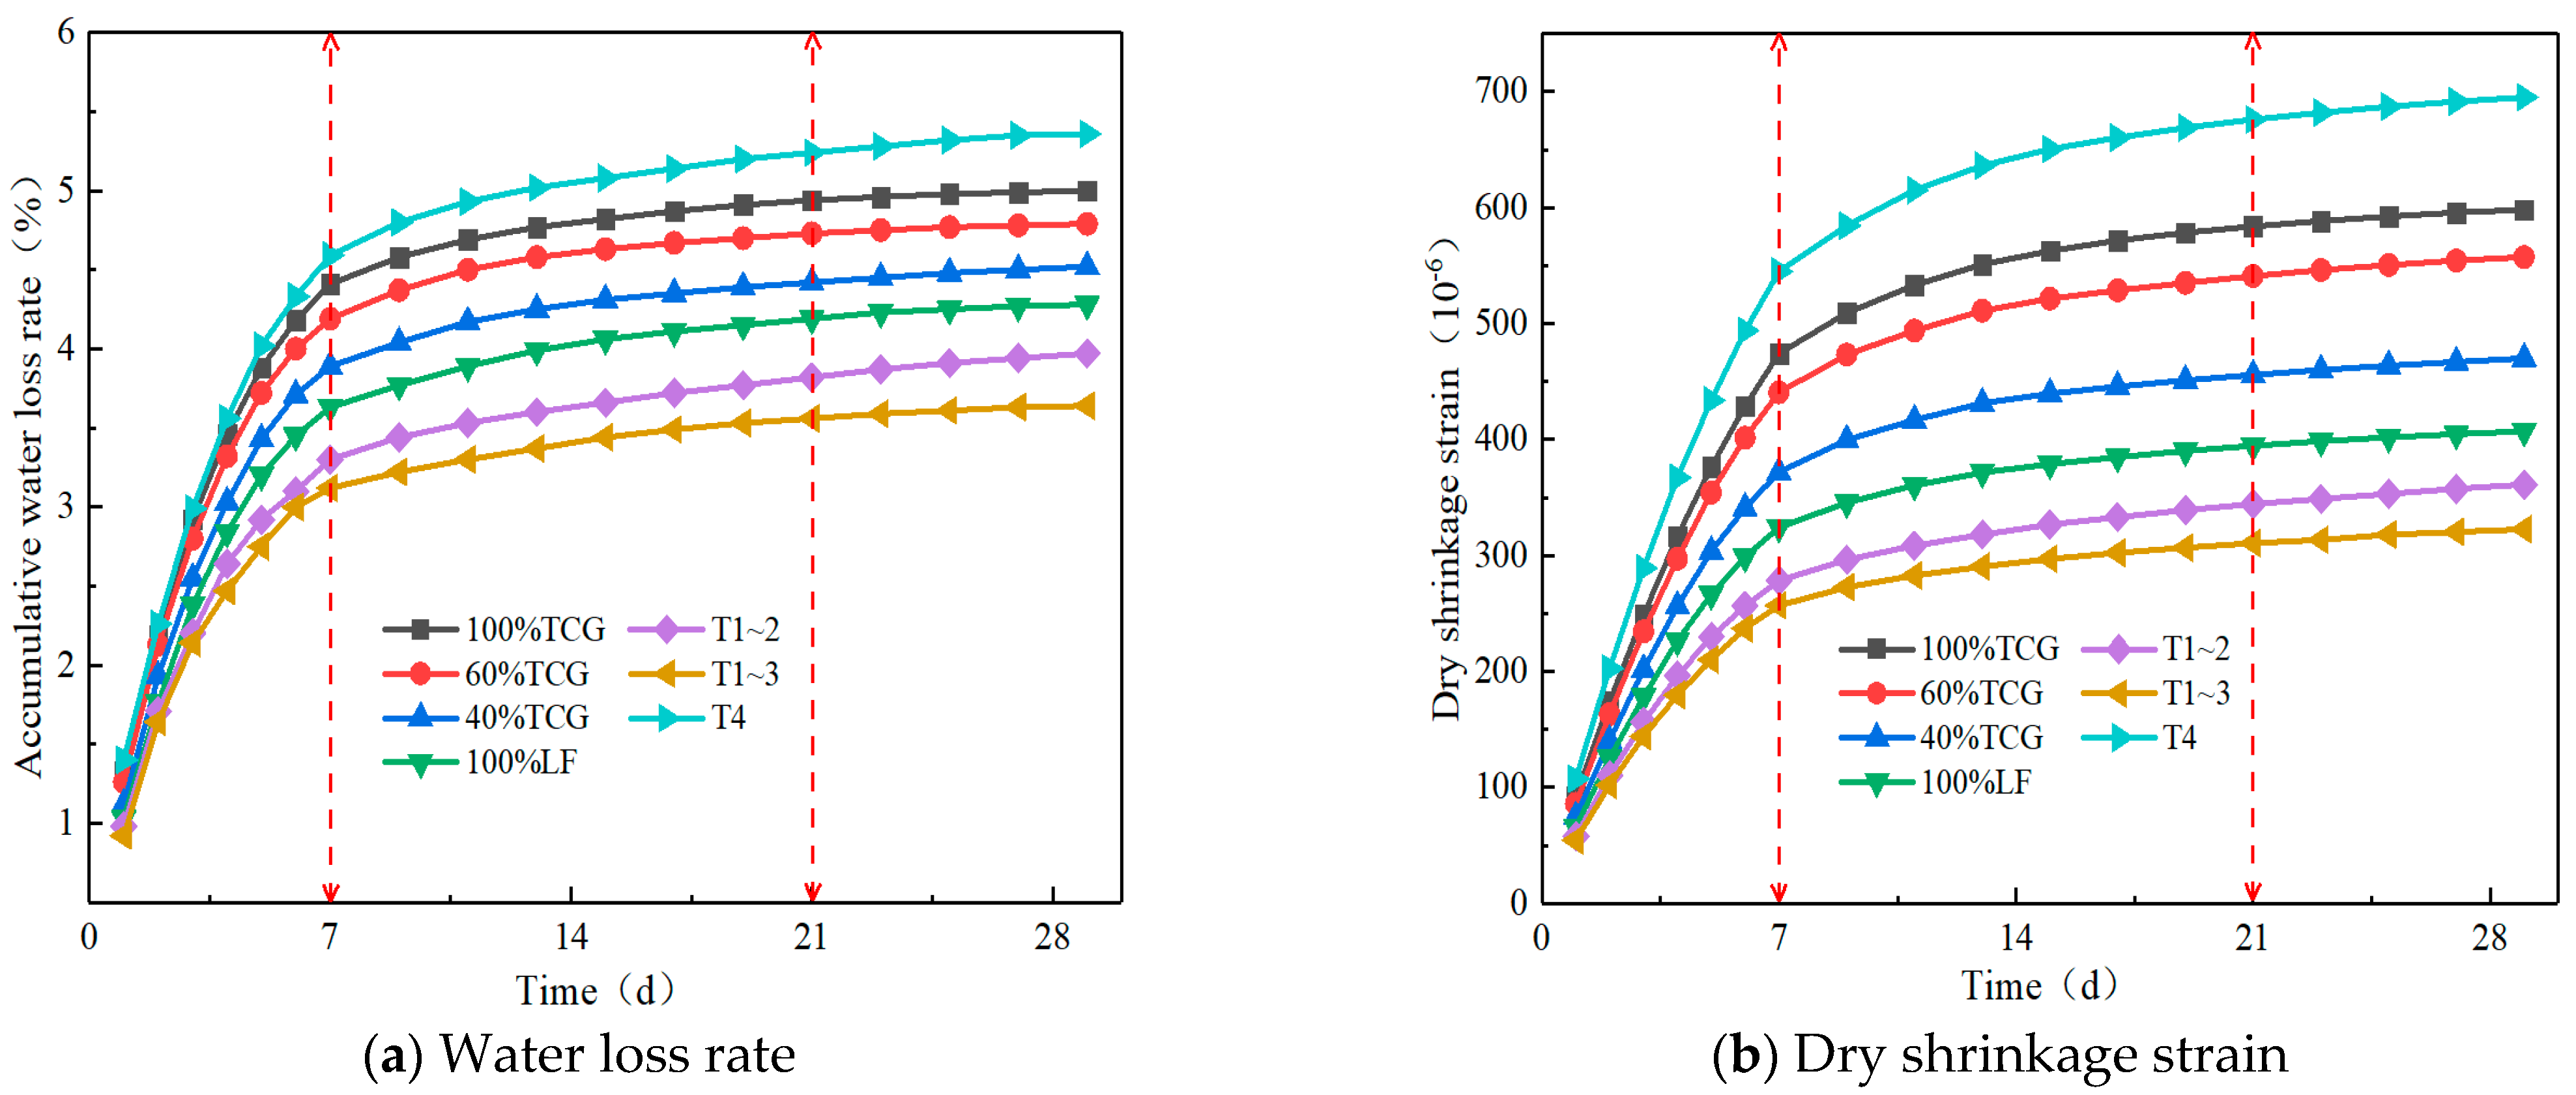
- Frost resistance and drying shrinkage
- (2)
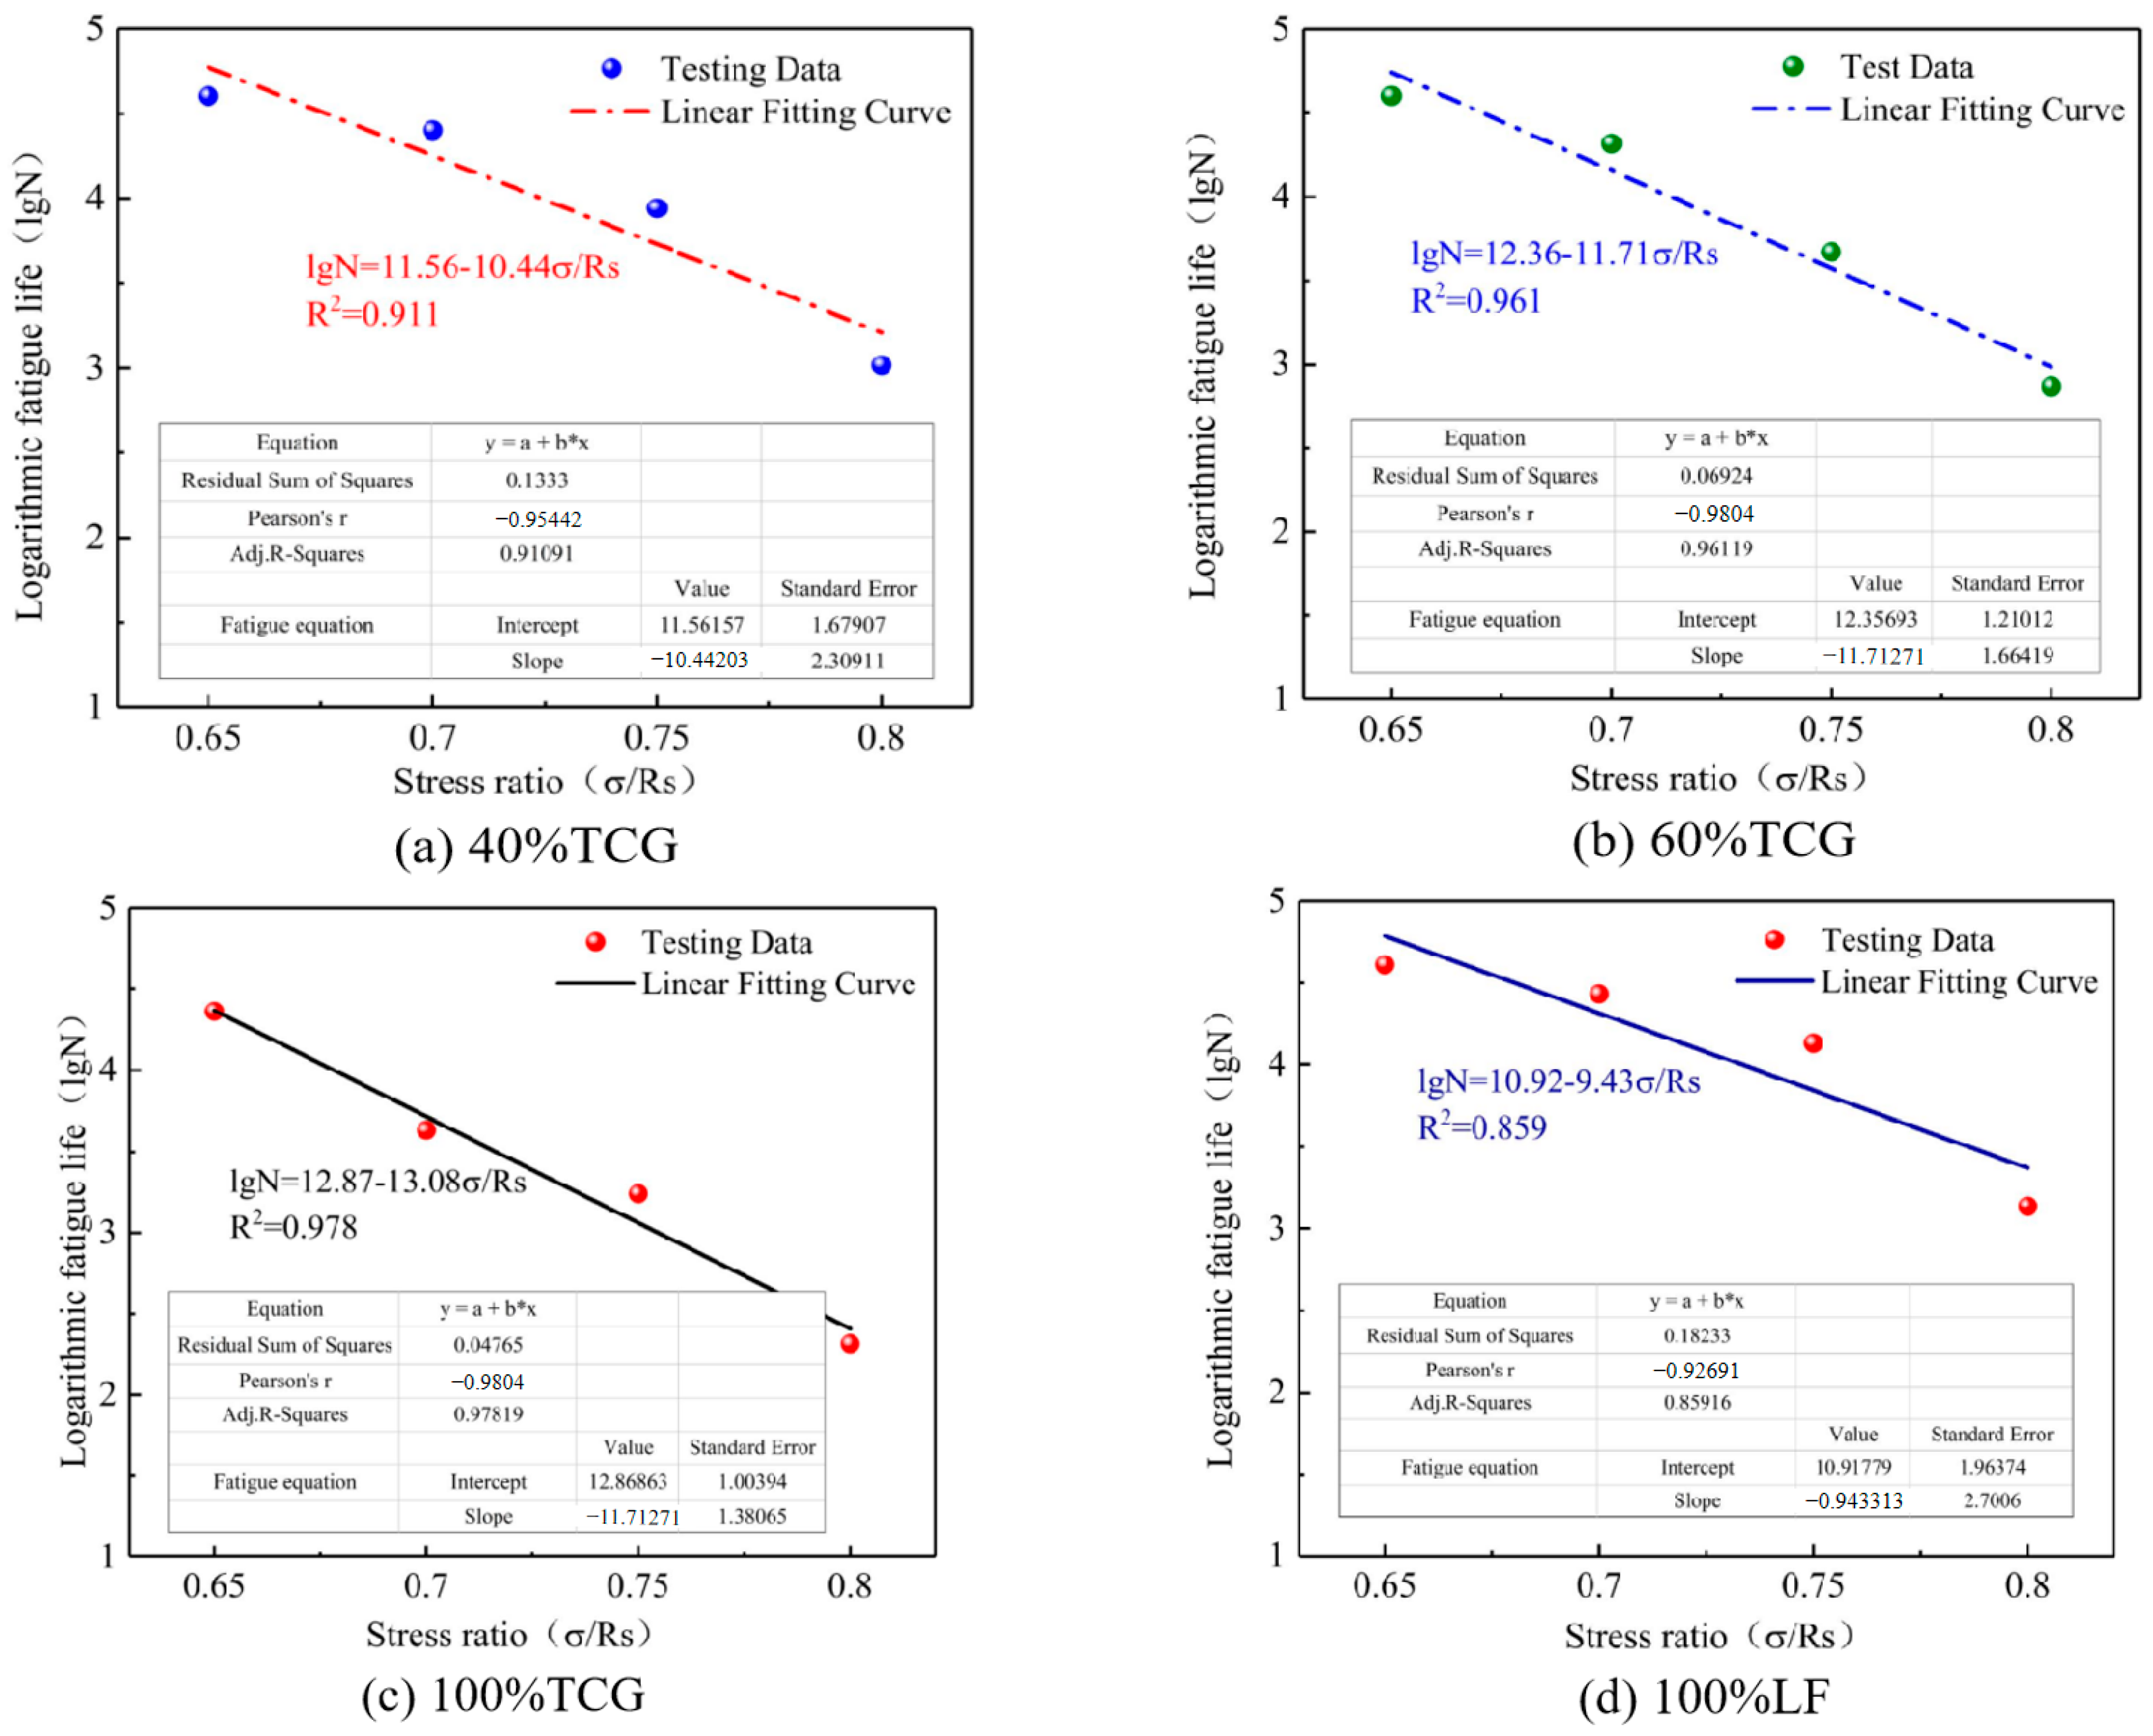
- Fatigue property
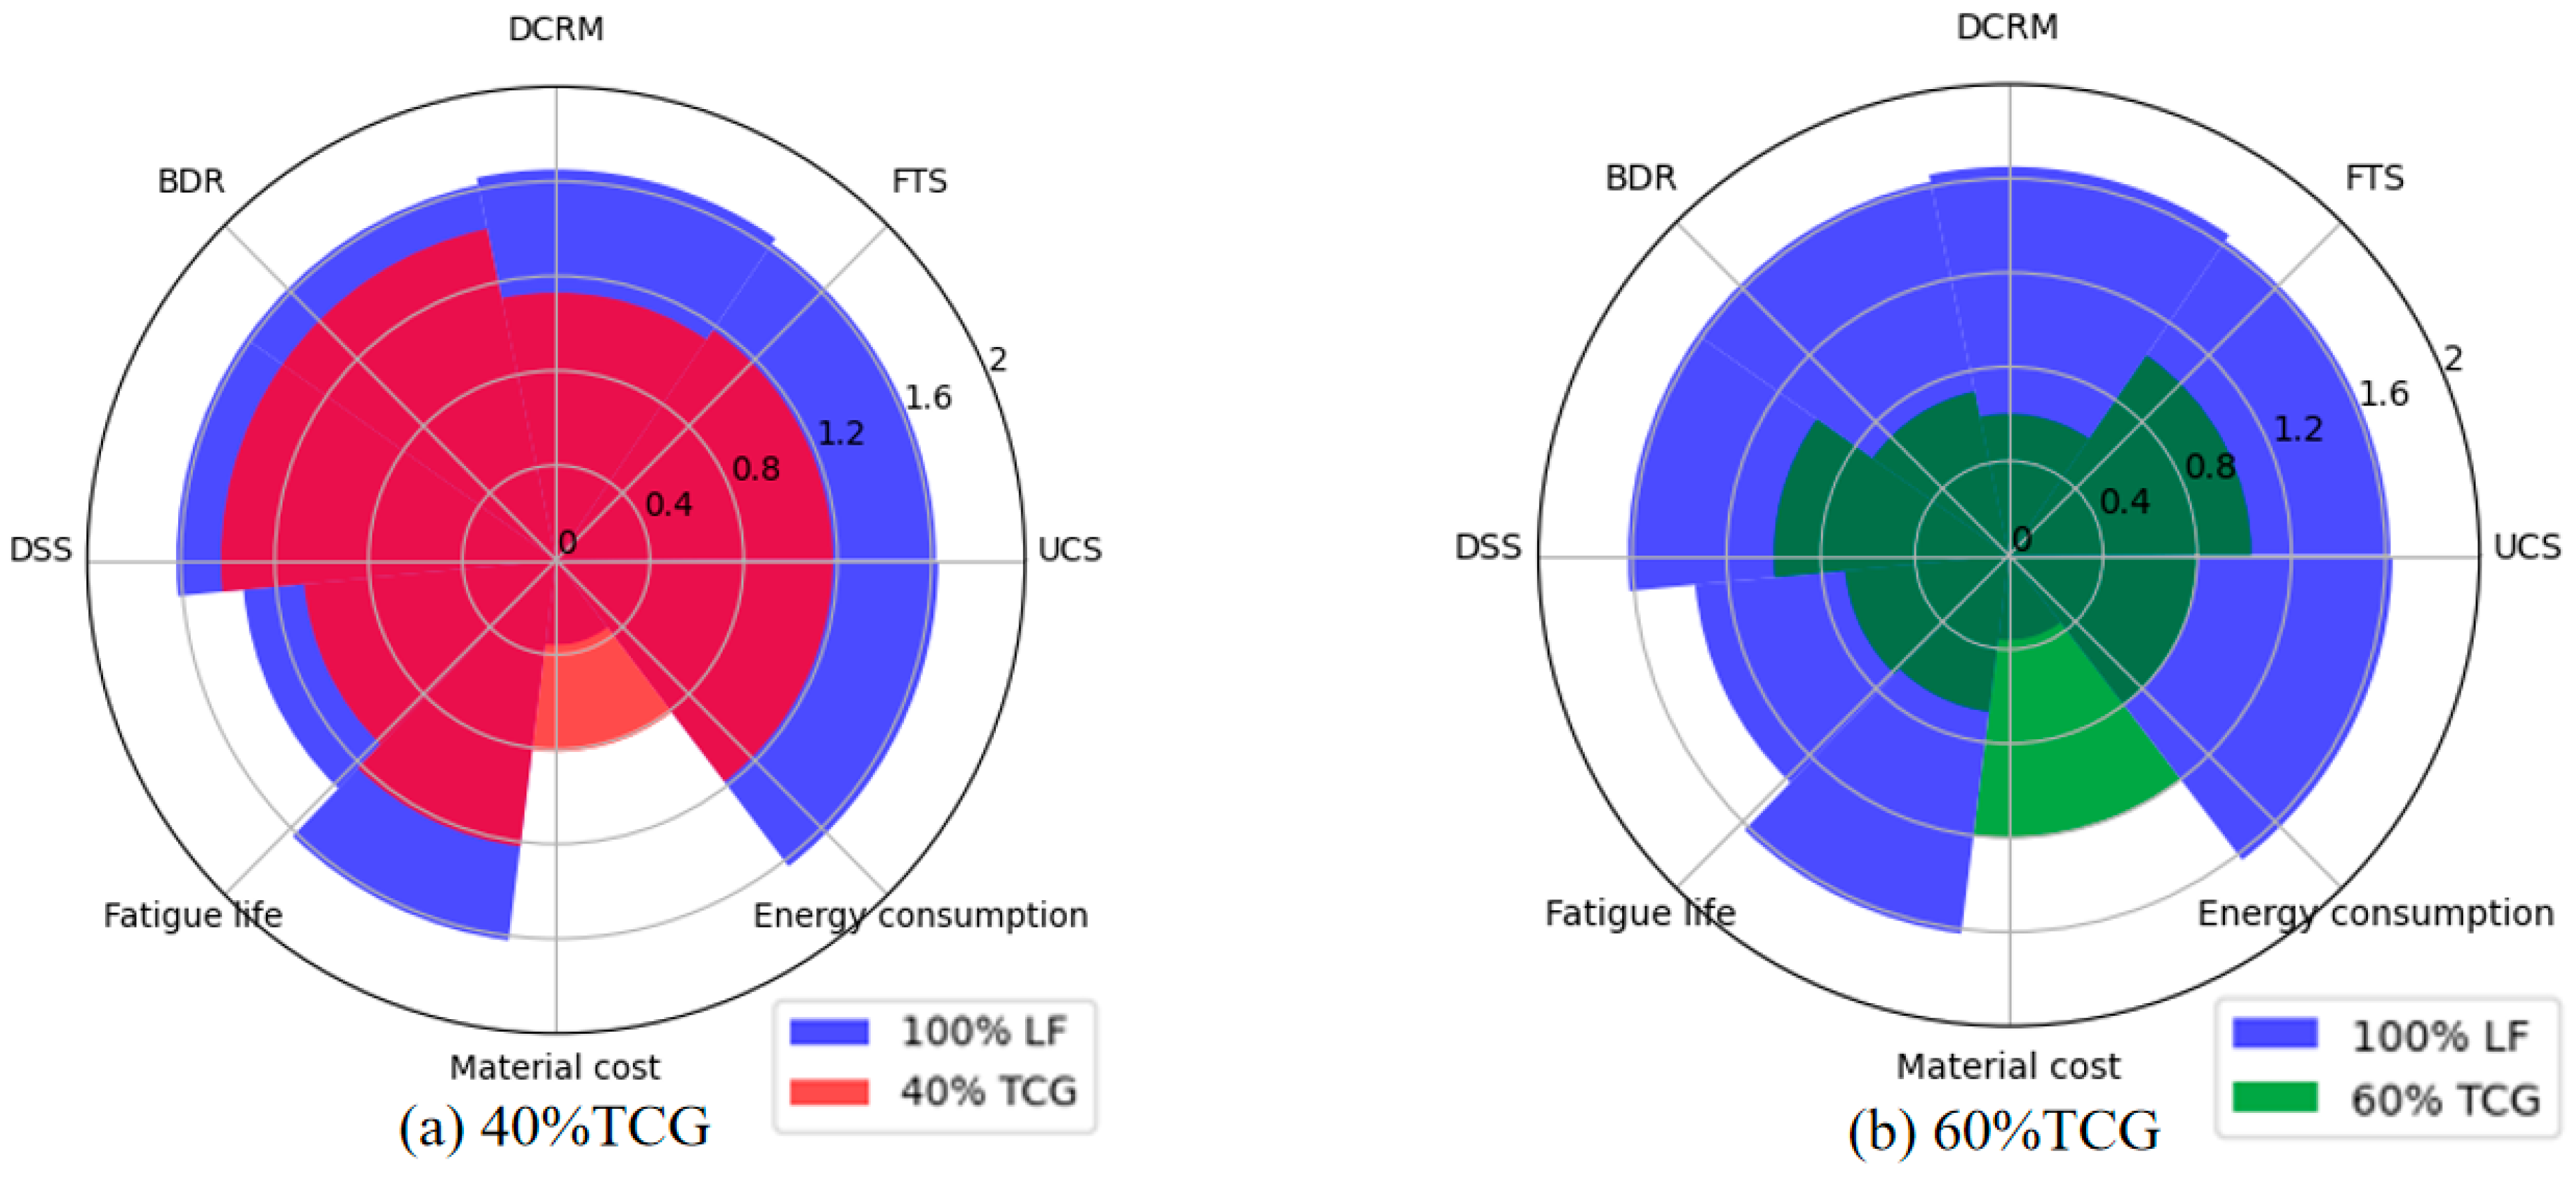
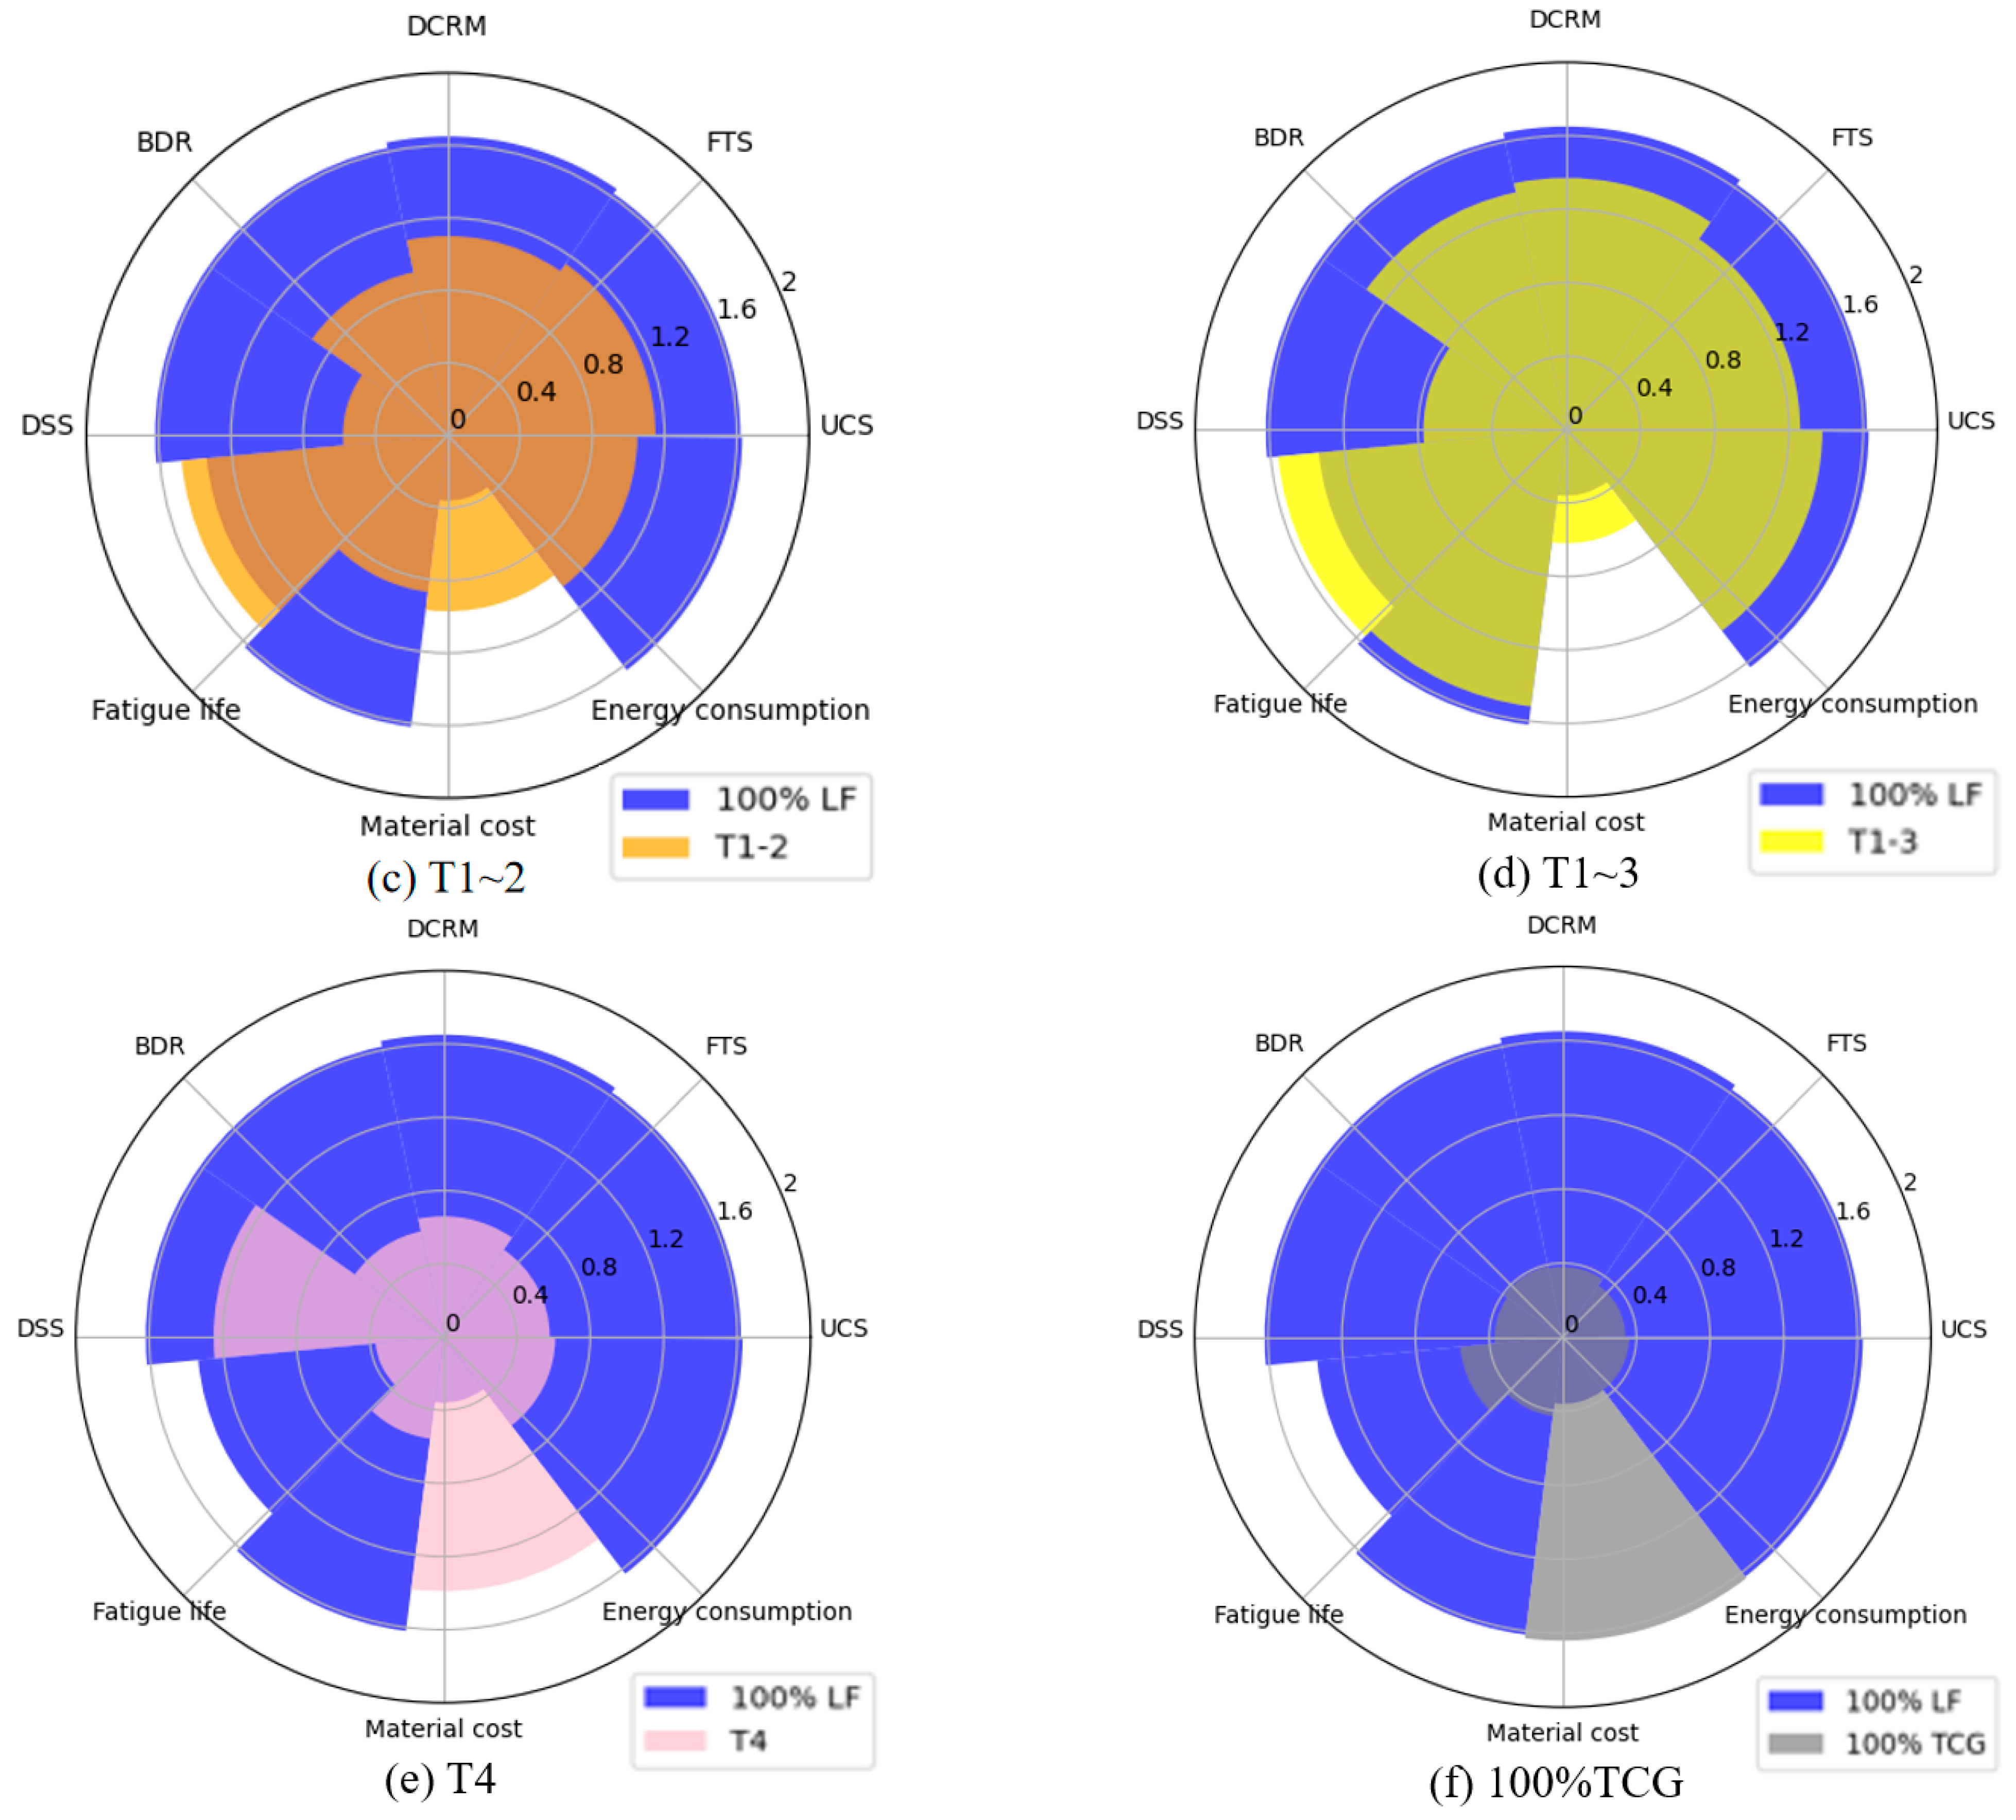
3.3. Comprehensive Performance Evaluation and Analysis
- (1)
- Economic indicator
- (2)
- Environmental indicator
- (3)
- DET evaluation results
3.4. Microscopic Mechanism Analysis
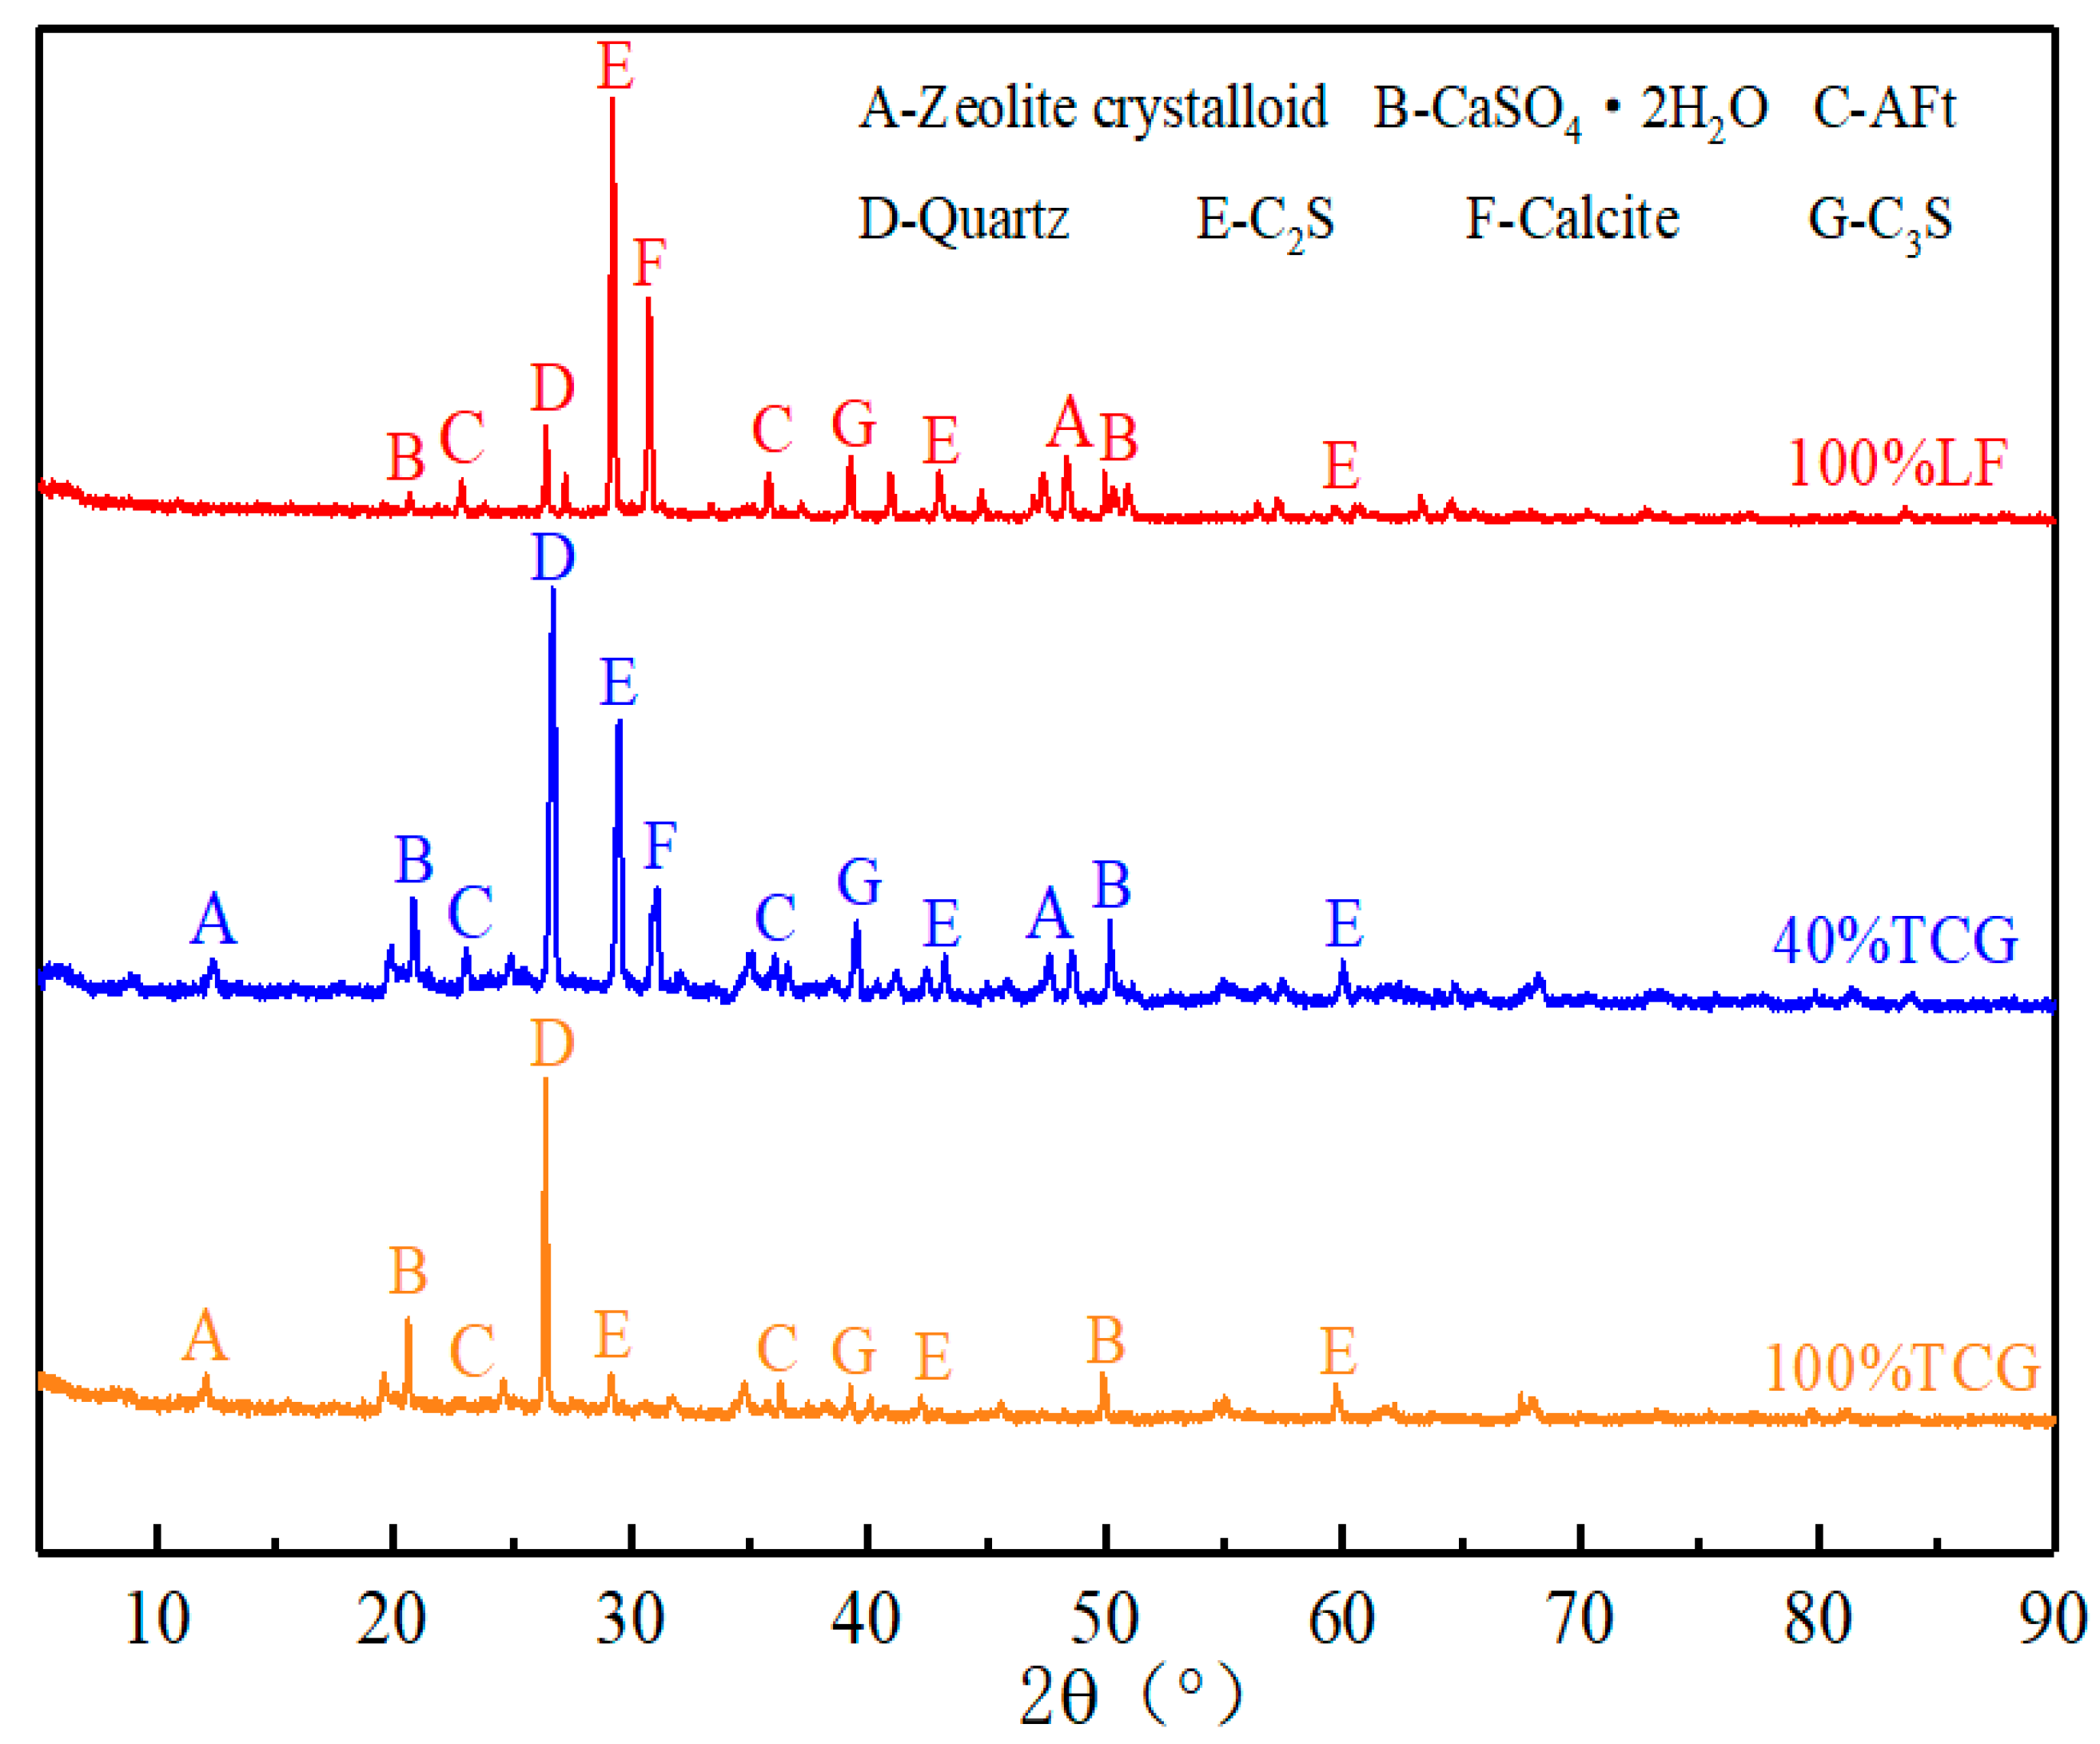
- (1)
- XRD Analysis
- (2)
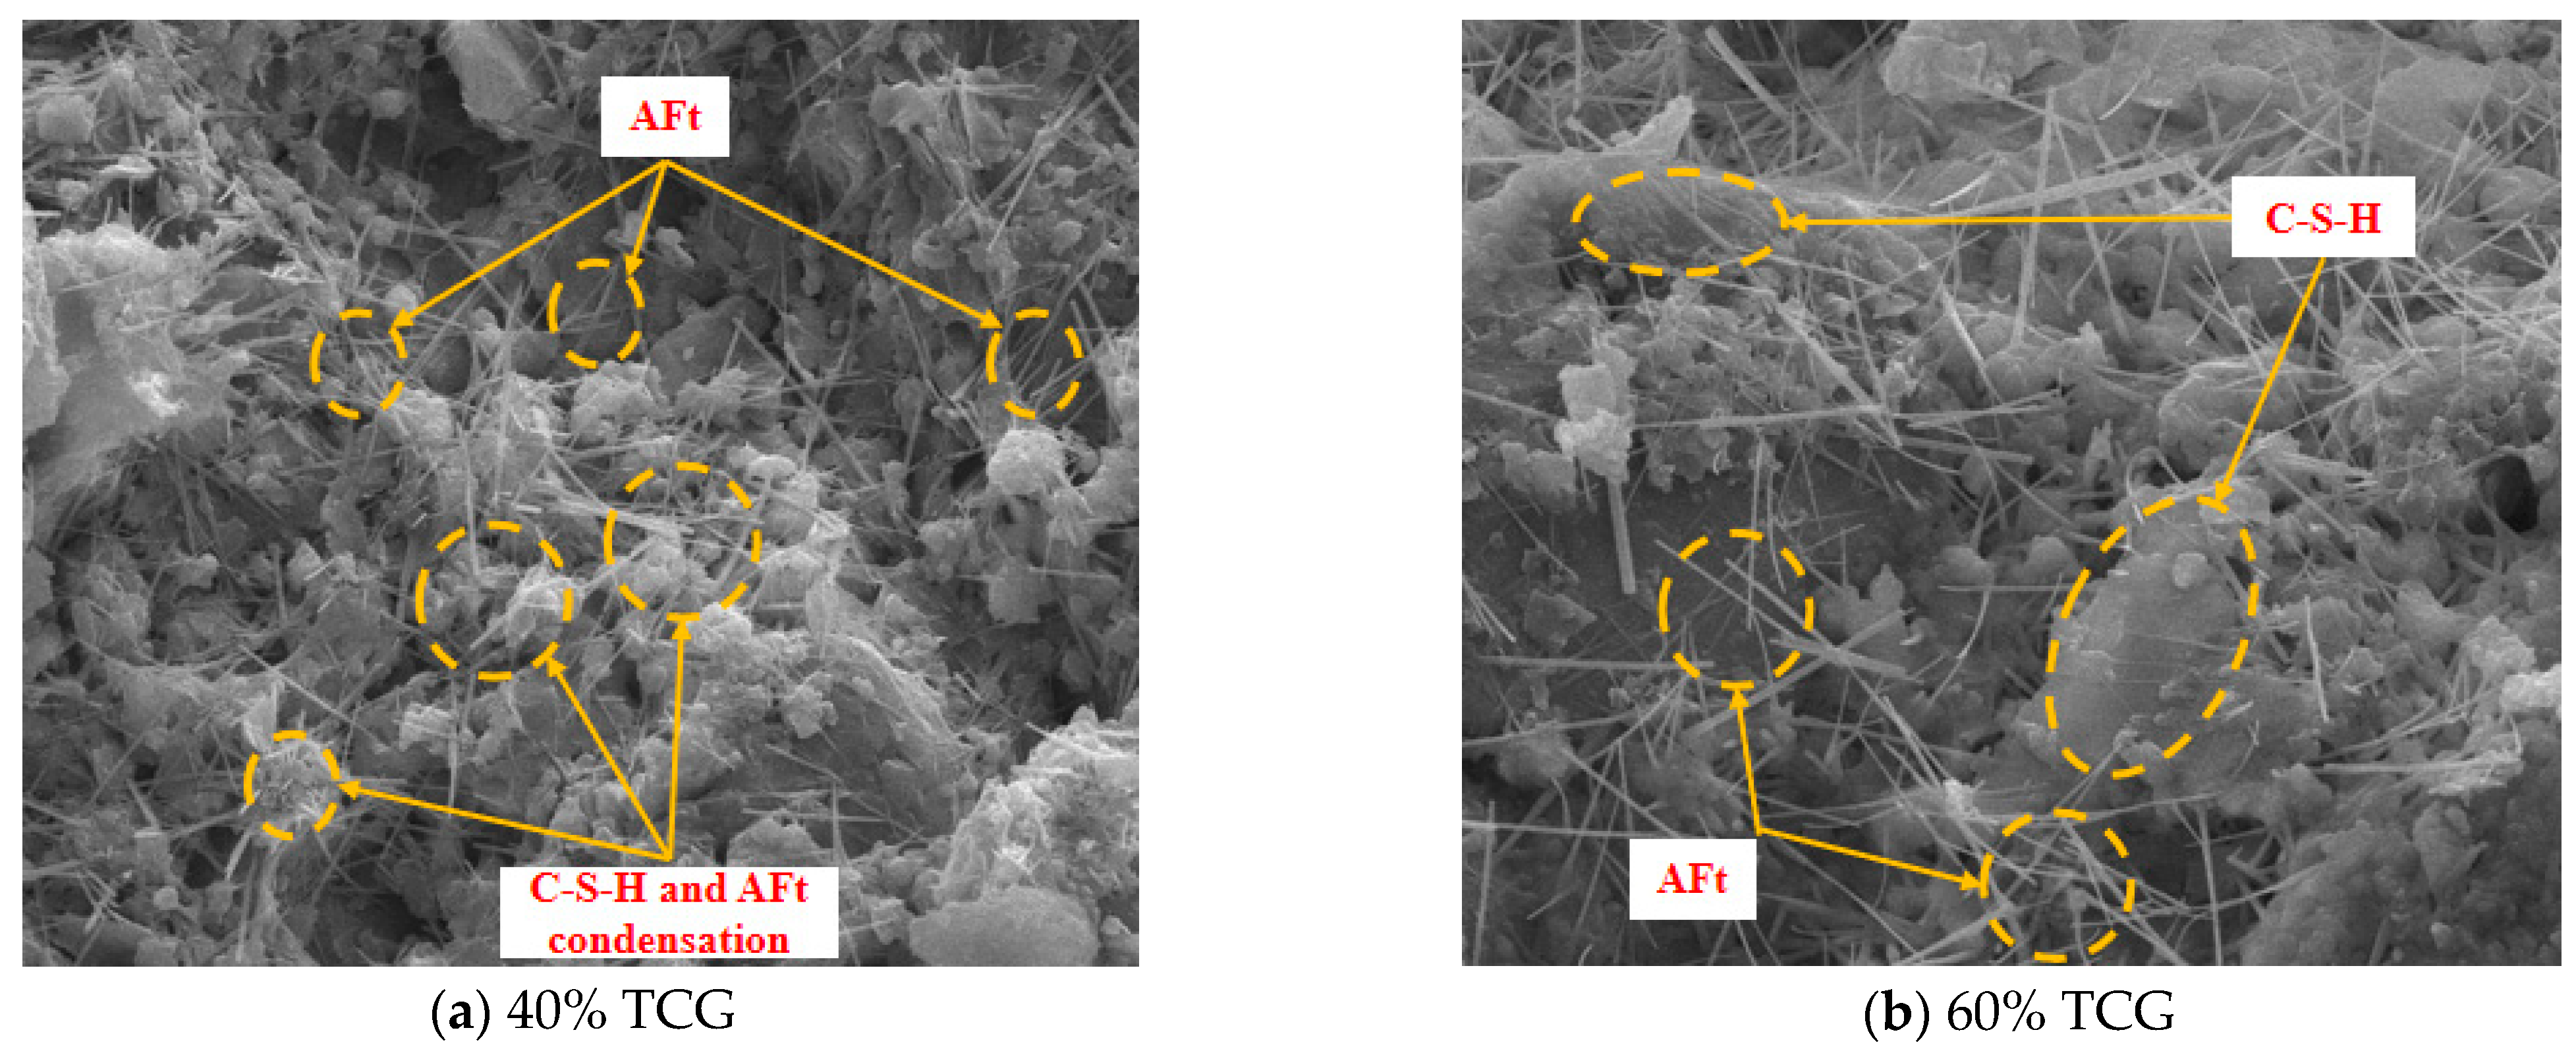
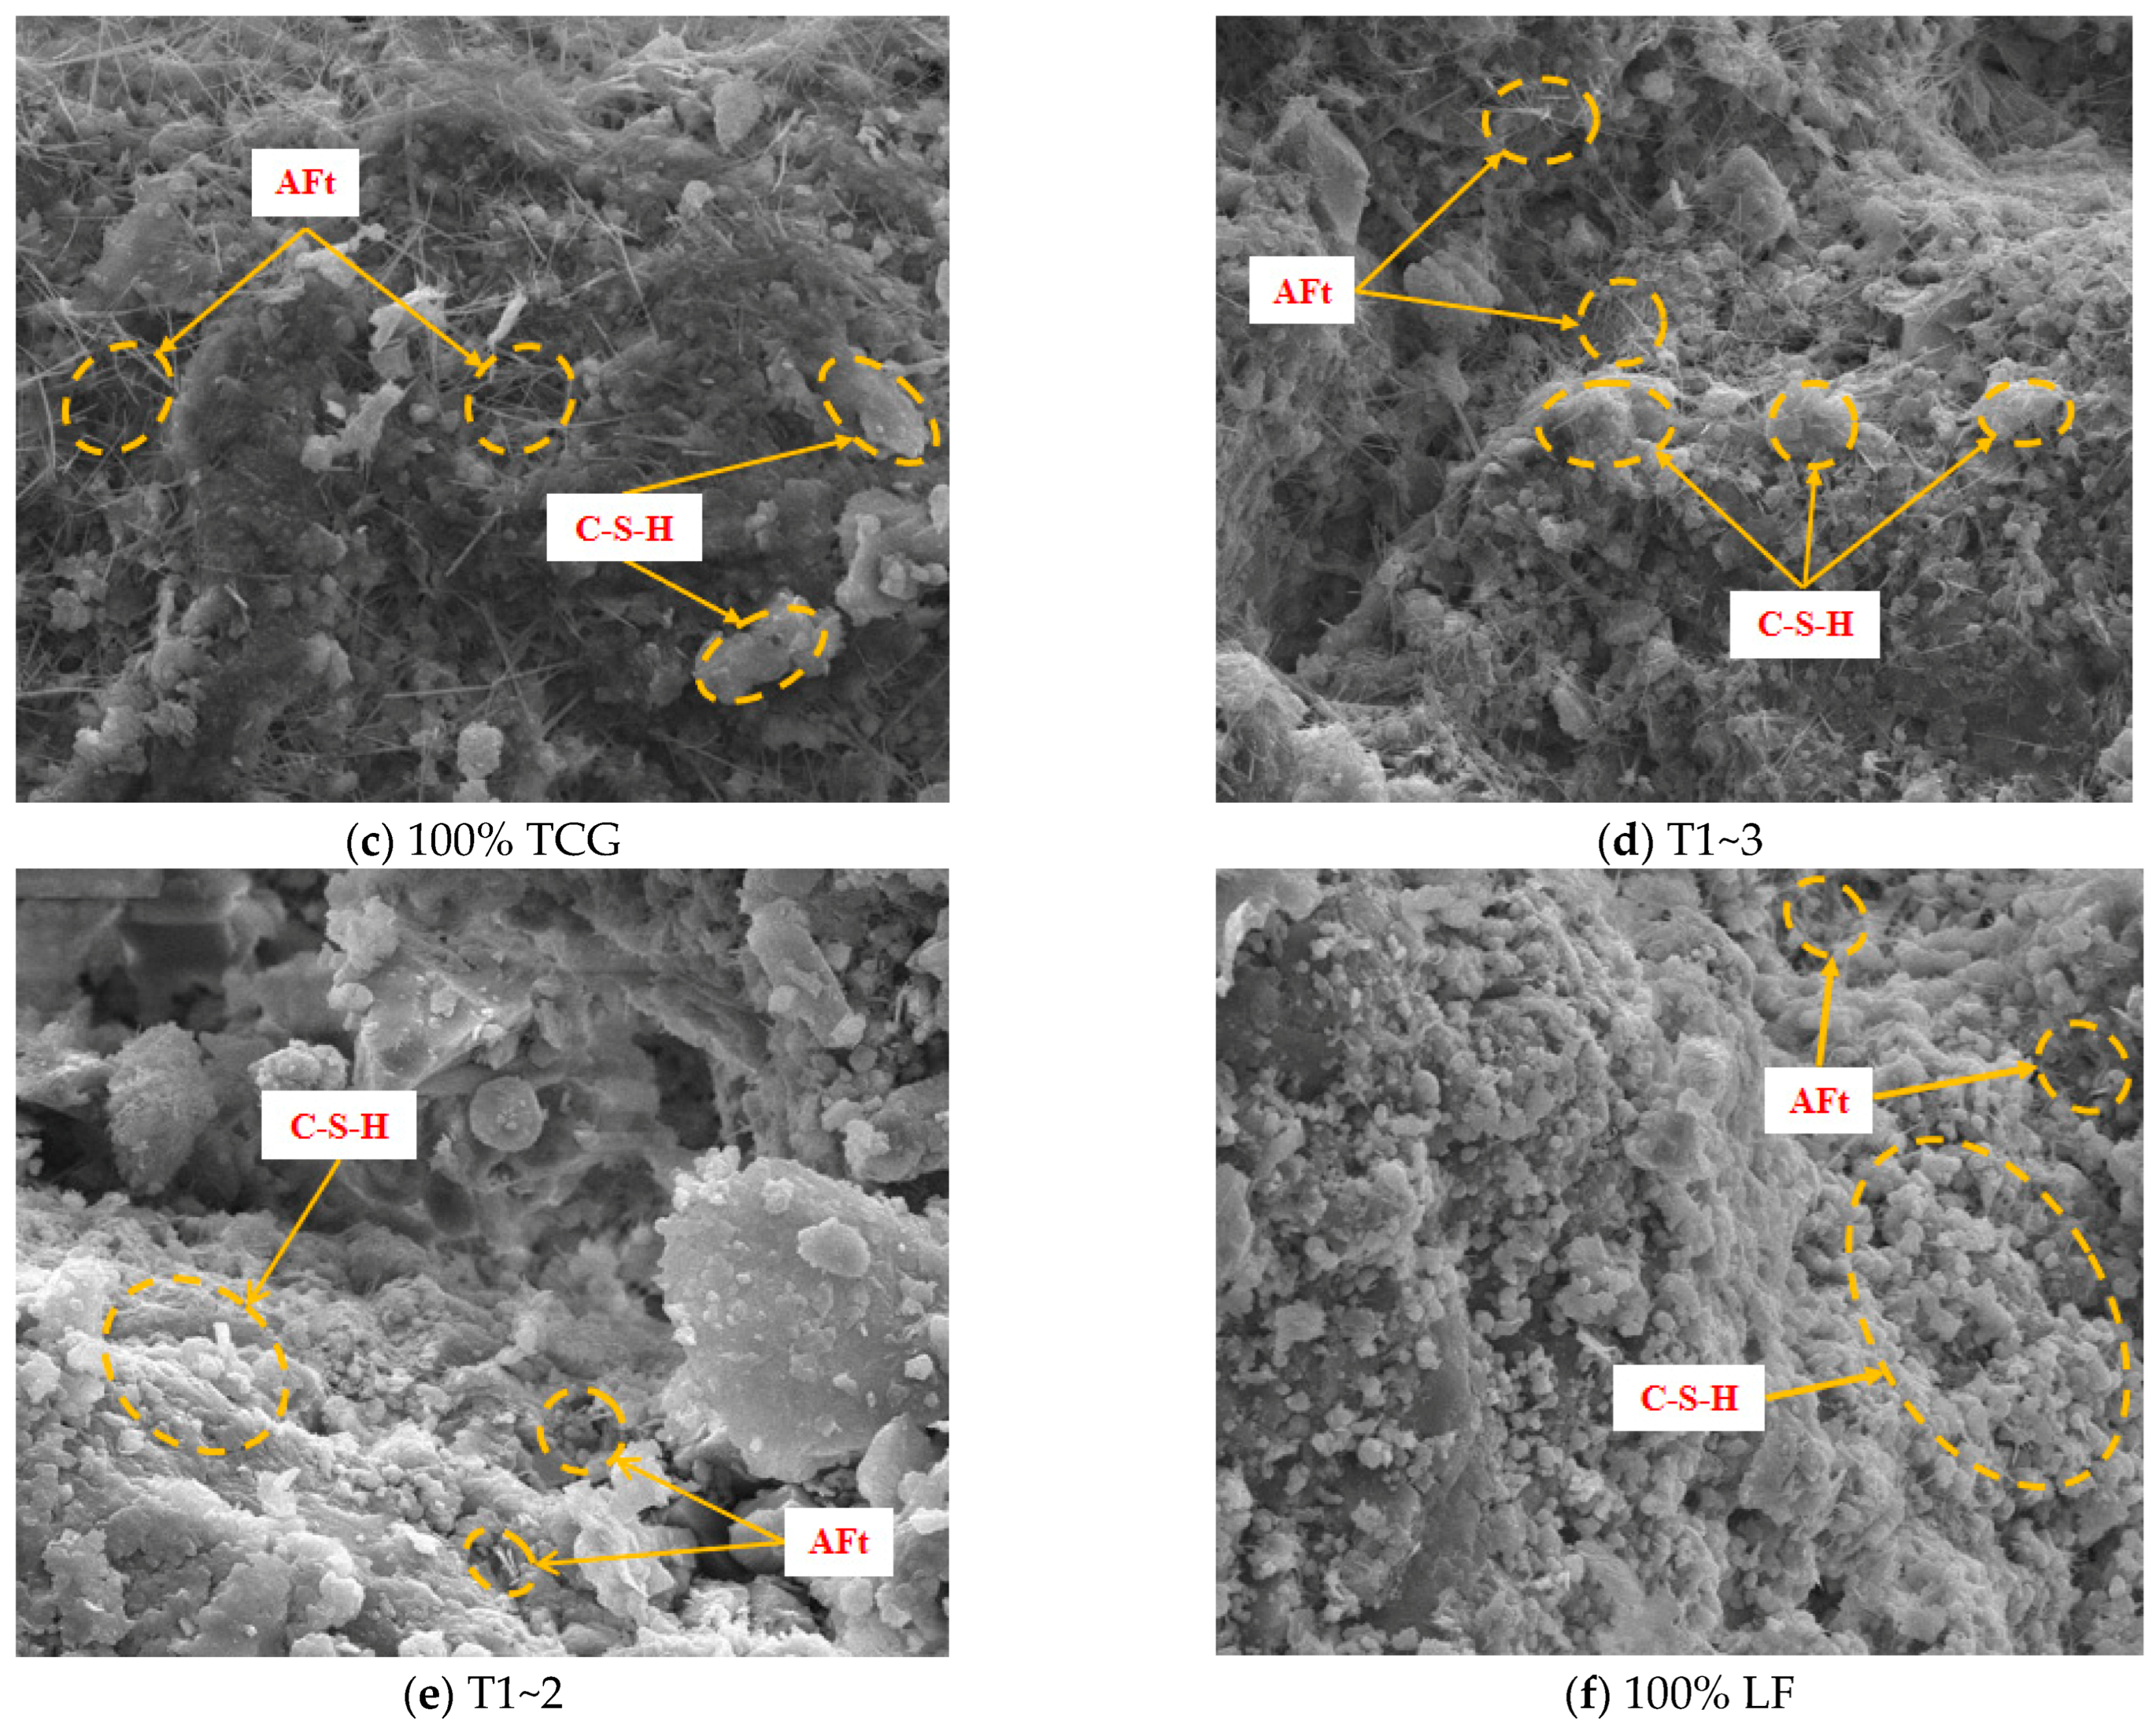
- SEM Analysis
4. Conclusions
- (1)
- The density of coal gangue is comparable to that of gravel, and it exhibits favorable particle gradation. Coal gangue primarily consists of minerals such as quartz, kaolinite, and illite, with a flaky or layered internal structure and some voids. This results in a relatively loose arrangement. The physical and chemical properties of coal gangue satisfy the application requirements for expressway subbase layers under heavy, medium, and light traffic conditions.
- (2)
- As the proportion of coal gangue in the mixture increases, there is a general decrease in UCS, DCRM, FTS, BDR, and fatigue life, while DSS shows an increase. However, over time, particularly with increased curing age, mechanical properties improve. Specifically, the UCS increased by 25.6%, 22.5%, and 19.8% for 60% TCG, 40% TCG, and 100% LF mixtures, respectively, between 28 and 90 days of curing. Both blending methods—proportional and particle size replacement—lead to enhanced fatigue life, with proportional replacement demonstrating better fatigue performance at lower stress ratios. In contrast, particle size replacement notably improves the stress sensitivity of the mixtures, making them more suitable for higher stress ratio conditions.
- (3)
- Coarse coal gangue aggregates have minimal impact on the freeze–thaw resistance of mixtures but significantly weaken the drying shrinkage performance. Replacing coal gangue aggregates of sizes 19~31.5 mm and 9.5~19 mm can significantly enhance the UCS, FTS, and DCRM of the mixtures, while the enhancement effect of replacing aggregates sized 4.75~9.5 mm is not obvious. Fine coal gangue aggregates inhibit early hydration reactions and have a considerable negative impact on freeze–thaw resistance but can benefit the improvement of mechanical performance over time and help mitigate drying shrinkage.
- (4)
- Hydration products of coal–gravel mixtures at 7 d mainly include AFt crystals and zeolite-type crystals, with unreacted C2S and C3S also present. Mixtures with 40% TCG and T1~3 exhibit large areas of C–S–H gel and AFt crystals forming a cohesive gel network, further enhancing the material’s density. A higher proportion of coal gangue leads to a greater quantity of fine aggregates, which slows the hydration reaction.
- (5)
- The evaluation indicators of the DET model for CGMs rank as follows: T1~3 > 100% LF > T1~2 > 40% TCG > 60% TCG > 100% TCG > T4. The comprehensive performance evaluation identified T1~3 as the most favorable mixture, making it the recommended optimal blending scheme for express highway subbases.
Author Contributions
Funding
Institutional Review Board Statement
Informed Consent Statement
Data Availability Statement
Conflicts of Interest
References
- Zhang, Y.; Ling, T.-C. Reactivity activation of waste coal gangue and its impact on the properties of cement-based materials–A review. Constr. Build. Mater. 2020, 234, 117424. [Google Scholar] [CrossRef]
- Li, J.; Wang, J. Comprehensive utilization and environmental risks of coal gangue: A review. J. Clean. Prod. 2019, 239, 117946. [Google Scholar] [CrossRef]
- Ma, H.; Zhu, H.; Wu, C.; Chen, H.; Sun, J.; Liu, J. Study on compressive strength and durability of alkali-activated coal gangue-slag concrete and its mechanism. Powder Technol. 2020, 368, 112–124. [Google Scholar] [CrossRef]
- Moghadam, M.J.; Ajalloeian, R.; Hajiannia, A. Preparation and application of alkali-activated materials based on waste glass and coal gangue: A review. Constr. Build. Mater. 2019, 221, 84–98. [Google Scholar] [CrossRef]
- Fang, Z.; Gao, Y.; He, W.; Zhu, M.; Xia, L.; Yang, P.; Liu, D.; He, J. Carbonation curing of magnesium-coal slag solid waste backfill material: Study on properties of flow, mechanics and carbon sequestration. Case Stud. Constr. Mater. 2024, 20, e03204. [Google Scholar] [CrossRef]
- Nedeljković, M.; Li, Z.; Ye, G. Setting, Strength, and Autogenous Shrinkage of Alkali-Activated Fly Ash and Slag Pastes: Effect of Slag Content. Materials 2018, 11, 2121. [Google Scholar] [CrossRef]
- de Oliveira, L.B.; de Azevedo, A.R.; Marvila, M.T.; Pereira, E.C.; Fediuk, R.; Vieira, C.M.F. Durability of geopolymers with industrial waste. Case Stud. Constr. Mater. 2022, 16, e00839. [Google Scholar]
- Huseien, G.F.; Shah, K.W. Durability and life cycle evaluation of self-compacting concrete containing fly ash as GBFS replacement with alkali activation. Constr. Build. Mater. 2020, 235, 117458. [Google Scholar] [CrossRef]
- Mischinenko, V.; Vasilchenko, A.; Lazorenko, G. Effect of Waste Concrete Powder Content and Microwave Heating Parameters on the Properties of Porous Alkali-Activated Materials from Coal Gangue. Materials 2024, 17, 5670. [Google Scholar] [CrossRef]
- Priyadharshini, P.; Ramamurthy, K.; Robinson, R. Excavated soil waste as fine aggregate in fly ash based geopolymer mortar. Appl. Clay Sci. 2017, 146, 81–91. [Google Scholar] [CrossRef]
- Wu, R.; Dai, S.; Jian, S.; Huang, J.; Tan, H.; Li, B. Utilization of solid waste high-volume calcium coal gangue in autoclaved aerated concrete: Physico-mechanical properties, hydration products and economic costs. J. Clean. Prod. 2021, 278, 123416. [Google Scholar] [CrossRef]
- Liu, H.; Xu, Q.; Wang, Q.; Zhang, Y. Prediction of the elastic modulus of concrete with spontaneous-combustion and rock coal gangue aggregates. Structures 2020, 28, 774–785. [Google Scholar] [CrossRef]
- Peng, B.; Guo, D.; Qiao, H.; Yang, Q.; Zhang, B.; Hayat, T.; Alsaedi, A.; Ahmad, B. Bibliometric and visualized analysis of China’s coal research 2000–2015. J. Clean. Prod. 2018, 197, 1177–1189. [Google Scholar] [CrossRef]
- Long, G.; Li, L.; Li, W.; Ma, K.; Dong, W.; Bai, C.; Zhou, J.L. Enhanced mechanical properties and durability of coal gangue reinforced cement-soil mixture for foundation treatments. J. Clean. Prod. 2019, 231, 468–482. [Google Scholar] [CrossRef]
- Liu, C.; Deng, X.; Liu, J.; Hui, D. Mechanical properties and microstructures of hypergolic and calcined coal gangue based geopolymer recycled concrete. Constr. Build. Mater. 2019, 221, 691–708. [Google Scholar] [CrossRef]
- Jiao, Y.; Qiao, J.; Jia, R.; Wei, P.; Li, Y.; Ke, G. The influence of carbon imperfections on the physicochemical characteristics of coal gangue aggregates. Constr. Build. Mater. 2023, 409, 133965. [Google Scholar] [CrossRef]
- Li, D.; Wu, D.; Xu, F.; Lai, J.; Shao, L. Literature overview of Chinese research in the field of better coal utilization. J. Clean. Prod. 2018, 185, 959–980. [Google Scholar] [CrossRef]
- Frasson, B.J.; Rocha, J.C. Drying shrinkage behavior of geopolymer mortar based on kaolinitic coal gangue. Case Stud. Constr. Mater. 2023, 18, e01957. [Google Scholar] [CrossRef]
- Gao, S.; Zhao, G.; Guo, L.; Zhou, L.; Yuan, K. Utilization of coal gangue as coarse aggregates in structural concrete. Constr. Build. Mater. 2021, 268, 121212. [Google Scholar] [CrossRef]
- Guan, J.; Lu, M.; Yao, X.; Wang, Q.; Wang, D.; Yang, B.; Liu, H. An experimental study of the road performance of cement stabilized coal gangue. Crystals 2021, 11, 993. [Google Scholar] [CrossRef]
- Cao, D.; Ji, J.; Liu, Q.; He, Z.; Wang, H.; You, Z. Coal gangue applied to low-volume roads in China. Transp. Res. Rec. 2011, 2204, 258–266. [Google Scholar] [CrossRef]
- Zhou, M.; Dou, Y.; Zhang, Y.; Zhang, Y.; Zhang, B. Effects of the variety and content of coal gangue coarse aggregate on the mechanical properties of concrete. Constr. Build. Mater. 2021, 220, 386–395. [Google Scholar] [CrossRef]
- Guan, X.; Qiu, J.; Song, H.; Qin, Q.; Zhang, C. Stress–strain behaviour and acoustic emission characteristic of gangue concrete under axial compression in frost environment. Constr. Build. Mater. 2019, 220, 476–488. [Google Scholar] [CrossRef]
- Li, Y.; Liu, S.; Guan, X. Multitechnique investigation of concrete with coal gangue. Constr. Build. Mater. 2021, 301, 124114. [Google Scholar] [CrossRef]
- Gao, S.; Zhang, S.; Guo, L. Application of coal gangue as a coarse aggregate in green concrete production: A review. Materials 2021, 14, 6803. [Google Scholar] [CrossRef]
- Zhu, C.; Zhang, S.; Liu, C.; Dang, Q.; Bai, G. Study on the properties of recycled concrete mixed with coal gangue: Mechanics, workability and microstructure. J. Build. Eng. 2024, 98, 111065. [Google Scholar] [CrossRef]
- Yu, L.; Xia, J.; Xia, Z.; Chen, M.; Wang, J.; Zhang, Y. Study on the mechanical behavior and micro-mechanism of concrete with coal gangue fine and coarse aggregate. Constr. Build. Mater. 2022, 338, 127626. [Google Scholar] [CrossRef]
- Vyas, V.; Singh, A.P.; Srivastava, A. Prediction of asphalt pavement condition using FWD deflection basin parameters and artificial neural networks. Road Mater. Pavement Des. 2021, 22, 2748–2766. [Google Scholar] [CrossRef]
- Xu, G.; Yang, W.; Huang, Y. The application of fuzzy mathematical method in the evaluation of the steel slag utilization. Procedia Environ. Sci. 2016, 31, 668–674. [Google Scholar] [CrossRef]
- Wu, Y. Study on the Index System of Green Ecological Building and Its Evaluation. In Proceedings of the IOP Conference Series: Earth and Environmental Science, Singapore, 22–25 December 2017; Volume 100, p. 012097. [Google Scholar]
- Luo, C.; Ju, Y.; Giannakis, M.; Dong, P.; Wang, A. A novel methodology to select sustainable municipal solid waste management scenarios from three-way decisions perspective. J. Clean. Prod. 2021, 280, 124312. [Google Scholar] [CrossRef]
- Jin, R.; Wang, L.; Zhang, T.; Li, Q. Bridge Construction Quality Evaluation Based on Combination Weighting Method-Technique for Order Preference by Similarity to an Ideal Solution Theory. Appl. Sci. 2023, 13, 12018. [Google Scholar] [CrossRef]
- JTG/T E42-2005; Test Code for Aggregates in Highway Engineering. China Communications Press: Beijing, China, 2005.
- JTG E51-2009; Test Code for Inorganic Stabilized Materials in Highway Engineering. China Communications Press: Beijing, China, 2009.
- JTG F20-2015; Technical Specifications for Construction of Highway Pavement Base Courses China Communications Press: Beijing, China, 2015.
- GB/T 176-2011; Methods for Chemical Analysis of Cement. Standards Press of China: Beijing, China, 2011.
- ASTM D4318; Standard Test Methods for Liquid Limit, Plastic Limit, and Plasticity Index of Soils. ASTM International: West Conshohocken, PA, USA, 2017.
- Gu, X.-B.; Wang, L.; Wu, Q.-H. The risk assessment of debris flow in the duba river watershed using intuitionistic fuzzy sets: TOPSIS model. Math. Probl. 2022, 2022, 2031907. [Google Scholar] [CrossRef]
- Wang, Y.; Zhai, R.; Sun, B.; Liu, J.; Hao, P. Microcapsule synthesis and evaluation on fatigue and healing of microcapsule-based asphalt by the entropy and TOPSIS method. Int. J. Pavement Eng. 2022, 23, 4610–4621. [Google Scholar] [CrossRef]
- Warda, M.A.; Ahmad, S.S.E.; Mahdi, I.M.; Sallam, H.E.-D.M.; Khalil, H.S. The applicability of TOPSIS-and fuzzy TOPSIS-based Taguchi optimization approaches in obtaining optimal fiber-reinforced concrete mix proportions. Buildings 2022, 12, 796. [Google Scholar] [CrossRef]
- Zhang, J.; Zhang, Z.H.; Li, X.D.; Sun, Q.; Qiao, W. Military transport capacity evaluation of ports using entropy weight and TOPSIS. Tsinghua Sci. Technol. 2018, 58, 494–499. [Google Scholar]
- Feng, X.M.; Qin, Z.; Wu, J.M.; Zhang, H.C.; Zuo, S.; He, H.T. Influence of high brightness pavement layer on driving safety in middle section of tunnel. J. Chang. Univ. (Nat. Sci. Ed.) 2023, 43, 92–100. [Google Scholar]
- Ji, X.P.; Cao, H.L.; Liu, L.Q. Performances and Influencing Factors of Cement Stabilized Recycled Concrete Aggregate. J. Build. Mater. 2016, 19, 342–346. [Google Scholar]
- Chen, P.; Zhang, L.; Wang, Y.; Fang, Y.; Zhang, F.; Xu, Y. Environmentally friendly utilization of coal gangue as aggregates for shotcrete used in the construction of coal mine tunnel. Case Stud. Constr. Mater. 2021, 15, e00751. [Google Scholar] [CrossRef]
- Li, S.W.; Zhou, M.; Zhang, L.M. Properties of spontaneous combustion coal gangue coarse aggregate and its influence on concrete. J. Build. Mater. 2020, 23, 334–340. [Google Scholar]
- Luo, D.; Wang, Y.; Zhang, S.; Niu, D.; Song, Z. Frost resistance of coal gangue aggregate concrete modified by steel fiber and slag powder. Appl. Sci. 2020, 10, 3229. [Google Scholar] [CrossRef]


| Index | Material Specification | Standard | Testing Standard | Testing Method | ||
|---|---|---|---|---|---|---|
| 19~31.5 mm | 9.5~19 mm | 4.75~9.5 mm | ||||
| Apparent density (g/cm3) | 2.578 | 2.573 | 2.572 | — | JTG/T E42-2005 [33] | T 0304-2005 [33] Wire Basket Method |
| Water absorption (%) | 1.68 | 2.14 | 2.66 | — | JTG/T E42-2005 | T 0304-2005 Wire Basket Method |
| Needle sheet content (%) | 15.6 | 10.3 | 13.8 | — | JTG/T E42-2005 | T 0312-2022 [33] Vernier Caliper Method |
| Disintegration resistance index (%) | 99.1 | — | JTG E51-2009 [34] | T 0843-2009 [34] Unconfined Compressive Strength Test | ||
| Crushing value (%) | 23.7 | ≤26 | JTG F20-2015 [35] | T 0316-2005 [35] Crushed Value Test for Coarse Aggregates | ||
| Loss on ignition (%) | 8.9 | ≤10 | GB/T 176-2011 [36] | GB/T 176-2011 [36] Loss on Ignition Test | ||
| Liquid and plastic limit (%) | 11.6 | ≤17 | ASTM D4318 [37] | T 0118-2007 [37] Combined Determination of Liquid Limit and Plastic Limit | ||
| Oxide Type | SiO2 | Al2O3 | CaO | Fe2O3 | K2O | MgO |
|---|---|---|---|---|---|---|
| Content (%) | 47.02 | 21.37 | 5.85 | 4.00 | 2.38 | 1.03 |
| Index | Material Specification | Standard | Testing Standard | Testing Method | ||
|---|---|---|---|---|---|---|
| 19~31.5 mm | 9.5~19 mm | 4.75~9.5 mm | ||||
| Apparent density (g/cm3) | 2.684 | 2.650 | 2.632 | — | JTG/T E42-2005 | T 0304-2005 Wire Basket Method |
| Water absorption (%) | 0.46 | 0.72 | 0.97 | — | JTG/T E42-2005 | T 0304-2005 Wire Basket Method |
| Needle sheet content (%) | 5.4 | 7.2 | 6.2 | — | JTG/T E42-2005 | T 0312-2022 Vernier Caliper Method |
| Crushing value (%) | 21.2 | ≤26 | JTG F20-2015 | T 0316-2005 Crushed Value Test for Coarse Aggregates | ||
| Test Items | Test Results | Standard | Test Method | |
|---|---|---|---|---|
| Fineness (%) | 6.7 | ≤10 | T0502-2005 | |
| Initial setting time (min) | 210 | ≥180 | T0505-2020 | |
| Final setting time (min) | 480 | 360~600 | T0505-2020 | |
| Stability (mm) | 1.5 | ≤5.0 | T0505-2020 | |
| Flexural strength (MPa) | 7 d | 4.8 | ≥3.5 | T0506-2005 |
| 28 d | 8.2 | ≥6.5 | ||
| Compressive strength (MPa) | 7 d | 24.3 | ≥17 | T0506-2005 |
| 28 d | 50.5 | ≥42.5 | ||
| Sieve Size (mm) | Range of Grading | Median | Composite Gradation |
|---|---|---|---|
| 31.5 | 100~100 | 100.0 | 100 |
| 19 | 68~86 | 77.0 | 74.7 |
| 9.5 | 38~58 | 48.0 | 48.9 |
| 4.75 | 22~32 | 27.0 | 28.4 |
| 2.36 | 16~28 | 22.0 | 19.7 |
| 0.6 | 8~15 | 11.5 | 9.4 |
| 0.075 | 0~3 | 1.5 | 1.7 |
| Mixing Type | Replace Method | Number | |||
|---|---|---|---|---|---|
| 19~31.5 mm | 9.5~19 mm | 4.75~9.5 mm | 0~4.75 mm | ||
| Particle size replacement | LF | TCG | TCG | TCG | T1 |
| LF | LF | TCG | TCG | T1~2 | |
| LF | LF | LF | TCG | T1~3 | |
| TCG | TCG | TCG | LF | T4 | |
| Proportional replacement | 80% TCG + 20% LF | 80% TCG | |||
| 60% TCG + 40% LF | 60% TCG | ||||
| 40% TCG + 60% LF | 40% TCG | ||||
| 20% TCG + 80% LF | 20% TCG | ||||
| Control group | 100% TCG | 100% TCG | |||
| 100% LF | 100% LF | ||||
| Type of Mixture | Proportion of Coal Gangue (%) | Percentage of Limestone (%) | Total Price (RMB/t) |
|---|---|---|---|
| 40% TCG | 40 | 60 | 80 |
| 60% TCG | 60 | 40 | 65 |
| 100% TCG | 100 | 0 | 74 |
| 100% LF | 0 | 100 | 89 |
| T1~2 | 52 | 48 | 56 |
| T1~3 | 28 | 72 | 35 |
| T4 | 72 | 28 | 110 |
| Energy Consumption Indicators | 40% TCG | 60% TCG | 100% TCG | 100% LF | T1~2 | T1~3 | T4 | AVG | STDEV |
|---|---|---|---|---|---|---|---|---|---|
| Raw material production | 32.668 | 32.542 | 32.29 | 32.92 | 32.59 | 32.74 | 32.47 | 32.6 | 0.2 |
| Raw material transportation | 23.39 | 23.39 | 23.39 | 23.39 | 23.39 | 23.39 | 23.39 | 23.39 | 0 |
| Mixture production | 309.308 | 311.712 | 316.52 | 304.5 | 310.75 | 307.87 | 313.16 | 310.55 | 3.86 |
| Mixture transportation | 9.04 | 9.11 | 9.25 | 8.9 | 9.082 | 9 | 8.9 | 9.04 | 0.12 |
| Construction phase | 61.232 | 60.628 | 59.42 | 62.44 | 60.87 | 61.6 | 60.26 | 60.92 | 0.97 |
| Total EC (MJ/t) | 435.638 | 437.382 | 440.87 | 432.15 | 436.182 | 434.59 | 438.432 | 436.46 | 2.8 |
| Performance | 40% TCG | 60% TCG | T1~2 | T1~3 | T4 | 100% TCG | 100% LF | AVG | STDEV |
|---|---|---|---|---|---|---|---|---|---|
| UCS (Mpa) | 4.57 | 4.40 | 4.54 | 4.67 | 3.84 | 3.19 | 5.39 | 4.37 | 0.69 |
| FTS (Mpa) | 1.31 | 1.18 | 1.30 | 1.38 | 1.18 | 1.04 | 1.54 | 1.28 | 0.16 |
| DCRM (Mpa) | 9092 | 7657 | 8053 | 8813 | 7368 | 6590 | 9840 | 8201.86 | 1115.18 |
| BDR (%) | 83.40 | 79.55 | 75.77 | 77.73 | 81.51 | 72.10 | 86.64 | 79.53 | 4.87 |
| DSS (10−6) | 470.1 | 557.5 | 361.2 | 322.6 | 695.3 | 598.2 | 407.2 | 212.86 | 135.54 |
| Fatigue life (cycles) | 8746 | 4690 | 6282 | 11834 | 3579 | 1743 | 13577 | 7207.29 | 4369.65 |
| Material cost | 80 | 65 | 74 | 89 | 56 | 35 | 110 | 42.29 | 24.05 |
| Total EC (MJ/t) | 374.42 | 376.75 | 375.2 | 373 | 378.1 | 381.45 | 369.71 | 10.92 | 3.76 |
| Performance | 40% TCG | 60% TCG | T1~2 | T1~3 | T4 | 100% TCG | 100% LF | AVG | STDEV |
|---|---|---|---|---|---|---|---|---|---|
| UCS (Mpa) | 0.29 | 0.04 | 0.24 | 0.43 | −0.77 | −1.71 | 1.47 | 1 | 0 |
| FTS (Mpa) | 0.21 | −0.59 | 0.15 | 0.65 | −0.59 | −1.46 | 1.64 | 1 | 0 |
| DCRM Mpa) | 0.80 | −0.49 | −0.13 | 0.55 | −0.75 | −1.45 | 1.47 | 1 | 0 |
| BDR (%) | 0.80 | 0.00 | −0.77 | −0.37 | 0.41 | −1.53 | 1.46 | 1 | 0 |
| DSS (10−6) | 0.13 | −0.52 | 0.93 | 1.22 | −1.53 | −0.82 | 0.59 | 1 | 0 |
| Fatigue life (cycles) | 0.35 | −0.58 | −0.21 | 1.06 | −0.83 | −1.25 | 1.46 | 1 | 0 |
| Material cost | −0.30 | 0.32 | −0.05 | -0.68 | 0.69 | 1.57 | −1.55 | 1 | 0 |
| Total EC (MJ/t) | 0.30 | −0.32 | 0.08 | 0.67 | −0.70 | −1.57 | 1.55 | 1 | 0 |
| Weight Values | UCS (Mpa) | FTS (Mpa) | DCRM (Mpa) | BDR (%) | DSS (10−6) | Fatigue Life (Cycles) | Material Cost | Total EC (MJ/t) |
|---|---|---|---|---|---|---|---|---|
| Delphi method | 0.143 | 0.119 | 0.110 | 0.104 | 0.135 | 0.113 | 0.137 | 0.140 |
| Entropy weight method | 0.135 | 0.135 | 0.135 | 0.136 | 0.104 | 0.113 | 0.113 | 0.129 |
| Delphi–entropy combination method | 0.154 | 0.129 | 0.119 | 0.113 | 0.113 | 0.102 | 0.124 | 0.145 |
| Type of Mixture | DET Scores | Performance Ranking | Type of Mixture |
|---|---|---|---|
| 40% TCG | 0.53915 | The comprehensive performance ranking of the seven kinds of mixtures (from high to low) | T1~3 |
| 60% TCG | 0.43688 | 100% LF | |
| T1~2 | 0.56786 | T1~2 | |
| T1~3 | 0.62454 | 40% TCG | |
| T4 | 0.37380 | 60% TCG | |
| 100% TCG | 0.42945 | 100% TCG | |
| 100% LF | 0.57455 | T4 |
Disclaimer/Publisher’s Note: The statements, opinions and data contained in all publications are solely those of the individual author(s) and contributor(s) and not of MDPI and/or the editor(s). MDPI and/or the editor(s) disclaim responsibility for any injury to people or property resulting from any ideas, methods, instructions or products referred to in the content. |
© 2025 by the authors. Licensee MDPI, Basel, Switzerland. This article is an open access article distributed under the terms and conditions of the Creative Commons Attribution (CC BY) license (https://creativecommons.org/licenses/by/4.0/).
Share and Cite
Wang, D.; Wang, B.; Wu, Z.; Wei, J.; Wang, R.; Wu, J.; Ding, S. Optimum Mix of Tunneling Coal Gangue as a Highway Base Material Through Delphi–Entropy Weight–TOPSIS and Microstructure Analysis. Materials 2025, 18, 2191. https://doi.org/10.3390/ma18102191
Wang D, Wang B, Wu Z, Wei J, Wang R, Wu J, Ding S. Optimum Mix of Tunneling Coal Gangue as a Highway Base Material Through Delphi–Entropy Weight–TOPSIS and Microstructure Analysis. Materials. 2025; 18(10):2191. https://doi.org/10.3390/ma18102191
Chicago/Turabian StyleWang, Decai, Baiyu Wang, Zongyuan Wu, Jiawei Wei, Riran Wang, Jingjiang Wu, and Shenzhen Ding. 2025. "Optimum Mix of Tunneling Coal Gangue as a Highway Base Material Through Delphi–Entropy Weight–TOPSIS and Microstructure Analysis" Materials 18, no. 10: 2191. https://doi.org/10.3390/ma18102191
APA StyleWang, D., Wang, B., Wu, Z., Wei, J., Wang, R., Wu, J., & Ding, S. (2025). Optimum Mix of Tunneling Coal Gangue as a Highway Base Material Through Delphi–Entropy Weight–TOPSIS and Microstructure Analysis. Materials, 18(10), 2191. https://doi.org/10.3390/ma18102191