
The Influence of Fly Ash Carbonation on the Protective Properties of Concrete Cover Towards Reinforcement

 ,
,  , , ,
, , ,
Abstract
1. Introduction
2. Materials and Methods
2.1. Mixture Design and Specimen Preparation
2.2. CO2 Sequestration Process
2.3. CO2 Uptake Measurement
2.3.1. TGA
2.3.2. XRD
2.3.3. SEM
2.4. Mortar and Concrete Characterization
2.4.1. Compressive Strength Test
2.4.2. Determination of pH
2.4.3. Resistance to Weathering Carbonation
2.4.4. EIS Analysis
2.4.5. The Diffusion of Chloride Ions in Concrete
2.4.6. Service Life Reinforced Concrete Structures—Modeling
3. Results and Discussion
3.1. CO2 Uptake and Carbonation Product
3.1.1. TGA
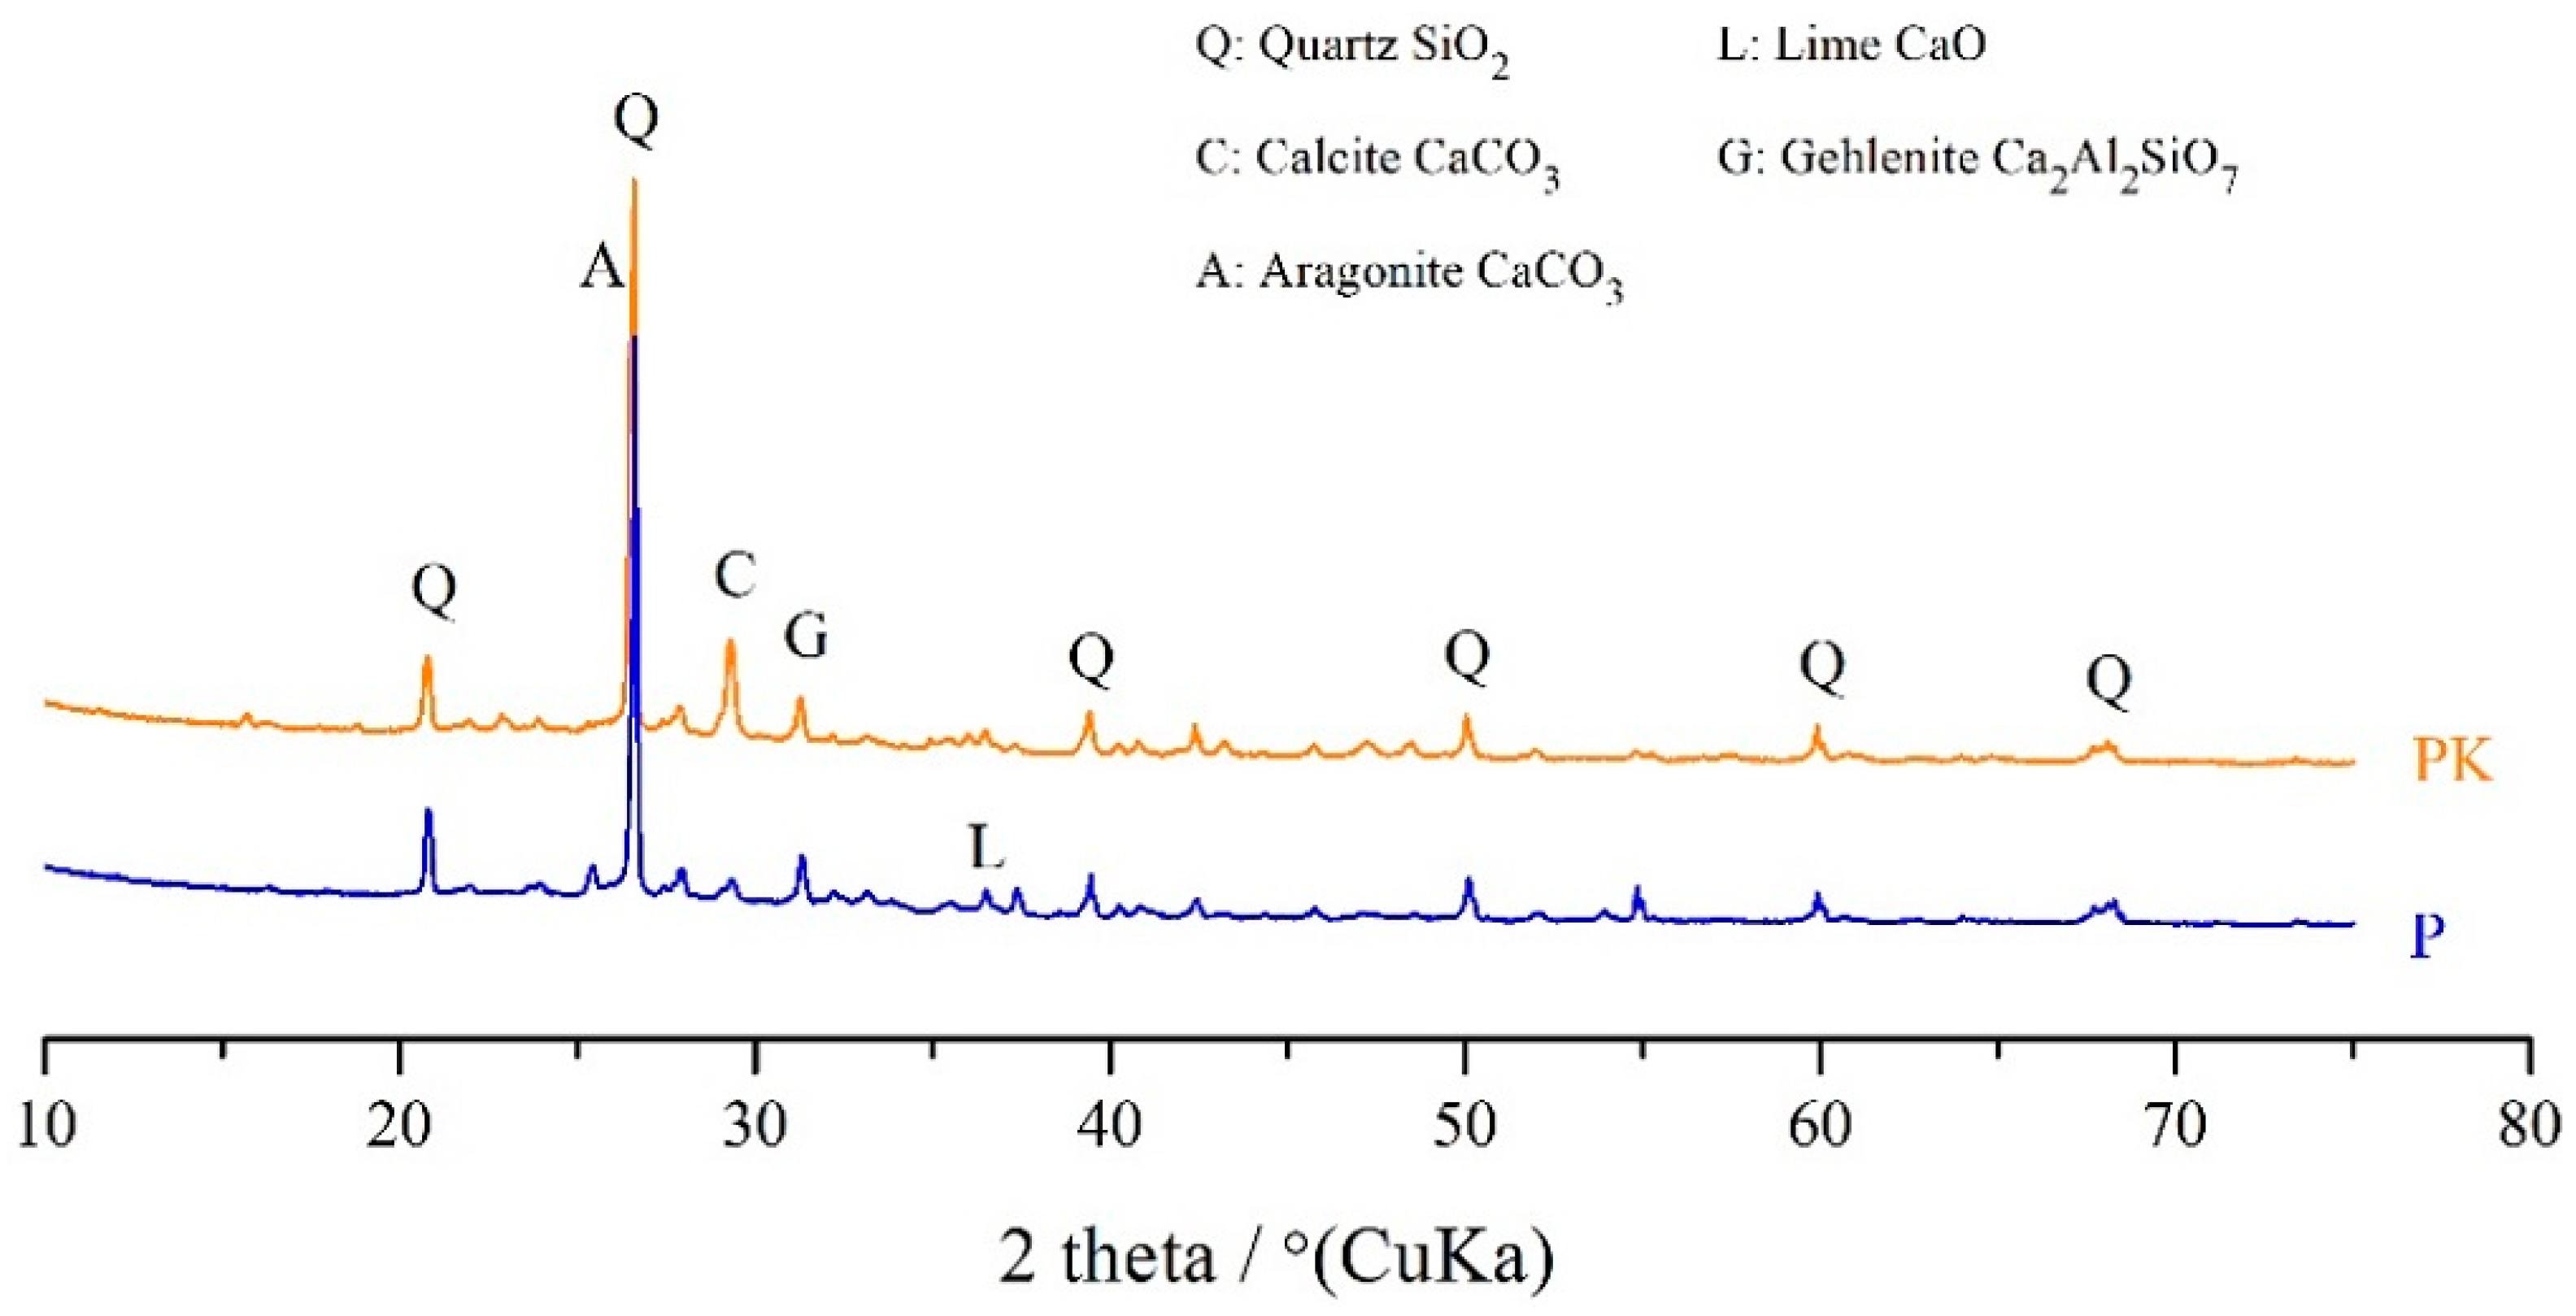
3.1.2. XRD
3.1.3. Mass Gain and LOI
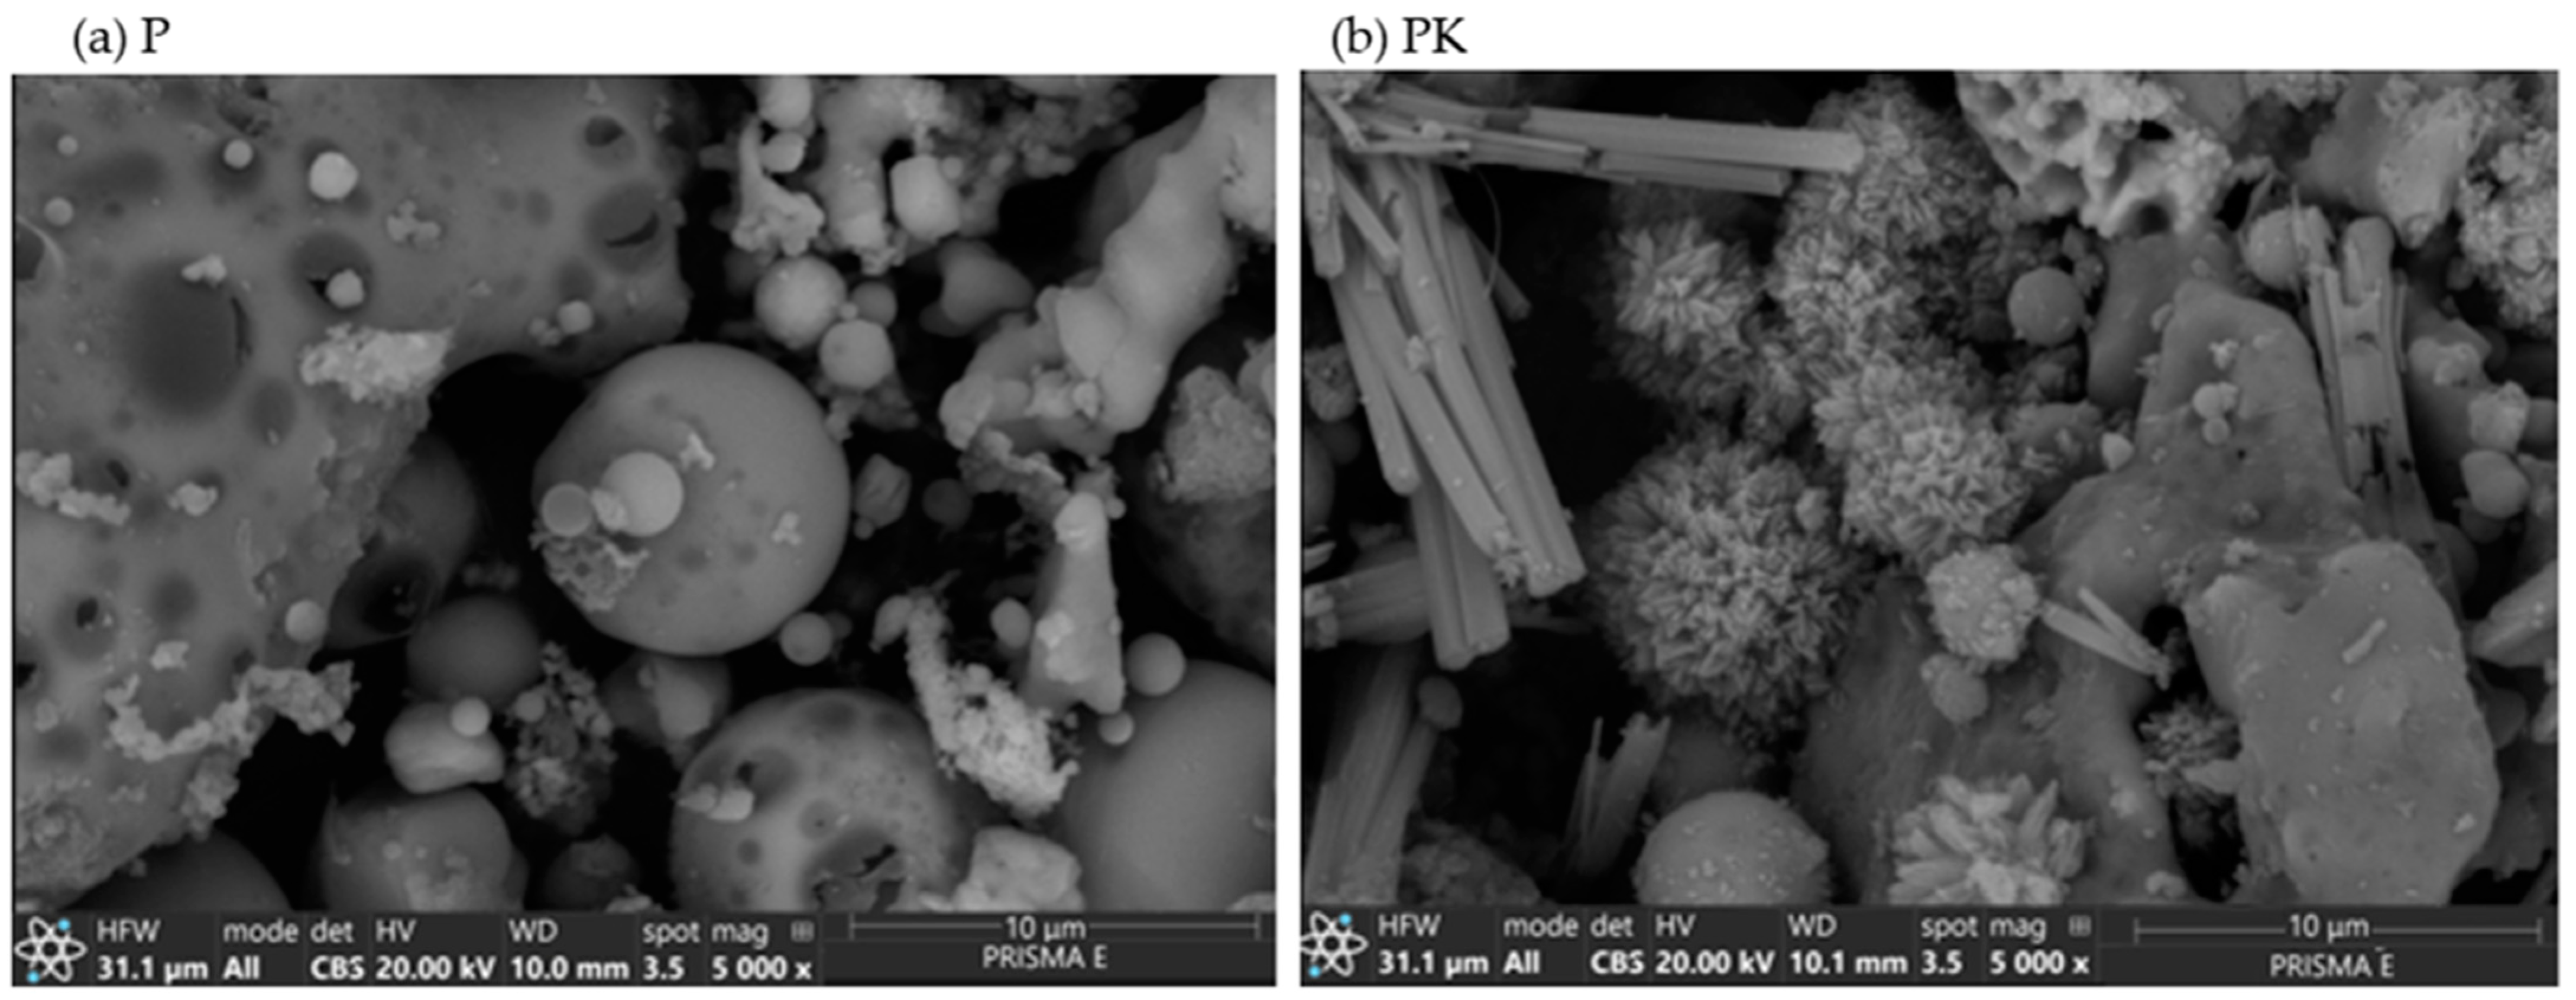
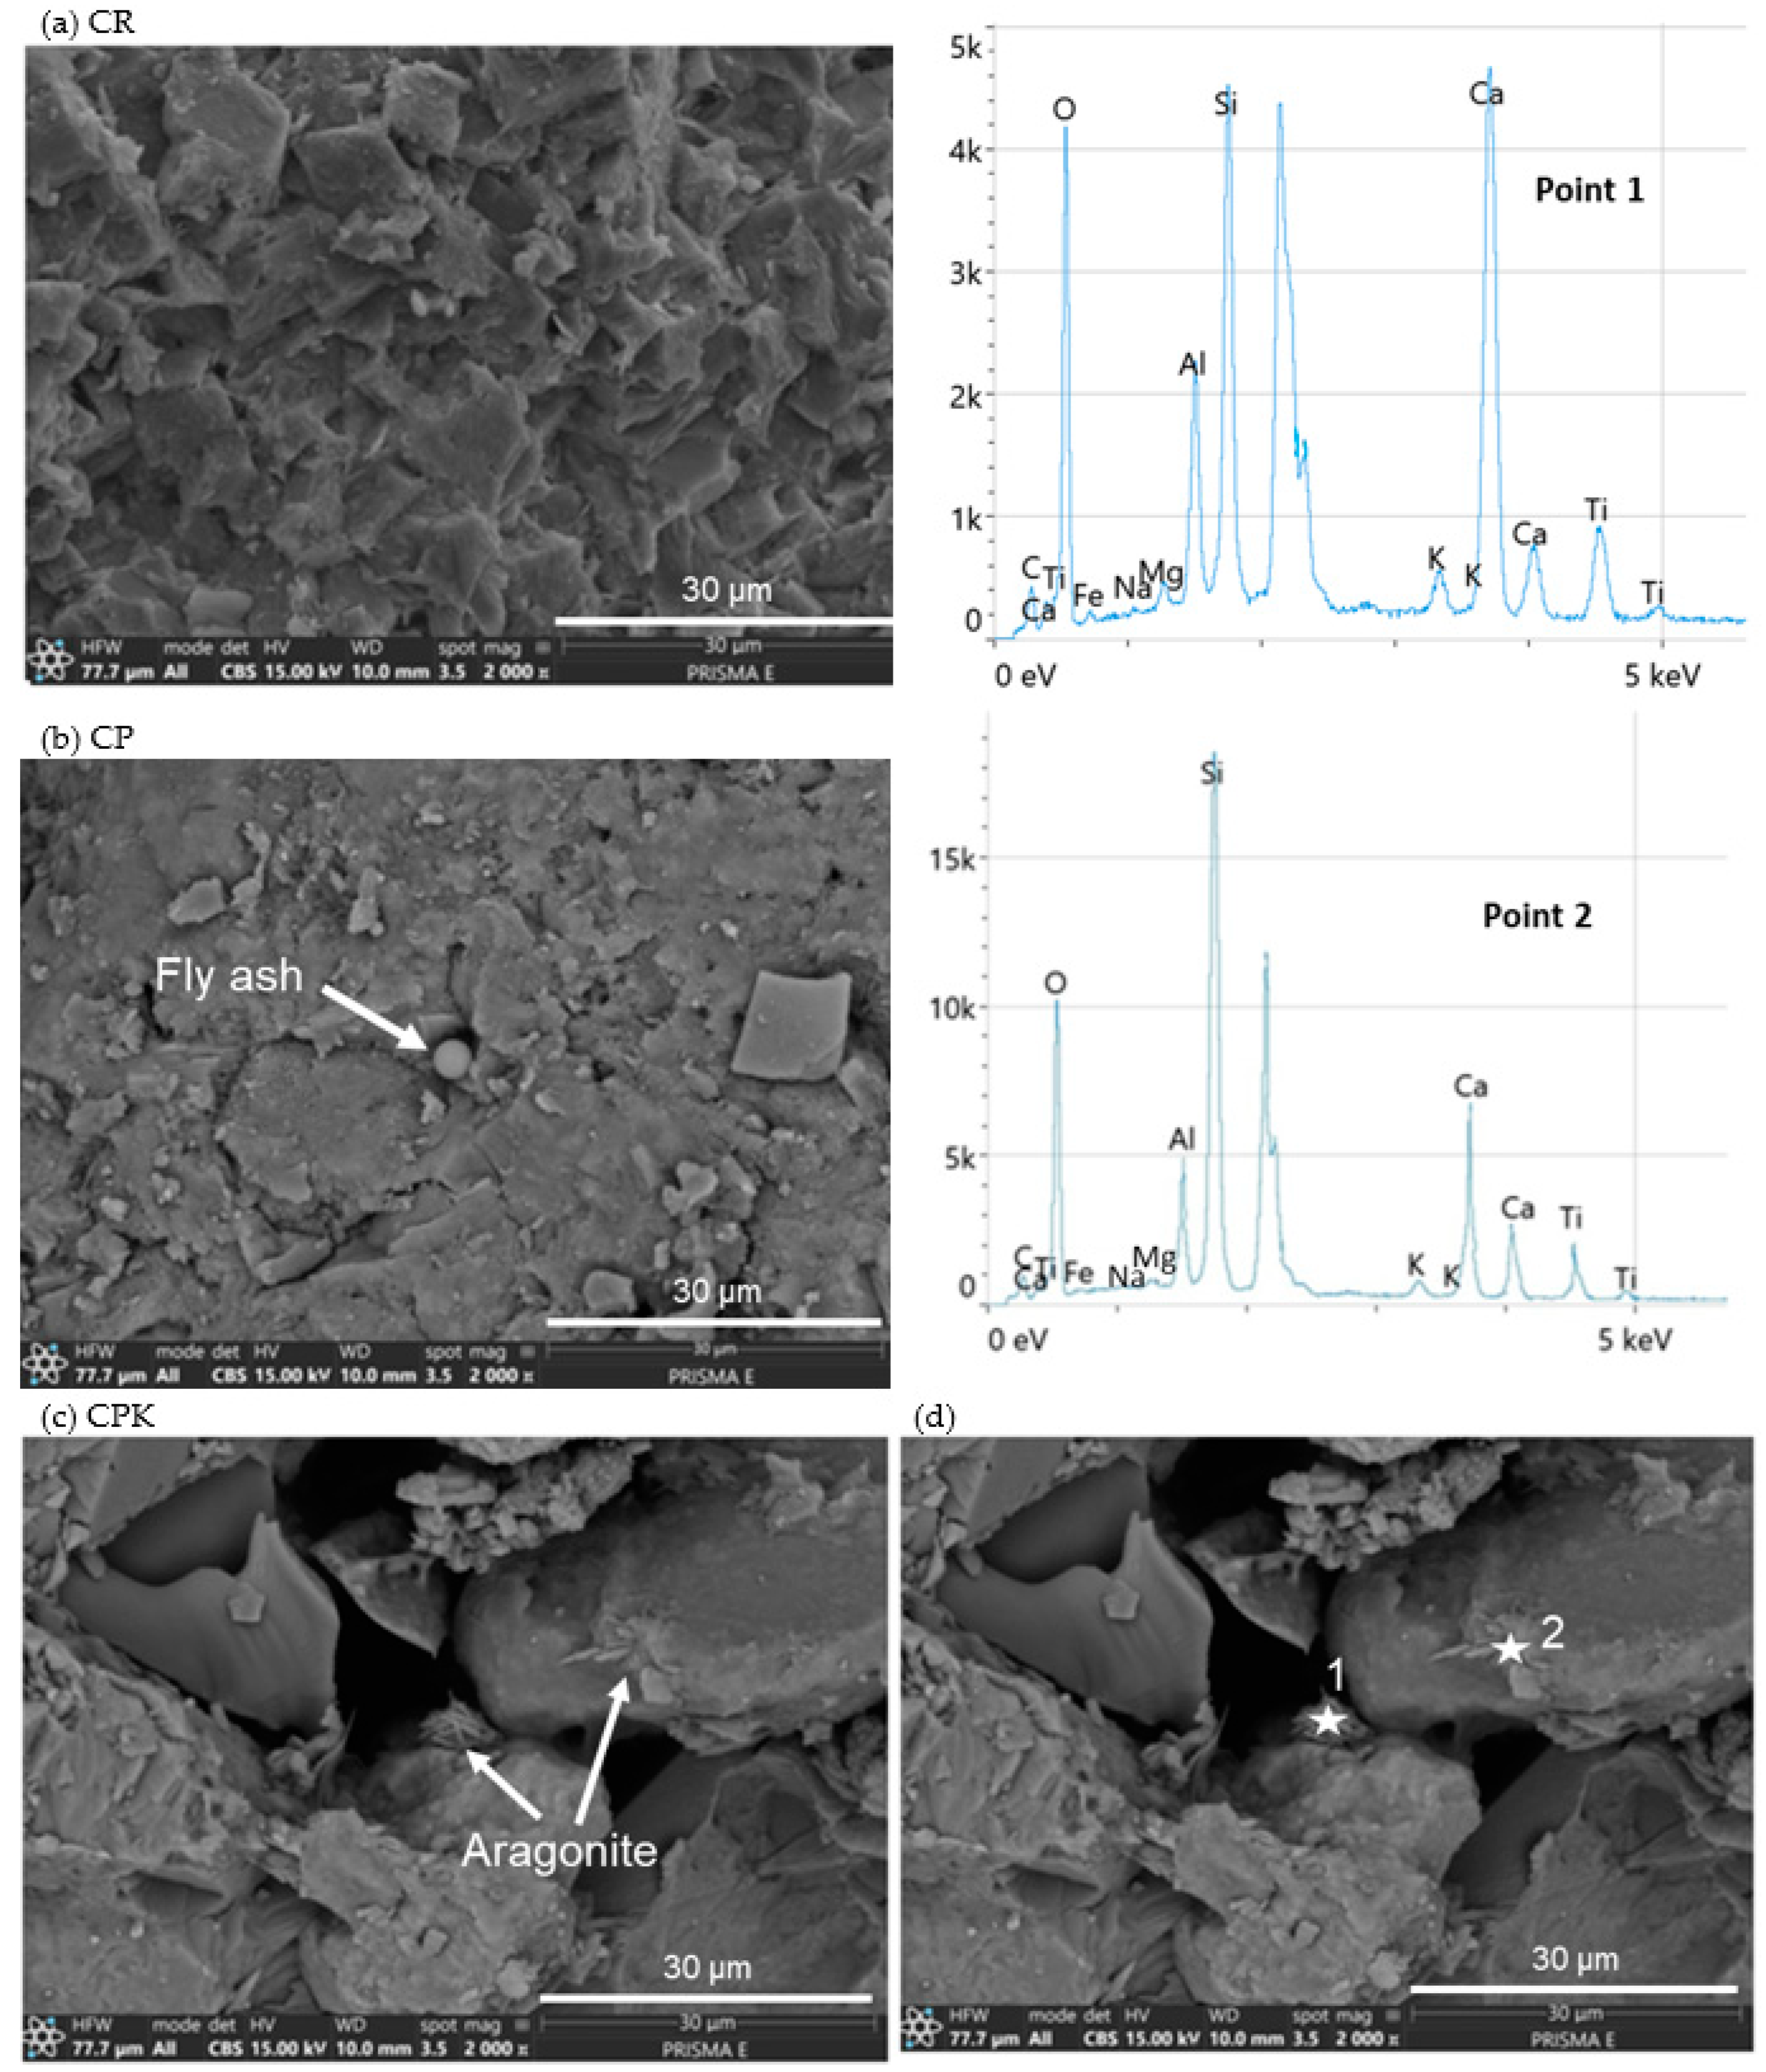
3.1.4. SEM
3.2. Mortar and Concrete Characterization
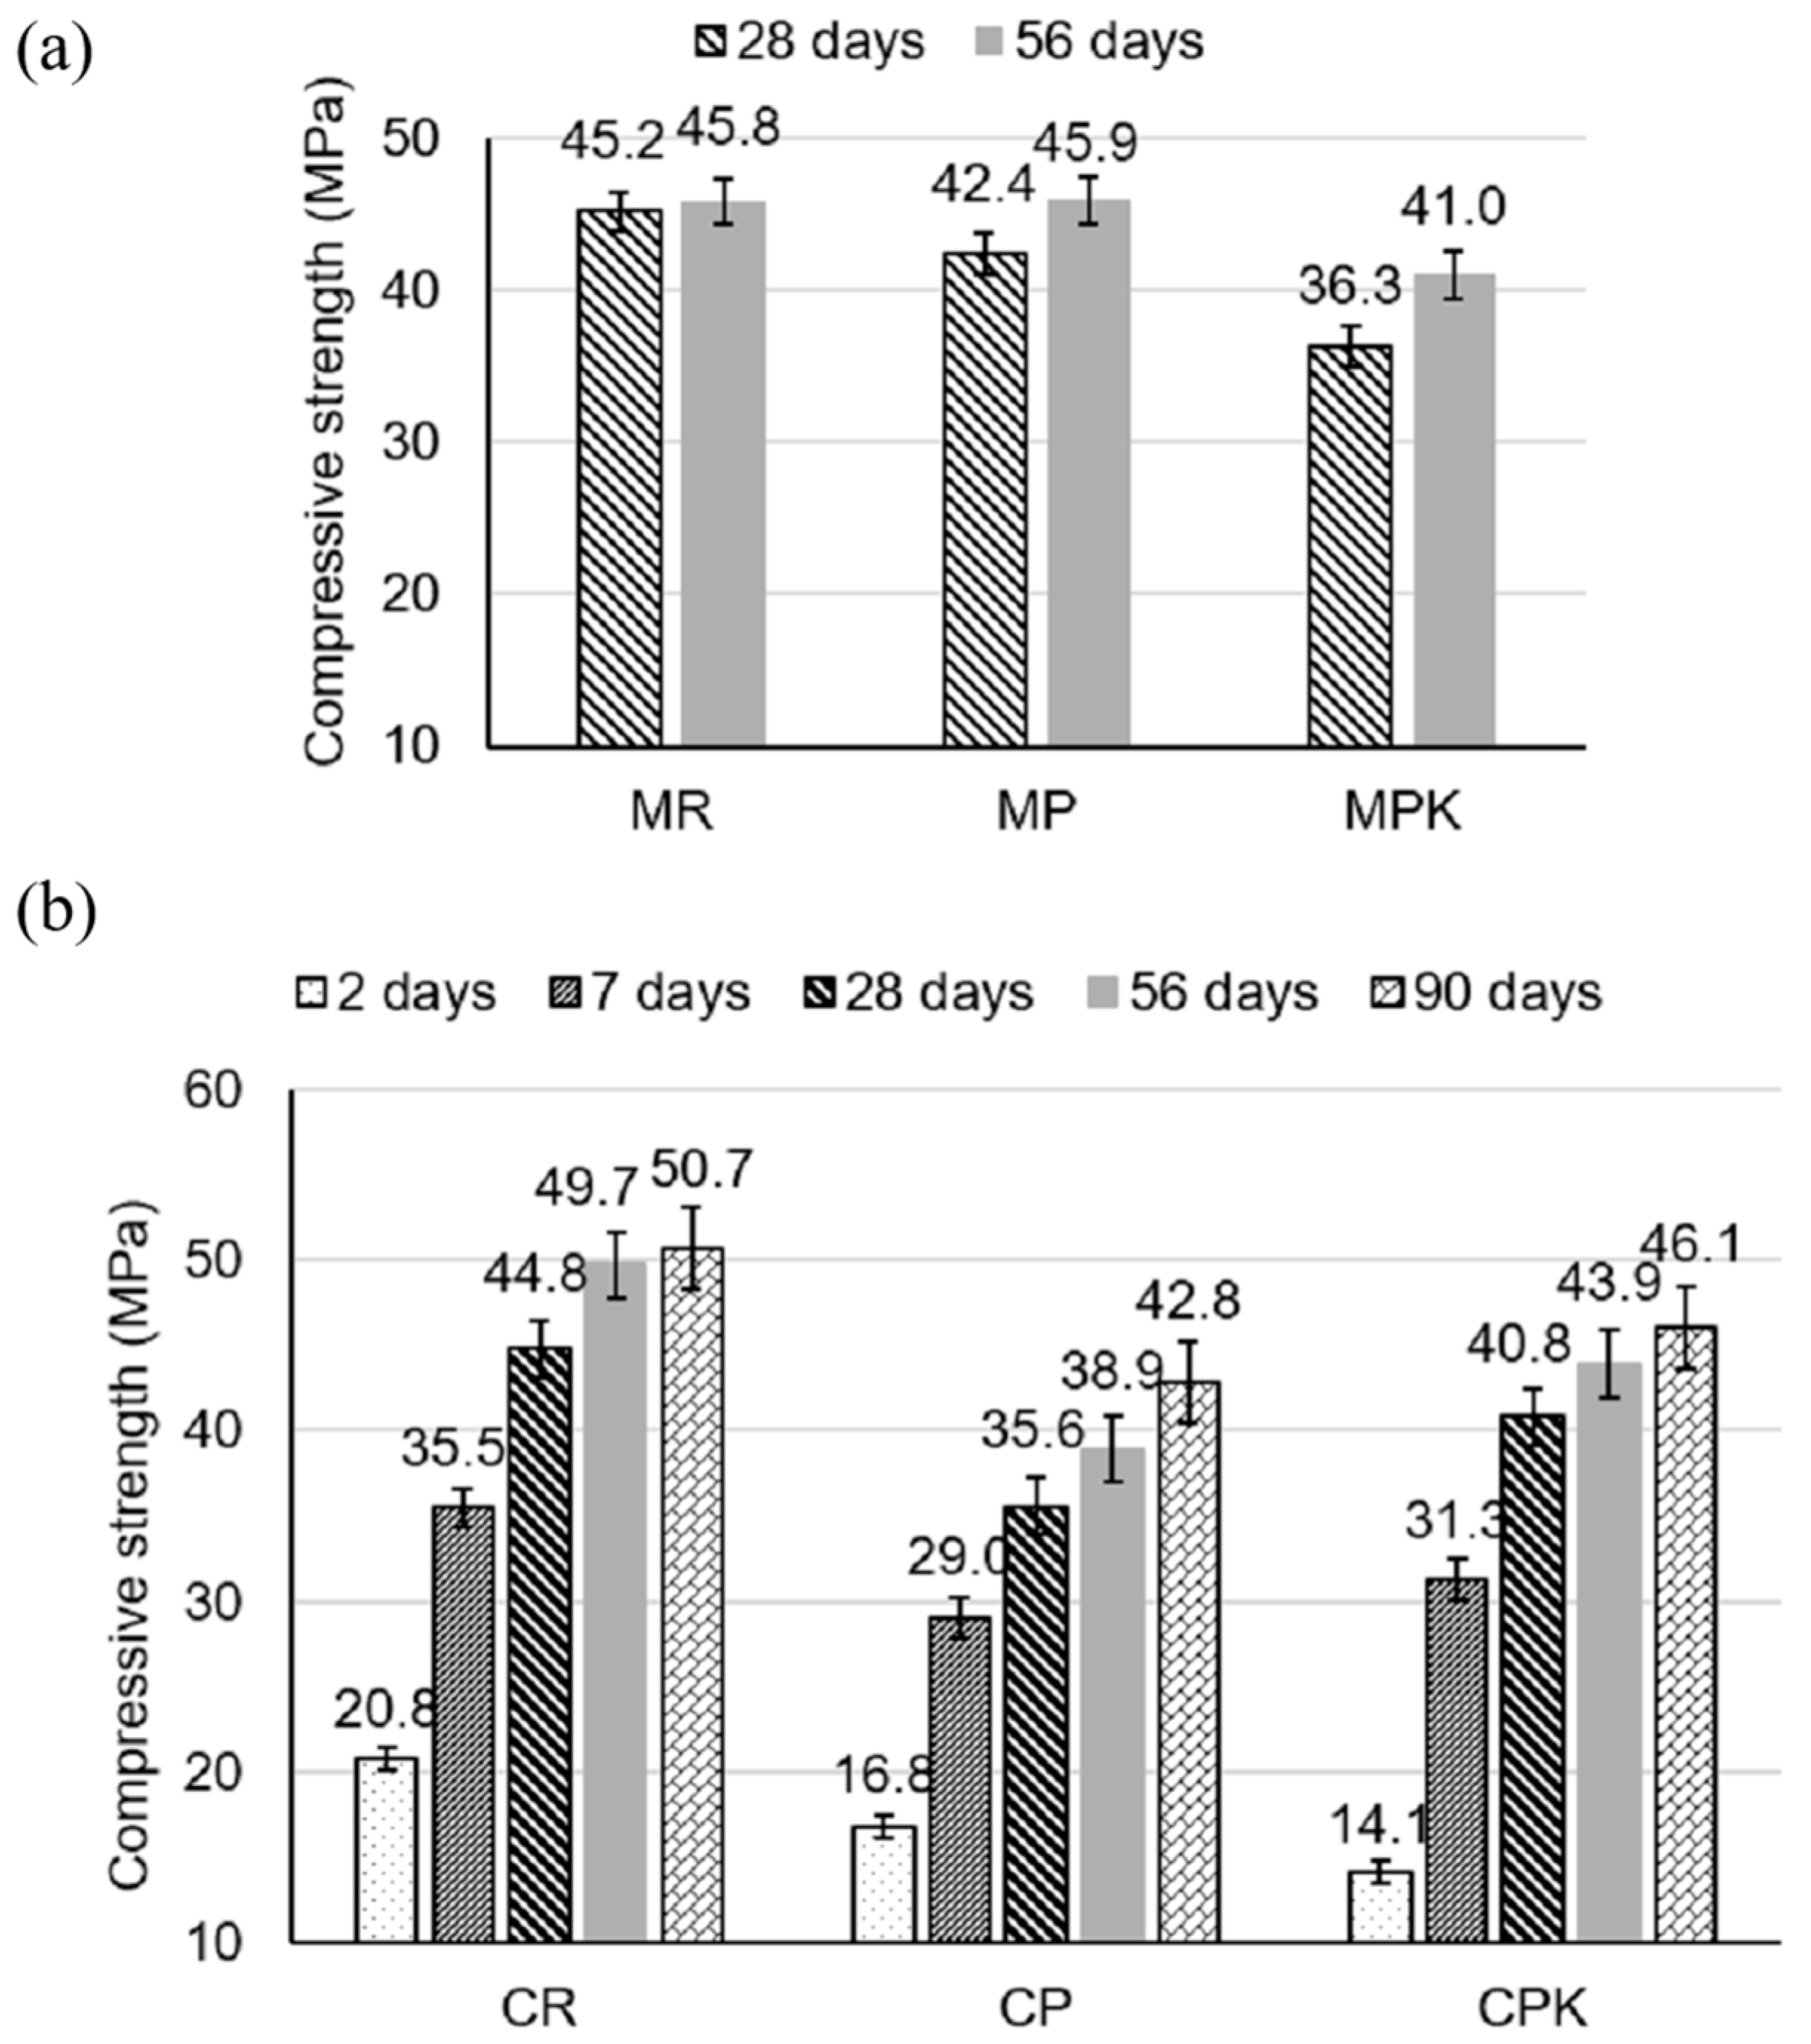
3.2.1. Strength Development
3.2.2. Evaluation of pH Values After CO2 Sequestration
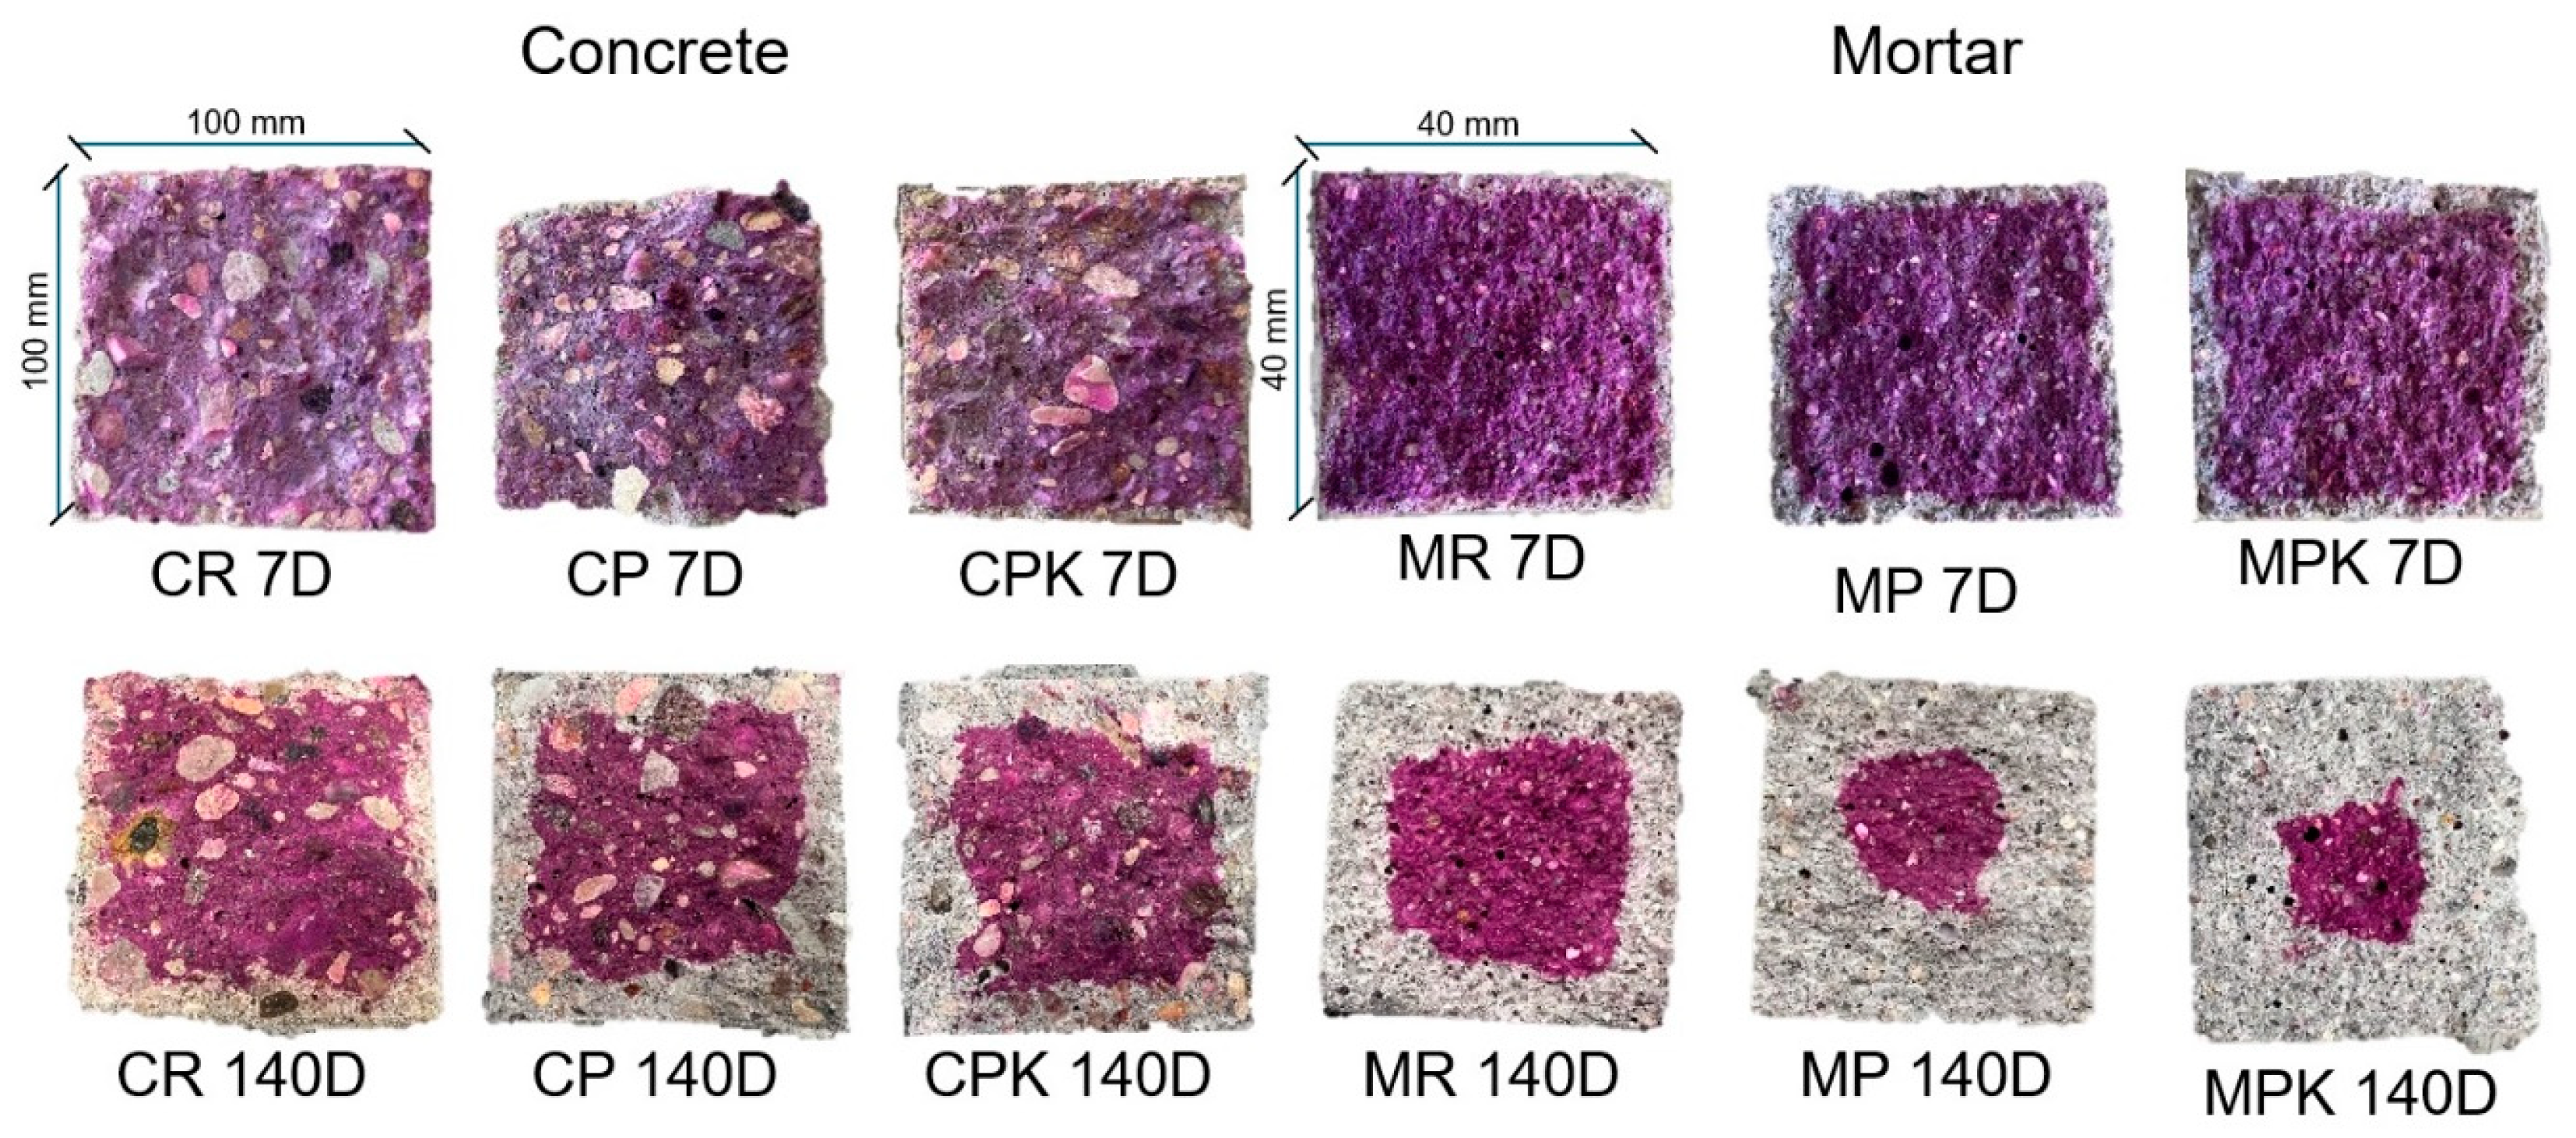
3.2.3. Weathering Carbonation
3.2.4. Electrochemical Measurements Analysis
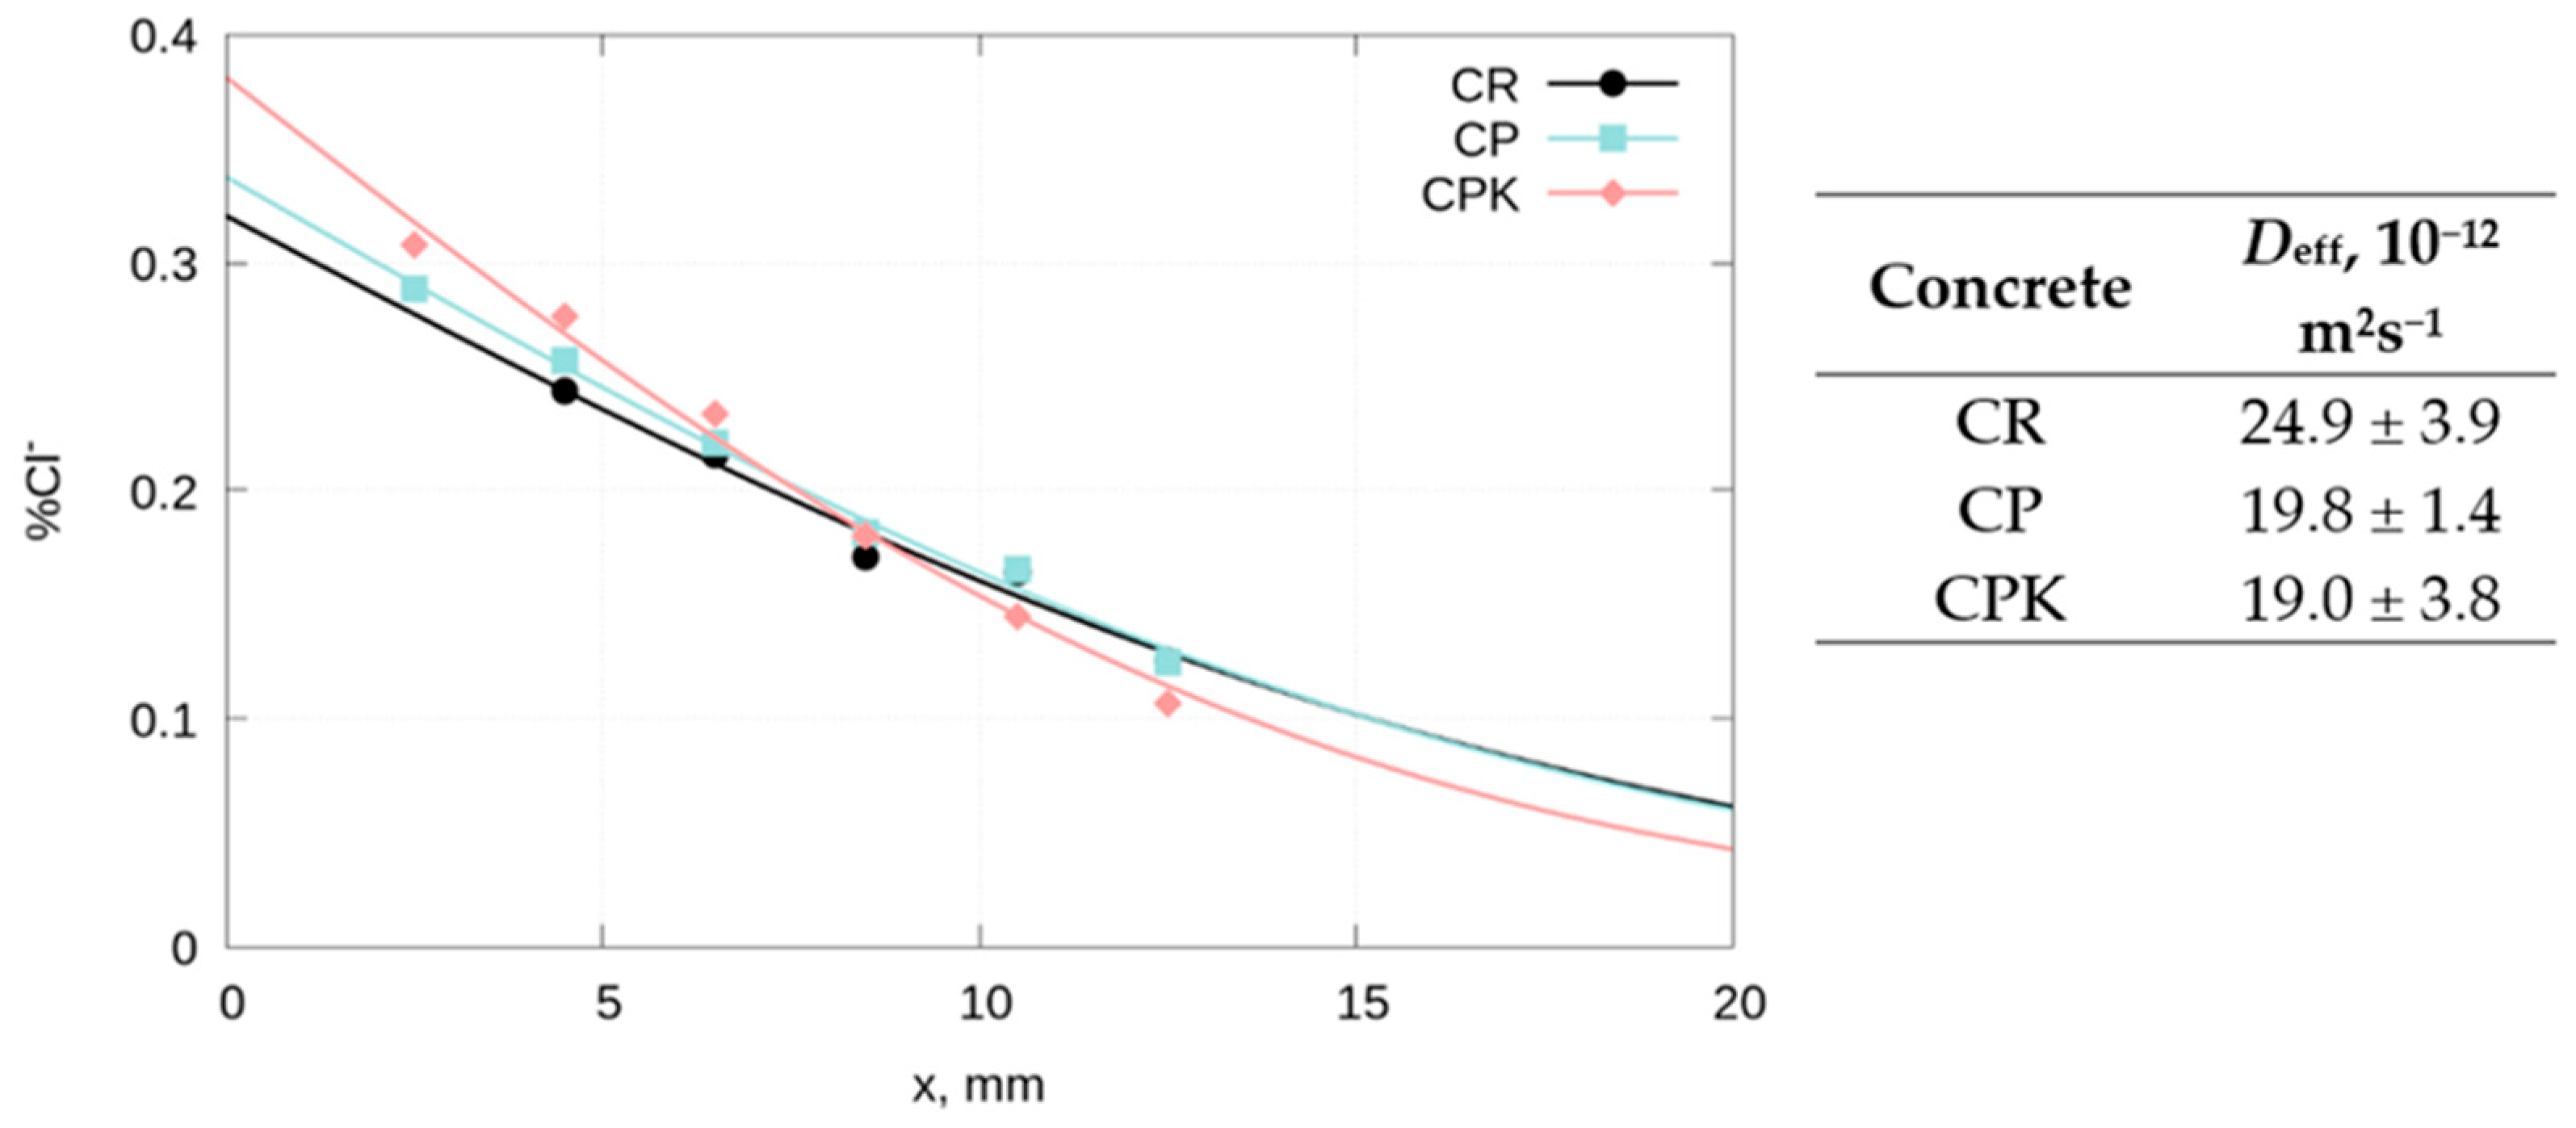
3.2.5. The Diffusion of Chloride Ions in Concrete
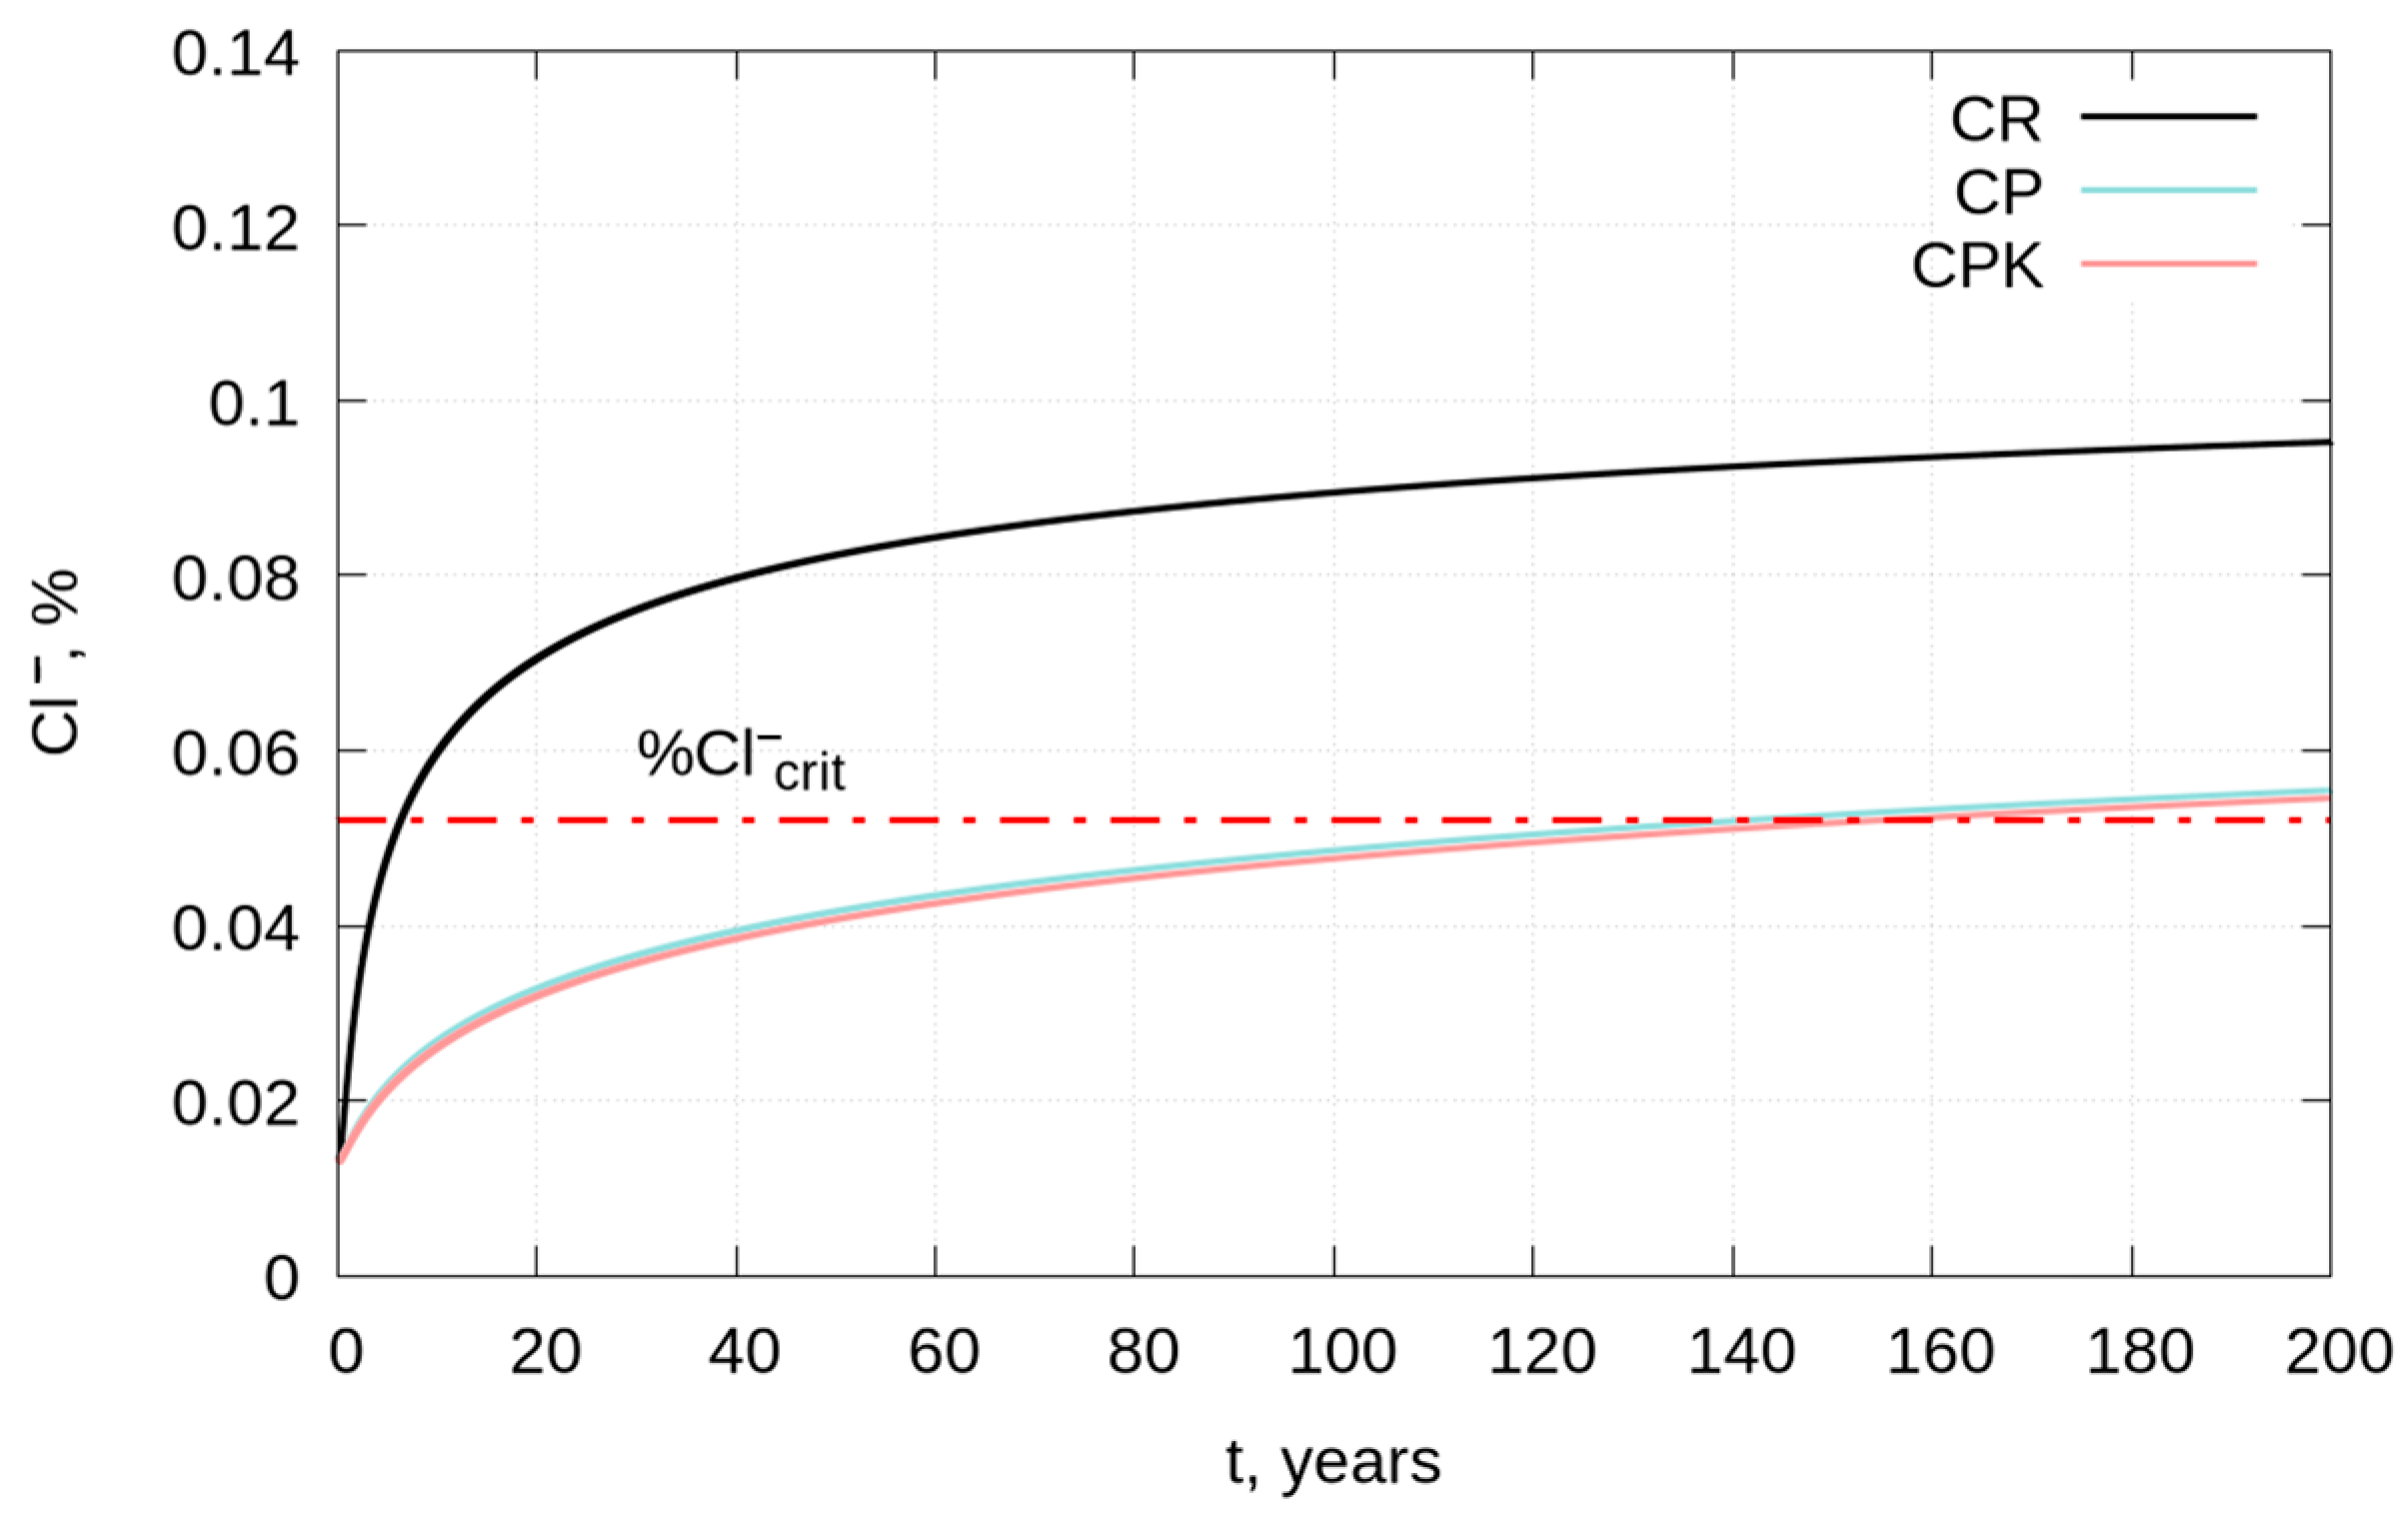
3.3. Service Life of Reinforced Concrete Structures—Modeling
3.4. Scaling and Environmental Assessment
4. Conclusions
- (1)
- The compressive strength of specimens with carbonated calcareous fly ash was lower compared to the reference samples; however, it was not more than 10% after 56 days for mortars and 9% after 90 days for concrete specimens.
- (2)
- The introduction carbonated calcareous fly ash did not result in a severely decreased pH. The pH value of the water extract from the mortar did not drop below 12.
- (3)
- It was found that the carbonation rate of concrete increases with the addition of the fly ash. However, no statistically significant effect (p > 0.05) of ash carbonation on concrete and mortar carbonation was observed.
- (4)
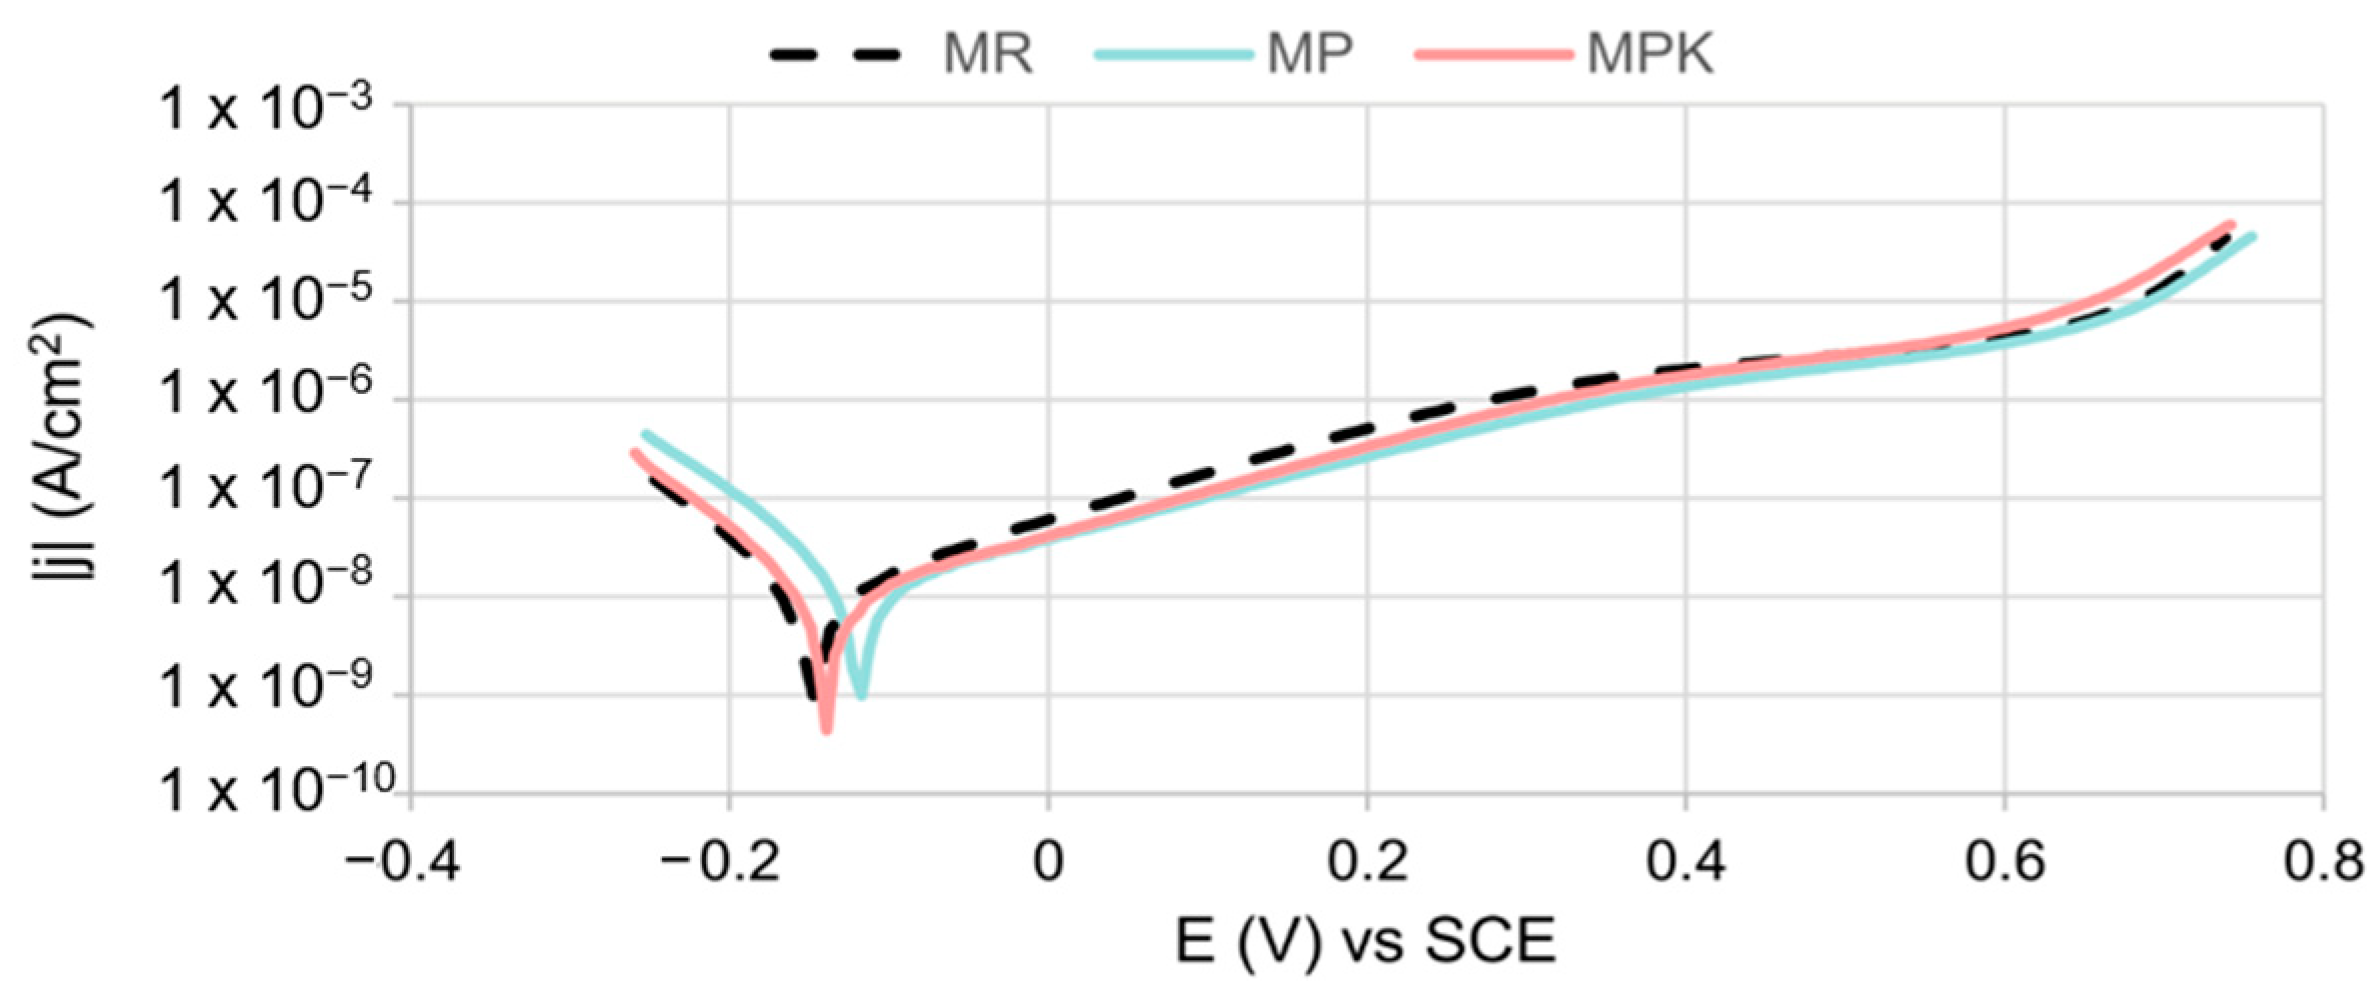
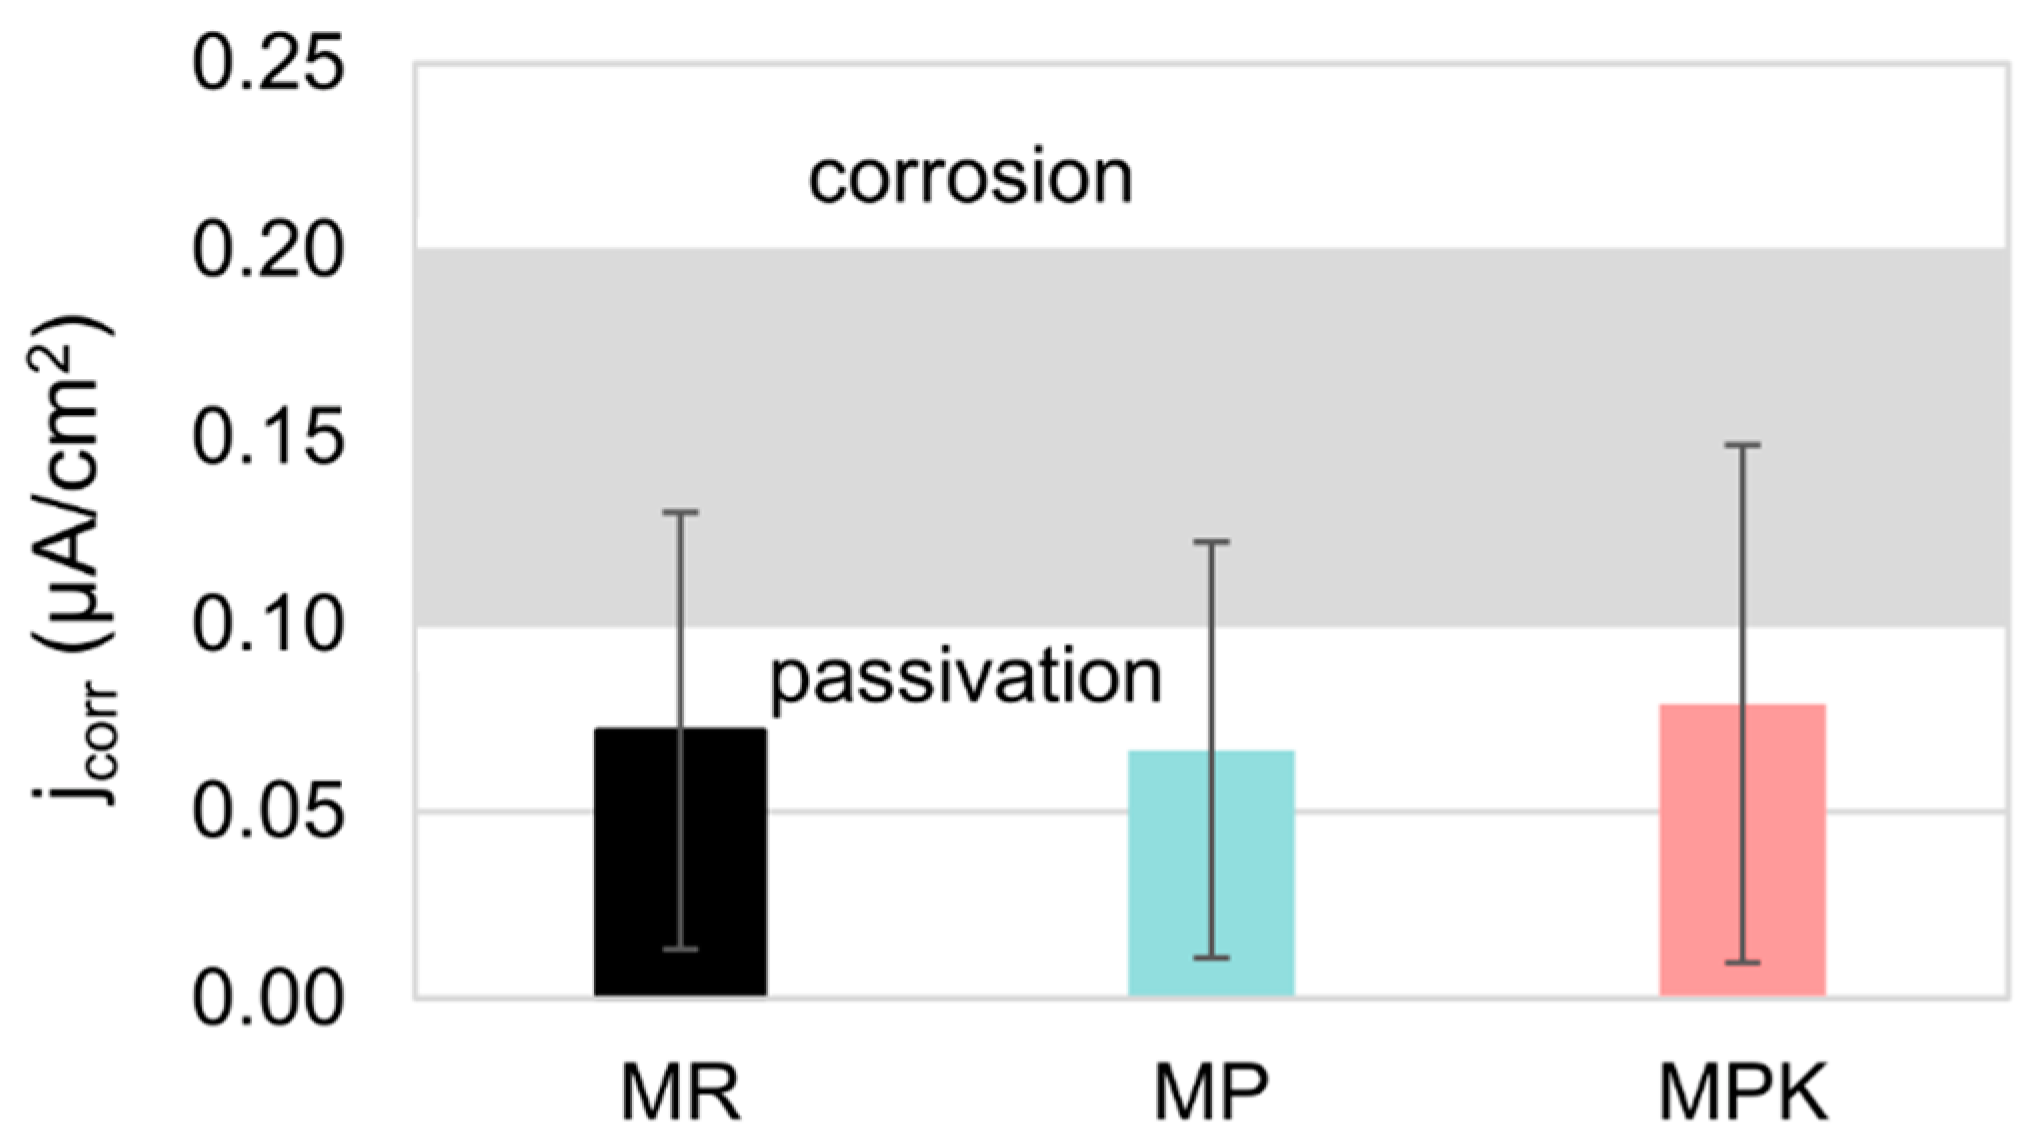
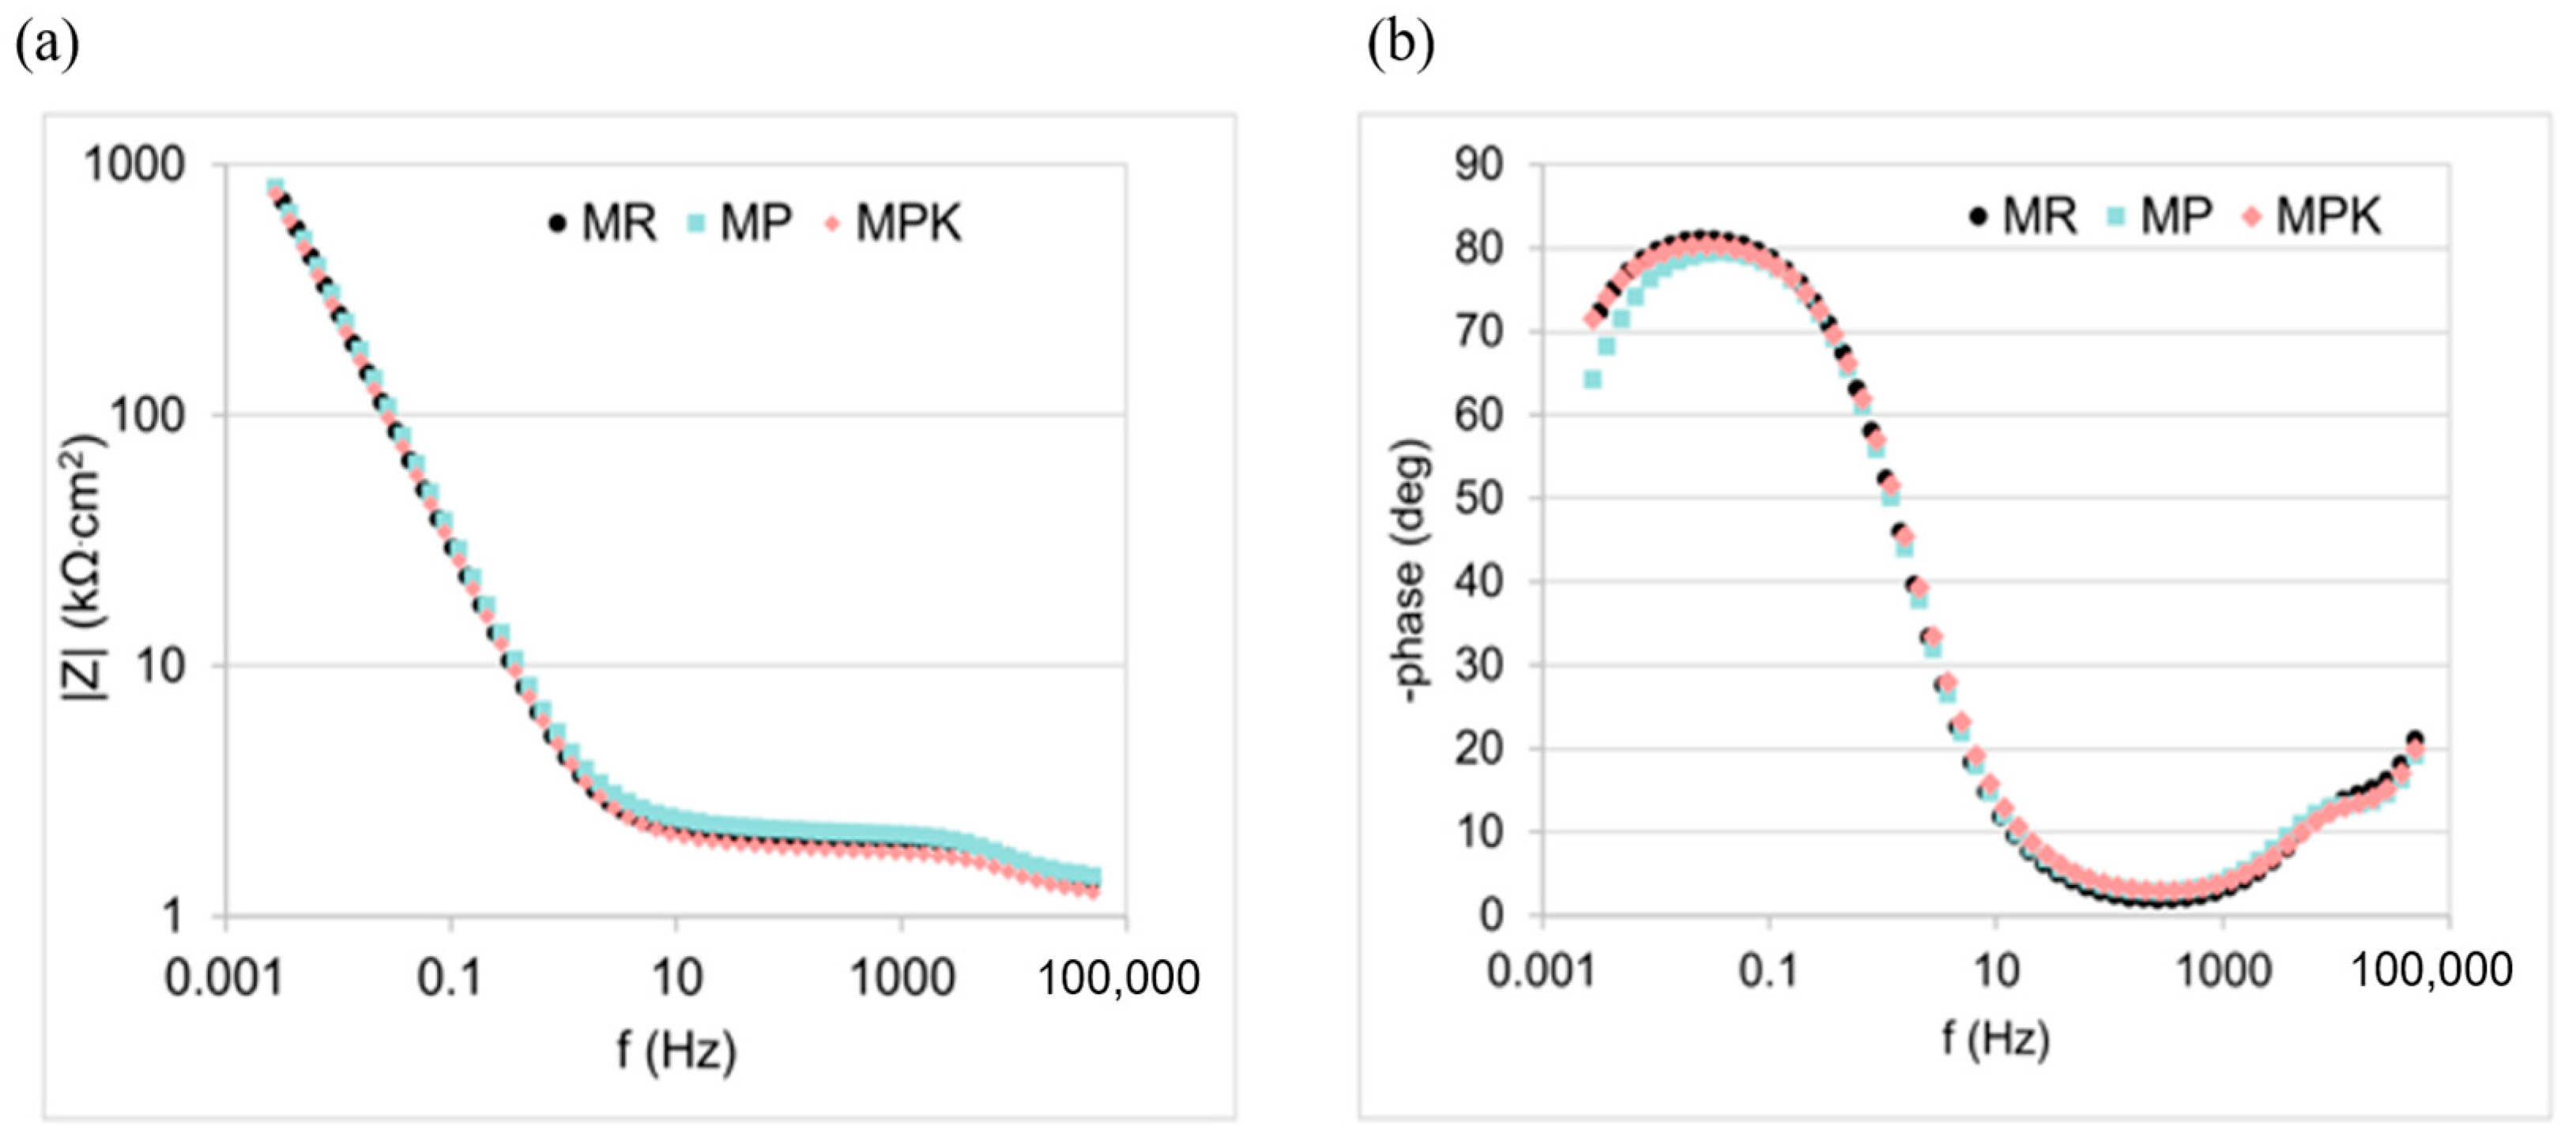
- There was no statistically significant effect of fly ash, either carbonated or non-carbonated, on the corrosion behavior of steel in mortar. The course of reinforcement polarization curves in all tested types of mortars was very similar to each other, indicating steel passivation and good protective properties of the passive layer formed on the steel.
- (5)
- Replacing 10% of the cement by mass with fly ash, both carbonated and non-carbonated, reduces the effective diffusion coefficient of chlorides in the concrete. No statistically significant influence of the carbonation of calcareous fly ash on the chloride diffusion rate was observed.
- (6)
- The estimated time to reach the permissible chloride concentration at a depth of 40 mm for concretes with fly ash and with carbonated fly ash is more than 20 times longer compared to the reference concrete and is about 141 and 154 years, respectively.
Author Contributions
Funding
Institutional Review Board Statement
Informed Consent Statement
Data Availability Statement
Conflicts of Interest
References
- Poland. National Inventory Report 2022. Ministry of Climate and Environment. Available online: http://unfccc.int/documents/461818 (accessed on 14 February 2025).
- Pan, S.Y.; Chen, Y.H.; Fan, L.S.; Kim, H.; Gao, X.; Ling, T.C.; Gu, G. CO2 mineralization and utilization by alkaline solid wastes for potential carbon reduction. Nat. Sustain. 2020, 3, 399–405. [Google Scholar] [CrossRef]
- Rahmani, O. An experimental study of accelerated mineral carbonation of industrial waste red gypsum for CO2 sequestration. J. CO2 Util. 2020, 35, 265–271. [Google Scholar] [CrossRef]
- Seifritz, W. CO2 disposal by means of silicates. Nature 1990, 345, 486. [Google Scholar] [CrossRef]
- Sanna, A.; Uibu, M.; Caramanna, G.; Kuusik, R.; Maroto-Valer, M.M. A review of mineral carbonation technologies to sequester CO2. Chem. Soc. Rev. 2014, 43, 8049–8080. [Google Scholar] [CrossRef]
- Snæbjörnsdóttir, S.Ó.; Sigfússon, B.; Marieni, C.; Goldberg, D.; Gislason, S.R.; Oelkers, E.H. Carbon dioxide storage through mineral carbonation. Nat. Rev. Earth Environ. 2020, 1, 90–102. [Google Scholar] [CrossRef]
- Zajac, M.; Irbe, L.; Bullerjahn, F.; Hilbig, H.; Haha, M.B. Mechanisms of carbonation hydration hardening in Portland cements. Cem. Concr. Res. 2022, 152, 106687. [Google Scholar] [CrossRef]
- Broomfield, J.P. Corrosion of Steel in Concrete: Understanding, Investigation and Repair; CRC Press Books: Boca Raton, FL, USA, 2023. [Google Scholar]
- Environment, U.N.; Scrivener, K.L.; John, V.M.; Gartner, E.M. Eco-efficient cements: Potential economically viable solutions for a low-CO2 cement-based materials industry. Cem. Concr. Res. 2018, 114, 2–26. [Google Scholar] [CrossRef]
- Biswal, U.S.; Dinakar, P. Evaluating corrosion resistance of recycled aggregate concrete integrating ground granulated blast furnace slag. Constr. Build. Mater. 2023, 370, 130676. [Google Scholar] [CrossRef]
- Huang, H.; Guo, R.; Wang, T.; Hu, X.; Garcia, S.; Fang, M.; Maroto-Valer, M.M. Carbonation curing for wollastonite-Portland cementitious materials: CO2 sequestration potential and feasibility assessment. J. Clean. Prod. 2019, 211, 830–841. [Google Scholar] [CrossRef]
- Guduru, R.K.; Tiwari, N.; Shah, H. CO2 Capture Using Fly Ash. In From Waste to Wealth; Arya, R.K., Verros, G.D., Verma, O.P., Hussain, C.M., Eds.; Springer: Singapore, 2024. [Google Scholar] [CrossRef]
- Senadeera, K.R.; Jayasinghe, T.K.; Jayasundara, P.M.; Nanayakkara, G.; Rathnayake, M. Investigation of CO2 sequestration possibility via indirect mineral carbonation using waste coal fly ash. In Proceedings of the 2020 Moratuwa Engineering Research Conference (MERCon), Moratuwa, Sri Lanka, 28–30 July 2020; IEEE: New York, NY, USA, 2020; pp. 119–123. [Google Scholar] [CrossRef]
- Siriruang, C.; Toochinda, P.; Julnipitawong, P.; Tangtermsirikul, S. CO2 capture using fly ash from coal fired power plant and applications of CO2-captured fly ash as a mineral admixture for concrete. J. Environ. Manag. 2016, 170, 70–78. [Google Scholar] [CrossRef]
- López Zaldívar, Ó.; Mayor Lobo, P.L.; Fernández Martínez, F.; Hernández Olivares, F. Improved cement mortars by addition of carbonated fly ash from solid waste incineration. Mater. Constr. 2015, 65, e062. [Google Scholar] [CrossRef]
- Salber, A.J.; Swan, C.W. Design of fly-ash concrete masonry for optimal carbon sequestration. In Proceedings of the 2013 World of Coal Ash (WOCA) Conference, Lexington, KY, USA, 22–25 April 2013. [Google Scholar]
- Pei, S.L.; Pan, S.Y.; Gao, X.; Fang, Y.K.; Chiang, P.C. Efficacy of carbonated petroleum coke fly ash as supplementary cementitious materials in cement mortars. J. Clean. Prod. 2018, 180, 689–697. [Google Scholar] [CrossRef]
- Ebrahimi, A.; Saffari, M.; Milani, D.; Montoya, A.; Valix, M.; Abbas, A. Sustainable transformation of fly ash industrial waste into a construction cement blend via CO2 carbonation. J. Clean. Prod. 2017, 156, 660–669. [Google Scholar] [CrossRef]
- Salta, M.M. Corrosion and Corrosion Protection of Steel in Concrete; Swamy, R.N., Ed.; Sheffield Academic Press: Sheffield, UK, 1994; p. 793. [Google Scholar]
- Montemor, M.F.; Simoes, A.M.P.; Salta, M.M. Effect of fly ash on concrete reinforcement corrosion studied by EIS. Cem. Concr. Compos. 2000, 22, 175–185. [Google Scholar] [CrossRef]
- Tuutti, K. Corrosion of Steel in Concrete. Ph.D. Thesis, Division of Building Materials, Swedish Cement and Concrete Research Institute, Stockholm, Sweden, 1982. [Google Scholar]
- Montemor, M.F.; Cunha, M.P.; Ferreira, M.G.; Simões, A.M. Corrosion behaviour of rebars in fly ash mortar exposed to carbon dioxide and chlorides. Cem. Concr. Compos. 2002, 24, 45–53. [Google Scholar] [CrossRef]
- PN-EN 1097-7:2001; Tests for Mechanical and Physical Properties of Aggregates—Part 7: Determination of the Particle Density of Filler—Pyknometer Method. Polski Komitet Normalizacyjny: Warsaw, Poland, 2001.
- PN-EN 451-2:2017-06; Method of Testing Fly Ash—Part 2: Determination of Fineness by Wet Sieving. Polski Komitet Normalizacyjny: Warsaw, Poland, 2017.
- PN-EN 196-1:2016-07; Methods of Testing Cement—Part 1: Determination of Strength. Polski Komitet Normalizacyjny: Warsaw, Poland, 2016.
- Ahmaruzzaman, M. A review on the utilization of fly ash. Prog. Energy Combust. Sci. 2010, 36, 327–363. [Google Scholar] [CrossRef]
- Shirai, H.; Ikeda, M.; Tanno, K. Factors affecting the density and specific surface area (Blaine value) of fly ash from pulverized coal combustion. Energy Fuels 2011, 25, 5700–5706. [Google Scholar] [CrossRef]
- Mercedes Maroto-Valer, M.; Lu, Z.; Zhang, Y.; Tang, Z. Sorbents for CO2 capture from high carbon fly ashes. Waste Manag. 2008, 28, 2320–2328. [Google Scholar] [CrossRef]
- Stanmore, B.R.; Gilot, P. Review-calcination and carbonation of limestone during thermal cycling for CO2 sequestration. Fuel Process. Technol. 2005, 86, 1707–1743. [Google Scholar] [CrossRef]
- Ho, H.J.; Iizuka, A.; Shibata, E. Utilization of low-calcium fly ash via direct aqueous carbonation with a low-energy input: Determination of carbonation reaction and evaluation of the potential for CO2 sequestration and utilization. J. Environ. Manag. 2021, 288, 112411. [Google Scholar] [CrossRef]
- Zhang, D.; Shao, Y. Early age carbonation curing for precast reinforced concretes. Constr. Build. Mater. 2016, 113, 134–143. [Google Scholar] [CrossRef]
- PN-85/B-04500; Building Mortars. Testing of Physical and Strength Properties. Polski Komitet Normalizacyjny: Warsaw, Poland, 1985.
- PN-EN 12390-2:2019-07; Testing Hardened Concrete—Part 2: Making and Curing Specimens for Strength Tests. Polski Komitet Normalizacyjny: Warsaw, Poland, 2019.
- PN-EN 12390-12:2020-06; Testing Hardened Concrete—Part 12: Determination of the Carbonation Resistance of Concrete—Accelerated Carbonation Method. Polski Komitet Normalizacyjny: Warsaw, Poland, 2020.
- Papadakis, V.G. Effect of supplementary cementing materials on concrete resistance against carbonation and chloride ingress. Cem. Concr. Res. 2000, 30, 291–299. [Google Scholar] [CrossRef]
- Szweda, Z.; Kuziak, J.; Sozańska-Jędrasik, L.; Czachura, D. Analysis of the effect of protective properties of concretes with similar composition on the corrosion rate of reinforcing steel induced by chloride ions. Materials 2023, 16, 3889. [Google Scholar] [CrossRef]
- Csizmadia, J.; Balázs, G.; Tamás, F.D. Chloride ion binding capacity of aluminoferrites. Cem. Concr. Res. 2001, 31, 577–588. [Google Scholar] [CrossRef]
- Wang, Y.; Shui, Z.; Gao, X.; Yu, R.; Huang, Y.; Cheng, S. Understanding the chloride binding and diffusion behaviors of marine concrete based on Portland limestone cement-alumina enriched pozzolans. Constr. Build. Mater. 2019, 198, 207–217. [Google Scholar] [CrossRef]
- Park, J.I.; Lee, K.M.; Kwon, S.O.; Bae, S.H.; Jung, S.H.; Yoo, S.W. Diffusion decay coefficient for chloride ions of concrete containing mineral admixtures. Adv. Mater. Sci. Eng. 2016, 2016, 2042918. [Google Scholar] [CrossRef]
- FIB Bulletin 34. Model Code for Service Life Design; FIB: Lausanne, Switzerland, 2006; ISBN 978-2-88394-074-1. [Google Scholar] [CrossRef]
- dos Santos, R.P.; Martins, J.; Gadelha, C.; Cavada, B.; Albertini, A.V.; Arruda, F.; Vasconcelos, M.; Teixeira, E.; Alves, F.; Lima Filho, J.; et al. Coal fly ash ceramics: Preparation, characterization, and use in the hydrolysis of sucrose. Sci. World J. 2014, 2014, 154651. [Google Scholar] [CrossRef]
- Dixit, A.; Du, H.J.; Pang, S.D. Carbon capture in ultra-high performance concrete using pressurized CO2 curing. Constr. Build. Mater. 2021, 288, 123076. [Google Scholar] [CrossRef]
- Brown, R.C.; Dykstra, J. Systematic errors in the use of loss-on-ignition to measure unburned carbon in fly ash. Fuel 1995, 74, 570–574. [Google Scholar] [CrossRef]
- Chang, E.E.; Pan, S.Y.; Chen, Y.H.; Tan, C.S.; Chiang, P.C. Accelerated carbonation of steelmaking slags in a high-gravity rotating packed bed. J. Hazard. Mater. 2012, 227–228, 97–106. [Google Scholar] [CrossRef]
- Villain, G.; Thiery, M.; Platret, G. Measurement methods of carbonation profiles in concrete: Thermogravimetry, chemical analysis and gammadensimetry. Cem. Concr. Res. 2007, 37, 1182–1192. [Google Scholar] [CrossRef]
- Liu, W.; Su, S.; Xu, K.; Chen, Q.; Xu, J.; Sun, Z.; Wang, Y.; Hu, S.; Wang, X.; Xue, Y.; et al. CO2 sequestration by direct gas–solid carbonation of fly ash with steam addition. J. Clean. Prod. 2018, 178, 98–107. [Google Scholar] [CrossRef]
- Ohenoja, K.; Rissanen, J.; Kinnunen, P.; Illikainen, M. Direct carbonation of peatwood fly ash for carbon capture and utilization in construction application. J. CO2 Util. 2020, 40, 101203. [Google Scholar] [CrossRef]
- Yeheyis, M.B.; Shang, J.Q.; Yanful, E.K. Chemical and mineralogical transformations of coal fly ash after landfilling. In Proceedings of the World of Coal Ash (WOCA) Conference, Lexington, KY, USA, 4–7 May 2009. [Google Scholar]
- Nouri, S.M.M.; Ebrahim, H.A. Kinetic study of CO2 reaction with CaO by a modified random pore model. Pol. J. Chem. Technol. 2016, 18, 93–98. [Google Scholar] [CrossRef]
- Zhang, D.; Cai, X.; Shao, Y. Carbonation curing of precast fly ash concrete. J. Mater. Civ. Eng. 2016, 28, 04016127. [Google Scholar] [CrossRef]
- Yuan, Q.; Zhang, Y.; Wang, T.; Wang, J. Characterization of heavy metals in fly ash stabilized by carbonation with supercritical CO2 coupling mechanical force. J. CO2 Util. 2023, 67, 102308. [Google Scholar] [CrossRef]
- Ding, Z.; Zhang, X.; Cheng, T.; Shen, Y.; Cai, W.J.; Chen, C.T.A.; Yang, Z.; Liu, T.; Xiao, J.; Xia, M.; et al. Unlocking high carbonation efficiency: Direct CO2 mineralization with fly ash and seawater. Chem. Eng. Sci. 2023, 282, 119349. [Google Scholar] [CrossRef]
- Bilodeau, A.; Sivasundarm, V.; Painter, K.E.; Malholtra, V.M. Durability of concrete incorporating high volumes of fly ash from sources in USA. Mater. J. 1994, 91, 3–12. [Google Scholar] [CrossRef]
- Aitcin, P.C. High Performance Concrete; CRC Press: London, UK, 1998; p. 624. [Google Scholar] [CrossRef]
- Ševčík, R.; Šašek, P.; Viani, A. Physical and nanomechanical properties of the synthetic anhydrous crystalline CaCO3 polymorphs: Vaterite, aragonite and calcite. J. Mater. Sci. 2018, 53, 4022–4033. [Google Scholar] [CrossRef]
- Li, L.; Cao, M.; Yin, H. Comparative roles between aragonite and calcite calcium carbonate whiskers in the hydration and strength of cement paste. Cem. Concr. Compos. 2019, 104, 103350. [Google Scholar] [CrossRef]
- Tang, H.; Yu, J.; Zhao, X. Controlled synthesis of crystalline calcium carbonate aggregates with unusual morphologies involving the phase transformation from amorphous calcium carbonate. Mater. Res. Bull. 2009, 44, 831–835. [Google Scholar] [CrossRef]
- Saeki, T.; Monteiro, P.J.M. A model to predict the amount of calcium hydroxide in concrete containing mineral admixtures. Cem. Concr. Res. 2005, 35, 1914–1921. [Google Scholar] [CrossRef]
- Wu, M.; Zhang, Y.; Liu, Z.; Liu, C.; She, W.; Wu, Z. Experimental study on eco-friendly one-part alkali-activated slag-fly ash-lime composites under CO2 environment: Reaction mechanism and carbon capture capacity. Constr. Build. Mater. 2024, 421, 135779. [Google Scholar] [CrossRef]
- ACI CODE-318-19; Building Code Requirements for Structural Concrete and Commentary. American Concrete Institute: Farmington Hills, MI, USA, 2011. [CrossRef]
- Price, W.H. Factors influencing concrete strength. J. Proc. 1951, 47, 417–432. [Google Scholar] [CrossRef]
- Dos Santos, V.; Denzin Tonoli, G.H.; Mármol, G.; Savastano, H., Jr. Fiber-cement composites hydrated with carbonated water: Effect on physical-mechanical properties. Cem. Concr. Res. 2019, 124, 105812. [Google Scholar] [CrossRef]
- ACI 222R-19; Guide to Protection of Reinforcing Steel in Concrete against Corrosion. American Concrete Institute: Farmington Hills, MI, USA, 2019.
- Angst, U.; Moro, F.; Geiker, M.; Kessler, S.; Beushausen, H.; Andrade, C.; Lahdensivu, J.; Köliö, A.; Imamoto, K.; von Greve-Dierfeld, S.; et al. Corrosion of steel in carbonated concrete: Mechanisms, practical experience, and research priorities—A critical review by RILEM TC 281-CCC. RILEM Tech. Lett. 2020, 5, 85–100. [Google Scholar] [CrossRef]
- Wang, X.Y. Embodied CO2-based optimal design of concrete with fly ash considering stress and carbonation. J. Sustain. Cem.-Based Mater. 2023, 12, 71–82. [Google Scholar] [CrossRef]
- Ekolu, S.O. Model for practical prediction of natural carbonation in reinforced concrete: Part 1-formulation. Cem. Concr. Compos. 2018, 86, 40–56. [Google Scholar] [CrossRef]
- Chang, C.F.; Chen, J.W. The experimental investigation of concrete carbonation depth. Cem. Concr. Res. 2006, 36, 1760–1767. [Google Scholar] [CrossRef]
- Khunthongkeaw, J.; Tangtermsirikul, S.; Leelawat, T. A study on carbonation depth prediction for fly ash concrete. Constr. Build. Mater. 2006, 20, 744–753. [Google Scholar] [CrossRef]
- Ali, M.; Abdullah, M.S.; Saad, S.A. Effect of calcium carbonate replacement on workability and mechanical strength of Portland cement concrete. Adv. Mater. Res. 2015, 1115, 137–141. [Google Scholar] [CrossRef]
- Xia, J.; Ke, G.; Leng, F.; Wang, J.; Ren, L.; Liang, H. Effect of industrial-grade heavy calcium carbonate powder on properties of white high-strength concrete. Constr. Build. Mater. 2023, 378, 131211. [Google Scholar] [CrossRef]
- Lamberet, S. Durability of Ternary Binders Based on Portland Cement, Calcium Aluminate Cement and Calcium Sulfate. Ph.D. Thesis, EPFL, Lausanne, Switzerland, 2004. [Google Scholar] [CrossRef]
- Shah, V.; Scrivener, K.; Bhattacharjee, B.; Bishnoi, S. Changes in microstructure characteristics of cement paste on carbonation. Cem. Concr. Res. 2018, 109, 184–197. [Google Scholar] [CrossRef]
- Wang, D.; Shi, C.; Farzadnia, N.; Shi, Z.; Jia, H.; Ou, Z. A review on use of limestone powder in cement-based materials: Mechanism, hydration and microstructures. Constr. Build. Mater. 2018, 181, 659–672. [Google Scholar] [CrossRef]
- PN-B-01810:1986; Protection Against Corrosion in Building—Protective Properties of Concrete Refering to Reinforcing Steel—Electrochemical Tests. Polski Komitet Normalizacyjny: Warsaw, Poland, 1986.
- Andrade, C.; Alonso, C.; Gulikers, J.; Polder, R.; Cigna, R.; Vennesland, Ø.; Salta, M.; Raharinaivo, A.; Elsener, B. Test methods for on-site corrosion rate measurement of steel reinforcement in concrete by means of the polarization resistance method. Mater. Struct. 2004, 37, 623–643. [Google Scholar] [CrossRef]
- PN-H-04608:1978; Corrosion of Metals—Scale of Metals Corrosion Resistance. Polski Komitet Normalizacyjny: Warsaw, Poland, 1978.
- Domagała, K.; Śliwka, A. Application of potentiostatic measurements according to PN-EN 480-14 in assessment of the efficiency of reinforcement protection against corrosion by concrete with addition of fly ashes. Archit. Civ. Eng. Environ. 2017, 3, 109–115. [Google Scholar] [CrossRef]
- Królikowski, A.; Kuziak, J. Impedance study on calcium nitrite as a penetrating corrosion inhibitor for steel in concrete. Electrochim. Acta 2011, 56, 7845–7853. [Google Scholar] [CrossRef]
- Fedrizzi, L.; Azzolini, F.; Bonora, P.L. The use of migrating corrosion inhibitors to repair motorways’ concrete structures contaminated by chlorides. Cem. Concr. Res. 2005, 35, 551–561. [Google Scholar] [CrossRef]
- PN-EN 206:2014-04; Concrete—Specification, Performance, Production and Conformity. Polski Komitet Normalizacyjny: Warsaw, Poland, 2014.
- PN-EN 1990:2004/A1:2008; Eurocode—Basis of Structural Design. Polski Komitet Normalizacyjny: Warsaw, Poland, 2008.
- Zybura, A.; Śliwka, A. Design life of reinforced concrete structures in environment containing chlorides. Inżynieria Budownictwo 2019, 12, 543–550. (In Polish) [Google Scholar]
- Ghaddaffi, M.N.M.; Syazwan, O.M.; Syazwan, M.S.M.; Aimen, I.M. Scaling Up of Continuous Mineral Carbonation Reactor for the Production of High Value PCC Products. J. Phys. Conf. Ser. 2019, 1349, 012081. [Google Scholar] [CrossRef]
- Olajire, A.A. A review of mineral carbonation technology in sequestration of CO2. J. Petrol. Sci. Eng. 2013, 109, 364–392. [Google Scholar] [CrossRef]
- Nagireddi, S.; Agarwal, J.R.; Vedapuri, D. Carbon Dioxide Capture, Utilization, and Sequestration: Current Status, Challenges, and Future Prospects for Global Decarbonization. ACS Eng. Au 2024, 4, 22–48. [Google Scholar] [CrossRef]
- Jessa, E.; Ajidahun, A. Sustainable practices in cement and concrete production: Reducing CO2 emissions and enhancing carbon sequestration. World J. Adv. Res. Rev. 2024, 22, 2301–2310. [Google Scholar] [CrossRef]


| Composition | SiO2 | Al2O3 | Fe2O3 | CaO | MgO | SO3 | K2O | P2O5 | Rest | LOI |
|---|---|---|---|---|---|---|---|---|---|---|
| P | 50.7 | 18.5 | 3.8 | 17.6 | 1.0 | n.a | 0.1 | 0.1 | 1.9 | 6.4 |
| PK | 48.5 | 17.7 | 3.7 | 17.0 | 0.9 | n.a | 0.1 | 0.1 | 1.7 | 10.3 |
| CEM | 17.5 | 5.3 | 3.7 | 63.8 | 1.7 | 4.8 | 1.3 | 0.3 | 0.4 | 1.2 |
| Matrix | Cement, kg/m3 | Fly Ash, kg/m3 | Water, kg/m3 | Gravel, kg/m3 | Sand, kg/m3 | w/c | sp/c, % |
|---|---|---|---|---|---|---|---|
| MR | 512 | - | 256 | - | 1535 | 0.5 | - |
| MP | 461 | 51 | - | - | |||
| MPK | 461 | 51 | - | - | |||
| CR | 330 | - | 165 | 1931 | - | 1 | |
| CP | 297 | 33 | - | ||||
| CPK | 297 | 33 | - |
| Mortar | pH (pH Meter) | pH (Titration) | |
|---|---|---|---|
| COH-, M | pH | ||
| MR | 12.57 | 0.0540 | 12.73 |
| MP | 12.46 | 0.0460 | 12.66 |
| MPK | 12.30 | 0.0435 | 12.64 |
| Parameter | CR | CP | CPK | MR | MP | MPK |
|---|---|---|---|---|---|---|
| KAC (mm·day−0.5) | 0.73 | 1.23 | 1.19 | 0.54 | 1.01 | 1.07 |
| R2 | 0.93 | 0.95 | 0.97 | 0.97 | 0.99 | 0.99 |
| Parameter | MR | MP | MPK | Requirements for Passive State |
|---|---|---|---|---|
| Ecor, V | −0.149 ± 0.012 | −0.135 ± 0.023 | −0.149 ± 0.013 | >−0.350 (1) |
| jcor, μAcm−2 | 0.072 ± 0.058 | 0.066 ± 0.056 | 0.079 ± 0.069 | <0.1 (2) |
| jp, μAcm−2 | 0.714 ± 0.119 | 0.440 ± 0.054 | 0.704 ± 0.257 | <15 (1) |
| Etr, V | 0.660 ± 0.010 | 0.660 ± 0.010 | 0.660 ± 0.010 | 0.450–0.700 (1) |
| CR, mpy | 0.0008 | 0.0008 | 0.0009 | <0.0016 (2) |
| Mortar | CPEpas | Rpas, kΩ·cm2 | CPEdl | Rct, kΩ·cm2 | ||
|---|---|---|---|---|---|---|
| Ypas, μFsn−1cm−2 | npas | Ydl, μFsn−1cm−2 | ndl | |||
| MR | 34 ± 7 | 0.95 ± 0.01 | 2.5 ± 2.2 | 20 ± 6 | 0.89 ± 0.03 | 3620 ± 1410 |
| MP | 27 ± 3 | 0.95 ± 0.03 | 1.8 ± 1.3 | 22 ± 8 | 0.86 ± 0.01 | 3620 ± 1270 |
| MPK | 34 ± 1 | 0.94 ± 0.01 | 3.4 ± 1.5 | 15 ± 3 | 0.87 ± 0.01 | 3310 ± 1380 |
| Concrete | CR | CP | CPK |
|---|---|---|---|
| x0.4%, 50 years, mm | 76.6 | 28.1 | 27.6 |
| x0.4%, 100 years, mm | 108.0 | 39.8 | 39.1 |
Disclaimer/Publisher’s Note: The statements, opinions and data contained in all publications are solely those of the individual author(s) and contributor(s) and not of MDPI and/or the editor(s). MDPI and/or the editor(s) disclaim responsibility for any injury to people or property resulting from any ideas, methods, instructions or products referred to in the content. |
© 2025 by the authors. Licensee MDPI, Basel, Switzerland. This article is an open access article distributed under the terms and conditions of the Creative Commons Attribution (CC BY) license (https://creativecommons.org/licenses/by/4.0/).
Share and Cite
Jaworska, B.; Stańczak, D.; Kobyłka, R.; Gołofit, T.; Zhang, D.; Kuziak, J. The Influence of Fly Ash Carbonation on the Protective Properties of Concrete Cover Towards Reinforcement. Materials 2025, 18, 2181. https://doi.org/10.3390/ma18102181
Jaworska B, Stańczak D, Kobyłka R, Gołofit T, Zhang D, Kuziak J. The Influence of Fly Ash Carbonation on the Protective Properties of Concrete Cover Towards Reinforcement. Materials. 2025; 18(10):2181. https://doi.org/10.3390/ma18102181
Chicago/Turabian StyleJaworska, Beata, Dominika Stańczak, Rafał Kobyłka, Tomasz Gołofit, Duo Zhang, and Justyna Kuziak. 2025. "The Influence of Fly Ash Carbonation on the Protective Properties of Concrete Cover Towards Reinforcement" Materials 18, no. 10: 2181. https://doi.org/10.3390/ma18102181
APA StyleJaworska, B., Stańczak, D., Kobyłka, R., Gołofit, T., Zhang, D., & Kuziak, J. (2025). The Influence of Fly Ash Carbonation on the Protective Properties of Concrete Cover Towards Reinforcement. Materials, 18(10), 2181. https://doi.org/10.3390/ma18102181