Article

Research on the Corrosion Resistance and Mechanical Properties of Graphene Oxide–Modified AT13 Coatings

Department of Mechanical Engineering, College of Engineering, Shanghai Ocean University, Shanghai 201306, China
*
Author to whom correspondence should be addressed.
Materials 2025, 18(10), 2168; https://doi.org/10.3390/ma18102168
Submission received: 2 April 2025 / Revised: 3 May 2025 / Accepted: 6 May 2025 / Published: 8 May 2025
(This article belongs to the Section Corrosion)

Abstract

:
The ongoing development of maritime powers has driven markedly growing requirements for novel naval and civilian vessel categories in recent years. The import temperature of gas turbines is rising, and the issue of corrosion can no longer be ignored, creating an urgent need to develop coatings with high-temperature resistance, corrosion resistance, and good toughness. This study utilized plasma spraying technology to prepare composite AT13 ceramic coatings with 0 wt.%, 5 wt.%, 10 wt.%, and 15 wt.% GO/Cu (GO:Cu = 1:10) content. It systematically investigated the effects of GO/Cu doping on the porosity, Vickers hardness, fracture toughness, thermal shock resistance, and corrosion resistance of the AT13 coatings while exploring the corrosion behavior of the composite coatings. The experimental results indicate that doping with GO/Cu can effectively fill the pores of the coatings, leading to an overall improvement in coating performance. The coating with 10 wt.% doping (G2) exhibited the best comprehensive performance, with a 72% reduction in porosity compared to the original coating, a 23.2% increase in Vickers hardness, a 31.4% enhancement in fracture toughness, and an 83% decrease in corrosion rate. It also demonstrated the best thermal shock resistance, maintaining a relatively intact surface after 31 days of immersion in artificial seawater, with only a few pitting and cracking defects observed in the areas of corrosion.

1. Introduction

The ongoing development of maritime powers has driven markedly growing requirements for novel naval and civilian vessel categories in recent years. With the continuous advancement of marine vessel performance requirements, gas turbines are gradually replacing traditional steam and diesel power systems due to their advantages of high thermal efficiency, smooth operation, and environmental friendliness. However, the increasing inlet temperatures of gas turbines have led to prominent issues, including increased tip clearance caused by thermal erosion, deterioration of compressor performance, and failure of turbine blades due to fracture [1,2]. Traditional coating protection systems can no longer adapt to gas turbines’ increasingly high operating temperatures [3]. Nowadays, thermal barrier coatings are often selected to withstand high-temperature conditions. Conventional thermal barrier coatings, such as yttria-stabilized zirconia (YSZ), Al2O3-TiO2, and rare earth zirconates, are primarily porous coatings that can operate effectively at temperatures exceeding a thousand degrees Celsius [4,5,6,7,8]. Under high-temperature marine environments, the toughness of coatings is subject to the coupled effects of chemical corrosion, mechanical loads, and wet-heat aging [9,10], which pose severe challenges to the toughness and corrosion resistance of the coatings. Existing thermal barrier coatings, which are primarily ceramic-based, exhibit poor toughness, and their porous structure is prone to accumulation of corrosion products, leading to the formation of micro-cracks and local delamination in the coatings, rendering them inadequate to meet current usage demands. Developing coatings that are high-temperature, corrosion-resistant, and tough is crucial for increasing the service life of marine engineering equipment, particularly gas turbines.
To enable existing thermal barrier coatings to adapt to the increasingly harsh operating conditions of gas turbines, it is necessary to further enhance their toughness and corrosion resistance. Doping modification is a commonly used method for modifying coatings [11,12]. Sanket Mehar et al. [13] sprayed Al2O3-3 wt.% TiO2 (AT) coatings with different proportions of Y2O3-stabilized zirconia (YSZ) on the 316 L stainless steel substrate. The study found that the AT coating with 30% YSZ exhibited a lower friction coefficient, significantly improving its wear resistance. Among a series of doping phases, graphene oxide has become a key additive for the next generation of high-performance composite materials due to its excellent toughening effects and corrosion resistance. Usha Pandey et al. [14] incorporated graphene oxide–modified TiO2 into nickel-based coatings and sprayed them onto low-carbon steel. The research demonstrated that the corrosion resistance of the composite coatings was significantly improved compared to the original coatings. A. Amudha et al. [15] added graphene oxide to alumina coating and sprayed it onto the low-carbon steel substrate IS2062 [16] grade B steel, resulting in a significant enhancement in both the fracture toughness and microhardness of the coatings compared to the original coatings. Cheng Zhang et al. [17] prepared thermoplastic polyurethane (TPU) composite materials with different compositions. The study indicated that the composite filler with an Al2O3 content of 8.9 wt.%, a GO content of 0.1 wt.%, and a Si3N4ws content of 1.0 wt.% exhibited excellent thermal stability and toughness. Current research often focuses on one or two aspects, such as high-temperature resistance, corrosion resistance, and high toughness, which do not meet the demands of marine gas turbines for high temperature resistance, high salinity resistance, and high toughness [18,19,20,21,22,23].
This study addresses the requirements of marine gas turbines for high temperature resistance, high salinity resistance, and high toughness by preparing composite AT13 coatings with different GO/Cu contents using plasma spraying technology. The effects of GO/Cu addition on the corrosion resistance, toughness, and thermal shock performance of the composite coatings were investigated through characterization, aiming to identify the optimal composition and explore the corrosion behavior in artificial seawater.

2. Materials and Methods

2.1. Experimental Raw Materials

The substrate selected is 45# steel, which was cut into dimensions of 10 mm × 12 mm × 10 mm for subsequent use. Before spraying the coating, the substrate must undergo sandblasting and dust removal treatment. The coating material AT13 powder and the bond layer spraying material NiCrAlY were both purchased from Beijing Sanspu Rui New Materials Co., Ltd. (Beijing, China); the additive material Cu powder was purchased from Shanghai National Nano Technology Co., Ltd. (Shanghai, China), and the GO was sourced from Suzhou Carbonfeng Graphene Technology Co., Ltd. (Suzhou, China). The specific parameters of the experimental materials are shown in Table 1.

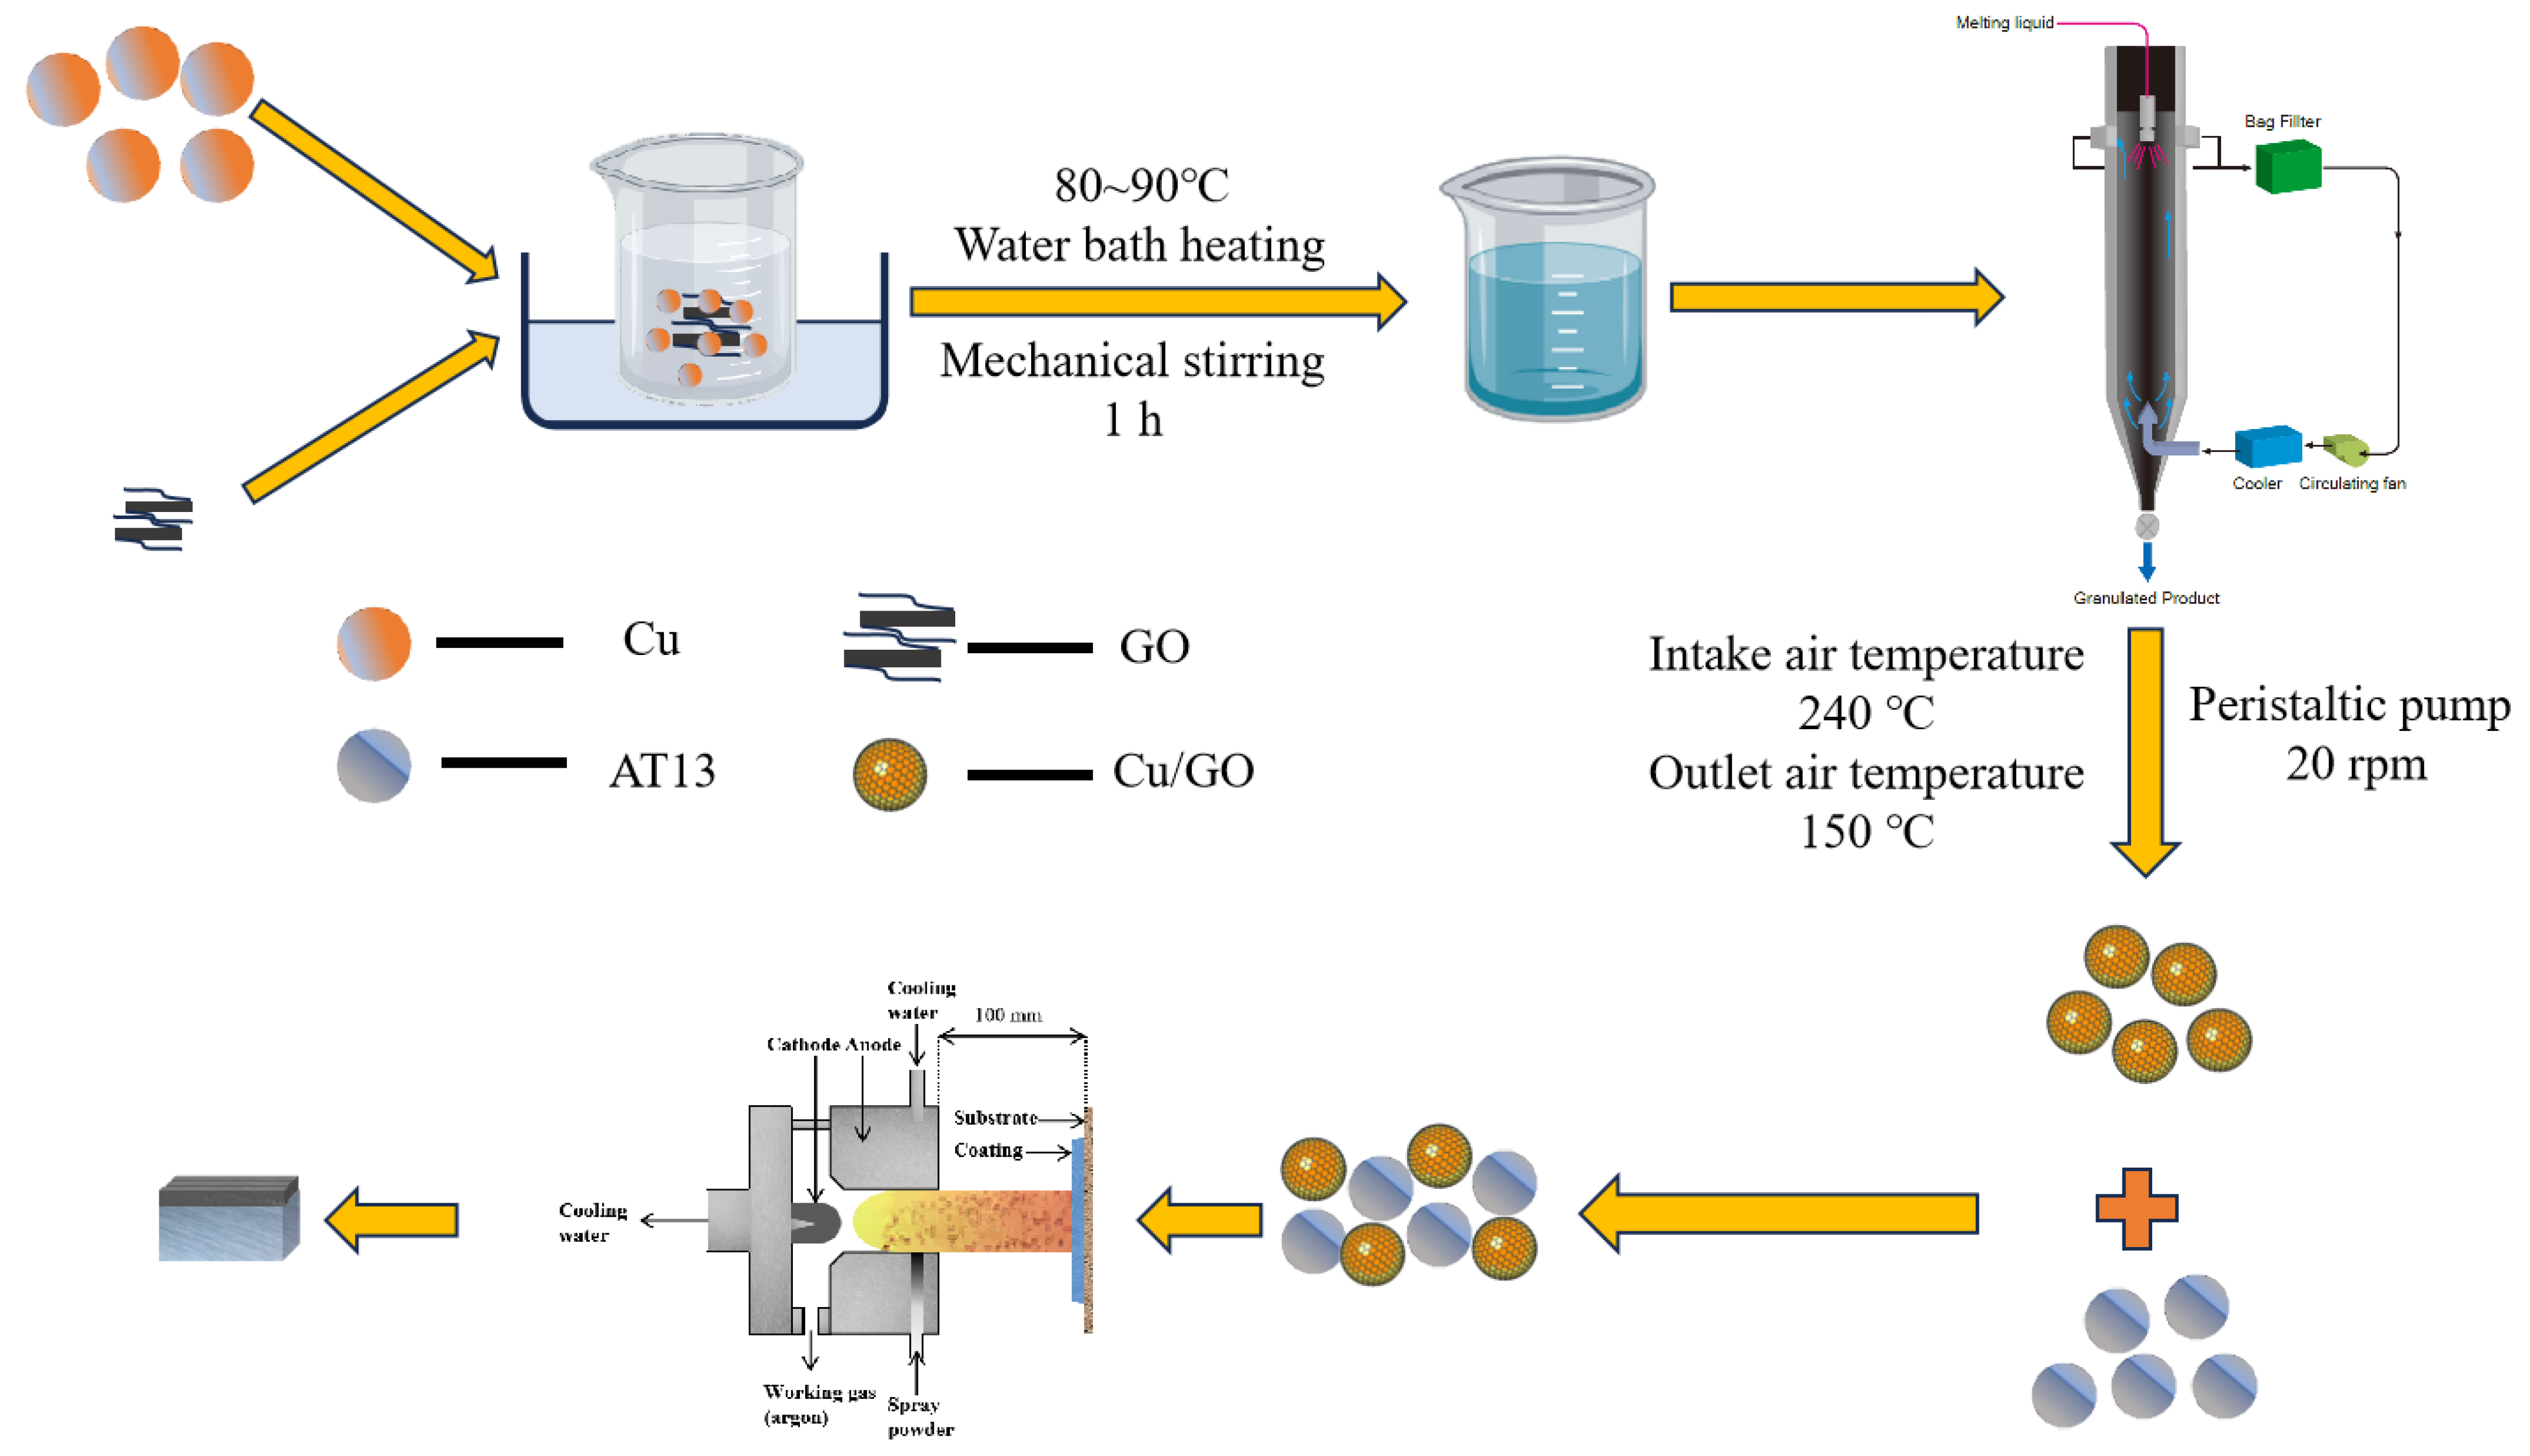
2.2. Preparation of Coatings

This study strictly followed the procedure outlined below. The schematic diagram of the coating preparation process is shown in Figure 1. First, the GO powder has a small particle size and cannot be used directly for spraying. Therefore, GO powder was mixed with Cu in a ratio of 1:10 and agglomerated using spray granulation to prepare a GO/Cu composite powder suitable for spraying. The composite powder was then blended with AT13 powder in a mixing machine for 12 h to obtain a uniformly mixed composite AT13 powder. The microscopic morphology of the selected powder is shown in Figure 2. To find the appropriate doping ratio, composite spray coating powders with GO/Cu contents of 5 wt.%, 10 wt.%, and 15 wt.% were prepared.
Due to the significant difference in thermal expansion coefficients between the ceramic coating and the substrate, a bonding layer was added between them. Using plasma spraying technology, a bonding layer was first applied to the substrate’s surface, followed by spraying of the original powder and composite powders with three different contents onto the bonding layer. Table 2 shows the spraying parameters. The prepared coatings are classified into four types––G0, G1, G2, and G3––according to the proportion of GO/Cu composite powder, corresponding to AT13 composite coatings with GO/Cu composite powder contents of 0 wt.%, 5 wt.%, 10 wt.%, and 15 wt.%, respectively.

2.3. Characterization Analysis Methods

The surface morphology of samples was observed using a scanning electron microscope (SEM, JSM-7500F, JEOL, Tokyo, Japan), and energy dispersive spectroscopy (EDS) analysis was performed. The porosity test was conducted by calculating the proportion of pores in surface and cross-sectional morphology images of the coating obtained via SEM using ImageJ software (https://imagej.net/ij/ (accessed on 1 September 2023)). The coating’s hardness was tested with a micro Vickers hardness tester at a loading pressure of 3 N for a holding time of 15 s. Twelve data points were measured to calculate the average value. The fracture toughness was calculated using the indentation method, and Figure 3 illustrates the schematic of the indentation method. The formula for calculating fracture toughness [24] is:
K I C = 0.16 H V a ( c a ) 3 2
In this context, K I C represents the fracture toughness (MPa·m¹/²), H V denotes the Vickers hardness (GPa), a is half of the diagonal length of the indentation (μm), and c is the distance from the center of the indentation to the tip of the crack (μm).
Thermal shock performance was tested in a tubular resistance furnace. During the testing, the furnace temperature was raised to 800 °C, and the sample was placed inside to heat for 5 min, followed by a 20 min hold. Afterward, the sample was quickly removed and immersed in water for cooling. When the temperature dropped to 30–50 °C, this signified completion of one thermal shock experiment. This process was repeated until failure occurred (when visible macroscopic cracks appeared on the surface or the area of local delamination exceeded 10% of the overall area) to test the thermal shock performance of the coating. The coefficient of thermal expansion (CTE) of the composite coating was estimated using the rule of mixtures:
α c o m p o s i t e = ϕ A T 13 α A T 13 + ϕ d o p a n t ( 0.9 α C u + 0.1 α G O )
In this context, ϕAT13 and ϕdopant are the volume fractions of the matrix and the dopant, respectively, αAT13 = 8.5 × 10⁻⁶/K [25], αCu = 16.5 × 10⁻⁶/K [26], and αGO = 6.0 × 10⁻⁶/K [27].
The electrochemical tests were conducted using an electrochemical workstation (Reference 600+, Gamry, Warminster, PA, USA). In this setup, a classic three-electrode system was employed. The composite ceramic coating sample served as the working electrode, while the counter electrode and reference electrode were a platinum grid and a saturated calomel electrode (SCE), respectively. A 3.5% NaCl solution was used as the electrolyte in the electrochemical tests. Polarization scans were performed at a scan rate of 1 mV/s, ranging from −0.5 mV to 0.5 mV. Before all tests, the samples were exposed to the electrolyte solution for 1 h to achieve a stable open-circuit potential. The polarization curve parameters were analyzed using the Tafel extrapolation method. In order to further study the corrosion failure process of the composite coatings and the corrosion law, the G2 coating, which performed better in the polarization curves and has a more stable coating structure, was selected to undergo a 31-day total immersion experiment in artificial seawater (Table 3 presents the formulation of artificial seawater). The electrochemical impedance spectra of the G2 coating at 1, 4, 10, 18, 24, and 31 days were measured through an electrochemical workstation, and the samples that had been immersed for 31 days were finally tested for their corrosion mechanism.

3. Results and Discussion

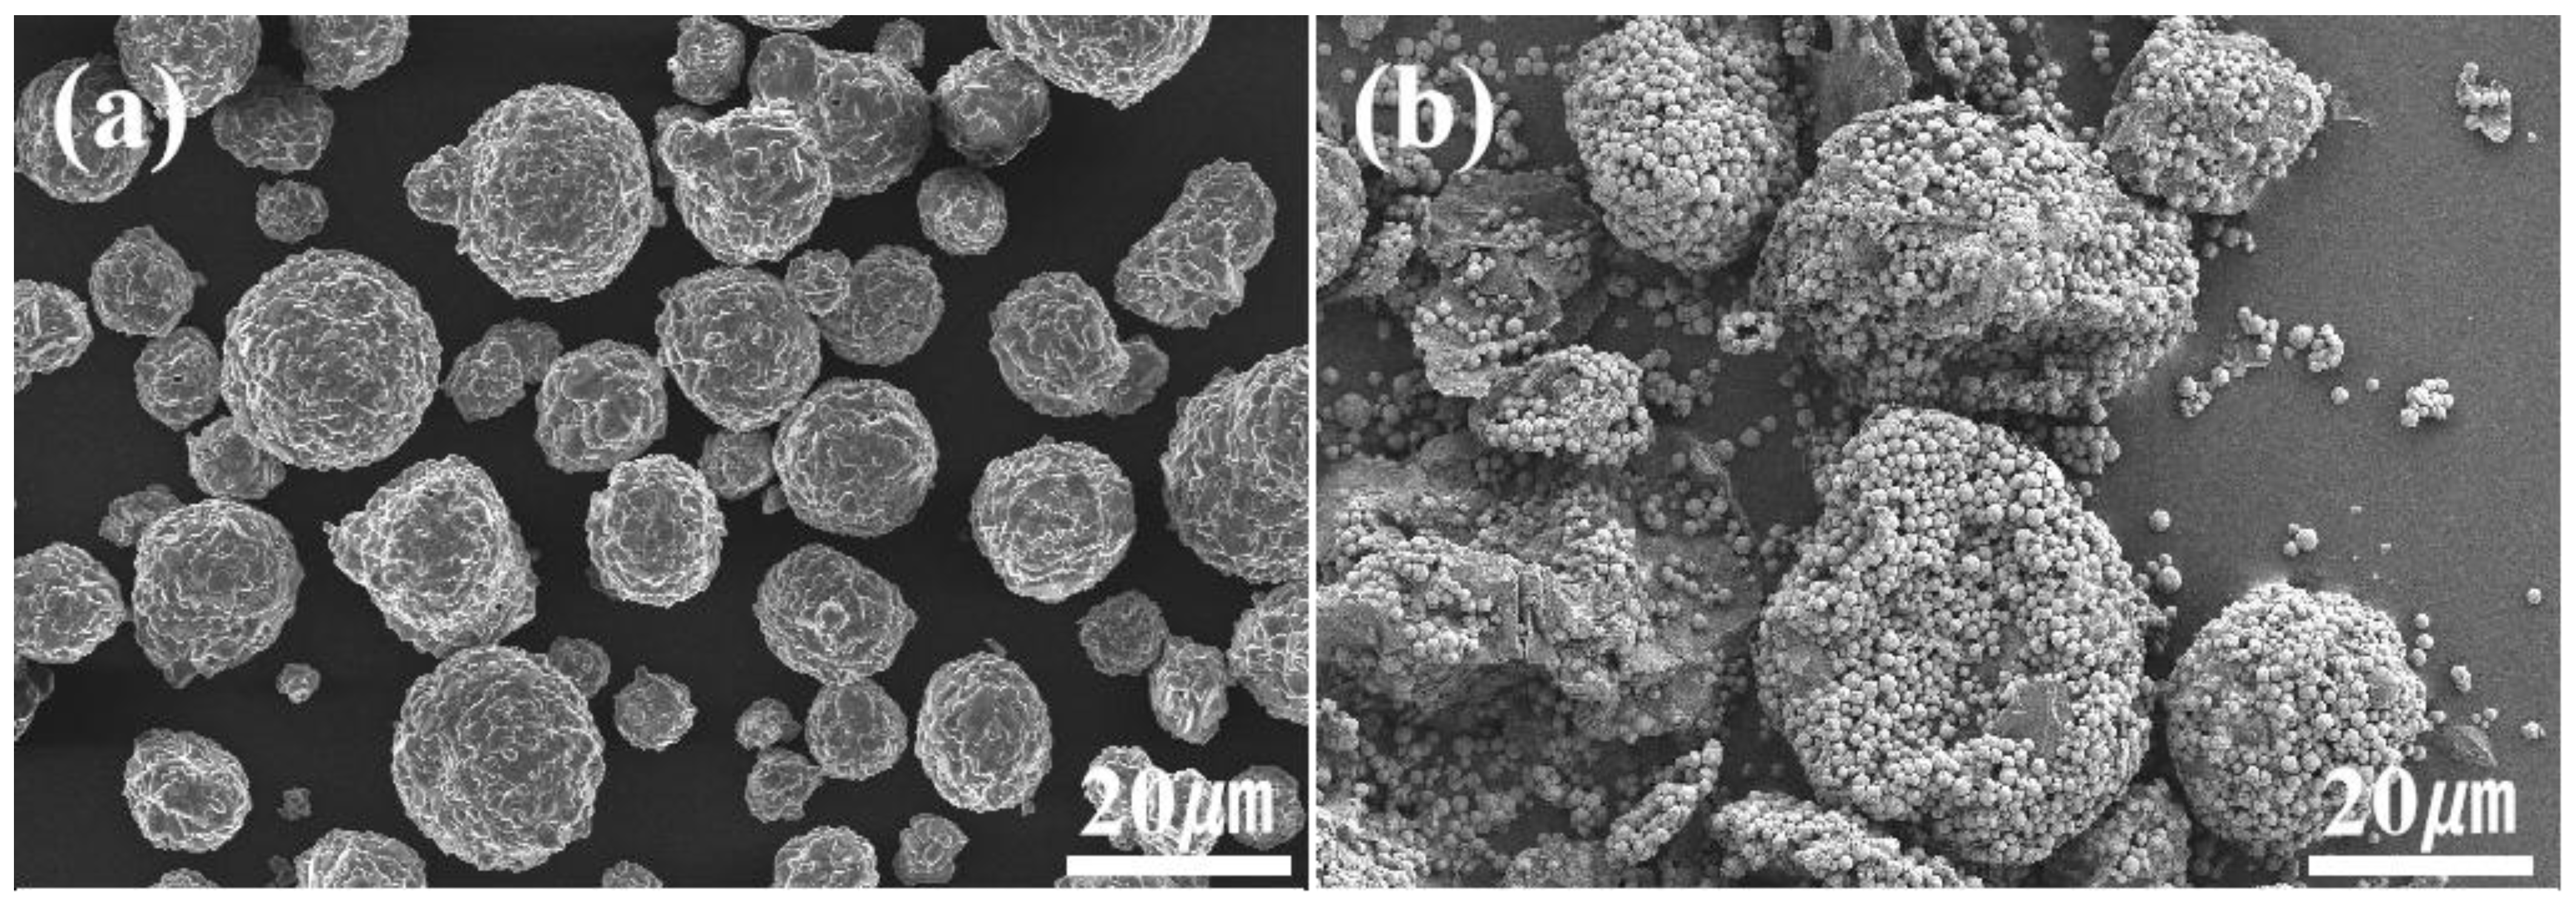
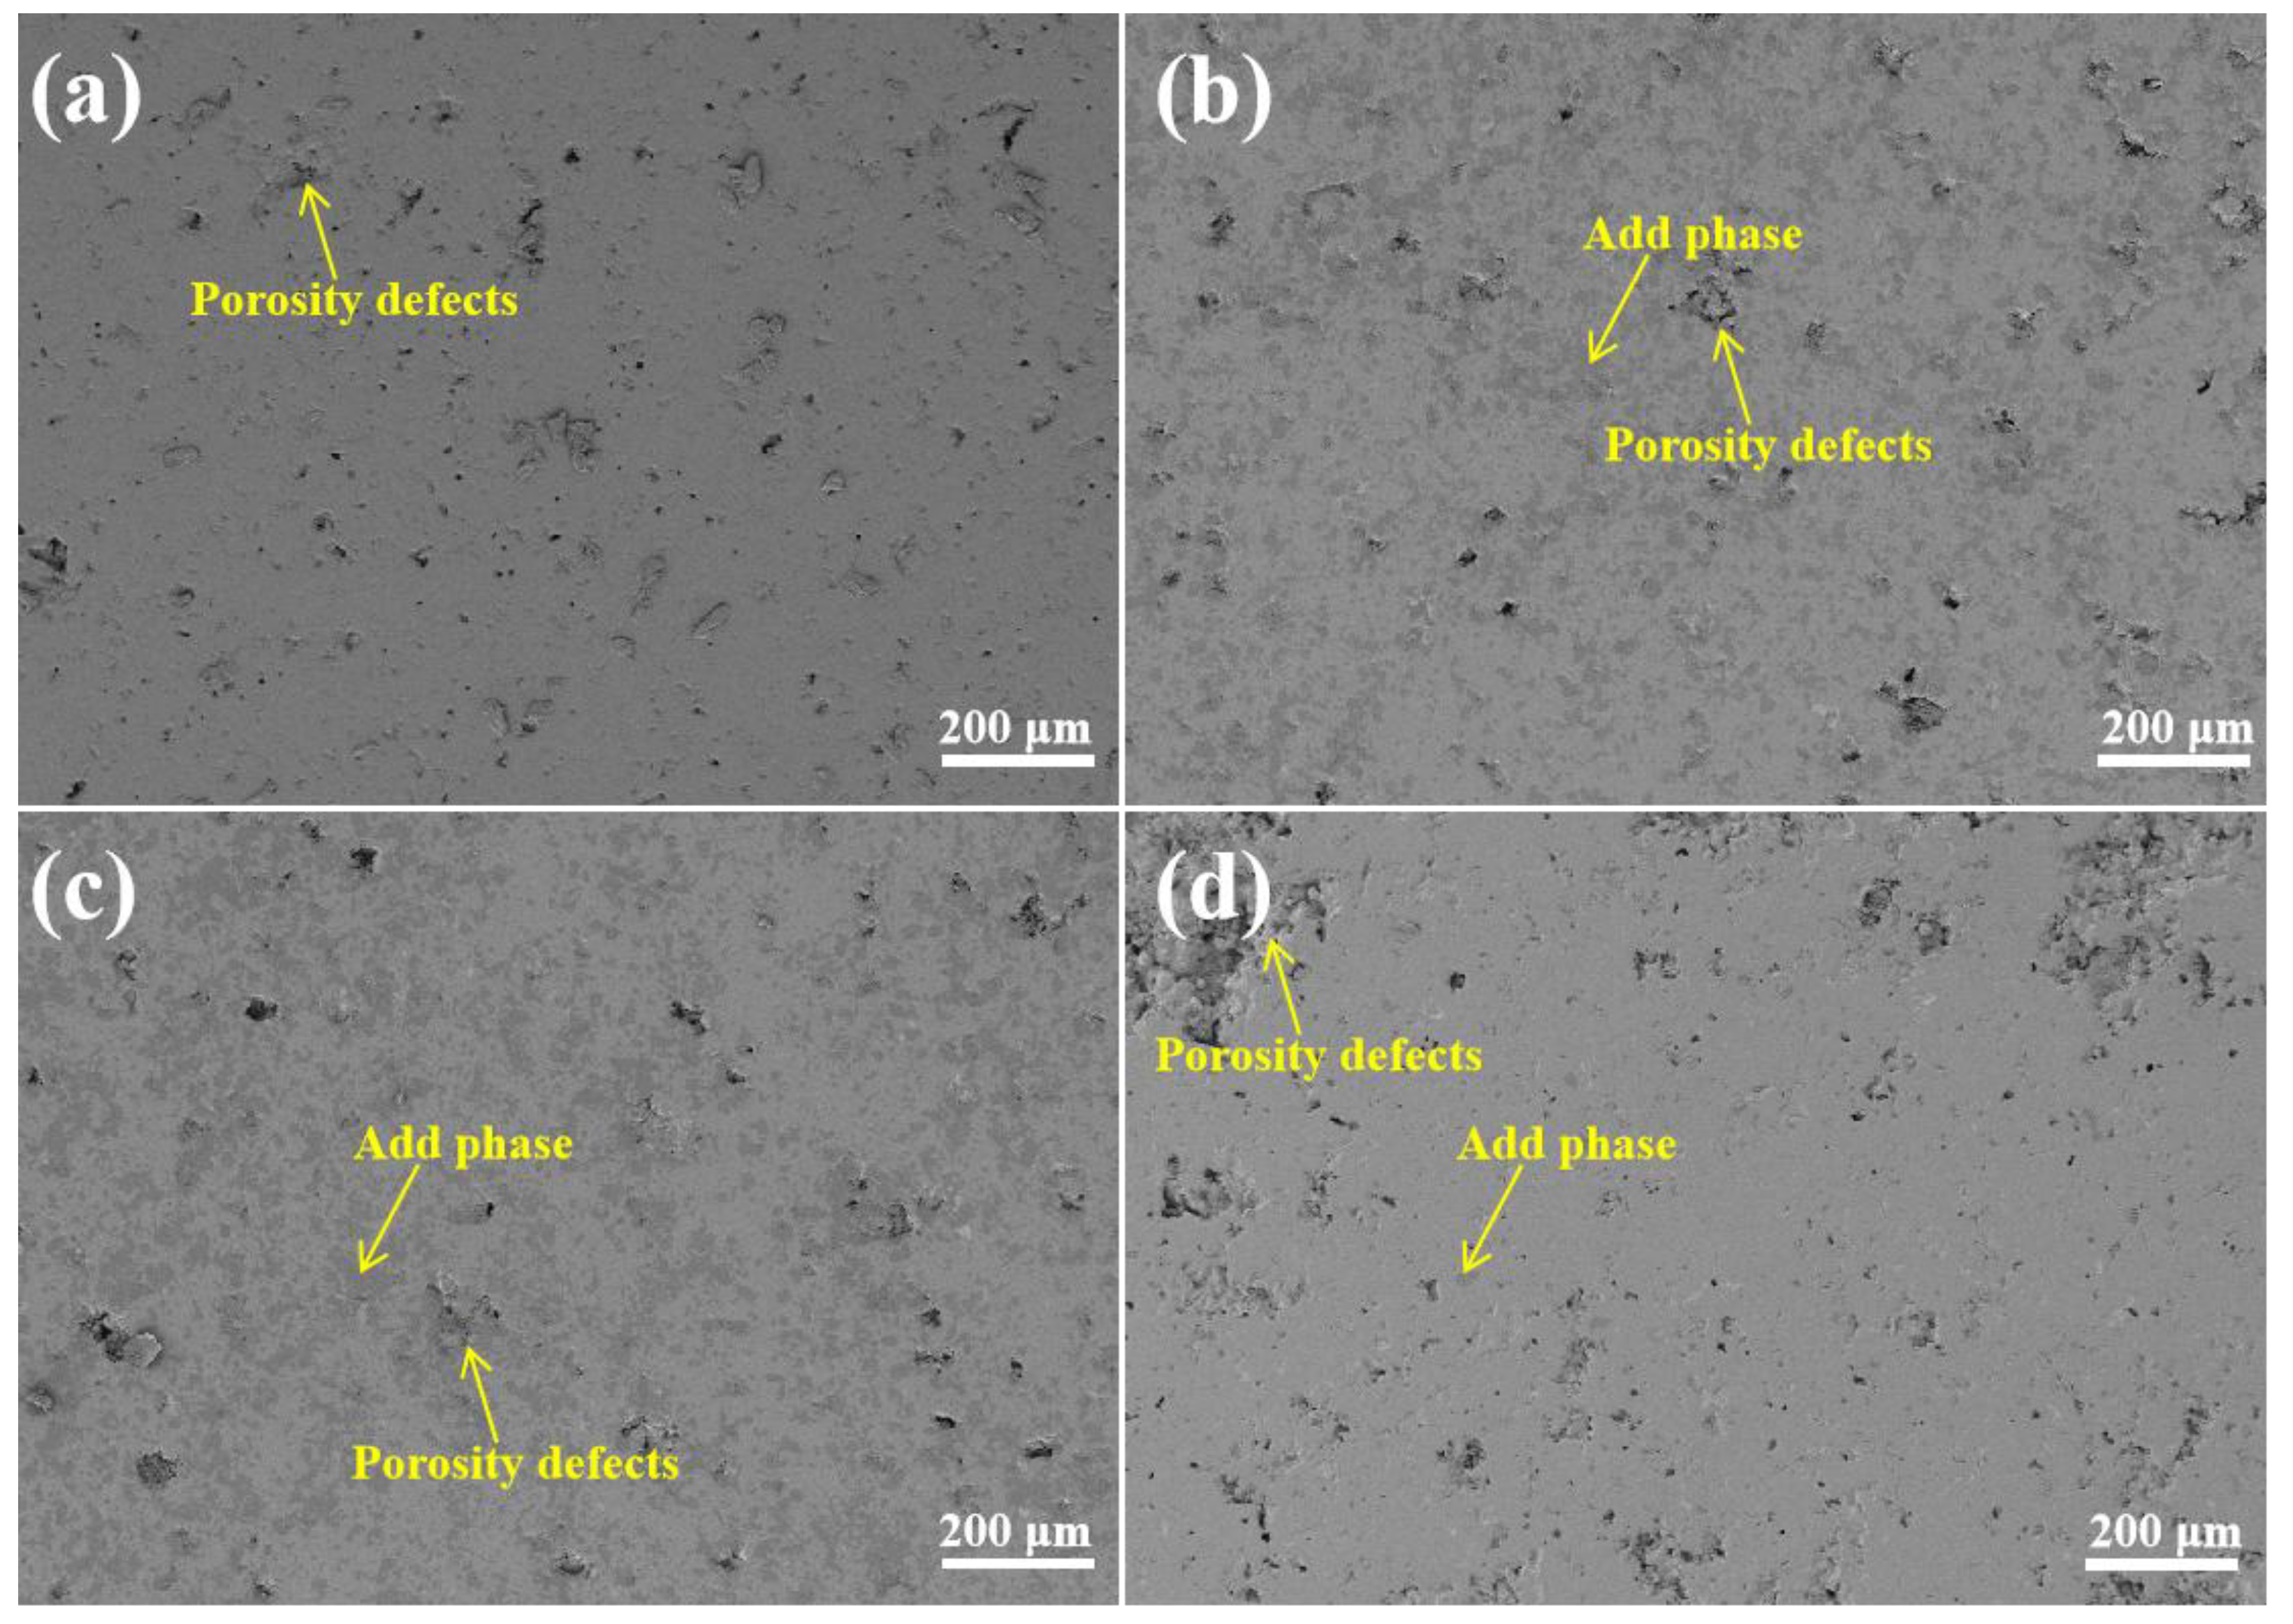
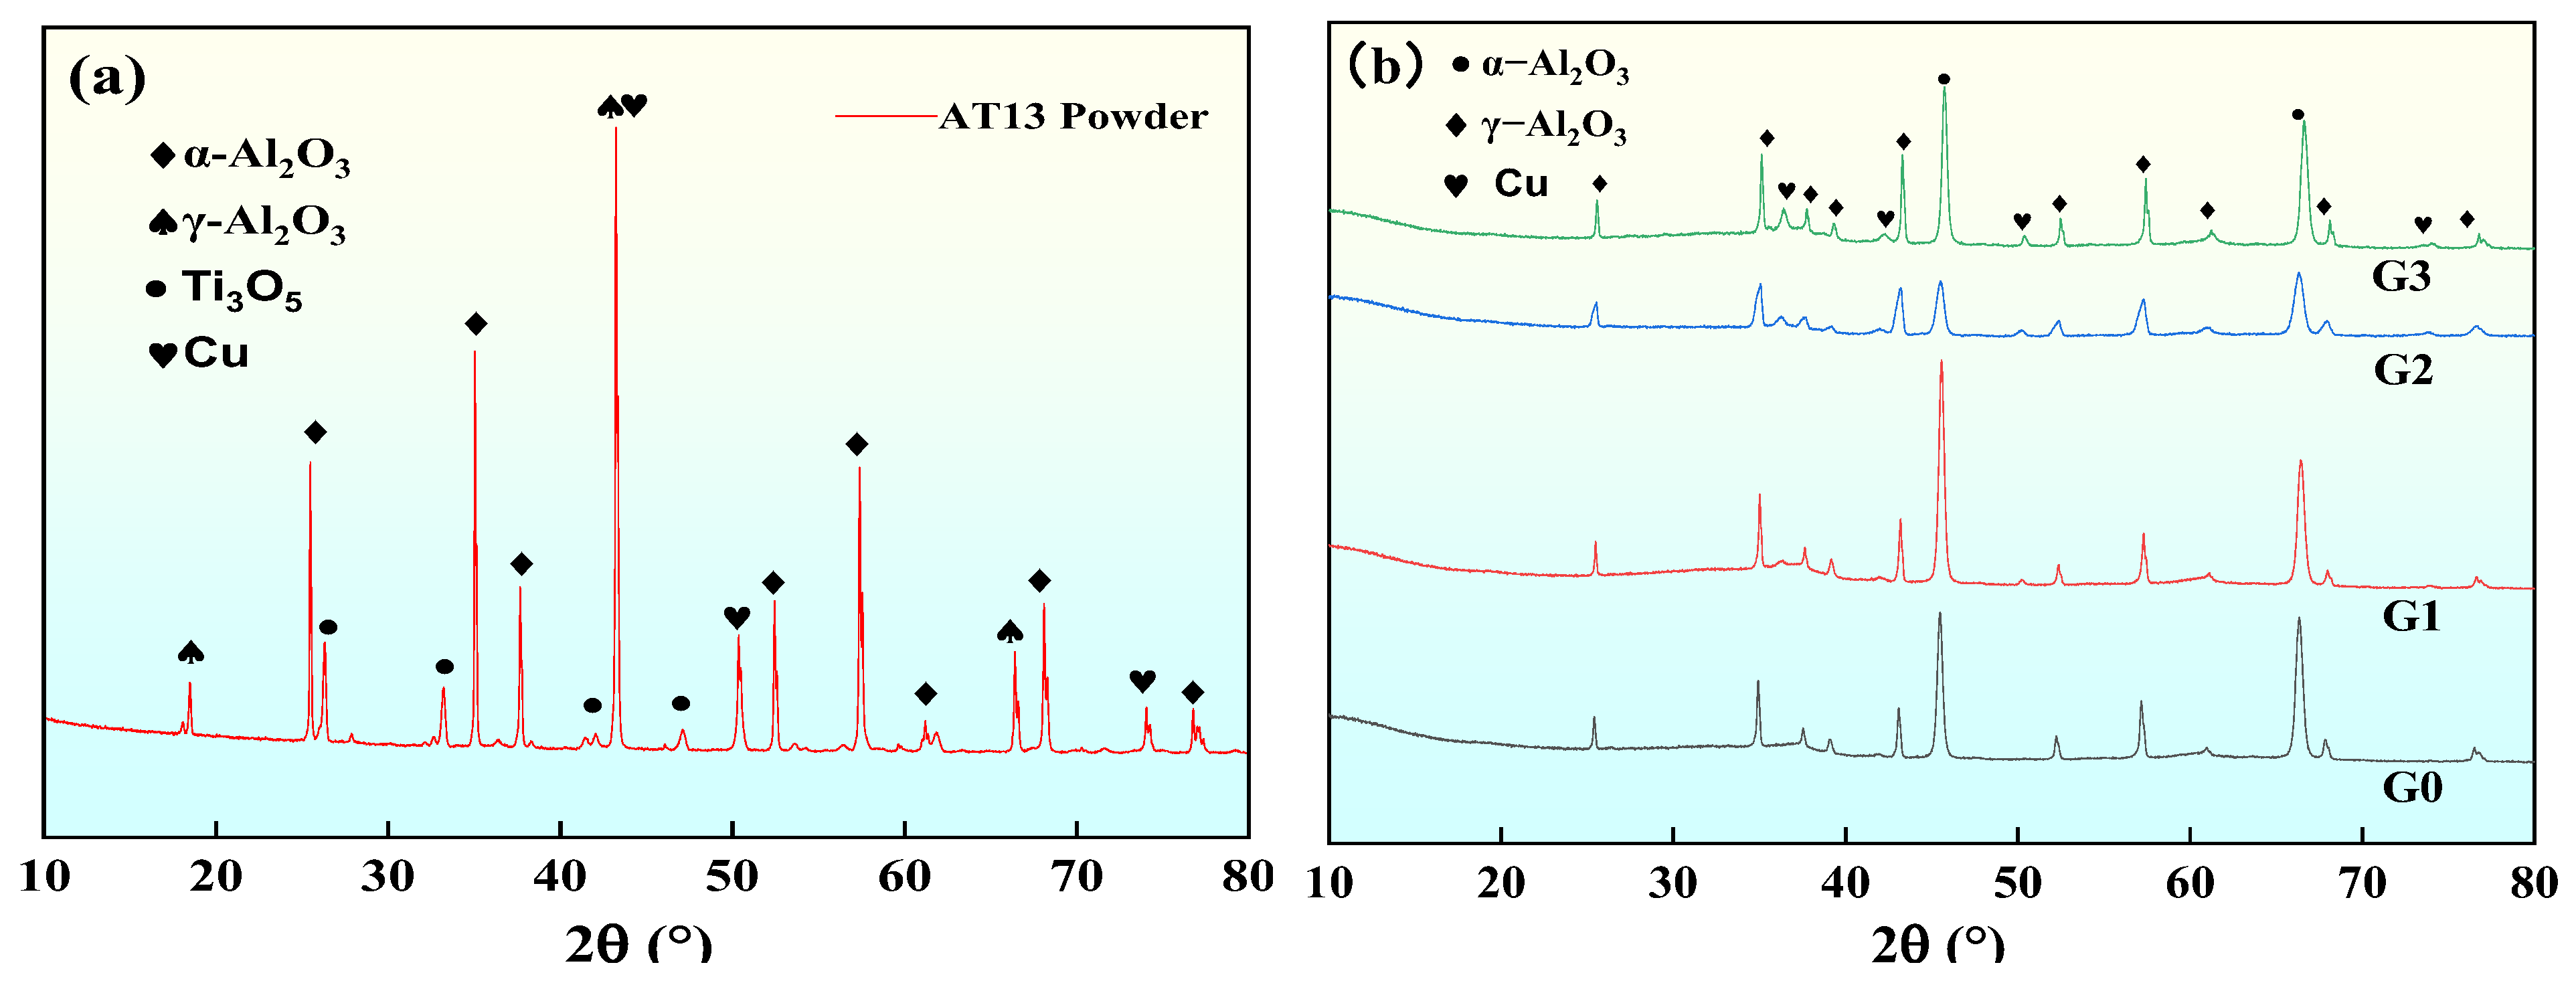
3.1. Morphology and Porosity

Figure 4 shows the surface microscopic morphology of the G0, G1, G2, and G3 composite coatings formed by plasma spraying. As can be seen from the figure, the presence of additive phases was observed on the surface of the G1, G2, and G3 coatings. The additive phases of the G1 and G2 coatings were uniformly distributed, with fewer defects; the additive phases of the G3 coating exhibited uneven phase distribution and had a greater number of porosity defects compared to the original coating.
The porosities of the coating surface and cross-section, as shown in Figure 5, were calculated from SEM images using ImageJ software. The figure shows that the coating porosity increased successively with the addition ratio of GO/Cu. When GO/Cu was added in smaller amounts, it melted into a flat shape at high temperatures and stayed inside the coating to fill the internal pore defects, making the coating denser. A larger amount of GO will accumulate on the surface of the substrate due to its higher melting point, further causing defects [28].
Figure 6a,b show the XRD patterns of AT13/GO/Cu powder and the four coatings, respectively. The AT13 composite powder consists of α-Al2O3, γ-Al2O3, Cu, and Ti3O5 phases, while the coating consists of α-Al2O3, γ-Al2O3, and Cu phases. The diffraction peaks in the AT13 composite coating predominantly correspond to γ-Al2O3, with only a minority attributed to α-Al2O3. This phenomenon occurs because the nucleation capability of various phases in the melt is determined by the critical nucleation free energy of the solid phase, the critical free energy of γ-Al2O3 is lower compared to that of α-Al2O3, and γ-Al2O3 is preferentially nucleated when the powder is deposited as a melt on the surface of the substrate [29].
The formation of the α-Al2O3 phase is primarily due to incomplete melting of the powder during the plasma spraying process, the presence of semi-molten particles, and the localized high temperatures caused by the spraying operation, which transformed part of γ-Al2O3 into the α-Al2O3 phase [30]. Figure 6b shows that G0, G1, and G3 have more prominent α-Al2O3 phases, while G2 has fewer α-Al2O3 phases. The appearance of the TiO2 phase was not found in the XRD patterns of each coating, which was attributed to the fact that TiO2 might partially react with Al2O3 to form a solid solution during the plasma spraying process, resulting in weakening or disappearance of the pristine TiO2 phase [31,32].
To confirm the presence of TiO2 in the composite coating, an EDS spectrum analysis was conducted on the G2 coating. Figure 7 shows the spectrum of the G2 coating, which clearly indicates the presence of titanium (Ti) with a uniform distribution, thereby confirming the existence of TiO2.

3.2. Vickers Hardness and Fracture Toughness

Figure 8a presents the micro Vickers hardness profile of the coatings. As evident from the data, the Vickers hardness initially increased then decreased with GO/Cu addition, with sample G2 exhibiting a peak hardness of 1152.3 HV0.3, representing a 23.2% enhancement compared to the baseline coating G0. Excessive addition of GO/Cu significantly reduced the Vickers hardness of the coating. The G3 coating, which contains 15% GO/Cu, exhibited a 6.7% decrease in Vickers hardness compared to the original coating.
Figure 8b shows the fracture toughness of the coatings calculated by the indentation method. The addition of GO/Cu significantly improved the fracture toughness of the coatings, and the trend was the same as that of the Vickers hardness. Doping with GO/Cu comprehensively improved the mechanical properties of the coatings.
When a small amount of GO/Cu is added to the AT13 coating, because the specific surface area of GO is large enough to be sufficiently coated with the AT13 coating matrix, there is enough surface transfer stress between GO and the coating matrix to transfer the loads on the coating to GO. Because GO has a high Young’s modulus (Young’s modulus of monolayer graphene can reach up to 231 GPa [33]), the strength of the composite material was significantly improved during the load transfer. Cu, as the carrier of GO, has a low melting point. It can fully melt and further fill the pores and surface defects during the spraying process to enhance the coating’s performance. However, when the amount of GO is excessive, this can lead to aggregation and accumulation. During the spraying process, this causes the coating to exhibit a higher number of casting defects (such as porosity and impurities), thereby reducing the strength of the coating [34,35,36]. In this study, the G2 coating with a 1% GO content had mechanical properties that increased its Vickers hardness by 23.2% and fracture toughness by 31.4% compared to the original coating.

3.3. Thermal Shock Performance

As shown in Figure 9, the AT13 composite coatings exhibited distinct macroscopic morphological evolution during thermal shock testing. The undoped reference coating (G0) developed visible surface cracks detectable by eye after 36 thermal cycles, marking its failure. In contrast, the GO/Cu-doped coatings G1 and G2 showed no macroscopic cracking after 34 and 39 cycles, respectively. However, edge delamination exceeding 10% of the total coating area was observed at these stages, defining their failure criteria. Notably, coating G3 failed prematurely at 27 cycles due to extensive surface cracking concurrent with large-area spallation.
Analysis of failure modes revealed that moderate GO/Cu doping (G1, G2) enhanced thermal shock resistance, while excessive doping (G3) introduced detrimental defects. The thermal shock resistance ranking was as follows: G2 > G1 > G0 > G3, with G2 demonstrating optimal performance.
Figure 10 compares the surface and cross-section morphology of the G0 and G2 coatings after thermal shock experiments. Figure 10a,c show that more cracks were distributed on the surfaces of G0 and G2, and the crack width for G0 was much wider compared with that for G2. Only a few small cracks appeared on the surface of G2, and the incorporation of GO/Cu obviously inhibited the cracks’ emergence and prolongation. Figure 10b,d show that the G0 coating had only slight cracks between the bonding layer and the ceramic layer, while the G2 coating had obvious cracks. This is because the difference in thermal coefficients between the ceramic layer and the bonding layer was further enlarged by the addition of GO/Cu (the thermal expansion coefficients (CTEs) of G0, G1, G2, and G3 are 8.5 × 10⁻⁶/K, 8.85 × 10⁻⁶/K, 9.2 × 10⁻⁶/K, and 9.55 × 10⁻⁶/K, respectively).
Coating G0 surface failure manifested as cracks visible to the naked eye. Cracks appear and proliferate primarily because hot and cold cycles constantly generate thermal stress in the thermal shock experiment, resulting in ceramic coating deformation, which sprouts cracks and continues to expand. Failure of the GO/Cu-doped coatings G1, G2, and G3 manifested as spalling of most of the surface of the edge of the coating. The coating spalling phenomenon is affected by a variety of factors. The first is the difference in thermal coefficients between the ceramic coating and the bonding layer; in general, as the difference in thermal coefficients between the two increases, the stress generated during thermal cycling increases significantly, making the spall phenomenon more likely [37]. During the heating stage, the coefficient of thermal expansion mismatch between the ceramic top coat and bond coat induces differential expansion, with the bond coat exhibiting greater dimensional change than the top coat. The shear stress will lead to cracking and peeling at the interface, and normal stress will lead to peeling of the coating.
In the course of this experiment, no delamination was observed in the G0 coating, while the coatings doped with GO/Cu all failed in the form of coating flaking. This phenomenon may be attributed to the increased coefficient of thermal expansion mismatch between the ceramic coating and bond coat caused by GO/Cu incorporation. During the heating process, because of the poor thermal conductivity of the ceramic coating, a temperature gradient is formed inside the coating, leading to non-uniformity of the coating, and the thermal stresses generated inside can lead to cracking of the coating. On the other hand, the metal elements of the bonding layer will be oxidized at high temperatures in the middle of the bonding layer. At the beginning, the growth of TGO is very rapid, during which Al elements preferentially oxidize to form a dense Al2O3 layer. The Al2O3 layer exhibits good anti-oxidation properties, and its presence can slow down further oxidation, inhibiting the growth rate of TGO. As the experiment continues, the TGO layer grows further, and some Y elements oxidize to form Y2O3. When the content of Al elements is further depleted to a low level, Cr and Ni elements will undergo oxidation reactions to produce Cr2O3 and NiO, among others. Pore defects in the coating affect the TGO growth rate. If the surface ceramic layer is spalled during the production of TGO, the bond coat becomes exposed to the atmospheric environment, and growth of TGO will be further promoted. During the growth of TGO, interfacial stresses are constantly generated, causing cracks to appear and spread between the ceramic layer and the TGO layer. Overall, spalling and cracking of the ceramic coating are mainly due to an excessive difference in thermal coefficients between the ceramic layer and the bonding layer, the thermal stresses generated during the ceramic layer’s warming process, and the coupling of interfacial stresses continuously generated during growth of the TGO layer.

3.4. Corrosion Resistance

The polarization curves of AT13 coatings with different GO/Cu contents in 3.5 wt.% NaCl solution were measured using an electrochemical workstation and are shown in Figure 11 after Tafel curve fitting. The self-corrosion potential Ecorr reacts to the ease with which a material can be corroded, and the self-corrosion current density Icorr reacts to the actual corrosion rate of the material. The larger the Ecorr, the more excellent the material’s resistance to corrosion, and the smaller the Icorr, the better the material’s corrosion resistance [38,39,40]. As seen from the Tafel curve in Figure 11, incorporation of GO/Cu induced a significant positive shift in the corrosion potential, demonstrating markedly enhanced corrosion resistance.
Combining the polarization curve–fitted parameters is necessary to further evaluate each coating’s corrosion resistance. As shown in Table 4, which shows the data fitted from the polarization curves, the Ecorr values of the GO/Cu-modified coatings were all positively shifted by more than 100 mV compared with the original coatings, and the Icorr decreased by one order of magnitude. It is worth noting that the G1 and G2 coatings had similar self-corrosion potentials, but the G2 coating exhibited a 37.3% reduction in corrosion current density compared to G1. This difference resulted in the G2 coating showing better corrosion resistance, with the corrosion rate decreasing from 0.331 mm/a to 0.057 mm/a for the original coating.

3.5. Corrosion Pattern of an AT13/Cu/GO Ceramic Coating in Artificial Seawater

The best-performing coating, G2, was immersed in seawater for 31 d to investigate its corrosion behavior. Figure 12 shows the impedance map of coating G2 over 31 d of immersion time. The Nyquist curve of the tolerant arc length radius size is related to corrosion resistance; the larger the radius of the capacitive arc, the more stable the passive film formed on the material surface and the better the corrosion resistance of the material [41,42,43]. The corrosion process can be categorized into two stages, pre-corrosion (1–10 days) and post-corrosion (18–31 days), based on changes in the impedance spectra of the coatings, as shown in Figure 12a. The composite AT13 coating has only a capacitive resistance arc in the pre-corrosion phase, which is mainly controlled by charge transfer. In the late stage of corrosion, the coating impedance spectrum shows a combination of capacitive arcs and Warburg diffusion curves, and this stage is mainly for the diffusion process of the coating corrosion products.
As can be seen from the Bode angular diagram, only one time constant exists in the pre-corrosion stage. In the late corrosion stage, two peaks appear in the Bode angular diagram, indicating two time constants: the first time constant corresponds to the capacitive response of the coating solution, and the second corresponds to the interfacial response of the coating substrate. The appearance of a double time constant indicates that the corrosion medium has reached the coating–substrate interface through the pores, forming a localized corrosion microcell. The Bode phase diagram, to a certain degree, reflects changes in the corrosion resistance of the coating, as can be seen from the figure; the trend of its impedance value and the Nyquist diagram has a consistent tendency to decline and then rise and then decline and then rise. In the pre-corrosion period, with the erosion of corrosive media, the coating corrosion resistance significantly decreased; from 10 d to 18 d, the coating corrosion resistance with the accumulation of corrosion products appeared to rebound; from 18 d to 24 d, during this stage of coating corrosion, corrosive media entered through the coating pore defects to reach the coating–substrate interface, and the formation of localized corrosion resulted in a decrease in corrosion resistance; after 31 d of immersion, the dissolution and generation of corrosion products reached an equilibrium state, having filled the pore defects, which blocked diffusion of corrosive media, and the coating corrosion resistance once again rebounded.
The equivalent circuits were fitted using the software program Zview 3.1, and the pre-corrosion circuit and post-corrosion circuit diagrams are shown in Figure 13a and Figure 13b, respectively. Rs represents the solution resistance; Rp represents the pore resistance, which represents the ability of the coating to resist the intrusion of corrosive media; Rct represents the charge transfer resistance, which can be used to express the ease of charge transfer across the interface of the two phases in the electrode process; CPEf represents the capacitance of the coating; CPEdl stands for the capacitance of the double electric layer, which reflects the condition of the metal surface and corrosive media; and W stands for the Warburg impedance. The statistical significance of the fitted parameters was evaluated using a threshold of α = 0.05 (95% confidence level).
The variation of the fitted parameters of each component with time is shown in Table 5. Coating capacitance CPEf in the pre-corrosion period with the erosion of corrosive media rapidly decreased and then stabilized; during the 18–24 d period, the corrosive media underwent pore defect diffusion to reach the coating–substrate interface; and the coating capacitance further declined during the 24–31 d period due to the generation of corrosion products and dissolution of the equilibrium to rebound. The CPEdl emerges when the corrosive medium penetrates to the coating–substrate interface, followed by a decrease due to corrosion product accumulation. Pore resistance Rp in the early stage of corrosion declined by an order of magnitude. At this corrosion stage, the medium erodes the coating through pore defects on the surface. Some tiny cracks appear on the coating. Pore defects cause severe damage to the coating by 10 d. From 10 to 18 d, Rp continuously changes with the generation and dissolution of corrosion products. After 31 d of immersion, the generation and dissolution of corrosion products reaches equilibrium. At this point, corrosion products significantly fill the coating pores. This leads to a renewed rise in Rp. The charge transfer resistance (Rct) shows an overall decreasing trend. Charge transfer becomes easier. Rct drops by an order of magnitude when the corrosive medium contacts the coating–substrate interface. Pore blockage in the later corrosion stages causes corrosion resistance to rebound. Rct also rebounds accordingly.
As seen in Figure 14a, the coating surface was relatively intact after 31 d of artificial seawater immersion, and there were no large pits or cracks. Moreover, electrochemical corrosion of the coating first appeared in the initial defective part and gradually expanded, and only a tiny number of pits and small cracks were observed after enlargement of the defective part.

3.6. Corrosion Failure Mechanism

Figure 15 shows the corrosion mechanism of the G2 coating after soaking in artificial seawater for 31 days. After doping with GO/Cu, the coating’s porosity improved, and the surface became relatively dense without the formation of through holes. This prevented the corrosion products from directly contacting the substrate in the early stages of corrosion, allowing them to remain within the coating, thereby maintaining good corrosion resistance. As the soaking time increased, the corrosive medium diffused through the pores to the coating–substrate interface, leading to localized corrosion and a further decline in corrosion resistance. In the later stages of corrosion, a balance was reached between generation and dissolution of the corrosive medium and products, which filled the pores of the coating. The resulting blockage effect enhanced the coating’s corrosion resistance.
The addition of GO/Cu not only fills the pores of the coating, making it denser, but the flaky structure of GO, with its large specific surface area and high Young’s modulus, allows it to be dispersed throughout the coating [44,45], providing structural support. This makes the propagation of cracks within the coating more difficult, reducing the formation of corrosion pathways and significantly decreasing the corrosion rate. Additionally, its unique network structure complicates the passage of corrosive media, and graphene oxide exhibits good chemical inertia, preventing it from reacting with corrosive substances. These factors result in a convoluted path for the corrosive media within the coating, significantly extending the coating’s service life.

4. Conclusions

This study prepared composite AT13 coatings with different GO/Cu contents using plasma spraying technology. By characterizing the corrosion resistance, toughness, and thermal shock performance of the composite coatings, the effects of the addition of GO/Cu on the coating properties were investigated. The corrosion behavior of the composite AT13 coatings was studied through artificial seawater immersion experiments, leading to the following conclusions.
(1)
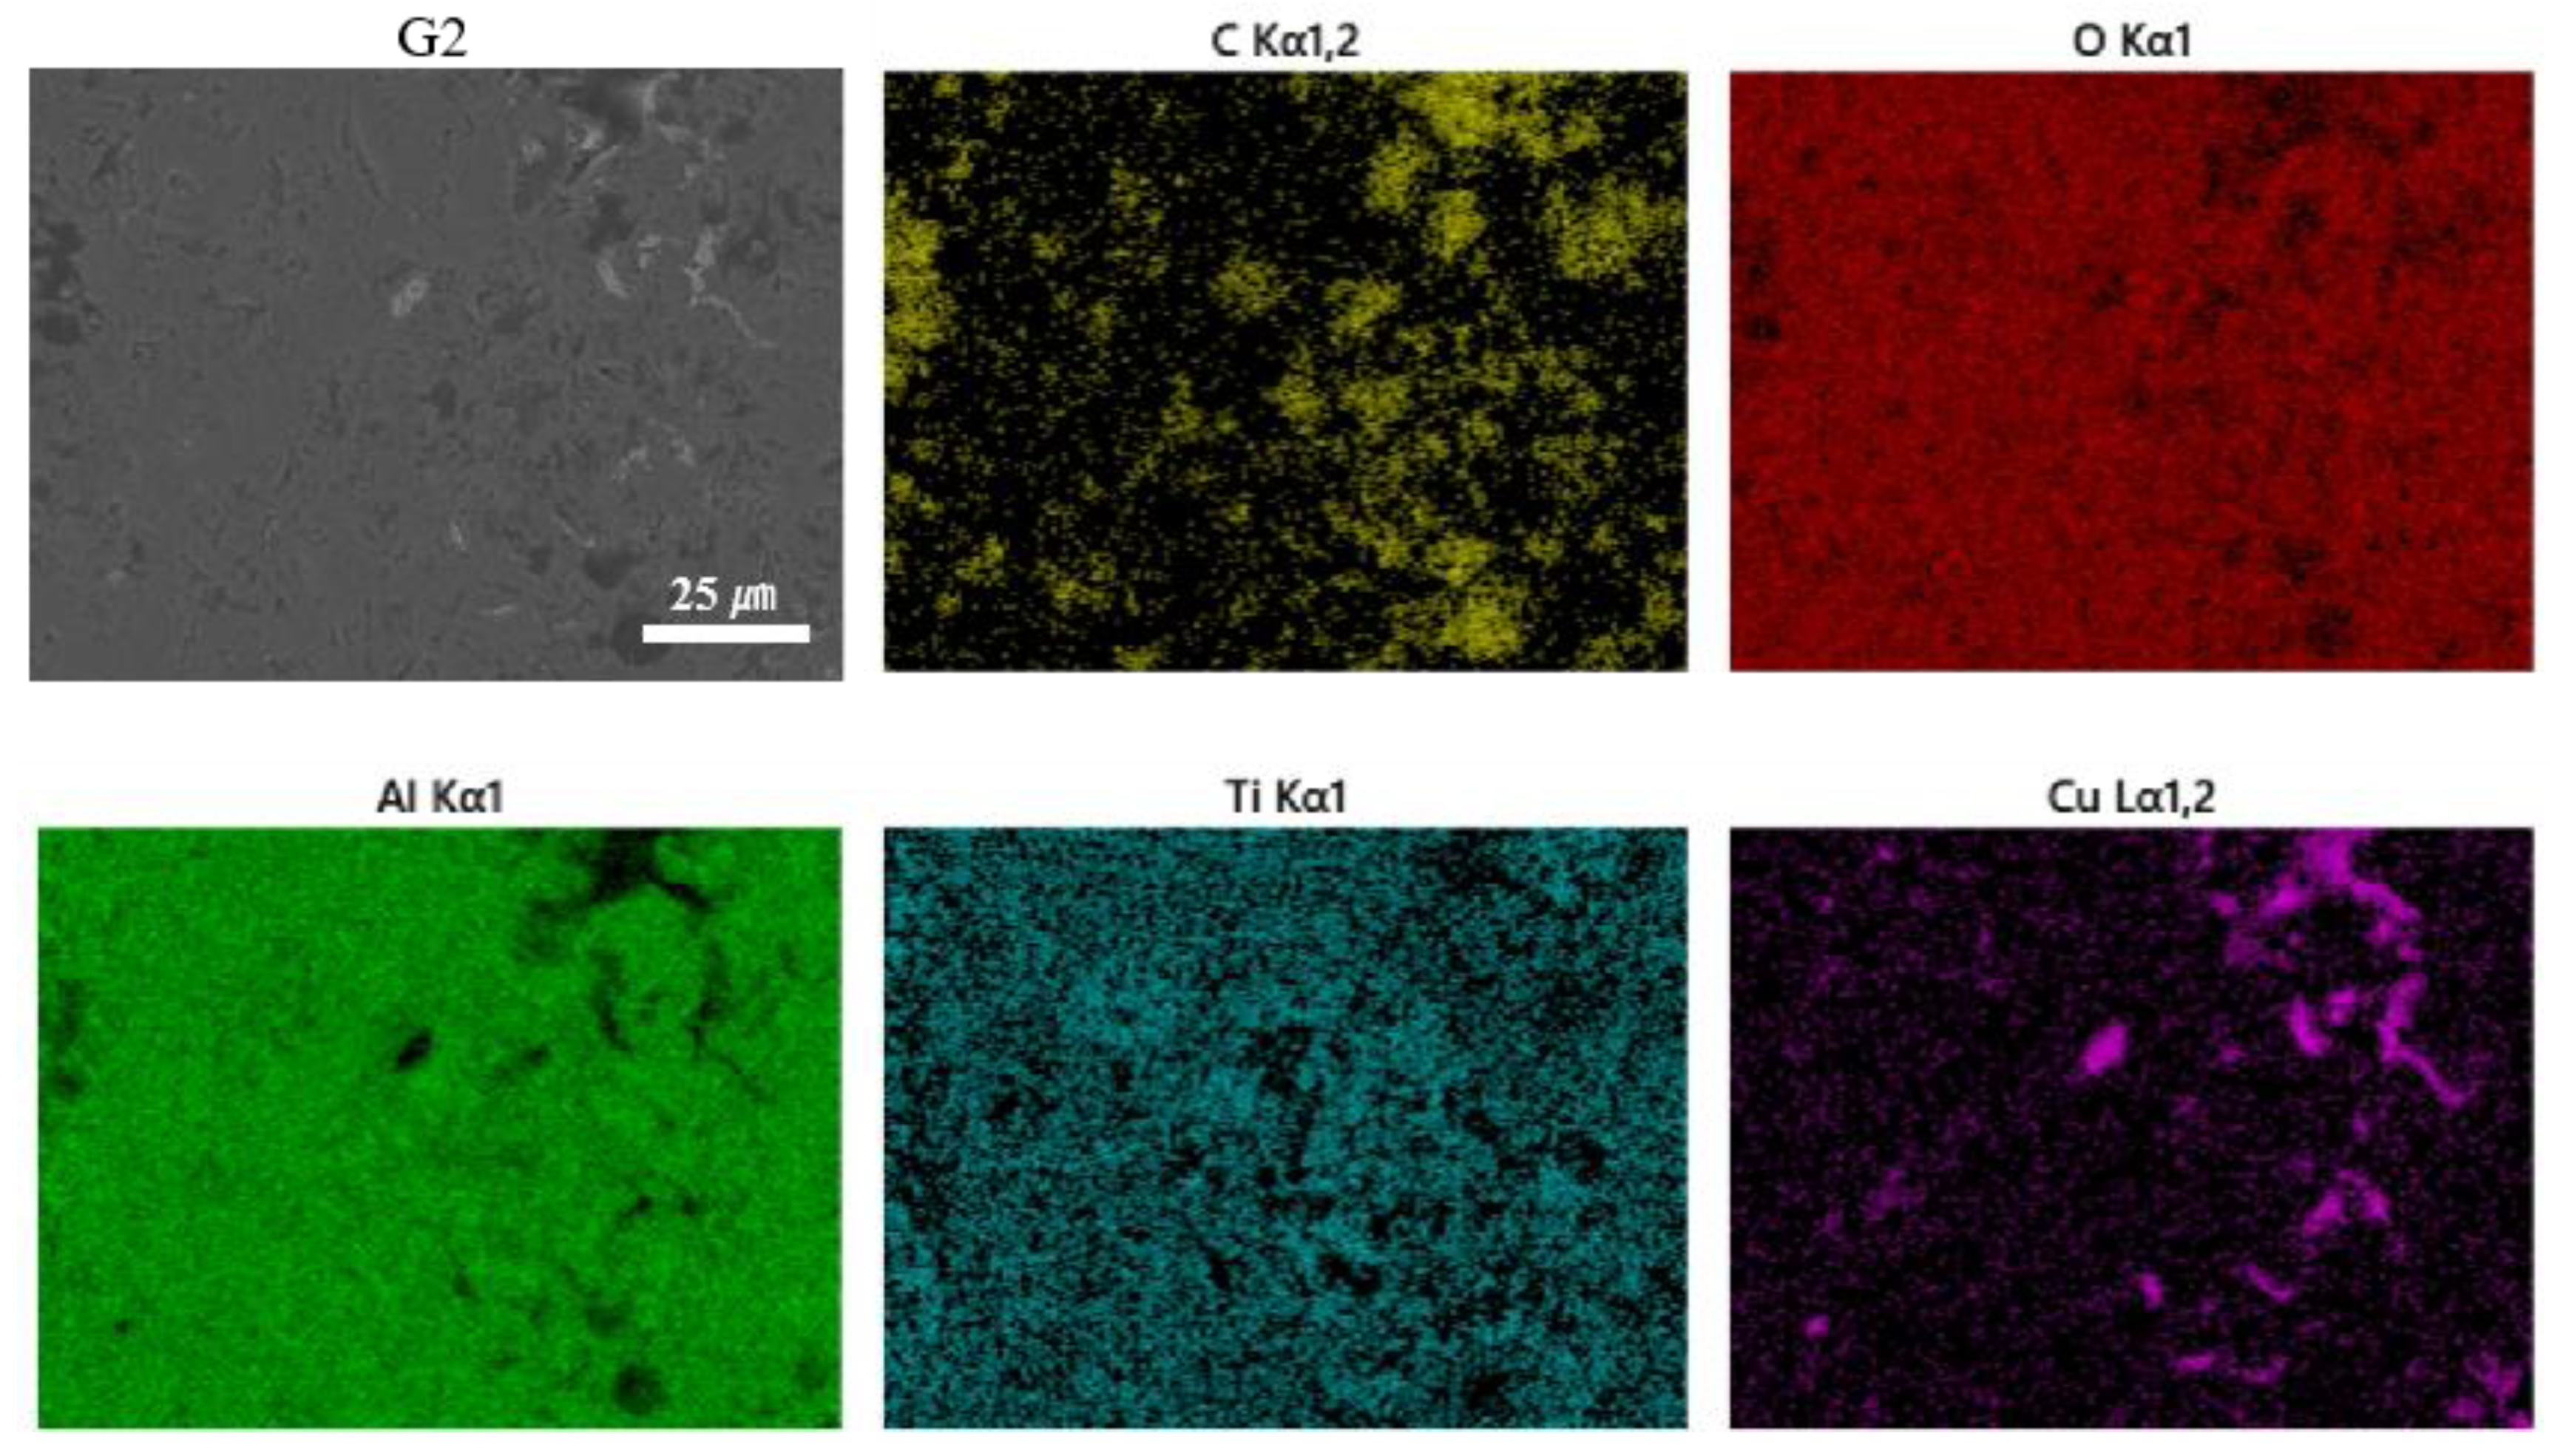
Co-doping with GO/Cu promotes densification of the AT13 ceramic coating by filling the pore structure, resulting in a significant increase in its hardness. The coating G2, which was doped with 10 wt.% GO/Cu, had the lowest porosity (0.76% on the front side and 1.63% on the cross-section) and the highest Vickers hardness of 1152.28 HV0.3.
(2)
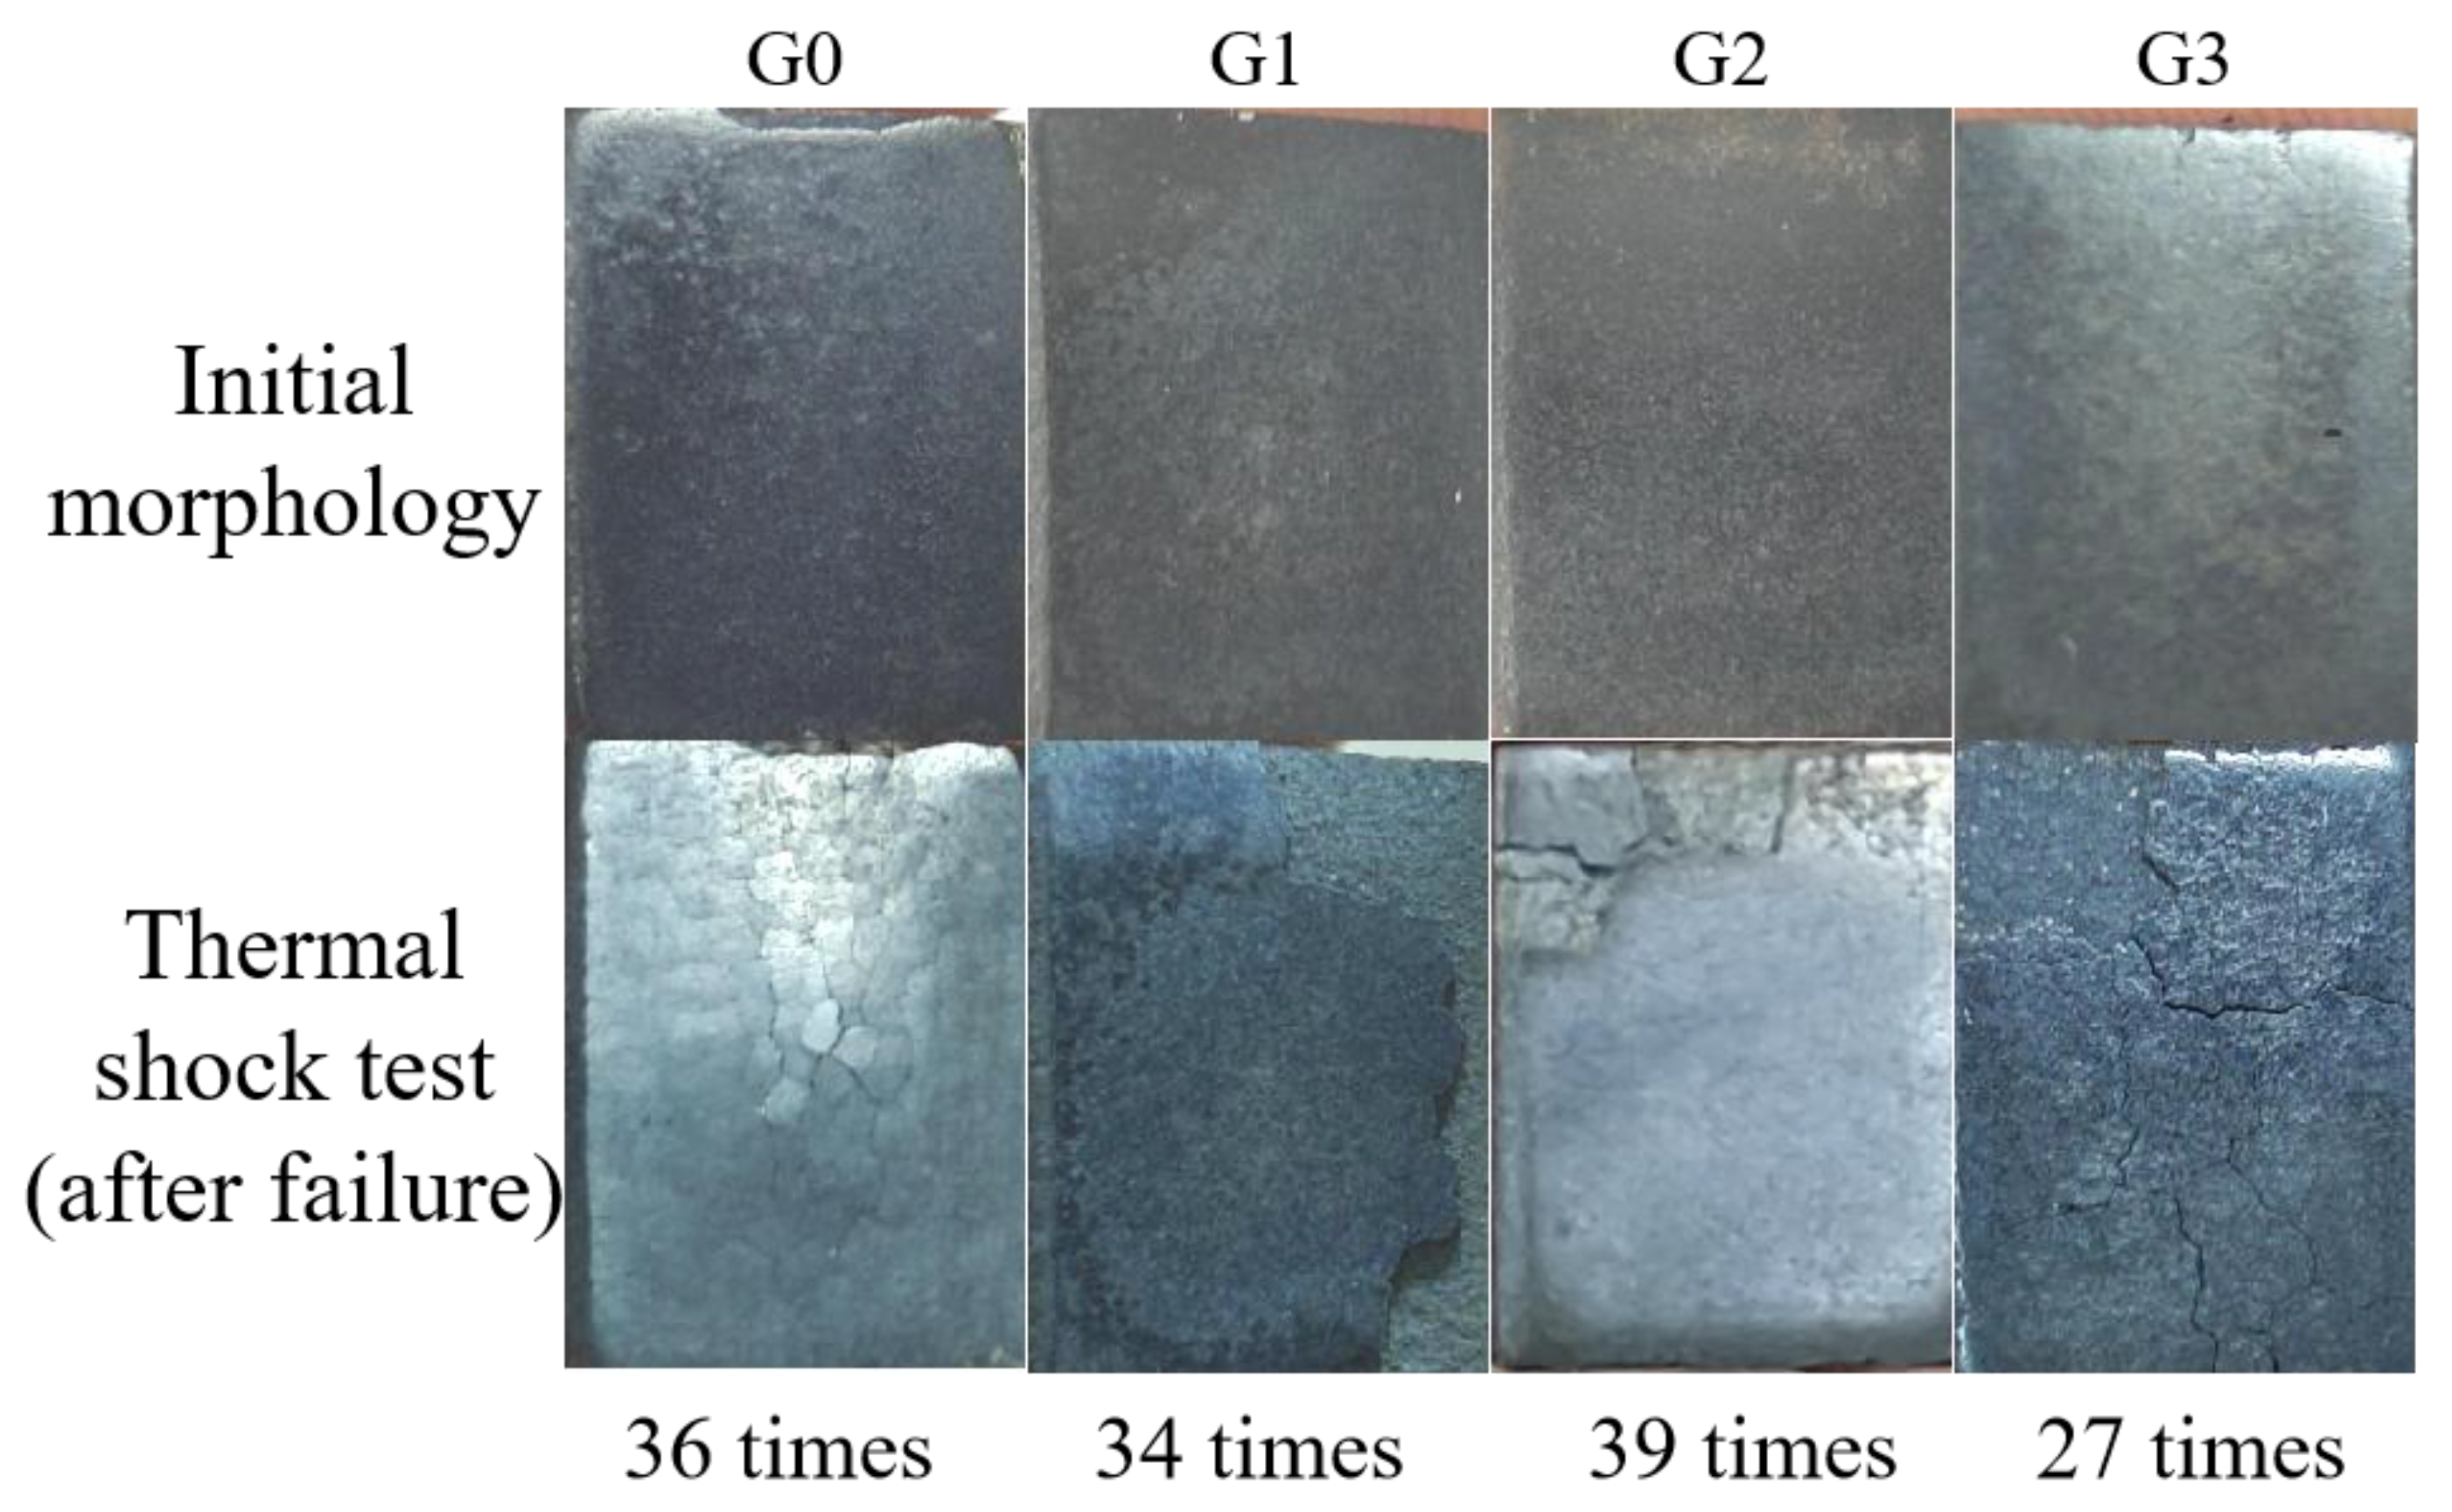
The incorporation of GO effectively increased the coating’s toughness and inhibited crack initiation and extension under sudden temperature changes. Coating G2 had the best fracture toughness of 3.56 MPa⋅m1/2 and the best thermal shock performance, failing after 39 thermal shock cycles.
(3)
As the GO/Cu doping ratio increases, the corrosion resistance of the coatings first rises and then decreases, and the G2 coating with a doping ratio of 10 wt.% had the best effect, with its self-corrosion current density decreasing by one order of magnitude compared to the original coating. At the same time, it had the lowest self-corrosion rate of 0.057 mm⋅a−1.
(4)
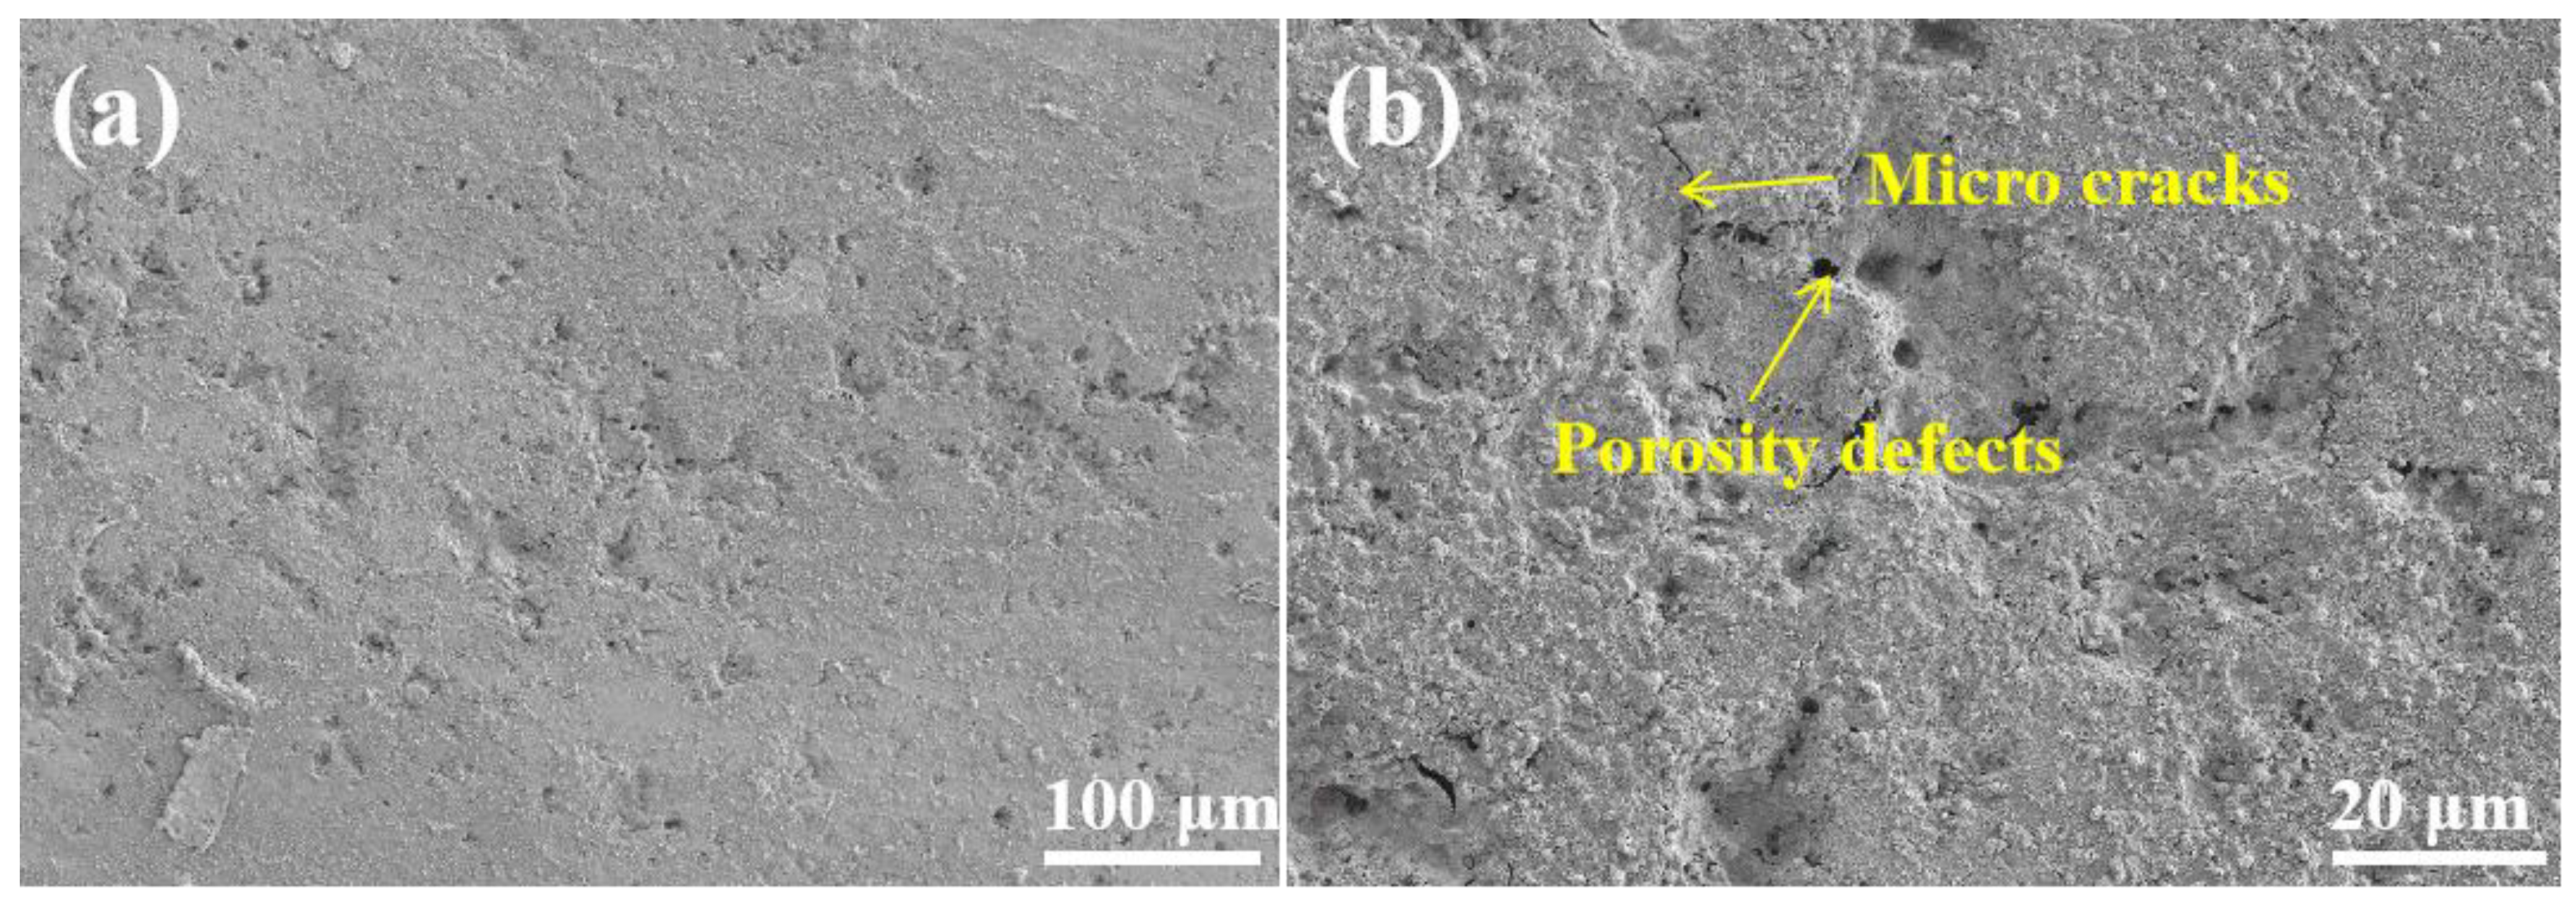
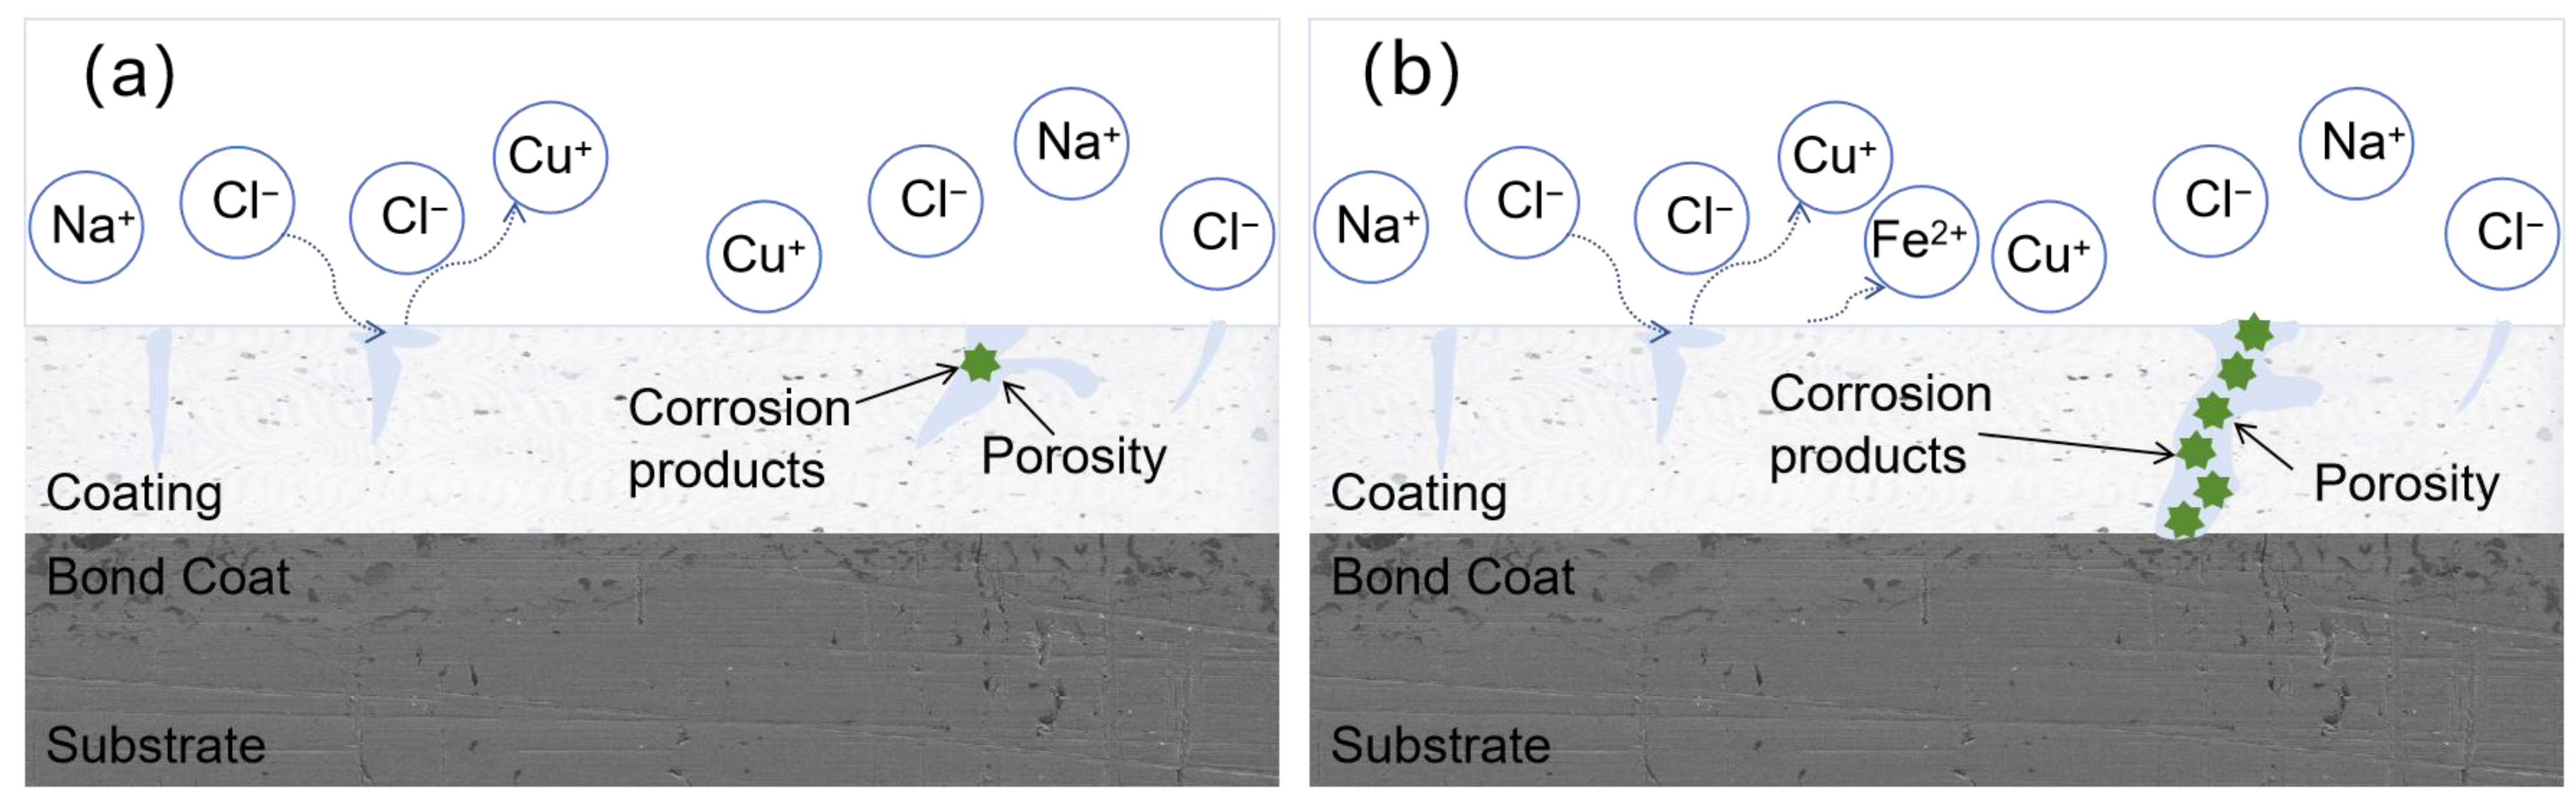
In the 31 d artificial seawater immersion experiment, the corrosion resistance of coating G2 decreased by an order of magnitude in 0–10 d due to erosion by corrosive media; during 10–18 d, the corrosion resistance recovered due to the accumulation of corrosion products; by 18 d, the corrosive media had diffused to the coating–substrate interface through pore defects, and the corrosion resistance further decreased; during 24–31 d, the generation and dissolution of corrosion products reached an equilibrium, and the corrosion resistance recovered; after 31 d, only a small number of pits and cracks were observed on the coating’s surface.

Author Contributions

Conceptualization, Z.C. and J.X.; data curation, Y.X.; validation, Y.X.; formal analysis, Y.X. and W.T.; investigation, Y.X. and W.T.; resources, Z.C., J.X. and L.G.; writing—original draft preparation, Y.X.; writing—review and editing, Y.X. and Z.C.; visualization, Y.X.; supervision, Z.C., J.X. and L.G.; project administration, W.T.; funding acquisition, Z.C. All authors have read and agreed to the published version of the manuscript.

Funding

This research was funded by National Natural Science Foundation of China, grant number 51872072, and the APC was funded by National Natural Science Foundation of China.

Institutional Review Board Statement

Not applicable.

Informed Consent Statement

Not applicable.

Data Availability Statement

The original contributions presented in this study are included in the article. Further inquiries can be directed to the corresponding author.

Acknowledgments

We sincerely thank colleagues and the anonymous reviewers for their constructive feedback, which greatly enhanced the quality of this research.

Conflicts of Interest

The authors declare no conflicts of interest. The funders had no role in the design of the study; in the collection, analyses, or interpretation of data; in the writing of the manuscript; or in the decision to publish the results.

References

  1. Robey, H.N. Application of Variable Speed Constant Frequency Generators to Propulsion-Derived Ship Service. Nav. Eng. J. 1985, 97, 296–305. [Google Scholar] [CrossRef]
  2. Carter, T.J. Common failures in gas turbine blades. Eng. Fail. Anal. 2005, 12, 237–247. [Google Scholar] [CrossRef]
  3. Wang, J.; Chen, M.; Yang, L.; Sun, W.; Zhu, S.; Wang, F. Nanocrystalline coatings on superalloys against high temperature oxidation: A review. Corros. Commun. 2021, 1, 58–69. [Google Scholar] [CrossRef]
  4. Pan, W.; Liu, G.; Wang, X.; Zhao, M.; Zhao, C.; Ren, X.; Wang, Z.; Zheng, Y.; Yang, J.; Wan, C. Review of thermal barrier coating materials and technology development. Therm. Spray Technol. 2025, 17, 1–17. [Google Scholar]
  5. Yang, Z.; Fu, Y.; Wang, Y.; Gu, Y.; Huang, S.; Meng, F. Research progress of YSZ-based thermal barrier coatings. Surf. Technol. 2025, 54, 27–43. [Google Scholar]
  6. Li, D.; Li, X.; Zhu, Y.; Chen, P.; Zhu, B. Research progress of rare earth zirconate thermal barrier coating materials. Refractories 2021, 55, 258–263. [Google Scholar]
  7. Bogdan, M.; Peter, I. A comprehensive understanding of thermal barrier coatings (TBCs): Applications, materials, coating design and failure mechanisms. Metals 2024, 14, 575. [Google Scholar] [CrossRef]
  8. Qiao, Y.; Chen, T.; Guo, X. Diffusion barrier effect of Al2O3 layer at the interface between Mo-Si-B coating and Nb-Si based alloy. Corros. Commun. 2021, 4, 45–56. [Google Scholar] [CrossRef]
  9. Liu, Y.; Zhou, Y.; Wang, W.; Tian, L.; Zhao, J.; Sun, J. Synergistic damage mechanisms of high-temperature metal corrosion in marine environments: A review. Progress Org. Coat. 2024, 197, 108765. [Google Scholar] [CrossRef]
  10. Cao, H.; Hou, G.; Xu, T.; Ma, J.; Wan, H.; An, Y.; Zhou, H.; Chen, J. Effect of seawater temperature on the corrosion and cavitation erosion-corrosion resistance of Al10Cr28Co28Ni34 high-entropy alloy coating. Corros. Sci. 2024, 228, 111822. [Google Scholar] [CrossRef]
  11. Li, Y.; Liu, J.; Lü, Z. Research progress of ceramic fibers for composite thermal barrier coatings. J. Liaoning Univ. Sci. Technol. 2023, 46, 254–261+307. [Google Scholar]
  12. Wei, X.; Yu, Q.; Yuan, P.; Jin, P.; Li, J.; Zhu, Q.; Sun, C. Influence of TiO2 dopingand spraying power on the microstructure, mechanical properties and cavitation erosion resistance of YSZ coatings. Ceram. Int. 2024, 50, 29244–29255. [Google Scholar] [CrossRef]
  13. Mehar, S.; Sapate, S.G. Contact severity maps for plasma sprayed YSZ modified Al2O3-3% TiO2 coatings. Ceram. Int. 2024, 50, 13003–13013. [Google Scholar] [CrossRef]
  14. Pandey, U.; Sharma, C. Comparative study of graphene oxide-multifunctional oxide doping on corrosion resistance of electrodeposited nickel coatings in saline environments. Int. J. Hydrogen Energy 2024, 60, 165–179. [Google Scholar] [CrossRef]
  15. Amudha, A.; Nagaraja, H.S.; Shashikala, H.D. Plasma-sprayed graphene oxide reinforced alumina composite coatings on low carbon steel with improved fracture toughness, brittleness index, and microhardness. Mater. Today Proc. 2021, 39, 1503–1508. [Google Scholar] [CrossRef]
  16. IS 2062; Hot Rolled Medium and High Tensile Structural Steel. Bureau of Indian Standards (BIS): New Delhi, India, 2013.
  17. Zhang, C.; Wu, W.; Hu, H.; Rui, Z.; Ye, J.; Shen, H. Effect of multidimensional filler hybridization on the mechanical properties of thermoplastic polyurethane composites prepared by selective laser sintering. J. Appl. Polym. Sci. 2023, 140, e54041. [Google Scholar] [CrossRef]
  18. Li, Y.; Qu, S.; Liu, T.; Lu, B.; Feng, X.; Yang, Y. High temperature oxidation behavior of γ′-strengthened CoNi-base superalloys. Corros. Commun. 2024, 16, 61–70. [Google Scholar] [CrossRef]
  19. Shi, S.; Ye, Z.; Li, X.; Xu, X.; Zhao, W.; Sun, J. Corrosion damages of nickel-based alloy G3 in 600 °C H2OCO2H2SH2 steam. Corros. Commun. 2024, 15, 42–51. [Google Scholar] [CrossRef]
  20. Zhang, Y.; Zhang, X.; Chen, S.; Liu, J.; Li, T.; Wang, L.; Wu, K. Corrosion behavior and passive film properties of nickel-based alloy in phosphoric acid. Corros. Commun. 2023, 9, 77–88. [Google Scholar] [CrossRef]
  21. Zhang, X.; Xin, H.; Guo, L. Crystallization behavior of calcium–magnesium–alumina–silicate coupled with NaCl/Na2SO4. Corros. Commun. 2023, 10, 1–9. [Google Scholar] [CrossRef]
  22. Gong, L.; Alamarguy, D.; Ruscassier, N.; Haghi-Ashtiani, P.; Giorgi, M.L. Understanding of selective oxidation of Fe-Mn binary alloys during continuous annealing through X-ray photoelectron spectroscopy. Corros. Commun. 2023, 11, 72–82. [Google Scholar] [CrossRef]
  23. Wang, P.; Du, K.; Yin, H.; Wang, D. Corrosion and protection of metallic materials in molten carbonates for concentrating solar power and molten carbonate electrolysis applications. Corros. Commun. 2023, 11, 58–71. [Google Scholar] [CrossRef]
  24. Evans, A.G.; Charles, E.A. Fracture toughness determinations by indentation. J. Am. Ceram. Soc. 1976, 59, 371–372. [Google Scholar] [CrossRef]
  25. Wang, L.; Zhang, L.; Huang, Q.; Zhang, C.; Zhang, L. Characteristics and thermal shock resistance of HVOF-sprayed TiAlNb coatings. J. Therm. Spray Technol. 2020, 29, 1752–1762. [Google Scholar] [CrossRef]
  26. Hahn, T.A. Thermal expansion of copper from 20 to 800 K—Standard reference material 736. J. Appl. Phys. 1970, 41, 5096–5101. [Google Scholar] [CrossRef]
  27. Chen, M.; Xu, Z.; Kim, J.H.; Seol, S.K.; Kim, J.T. Meniscus-on-demand parallel 3D nanoprinting. ACS Nano 2018, 12, 4172–4177. [Google Scholar] [CrossRef]
  28. Chen, Y.; Guo, Z.; Yang, Z.; Zhao, Q.; Zhang, L.; Xu, Y.; Hao, J.; Zhan, H.; Zhao, Y. Study on self-sealing effect of GO/TiO2 ceramic coating regulated by graphene oxide. Rare Metal. Mater. Eng. 2021, 50, 3621–3626. (In Chinese) [Google Scholar]
  29. Song, R.G.; Wang, C.; Jiang, Y.; Li, H.; Lu, G.; Wang, Z.X. Microstructure and properties of Al2O3/TiO2 nanostructured ceramic composite coatings prepared by plasma spraying. J. Alloys Compd. 2012, 544, 13–18. [Google Scholar] [CrossRef]
  30. Dejang, N.; Watcharapasorn, A.; Wirojupatump, S.; Niranatlumpong, P.; Jiansirisomboon, S. Fabrication and properties of plasma-sprayed Al2O3/TiO2 composite coatings: A role of nano-sized TiO2 addition. Surf. Coat. Technol. 2010, 204, 1651–1657. [Google Scholar] [CrossRef]
  31. Mei, D.; Lamaka, S.V.; Feiler, C.; Zheludkevich, M.L. The effect of small-molecule bio-relevant organic components at low concentration on the corrosion of commercially pure Mg and Mg-0.8 Ca alloy: An overall perspective. Corros. Sci. 2019, 153, 258–271. [Google Scholar] [CrossRef]
  32. Otterstein, E.; Karapetyan, G.; Nicula, R.; Stir, M.; Schick, C.; Burkel, E. Sol–gel synthesis and characterization of fine-grained ceramics in the alumina–titania system. Thermochim. Acta 2008, 468, 10–14. [Google Scholar] [CrossRef]
  33. Suk, J.W.; Piner, R.D.; An, J.; Ruoff, R.S. Mechanical properties of monolayer graphene oxide. ACS Nano 2010, 4, 6557–6564. [Google Scholar] [CrossRef] [PubMed]
  34. Wang, N.; Wang, R.; Peng, C.; Yan, F.; Zhang, X. Corrosion behavior of Mg-Al-Pb and Mg-Al-Pb-Zn-Mn alloys in 3.5% NaCl solution. Trans. Nonferrous Met. Soc. China 2010, 20, 1936–1943. [Google Scholar] [CrossRef]
  35. Feng, Y.; Fang, J.; Wu, J.; Ou, Z.; Liu, P.; Sun, Z. Preparation and performance study of graphene/Al2O3 + 13%TiO2 self-lubricating coating by plasma spraying. Surf. Technol. 2019, 48, 189–195. (In Chinese) [Google Scholar]
  36. Hu, Y.; Xu, C.; Xiao, G.; Yi, M.; Guo, R. Preparation and properties of alumina/graphene oxide composite ceramics. J. Chin. Ceram. Soc. 2016, 44, 432–437. [Google Scholar]
  37. Deng, W.; Li, T.; Li, H.; Dang, A. Research progress of graphene/ceramic composites. Solid Rocket Technol. 2022, 45, 13–22. (In Chinese) [Google Scholar]
  38. Shozib, I.A.; Ahmad, A.; Abdul-Rani, A.M.; Beheshti, M.; Aliyu, A.A.A. A review on the corrosion resistance of electroless Ni-P based composite coatings and electrochemical corrosion testing methods. Corros. Rev. 2022, 40, 1–37. [Google Scholar] [CrossRef]
  39. Yang, X.; Zeng, R.; Fu, X.; Wang, X.; Zhou, J.; Yu, L. Influence of the Cu content on the electrochemical corrosion performances of Ni60 coating. Corros. Sci. 2022, 205, 110408. [Google Scholar] [CrossRef]
  40. Chen, C.; Yu, M.; Tong, J.; Xiong, L.; Li, Y.; Kong, X.; Liu, J.; Li, S. A review of fluorescence based corrosion detection of metals. Corros. Commun. 2022, 6, 1–15. [Google Scholar] [CrossRef]
  41. Isakhani-Zakaria, M.; Allahkaram, S.R.; Ramezani-Varzaneh, H.A. Evaluation of corrosion behaviour of Pb-Co3O4 electrodeposited coating using EIS method. Corros. Sci. 2019, 157, 472–480. [Google Scholar] [CrossRef]
  42. Wang, R.; Satake, Y.; Li, Y.; Xiao, T.; Honda, M.; Fukuhara, H.; Hiramatsu, S. Microstructure of Ni-based hard facing alloy and its polarization behavior in aqueous solution with different pH and chloride concentration. Corros. Commun. 2021, 3, 1–9. [Google Scholar] [CrossRef]
  43. Song, G.L.; Zhang, C.; Chen, X.; Zheng, D. Galvanic activity of carbon fiber reinforced polymers and electrochemical behavior of carbon fiber. Corros. Commun. 2021, 1, 26–39. [Google Scholar] [CrossRef]
  44. Chen, Y.; Wu, L.; Yao, W.; Chen, Y.; Zhong, Z.; Ci, W.; Wu, J.; Xie, Z.; Yuan, Y.; Pan, F. A self-healing corrosion protection coating with graphene oxide carrying 8-hydroxyquinoline doped in layered double hydroxide on a micro-arc oxidation coating. Corros. Sci. 2022, 194, 109941. [Google Scholar] [CrossRef]
  45. Cui, J.; Bao, Y.; Sun, Y.; Wang, H.; Li, J. Critical factors on corrosion protective waterborne coatings containing functionalized graphene oxide: A review. Compos. Part A Appl. Sci. Manuf. 2023, 174, 107729. [Google Scholar] [CrossRef]
Figure 1. Schematic diagram of the coating preparation process.
Materials 18 02168 g001
Figure 2. SEM morphology of AT13 and GO/Cu powders: (a) AT13; (b) GO/Cu composite powder.
Materials 18 02168 g002
Figure 3. Schematic diagram of the indentation method.
Materials 18 02168 g003
Figure 4. Schematic diagram of coating surface morphology: (a) G0; (b) G1; (c) G2; and (d) G3.
Materials 18 02168 g004
Figure 5. Schematic diagram of coating porosity.
Materials 18 02168 g005
Figure 6. XRD spectra of the coating: (a) AT13 powder; (b) AT13 coating.
Materials 18 02168 g006
Figure 7. EDS spectrum of the G2 coating.
Materials 18 02168 g007
Figure 8. Mechanical properties of the coatings: (a) Vickers hardness; (b) fracture toughness.
Materials 18 02168 g008
Figure 9. Macro morphology of the coatings before and after thermal shock.
Materials 18 02168 g009
Figure 10. Comparison of coating surface and cross-sectional morphology after thermal shock test: (a) G0 surface morphology; (b) G0 cross-sectional morphology; (c) G2 surface morphology; (d) G2 cross-sectional morphology.
Materials 18 02168 g010
Figure 11. Potentiodynamic polarization curves of the G2 coating in a 3.5 wt.% NaCl solution.
Materials 18 02168 g011
Figure 12. Impedance diagrams of the G2 coating immersed in artificial seawater: (a) Nyquist plot; (b) Bode phase plot; and (c) Bode magnitude plot.
Materials 18 02168 g012
Figure 13. Equivalent circuit diagrams of G2 immersed in artificial seawater: (a) initial corrosion stage; (b) advanced corrosion stage.
Materials 18 02168 g013
Figure 14. SEM images of the corrosion morphology of the G2 coating after 31 days of immersion in artificial seawater: (a) low magnification; (b) high magnification.
Materials 18 02168 g014
Figure 15. Long-term corrosion mechanism of the G2 coating: (a) pre-corrosion stage; (b) post-corrosion stage.
Materials 18 02168 g015
Table 1. Specific parameters of experimental materials.
PowderParticle Size (µm)PurityMorphology
AT1315~4599.9%Near-spherical
NiCrAlY15~5399.9%Near-spherical
Cu1~599.9%Spherical
GO0.2~1098%Flaky
Table 2. Coating spraying parameters.
CoatingNiCrAlY Bonding LayerComposite AT13 Coating
Spraying Voltage70 v70 v
Spraying Current500 A600 A
Spraying Distance100 mm100 mm
Argon Gas Flow Rate40 L/min40 L/min
Gun Movement Speed800 mm/s600 mm/s
Powder Feeding Rate40 g/min40 g/min
Deposition Thickness100 μm250~300 μm
Table 3. Artificial seawater composition.
ReagentsNaClMgCl2Na2SO4CaCl2KClSrCl2NaHCO3KBrH3BO3NaF
Dose (g/L)24.535.204.091.1600.6950.0250.2010.1010.0270.003
Table 4. Fitting parameters of the polarization curve for the coatings.
Ecorr (mv)Icorr (μA·cm−2)corr Rate (mm/a)
G0−841.228.470.331
G1−710.37.9050.091
G2−717.94.9580.057
G3−7386.970.081
Table 5. Equivalent circuit fitting parameters.
TimeCPEf (F)Rp (Ω·cm2)Rct (Ω·cm2)CPEdl (F)Goodness of Fit
1 d1.64 × 10−53.74 × 1031.60 × 104-1.47 × 10⁻⁵
4 d2.41 × 10−67.47 × 1027.23 × 103-1.57 × 10⁻⁵
10 d1.79 × 10−64.53 × 1023.67 × 103-1.13 × 10⁻⁵
18 d1.85 × 10−66.58 × 1023.31 × 1031.44 × 10−54.71 × 10⁻⁴
24 d5.81 × 10−74.79 × 1027.5 × 1021.57 × 10−52.96 × 10⁻⁴
31 d9.82 × 10−68.56 × 1029.56 × 1035.17 × 10−63.71 × 10⁻⁴
Disclaimer/Publisher’s Note: The statements, opinions and data contained in all publications are solely those of the individual author(s) and contributor(s) and not of MDPI and/or the editor(s). MDPI and/or the editor(s) disclaim responsibility for any injury to people or property resulting from any ideas, methods, instructions or products referred to in the content.

