Article

Controlled Synthesis of Triangular Submicron-Sized CeO2 and Its Polishing Performance

1
National Engineering Research Center for Rare Earth, GRIREM Advanced Materials Co., Ltd., Beijing 100088, China
2
Rare Earth Functional Materials (Xiong’an) Innovation Center Co., Ltd., Xiong’an, Baoding 071700, China
3
General Research Institute for Nonferrous Metals, Beijing 100088, China
*
Author to whom correspondence should be addressed.
Materials 2024, 17(9), 2001; https://doi.org/10.3390/ma17092001
Submission received: 8 March 2024 / Revised: 14 April 2024 / Accepted: 18 April 2024 / Published: 25 April 2024
(This article belongs to the Section Materials Chemistry)

Abstract

:
CeO2 is widely used in the field of chemical–mechanical polishing for integrated circuits. Morphology, particle size, crystallinity, and Ce3+ concentration are crucial factors that affect polishing performance. In this study, we successfully synthesized two novel triangular CeO2 abrasives with similar particle sizes (600 nm) but different morphologies and Ce3+ concentrations using a microwave-assisted hydrothermal method with high-concentration raw materials, and no surfactants or template agents were added. It is generally believed that CeO2 with a higher Ce3+ concentration leads to better polishing performance. However, the results of polishing indicate that CeO2 synthesized at 200 °C, despite its lower Ce3+ concentration, demonstrates outstanding polishing performance, achieving a polishing rate of 324 nm/min, and the Sa of Si wafers decreased by 3.6% after polishing. This suggests that, under similar particle size conditions, the morphology of CeO2 plays a dominant role in the mechanical effects during the polishing process. Additionally, compared to commercial polishing slurries, the synthesized samples demonstrated better polishing performance. This indicates that, in CMP, the pursuit of smaller spherical abrasives may not be necessary. Instead, the appropriate shape and particle size can better balance the material removal rate and surface roughness.

1. Introduction

Integrated circuit (IC) manufacturing requires exceptionally flat wafer surfaces. Chemical–mechanical polishing (CMP) is the predominant technology for achieving nanoscale global planarization, widely applied in integrated circuit manufacturing. The key elements of CMP include a polishing slurry, a polishing pad, a polishing machine, and the process parameters [1]. CMP involves both mechanical abrasion of abrasive particles and chemical corrosion in the slurry to remove materials, achieving a highly planar surface by leveraging the advantages of both mechanical and chemical polishing [2]. Therefore, the polishing slurry plays a crucial role in determining the material removal rate (MRR) and surface roughness (Sa) throughout the CMP process. The selection of abrasive materials is a crucial step in CMP process design, and is extensively explored by researchers [3].
Cerium oxide (CeO2) is widely used in IC polishing due to its variable valence, high reactivity, slightly lower hardness than SiO2, and strong affinity for SiO2 [4,5,6]. It can form Ce-O-Si bonds with SiO2, accelerating polishing and exhibiting a very high selectivity removal ratio. In current research and the literature, various methods for preparing nanoscale or submicron CeO2 are explored, including precipitation [7,8,9], hydrothermal synthesis [10,11,12], sol–gel [13], and microemulsion [14]. Currently, precipitation and hydrothermal methods are prevalent. In the preparation process, lower concentrations (below 0.1 M) and template agents or surfactants are typically used to achieve a specific morphology and a uniform distribution of CeO2 [15,16,17].
From the perspective of chemical polishing, current research shows that Ce3+ can form Ce-O-Si bonds with the SiO2 surface, thereby increasing MRR. Consequently, it is widely acknowledged that CeO2 with a higher Ce3+ concentration exhibits superior polishing performance [18,19,20,21]. On the mechanical removal front, the morphology and size of abrasives are critical factors determining the removal rate. Therefore, morphology, particle size, and Ce3+ concentration are all crucial factors that affect polishing performance [22]. However, in general, CeO2 with different morphologies has different Ce3+ concentrations [23], leading to a lack of in-depth research in the existing literature on the dominant role of these factors in CMP.
Furthermore, in the current CMP process, there is a common pursuit of smaller-sized spherical CeO2 abrasives, as they can reduce scratches and decrease Sa. However, generally speaking, non-spherical abrasives exhibit higher removal rates compared to spherical abrasives [22]. Therefore, there is a need to seek CeO2 with both distinctive morphology and moderate particle size to achieve a balance between MRR and Sa.
This study proposes a novel CeO2 morphology suitable for IC CMP, capable of balancing MRR and Sa. Notably, during its preparation, there is no need to add surfactants or template agents, and it features a high raw material concentration, facilitating industrial production and reducing manufacturing costs. Additionally, our research investigates the polishing performance of CeO2 with different morphologies and Ce3+ concentrations but similar particle sizes. The results indicate that mechanical action predominates during the CMP process, and the polishing performance of CeO2 is significantly influenced by its morphology and particle size.

2. Experimental

2.1. Material Preparation

All the reagents were of analytical grade and were used without further purification: cerium carbonate (Ce2(CO3)3·6H2O ≥ 99.99%, Hebei Chengfeng Chemical Co., Ltd., Wuhan, China), ammonium bicarbonate (NH4HCO3 ≥ 99.5%, Xilong Science Co., Ltd., Shantou, China), and nitric acid (HNO3, 68 wt.%–70 wt.%, Modern Oriental Fine Chemistry Co., Ltd., Beijing, China). Cerium carbonate was dissolved in HNO3 to prepare a 1.0 mol/L cerium carbonate solution, and ammonium bicarbonate was dissolved in deionized water to prepare a 1.8 mol/L solution.
In a typical synthesis procedure, a 1.0 mol/L ammonium bicarbonate solution was added to a 1.8 mol/L cerium nitrate solution at a rate of 16 mL/min while stirring vigorously for 10 min. The mixture was transferred to a 300 mL Teflon-lined autoclave and microwave-assisted hydrothermal treatment was performed at 150 °C and 200 °C for 24 h, respectively, followed by natural cooling to room temperature. The resulting white precipitates were collected by centrifugation, washed 3–4 times with deionized water, and dried at 100 °C in air for 24 h. Finally, the obtained white powder was calcined in air at 600 °C for 2 h in a muffle furnace to obtain the CeO2 samples.

2.2. Structural Characterization

The morphology and size of the samples were examined using a scanning electron microscope (SEM, S-4800; Hitachi; Kyoto, Japan). The average particle size was determined using a nanoparticle size analyzer (LA-960; Horiba; Kyoto, Japan).
Thermogravimetric and differential thermal analyses were carried out under an air atmosphere from 25 to 1000 °C at a heating rate of 10 °C min−1, utilizing a thermal analyzer (TG, TGA/DSC 3+; Mettler Toledo; Columbus, OH, USA). The phase information and lattice structure of the samples were characterized by an X-ray diffractometer with Cu K radiation in the 2θ range of 10–90° (XRD, Smart Lab 9 kW; Japan Science Co., Ltd.; Kyoto, Japan). Additionally, a microscopic confocal Raman spectrometer (Lab RAM Aramis; Horiba Jobin Yvon; Paris, France) was employed, with a 325 nm laser as the excitation source and the analyzed wavenumber range spanning from 200 to 800 cm−1.
High-resolution transmission electron microscopy (TEM, Talos F200X; Thermo Fisher Scientific; Waltham, MA, USA) and selected-area electron diffraction (SAED) were utilized to visualize the morphology and lattice information of CeO2. These methods offer detailed insights into the internal structure and arrangement of the crystals.

2.3. Polishing Test

Two-inch-diameter Si wafers were employed as the workpiece for CMP, utilizing a porous polyurethane pad on the CMP polisher. After polishing, the Si wafers were sequentially cleaned with water, ethanol, and ammonia in an ultrasonic cleaner. Subsequent measurements were conducted after the wafer dried. The specific parameters for the polishing process are detailed in Table 1. The change in mass of the Si wafer before and after CMP was used to indirectly calculate MRR according to Equation (1).
MRR = ( Δ m   ×   H )   /   m 0 t
where H and m0 represent the height (nm) and the mass of the Si wafer before CMP, respectively;   Δ m is the weight difference of the Si wafer before and after CMP; and t is the polishing time (min). The Sa of the Si wafer after polishing was measured by a 3D optical surface profiler (New View™ 9000; Zygo; Middlefield, CT, USA).
Polishing slurries were prepared with a concentration of 1 wt.% using HT-150 and HT-200 as polishing abrasives separately. An amount of 0.5 wt.% of sodium hexametaphosphate (SHMP) was added as a dispersant to each slurry and the pH was adjusted to 6 using HNO3 or ammonia solution. Two commercial polishing slurries (CC1 and CC2) were used for polishing under the same parameters for comparison.

3. Results and Discussion

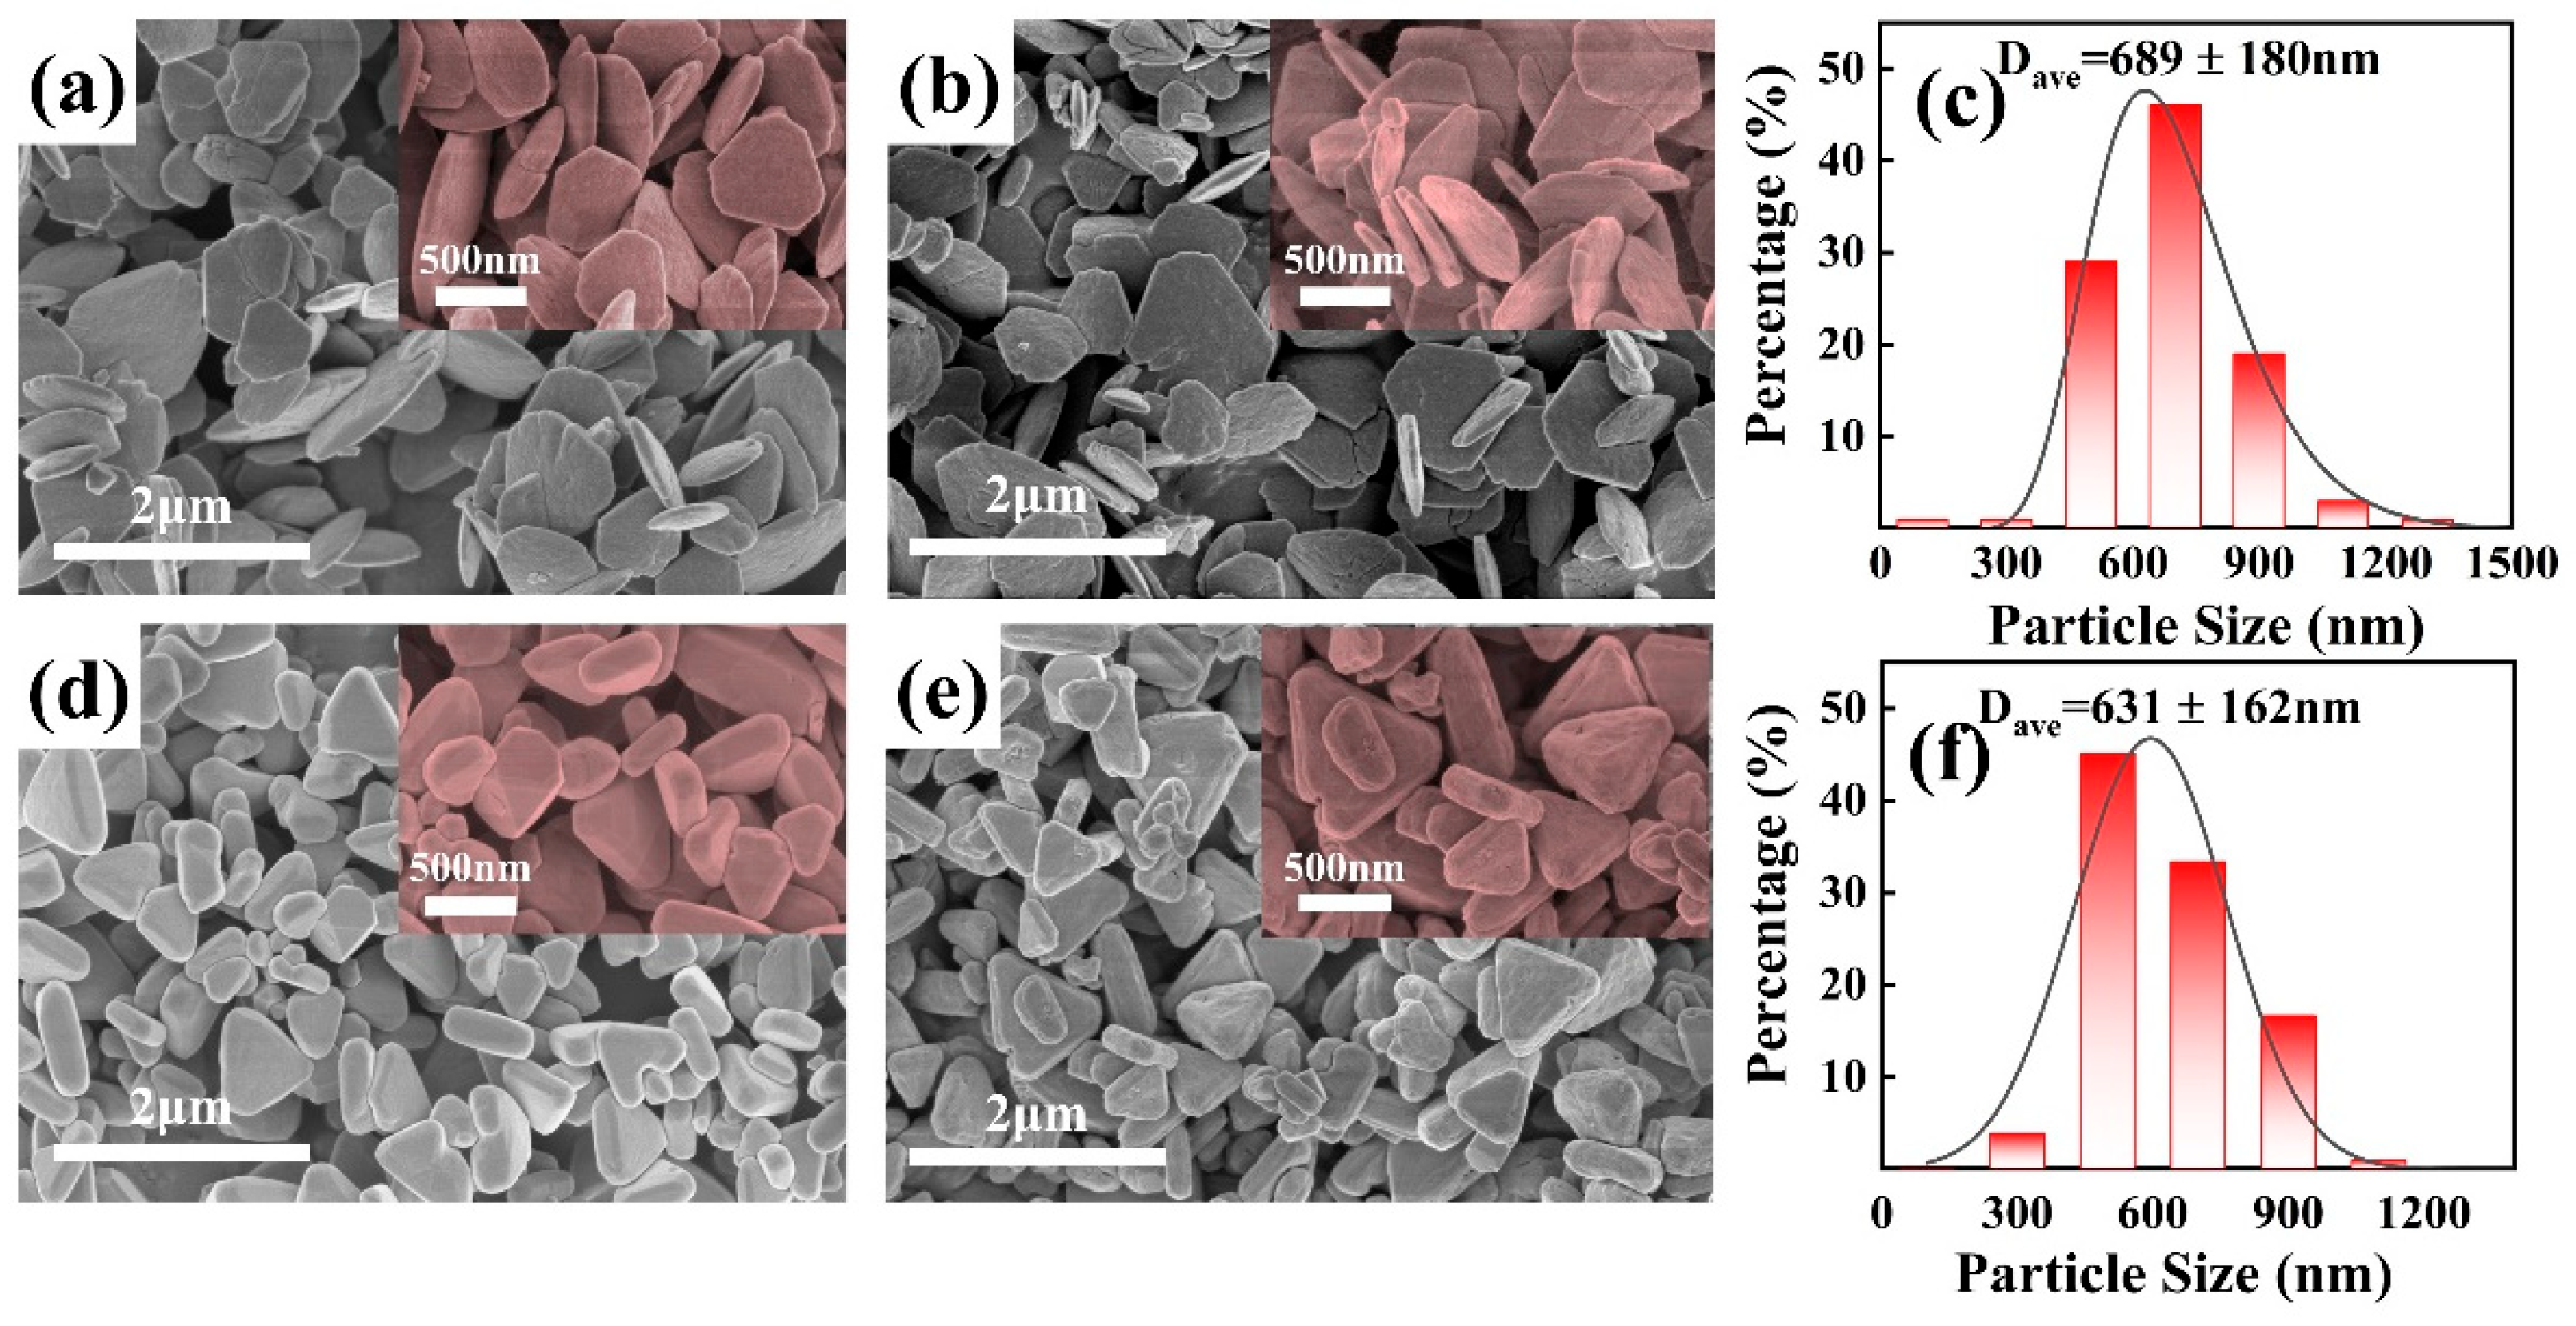
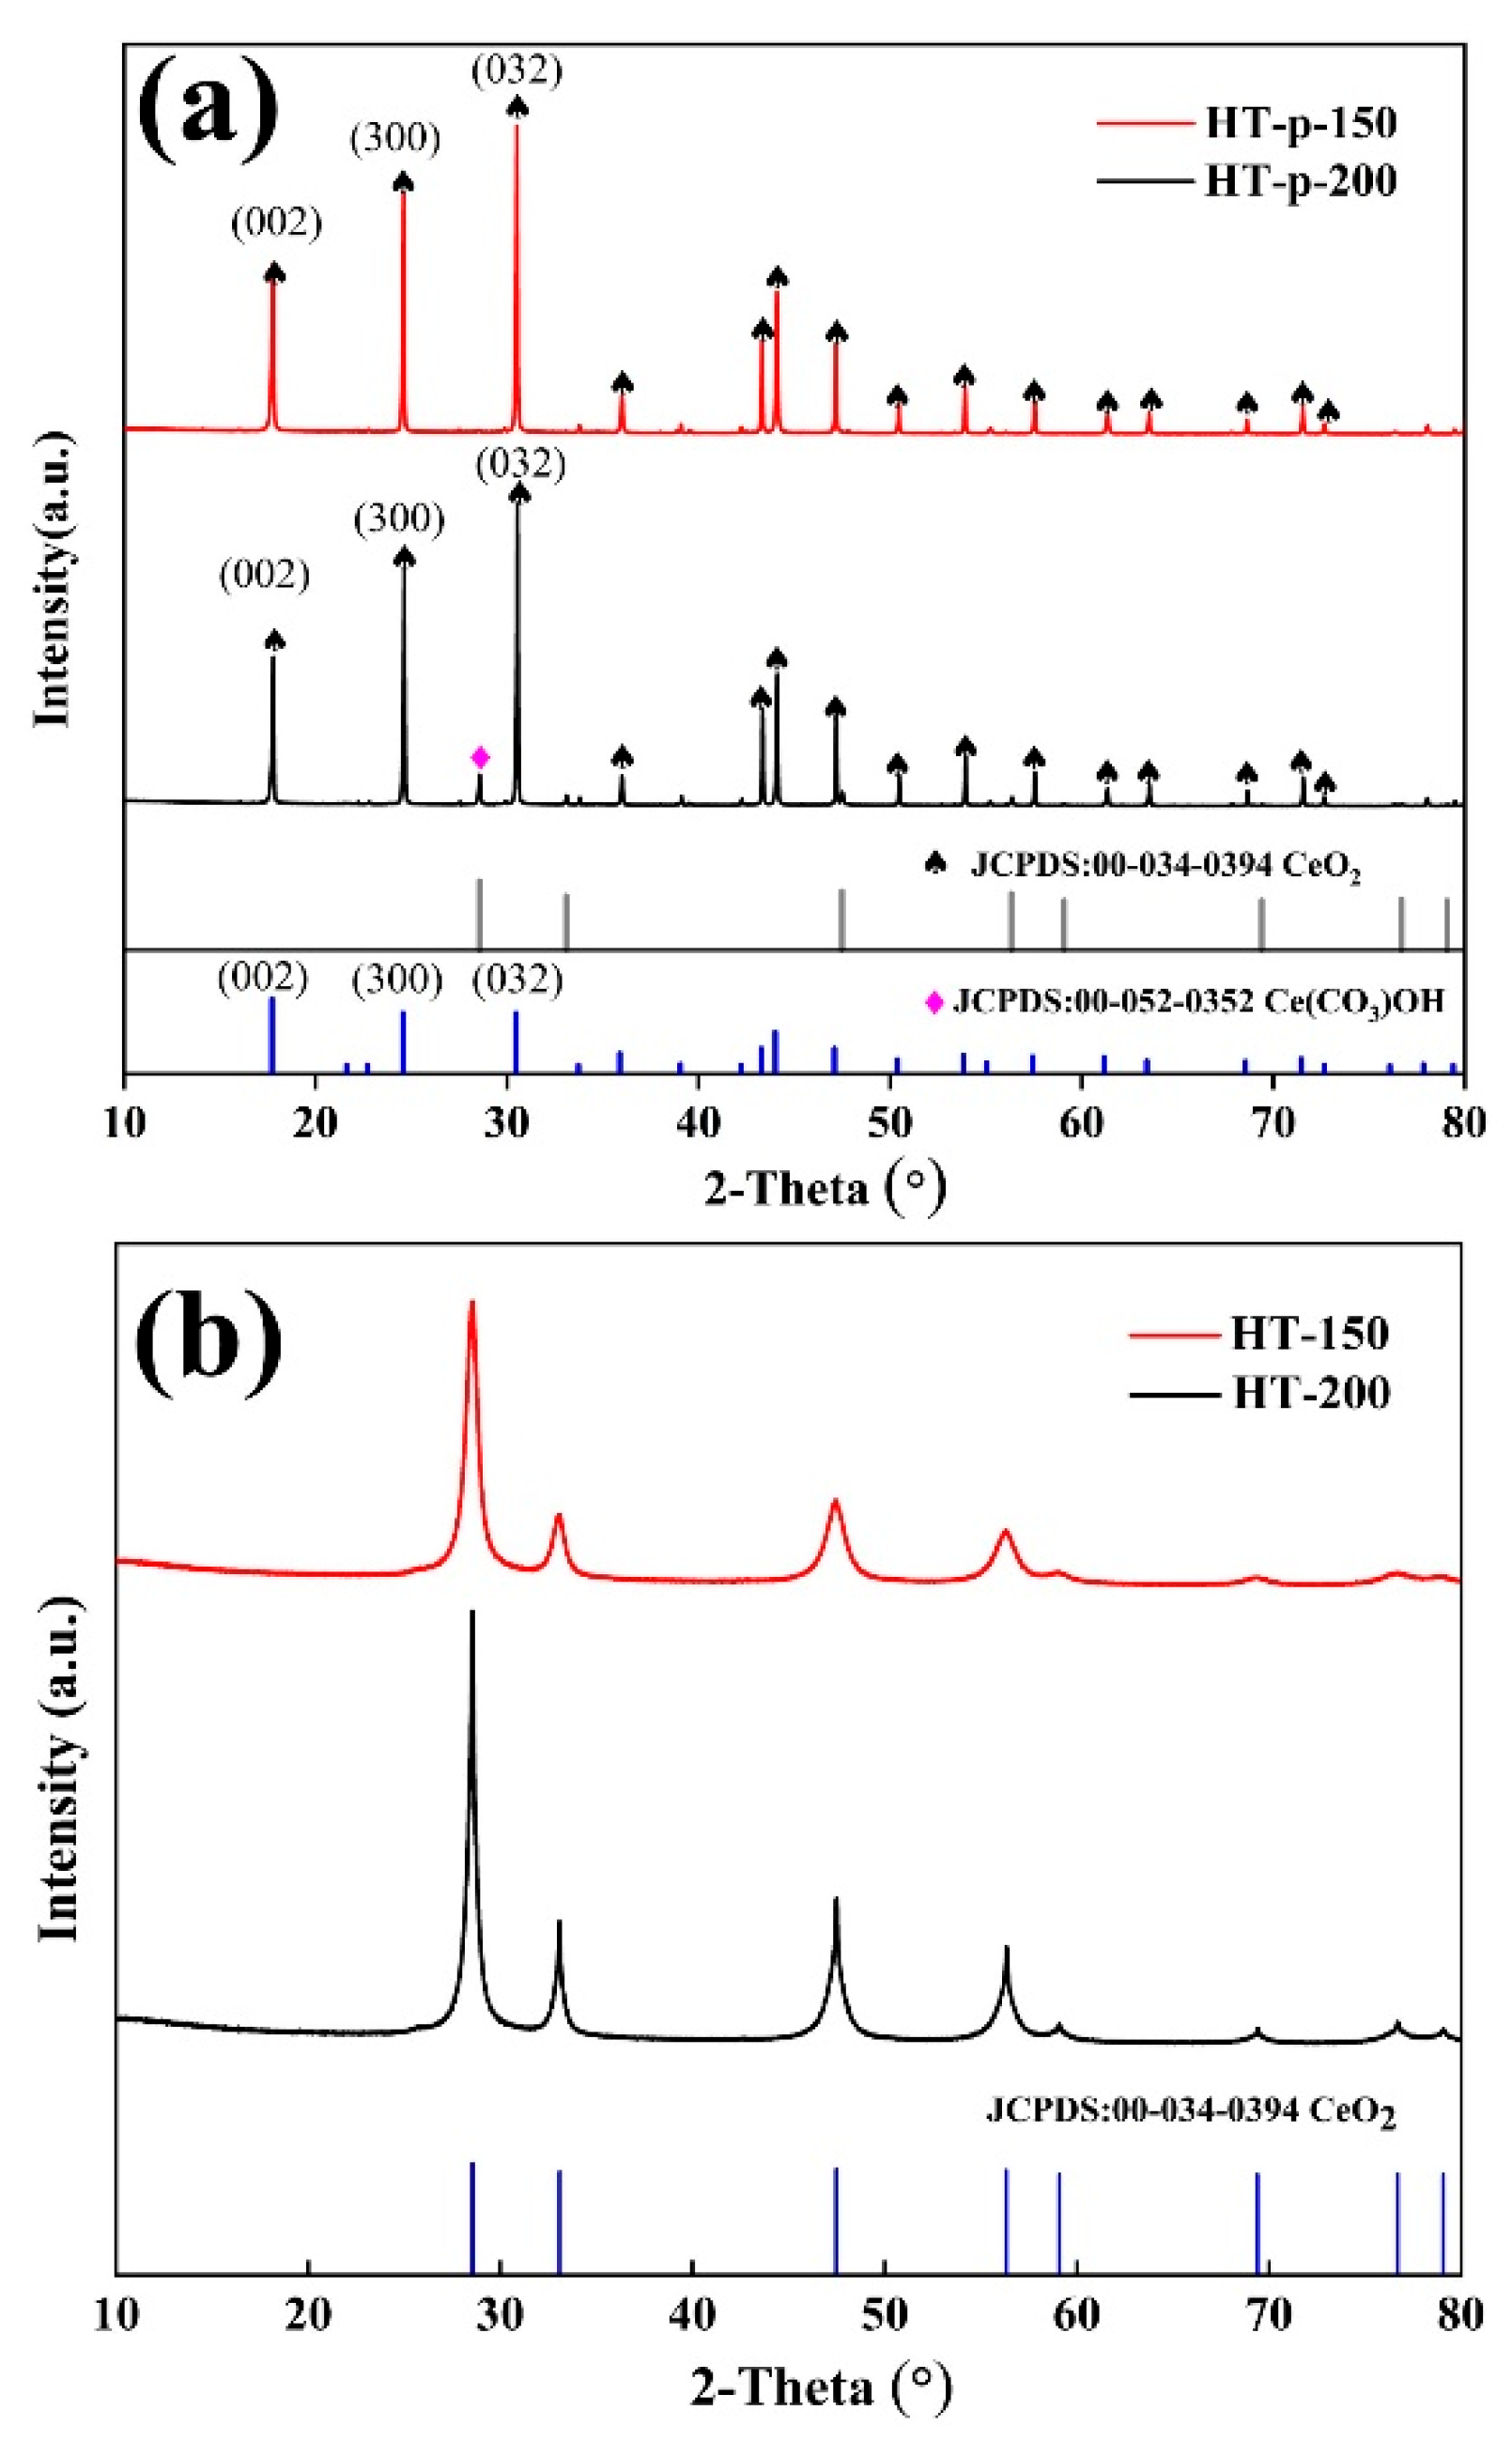
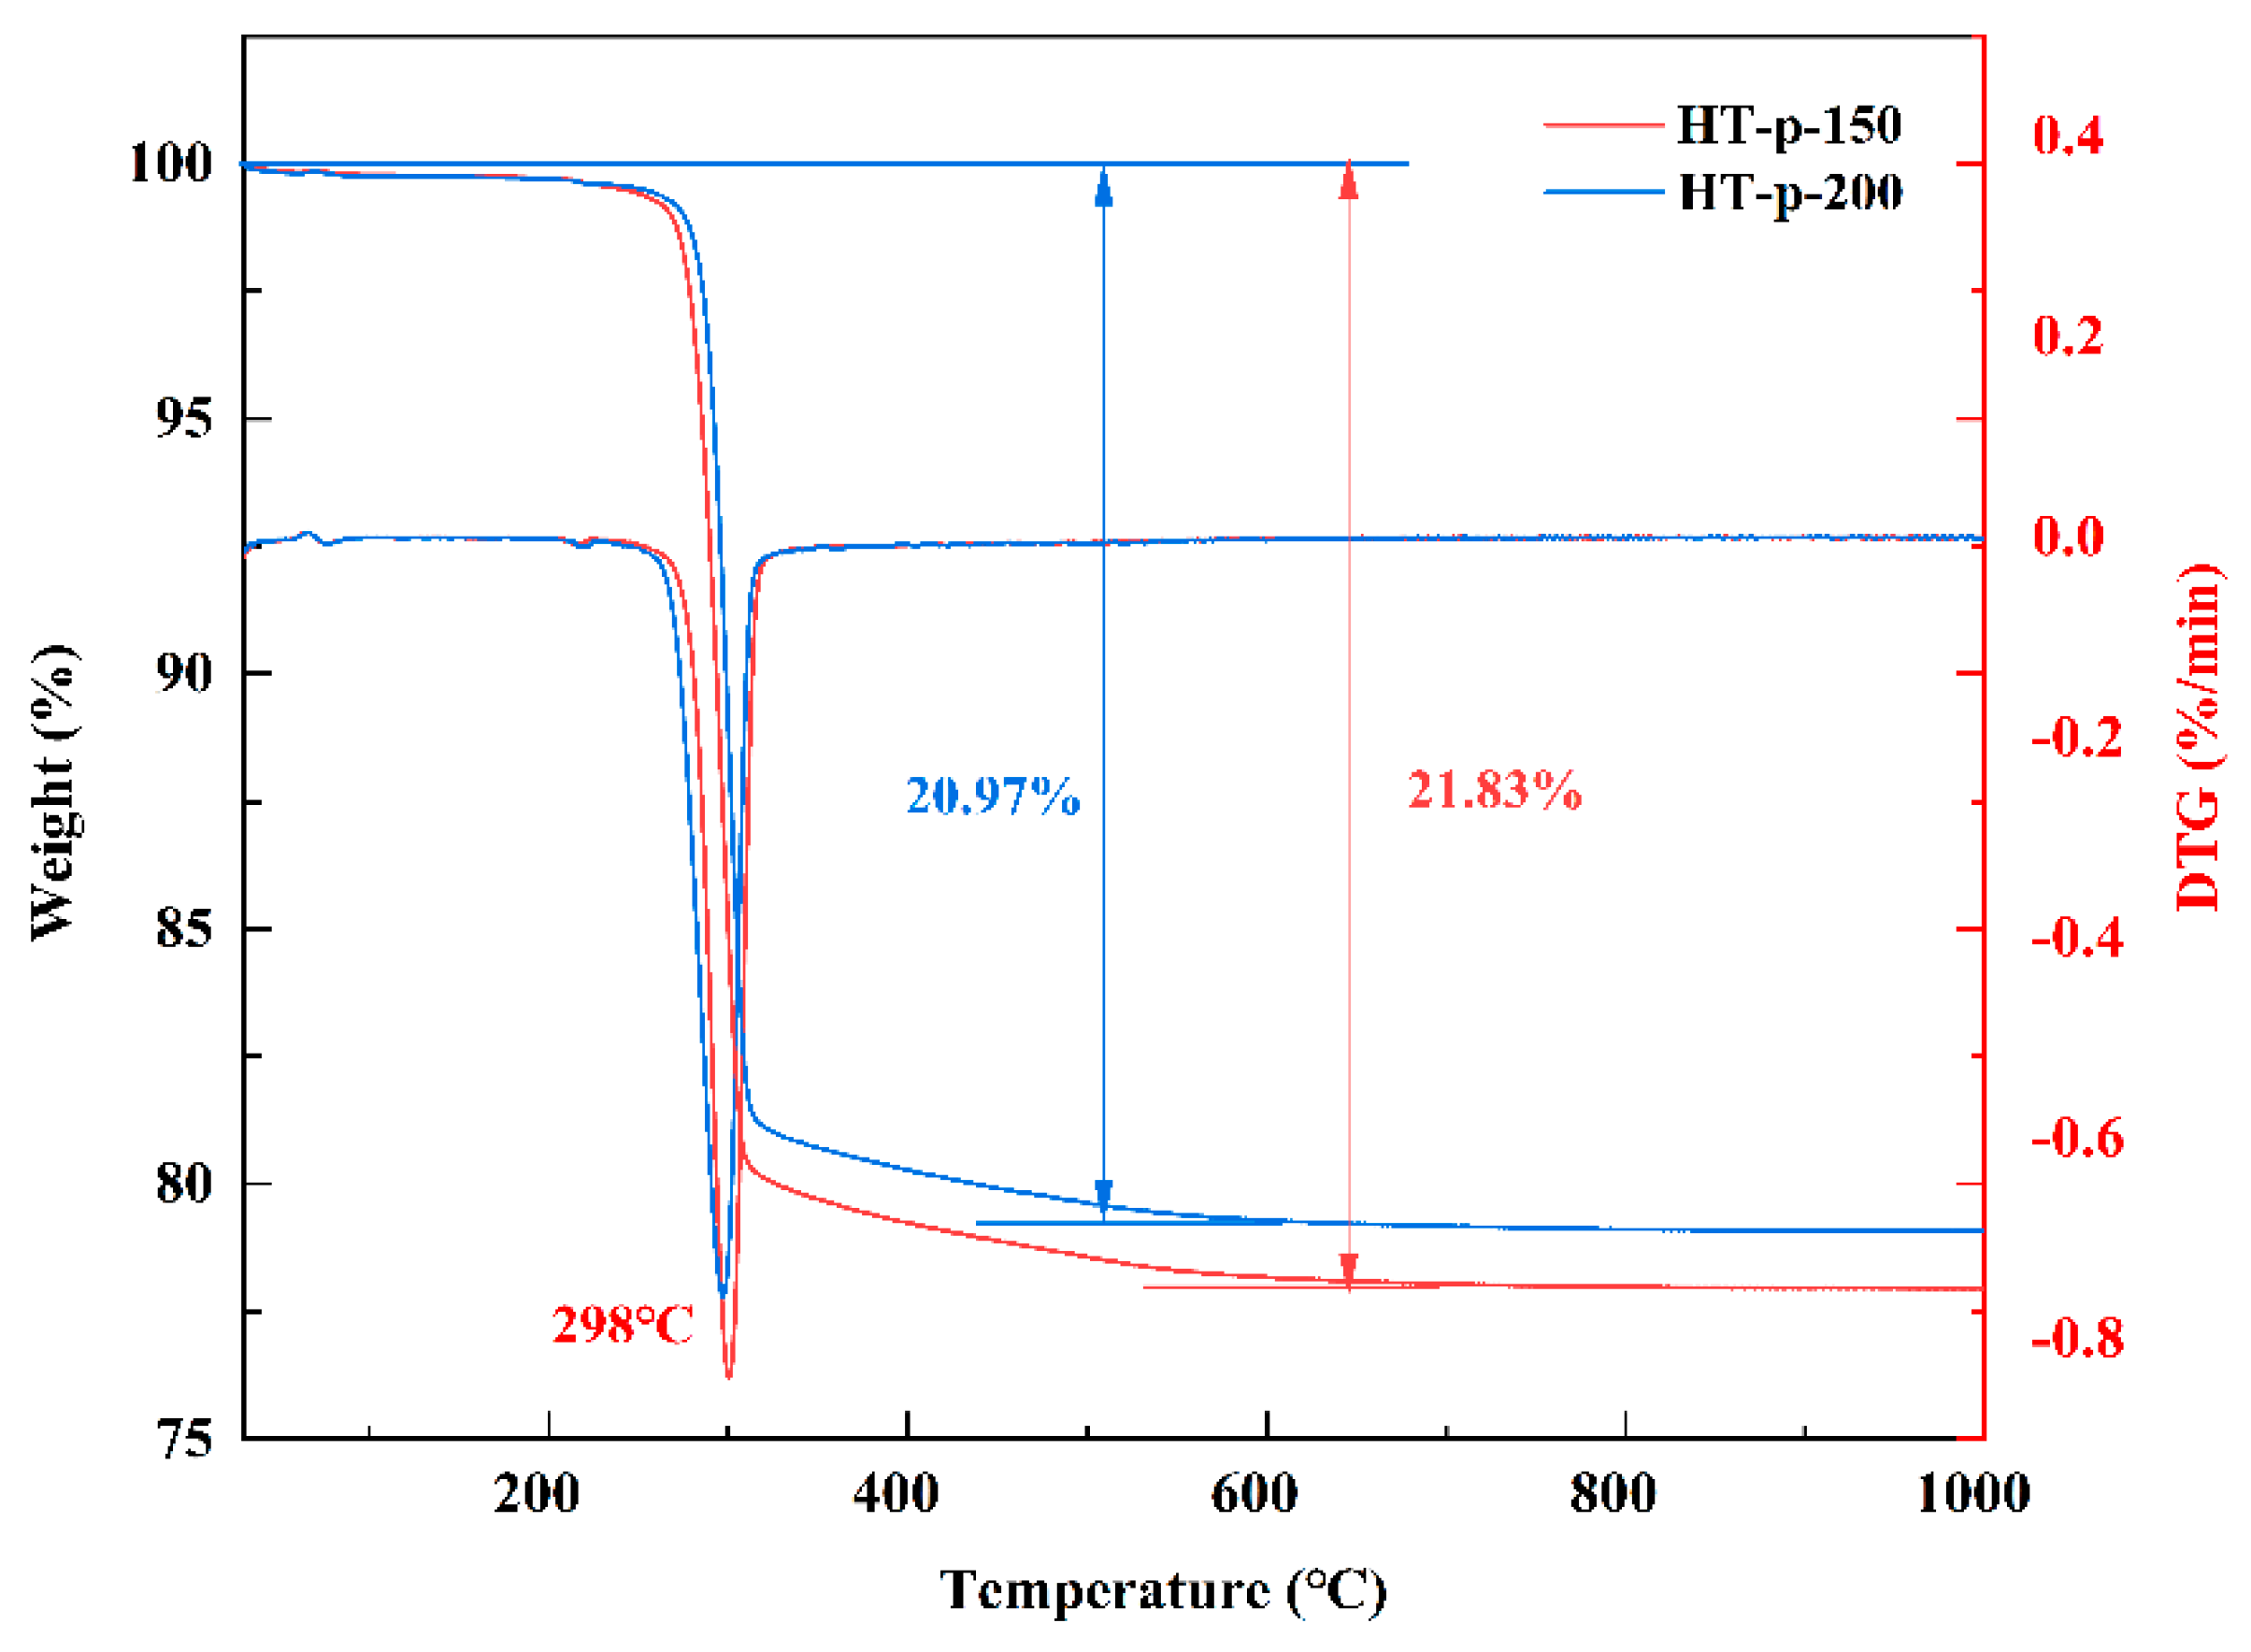
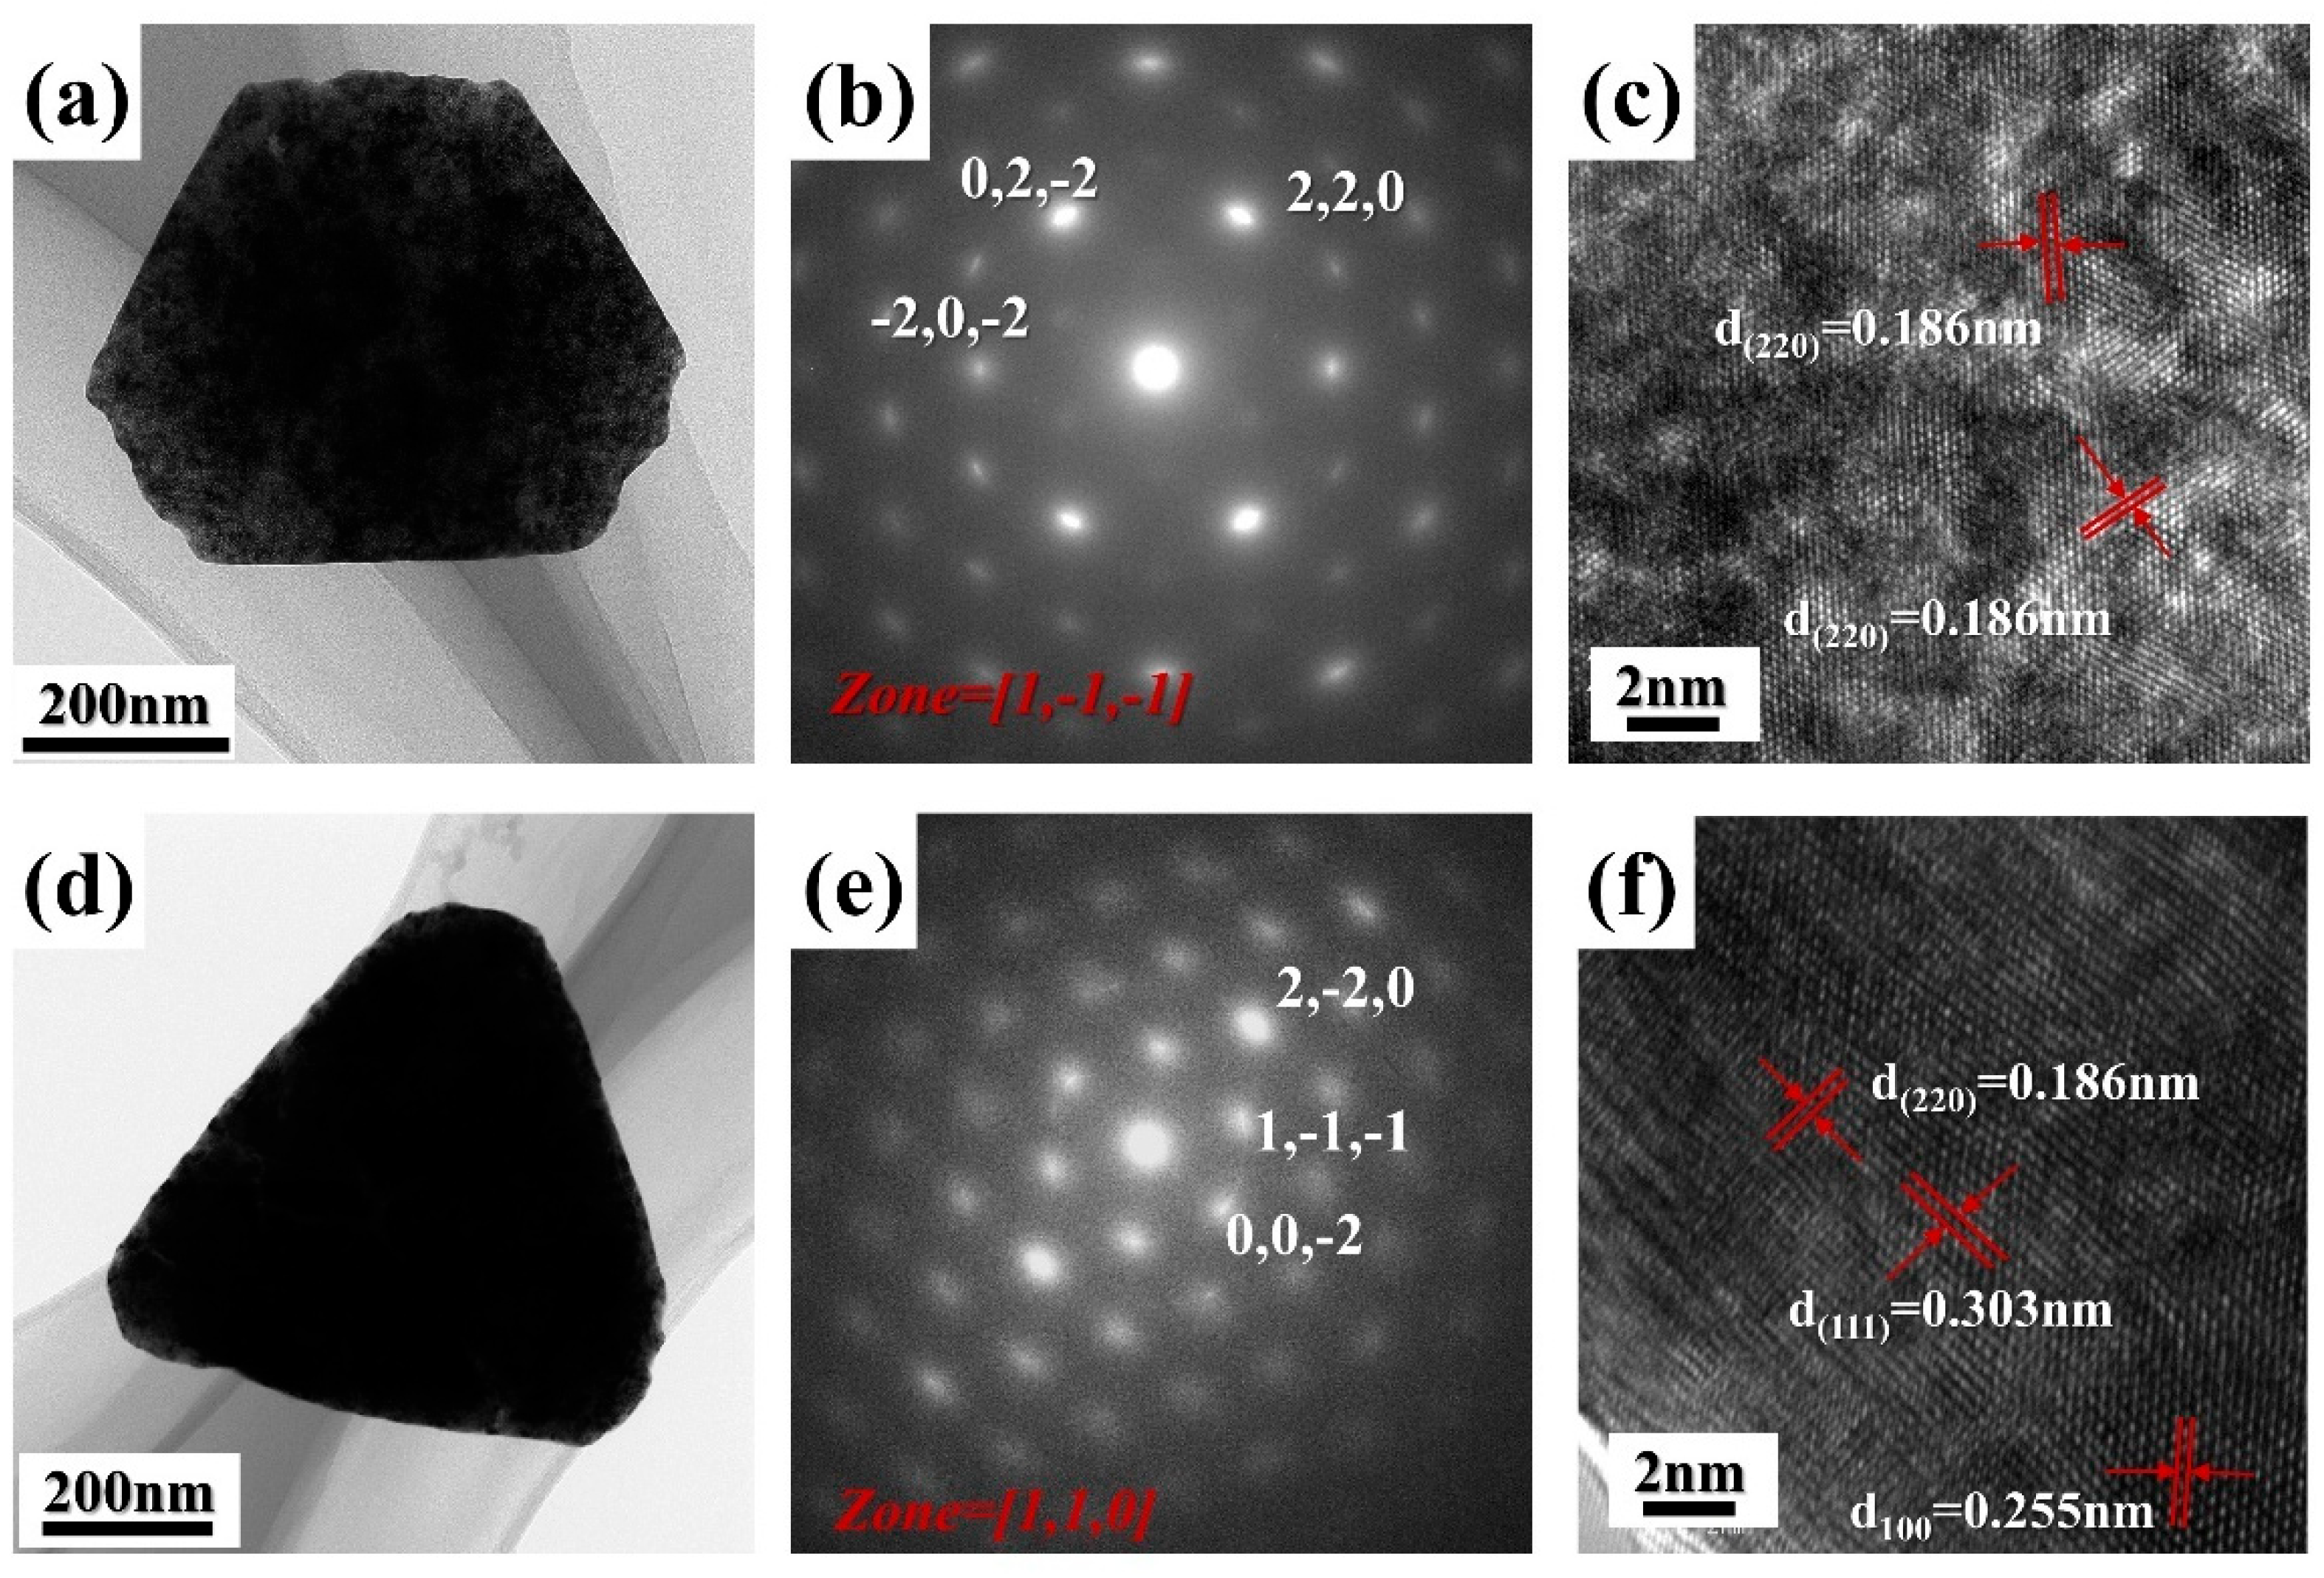
3.1. Morphology and Structure Characterization of CeO2 Abrasives

In this study, we utilized cerium carbonate solution and ammonium bicarbonate as raw materials, and employed a microwave-assisted hydrothermal method. By controlling the hydrothermal synthesis temperatures at 150 °C and 200 °C, respectively, we obtained two carbonate precursors, which were subsequently calcined at 600 °C to obtain the final products.
The morphological features of the samples subjected to hydrothermal treatment at 150 °C and 200 °C were investigated using SEM, as illustrated in Figure 1.
Figure 1a,c, respectively, showcase the carbonate precursors synthesized under hydrothermal conditions at 150 °C and 200 °C, labeled as HT-p-150 and HT-p-200. Subsequently, Figure 1b,d display the CeO2 samples obtained after calcination at 600 °C, designated as HT-150 and HT-200. It can be observed that the samples synthesized at different hydrothermal temperatures all present a nearly monodisperse state, with little to no aggregation. Compared to the precursors, the morphology and size of the products after calcination remain largely unchanged but exhibit more pores/voids on the surface, attributed to the release of water and carbon dioxide throughout the calcination process [24].
As shown in Figure 1b,c, HT-150 appears as flake-like truncated triangular shapes with a certain degree of curvature on the surface, and an average height of 689 nm. In contrast, as depicted in Figure 1e,f, HT-200 exhibits triangular shapes with a thickness of approximately 200 nm, featuring a relatively flat surface and rounded angles of the triangles, with an average height of 631 nm.
To determine the chemical composition of the prepared precursors at different hydrothermal temperatures and the calcined products, XRD analysis was conducted as shown in Figure 2.
As shown in Figure 2a, the XRD diffraction pattern of HT-p-150 matches the hexagonal CeCO3OH (JCPDS No. 52-0352), and no other phases were detected. In contrast, the XRD pattern of HT-p-200 corresponds to both the hexagonal CeCO3OH and the cubic fluorite CeO2, indicating partial oxidative decomposition of CeCO3OH as the hydrothermal temperature reaches 200 °C. Additionally, as depicted in Table 2, in the precursor samples, the intensity ratios of the (300) and (032) planes to the (002) plane are both higher than the proportions observed in the standard material (JCPDS No. 52-0352), indicating the presence of a preferred orientation in the growth of crystal planes within the synthesized precursor samples [25,26].
Moving to Figure 2b, the XRD pattern of the calcination products, well-crystallized at 600 °C, shows that both HT-150 and HT-200 can be accurately indexed to pure cubic fluorite CeO2 (JCPDS No. 034-0394). Moreover, HT-200 demonstrates higher crystallinity compared to HT-150.
The thermal stability of the precursors synthesized at 150 °C and 200 °C was investigated by TG analysis, as shown in Figure 3.
It can be observed that the weight losses of precursors HT-p-150 and HT-p-200 are 20.97% and 21.87%, respectively. These weight losses are higher than the theoretical weight loss calculated based on Equation (2) (20.73%) [27], attributed to the presence of adsorbed water and crystalline water in the precursors. Additionally, due to the presence of CeO2 in the precursor HT-p-200, its weight loss is relatively lower. A significant weight loss of precursors HT-p-150 and HT-p-200 is observed at 298 °C, believed to be associated with the decomposition of cerium carbonate.
Beyond 600 °C, the weight of the sample shows minimal further decline, indicating complete decomposition of the precursor. As the calcination temperature increases, the particles of the product are more prone to growth and aggregation. Therefore, based on the TG—DTG curves, it is reasonable that the calcination temperature for precursors was chosen at 600 °C.
4 C e C O 3 O H + O 2 4 C e O 2 + 4 C O 2 + 2 H 2 O
XPS analysis was carried out to investigate the Ce oxidation state (Ce3+/Ce4+) at the surface of CeO2. For quantitative calculations of the Ce3+ concentration in CeO2 particles, all the XPS Ce 3d spectra were deconvoluted into ten separate peaks using the mixed Gaussian–Lorentzian function. The fitted spectrum, shown in Figure 4a, designates v and u for the Ce 3d5/2 and Ce 3d3/2 graphs, respectively. The v0, u0, v′, and u′ peaks are attributed to Ce3+, while the remaining peaks correspond to Ce4+ ions [28].
The Ce3+ concentration can be calculated from semi-quantitative formula by using the area under fitted peaks [29]:
C e 3 + = A v 0 + A ( u 0 ) + A v + A ( u )
From Figure 4a,c, the calculated Ce3+ concentration values are 20.42% and 15.41% for HT-150 and HT-200, respectively. In other words, the concentration of Ce3+ in the CeO2 prepared at a hydrothermal temperature of 150 °C is higher than that prepared at a hydrothermal temperature of 200 °C.
We also analyzed the O1s spectrum, and the fitted spectrum is illustrated in Figure 4b. From this, we can clearly observe two types of oxygen peaks around 529.2 eV and 531.4 eV, which correspond to lattice oxygen (Olat) and surface—adsorbed oxygen (Oads) [15,23]. The area and intensity of the Oads peak are relevant to the OVs in the host lattice. The Oads ratio of HT-150 is calculated as 31.31%, which is higher than that of HT-200 (26.02%), suggesting that the O1s result is in line with the results from the Ce 3d spectra.
Figure 4d shows Raman spectra of the synthesized CeO2, complementing the structural characterization and valence information. In the test, we used an incident laser wavelength of 325 nm UV light, mainly because UV Raman is more sensitive to defect sites in ceria than visible Raman [30,31]. This is due to the resonance Raman effect, since ceria strongly absorbs light in the UV region [32]. We can see two main peaks centered at 451 and 600 cm−1. The peak near 451 cm−1 represents the Raman F2g mode, which originates from oxygen stretching vibrations and is strongly affected by the grain size [33], as established by the Grüneisen relation [34]. It could contribute to confinement and inhomogeneous strain effects, which influence the mode position and are responsible for the asymmetrical broadening of the Raman peak [33,35]. The active vibration peak near 600 cm−1 in the Raman spectrum is the defect—induced (D) mode, ascribed to the intrinsic oxygen vacancies because of the presence of Ce3+. The ratio of ID/IF2g is used to reflect the concentration of oxygen vacancies [36]. Based on the data presented in Figure 4d, the ID/IF2g values for HT-150 and HT-200 were 0.346 and 0.219, respectively. This suggests that the concentration of oxygen vacancies or Ce3+ in the sample synthesized at 150 °C is higher than that in the sample synthesized at 200 °C [32].
Figure 5a,d show the bright—field TEM images of CeO2 prepared at 150 °C and 200 °C, respectively.
It can be seen that the morphology and size of CeO2 observed by TEM are consistent with SEM. Figure 5b,e show the corresponding selected—area electron diffraction (SAED) patterns, revealing that CeO2 prepared at different hydrothermal temperatures contains single crystals with an FCC structure. Figure 5c displays the HRTEM image of the sample prepared at 150 °C, indicating lattice spacings of 0.186 nm corresponding to the (110) crystal planes of CeO2, consistent with SAED. Figure 5f presents the HRTEM image of CeO2 prepared at 200 °C, revealing lattice spacings of 0.255 nm, 0.303 nm, and 0.186 nm corresponding to the (100), (111), and (110) crystal planes of CeO2 [22,37]. The DFT calculations indicate that the (111), (110), and (100) planes are the three most thermodynamically stable surfaces of CeO2, with a vacancy formation energy sequence of (110) < (100) < (111) [38,39]. This suggests that the (100) and (110) crystal planes have higher defect concentrations [40]. Since the main exposed crystal plane of the sample prepared at 150 °C is the (110) plane, its surface Ce3+ concentration is higher than that of the 200 °C sample, which is primarily dominated by the (111), (110), and (100) planes. This is consistent with the results of XPS and Raman analysis.

3.2. The Polishing Performance of CeO2 Abrasives

MRR and Sa are the two most important indicators for evaluating the polishing performance of polishing materials.
HT-150 and HT-200 were dispersed in water to prepare a 1 wt.% polishing slurry, with the addition of SHMP as a dispersant. The particle size distributions of the polishing slurry are shown in Figure 6a,d. It can be observed that both polishing slurries exhibit single—peak distributions. The median particle diameters (D50) of HT-150 and HT-200 are 646 nm and 621 nm, respectively, with polydispersity indexes of 0.253 and 0.136, indicating that the dispersibility of the synthesized CeO2 exhibits excellent dispersion characteristics, especially for HT-200.
By measuring the weight change in the Si wafer during the polishing process, the MRRs for HT-150 and HT-200 were indirectly calculated, resulting in 216 nm/min and 324 nm/min, respectively. It is evident that the MRR of HT-200 is significantly higher than that of HT-150. Subsequently, an analysis of its Sa was conducted, and the typical 3D surface contour map and Sa of the Si wafer before and after polishing using HT-150 and HT-200 slurries, respectively, are shown in Figure 6b,c,e,f. Before polishing, the Sa values of the Si wafer are nearly the same. After polishing with HT-150, the Sa of the Si wafer slightly increases to 0.554 nm. When using HT-200 as the abrasive, the Sa decreases to 0.521 nm.
These results indicate that CeO2 prepared at a hydrothermal temperature of 200 °C exhibits superior polishing performance, striking a balance between a higher material removal rate and a lower Sa. This contradicts the conventional understanding that a higher Ce3+ concentration typically leads to better polishing performance. This suggests that the difference in performance is likely attributed to the influence of morphology, crystallinity, and particle size distribution on mechanical properties during the chemical–mechanical polishing process, outweighing the effects of Ce3+ concentration.
HT-150 is a flake—like material, reflecting its polishing state during CMP as shown in Figure 7a.
The thinner HT-150 abrasive has a larger contact area with the wafer, which leads to enhanced interfacial adhesion. And it is difficult for the tangential force of the machine to act on the thinner abrasive, which may make part of the abrasives ineffective. This may lead to degraded polishing performance. Additionally, compared to HT-200, HT-150 has a broader particle size distribution with relatively more large particles. This may lead to a higher likelihood of scratches and consequently higher Sa after polishing. In contrast, HT-200, with a certain thickness (~200 nm), may exhibit different states during polishing. As illustrated in Figure 7b, the triangular plane comes into contact with the Si wafer, providing superior Sa due to its relatively flat and smooth contact surface. In the polishing state shown in Figure 7c, the contact mode between CeO2 and the Si wafer surface is linear, increasing the contact pressure and thereby elevating the MRR. Finally, in the state depicted in Figure 7d, the abrasive particles have point contact with the Si wafer, exerting maximum pressure. This significantly enhances the MRR [22,41], while the rounded angles of the triangle prevent excessive scratching. Furthermore, compared to HT-150, HT-200 has a smaller average particle size and a greater percentage of particles smaller than the mean, effectively “filling in the gaps” between the larger particles. Therefore, HT-200 may be more effective in grinding than HT-150. The combined effect of the above polishing states allows HT-200 to have both a higher MRR and a superior Sa.
At present, the CeO2 slurry commonly used in IC generally consists of small particles. Figure 8 displays two common polishing slurries, which have a spherical particle shape with a median particle diameter (D50) of approximately 80 nm. We selected these two slurries as the control groups and conducted polishing studies under the same polishing process.
The average MRR and Sa values are summarized in Table 3 to evaluate the polishing performance quantitively. The MRRs for HT-150, HT200, CC1, and CC2 are 216 nm/min, 324 nm/min, 136 nm/min, and 154 nm/min, respectively, accompanied by Sa values of 0.554, 0.521, 0.592, and 0.847 nm. Clearly, the MRR of HT-200 is 210% higher compared to CC2, and Sa is reduced by 11.9% compared to CC1, demonstrating optimal polishing performance.
This implies that HT-200 is capable of effectively balancing MRR and surface roughness, Sa.
In comparison, the MRR and Sa of the commercial polishing slurries in the control group are both inferior to those of the CeO2 slurries synthesized in this study. This may be attributed to their predominantly spherical morphology and smaller particle sizes [42]. The polishing mechanism of spherical CeO2 involves rolling friction, resulting in a relatively lower MRR. Moreover, smaller particle sizes lead to an increased specific surface area and enhanced agglomeration, thereby causing challenges in subsequent cleaning and leaving a higher residue of CeO2 particles on the surface of Si wafers [42].
In summary, the CeO2 prepared in this study demonstrates favorable polishing performance, particularly with HT-200. This attests to the superiority of the morphological characteristics of CeO2 represented by HT-200 in polishing applications.

4. Conclusions

This study successfully synthesized two novel types of nearly monodisperse CeO2 at a high concentration of raw material without the addition of any dispersants. Both particle sizes were around 600 nm. At 150 °C, both types of CeO2 exhibited flake—like truncated triangular shapes with a Ce3+ concentration of 20.42%. At 200 °C, they took on a triangular form with a thickness of approximately 200 nm and a Ce3+ concentration of 15.41%. Polishing performance characterization revealed MRRs of 214 nm/min and 324 nm/min for CeO2 synthesized at 150 °C and 200 °C, respectively. Surprisingly, CeO2 with a higher Ce3+ concentration did not exhibit superior polishing performance as expected. Therefore, we speculate that factors such as morphology and crystallinity play a dominant role in the mechanical effects during CMP.
Furthermore, there is no need to actively pursue CeO2 with a smaller spherical shape. Polishing slurries prepared with smaller abrasives have noticeable drawbacks, such as increased surface area and enhanced agglomeration, leading to challenges in cleaning and a higher level of residue. Although spherical abrasives can reduce scratches during polishing, their disadvantage is apparent as the MRR is not as high as that of non—spherical abrasives. Therefore, in CMP, selecting CeO2 with a specific morphology and appropriate particle size can balance the MRR and Sa more appropriately. It is evident that the triangular CeO2 prepared at 200 °C, as presented in this paper, is a favorable choice.

Author Contributions

X.W.: Investigation, Formal Analysis, Visualization, Writing—Original Draft. N.W.: Conceptualization, Formal Analysis, Review and Editing, Funding Acquisition. Z.Z.: Investigation, Visualization, Formal Analysis. X.T.: Investigation, Formal Analysis. Y.Z.: Methodology, Funding Acquisition. J.Y.: Project Administration, Review and Editing, Funding Acquisition. All authors have read and agreed to the published version of the manuscript.

Funding

This work was supported by the National Key Research and Development Program [grant number 2021YFB3501101] and Beijing Nova Program [grant number 2022048427].

Data Availability Statement

Data are contained within the article.

Conflicts of Interest

Xingzi Wang, Ning Wang, Zhenyu Zhang, Xianmin Tan, Yuanyuan Zheng and Juanyu Yang were employed by the National Engineering Research Center for Rare Earth, GRIREM Advanced Materials Co., Ltd., and Rare Earth Functional Materials (Xiong’an) Innovation Center Co., Ltd. The remaining authors declare that the research was conducted in the absence of any commercial or financial relationships that could be construed as a potential conflict of interest.

References

  1. Zhao, D.; Lu, X. Chemical mechanical polishing: Theory and experiment. Friction 2013, 1, 306–326. [Google Scholar] [CrossRef]
  2. Moon, Y. Advances in Chemical Mechanical Planarization (CMP), 2nd ed.; Woodhead Publishing: New York, NY, USA, 2022; pp. 3–28. [Google Scholar]
  3. Lee, H.; Kim, H.; Jeong, H. Approaches to Sustainability in Chemical Mechanical Polishing (CMP): A Review. Int. J. Precis. Eng. Manuf.-Green Technol. 2022, 9, 349–367. [Google Scholar] [CrossRef]
  4. Srinivasan, R.; Dandu, P.V.; Babu, S.V. Shallow Trench Isolation Chemical Mechanical Planarization: A Review. ECS J. Solid State Sci. Technol. 2015, 4, P5029–P5039. [Google Scholar] [CrossRef]
  5. Cook, L.M. Chemical processes in glass polishing. J. Non-Cryst. Solids 1990, 120, 152–171. [Google Scholar] [CrossRef]
  6. Yang, J.C.; Oh, D.W.; Lee, G.W.; Song, C.L.; Kim, T. Step height removal mechanism of chemical mechanical planarization (CMP) for sub-nano-surface finish. Wear 2010, 268, 505–510. [Google Scholar] [CrossRef]
  7. Balamurugan, S.; Ashika, S.A.; Jainshaa, J. Influence of synthesis methods (combustion and precipitation) on the formation of nanocrystalline CeO2, MgO, and NiO phase materials. Results Chem. 2023, 5, 100941. [Google Scholar] [CrossRef]
  8. Suresh, R.; Ponnuswamy, V.; Mariappan, R. Effect of annealing temperature on the microstructural, optical and electrical properties of CeO2 nanoparticles by chemical precipitation method. Appl. Surf. Sci. 2013, 273, 457–464. [Google Scholar] [CrossRef]
  9. Ramachandran, M.; Subadevi, R.; Sivakumar, M. Role of pH on synthesis and characterization of cerium oxide (CeO2) nano particles by modified co-precipitation method. Vacuum 2019, 161, 220–224. [Google Scholar] [CrossRef]
  10. Hernández-Arteaga, J.; Ojeda-Galván, H.J.; Alanis, J.; Rodríguez-Aranda, M.; Villabona-Leal, E.; Mendoza-Mendoza, E.; Ulloa-Castillo, N.A.; Quintana, M.; Navarro-Contreras, H.R.; Rodríguez, A. Thermal tuning of the morphology of hydrothermally synthesized CeO2 nanotubes for photocatalytic applications. Ceram. Int. 2022, 48, 17802–17815. [Google Scholar] [CrossRef]
  11. Divya, T.; Anjali, C.; Sunajadevi, K.R.; Anas, K.; Renuka, N.K. Influence of hydrothermal synthesis conditions on lattice defects in cerium oxide. J. Solid State Chem. 2021, 300, 122253. [Google Scholar] [CrossRef]
  12. Li, H.; Qu, Y.; Zhang, X. The gas sensor utilizing CeO2 nanorods for the low temperature detection of hydrogen. Inorg. Chem. Commun. 2021, 130, 108692. [Google Scholar] [CrossRef]
  13. Sonawane, L.D.; Mandawade, A.S.; Ahemad, H.I.; Aher, Y.B.; Gite, A.B.; Nikam, L.K.; Shinde, S.D.; Jain, G.H.; Patil, G.E.; Shinde, M.S. Sol-gel and hydrothermal synthesis of CeO2 NPs: Their physiochemical properties and applications for gas sensor with photocatalytic activities. Inorg. Chem. Commun. 2024, 2024, 112313. [Google Scholar] [CrossRef]
  14. Hadi, A.; Yaacob, I.I. Novel synthesis of nanocrystalline CeO2 by mechanochemical and water-in-oil microemulsion methods. Mater. Lett. 2007, 61, 93–96. [Google Scholar] [CrossRef]
  15. Mao, X.; Xia, X.; Li, J.; Chen, C.; Gu, X.; Li, S.; Lan, Y.-P. Self-assembly of structured CeCO3OH and its decomposition in H2 for a novel tactic to obtain CeO2-with excellent photocatalytic property. J. Alloys Compd. 2021, 870, 159424. [Google Scholar] [CrossRef]
  16. Huang, Y.-C.; Wu, S.-H.; Hsiao, C.-H.; Lee, A.-T.; Huang, M.H. Mild Synthesis of Size-Tunable CeO2 Octahedra for Band Gap Variation. Chem. Mater. 2020, 32, 2631–2638. [Google Scholar] [CrossRef]
  17. Sonsupap, S.; Waehayee, A.; Siritanon, T.; Saenrang, W.; Chanlek, N.; Nakajima, H.; Rattanachata, A.; Maensiri, S. Structural, optical, and photocatalytic properties of La3+ doped CeO2 nanospheres for enhanced photodegradation of tetracycline. Colloids Surf. A Physicochem. Eng. Asp. 2023, 659, 130650. [Google Scholar] [CrossRef]
  18. Ozawa, N.; Ishikawa, M.; Nakamura, M.; Kubo, M. Polishing Process Simulation of SiO2 by CeO2 Abrasive Grain under Wet Environment. Hyomen Kagaku 2012, 33, 351–356. [Google Scholar] [CrossRef]
  19. Kim, E.; Hong, J.; Hong, S.; Kanade, C.; Seok, H.; Kim, H.-U.; Kim, T. Improvement of oxide removal rate in chemical mechanical polishing by forming oxygen vacancy in ceria abrasives via ultraviolet irradiation. Mater. Chem. Phys. 2021, 273, 124967. [Google Scholar] [CrossRef]
  20. Lee, J.; Kim, E.; Bae, C.; Seok, H.; Cho, J.; Aydin, K.; Kim, T. Improvement of oxide chemical mechanical polishing performance by increasing Ce3+/Ce4+ ratio in ceria slurry via hydrogen reduction. Mater. Sci. Semicond. Process. 2023, 159, 107349. [Google Scholar] [CrossRef]
  21. Cheng, J.; Huang, S.; Li, Y.; Wang, T.; Xie, L.; Lu, X. RE (La, Nd and Yb) doped CeO2 abrasive particles for chemical mechanical polishing of dielectric materials: Experimental and computational analysis. Appl. Surf. Sci. 2020, 506, 144668. [Google Scholar] [CrossRef]
  22. Hu, P.; Chen, Y.; Sun, R.; Chen, Y.; Yin, Y.; Wang, Z. Synthesis, characterization and frictional wear behavior of ceria hybrid architectures with {111} exposure planes. Appl. Surf. Sci. 2017, 401, 100–105. [Google Scholar] [CrossRef]
  23. Xu, N.; Ma, J.; Liu, Q.; Luo, Y.; Pu, Y. Preparation of CeO2 abrasives by reducing atmosphere-assisted molten salt method for enhancing their chemical mechanical polishing performance on SiO2 substrates. J. Rare Earths 2023, 41, 1627–1635. [Google Scholar] [CrossRef]
  24. Kaczmarek, A.M.; Van Hecke, K.; Van Deun, R. Nano- and micro-sized rare-earth carbonates and their use as precursors and sacrificial templates for the synthesis of new innovative materials. Chem. Soc. Rev. 2015, 44, 2032–2059. [Google Scholar] [CrossRef] [PubMed]
  25. Balakrishnan, G.; Raghavan, C.; Ghosh, C.; Divakar, R.; Mohandas, E.; Song, J.I.; Bae, S.; Kim, T.G. X-ray diffraction, Raman and photoluminescence studies of nanocrystalline cerium oxide thin films. Ceram. Int. 2013, 39, 8327–8333. [Google Scholar] [CrossRef]
  26. Tsuda, Y.; Uda, K.; Chiba, M.; Sun, H.; Sun, L.; White, M.S.; Masuhara, A.; Yoshida, T. Selective hybridization of organic dyes with CuSCN during its electrochemical growth. Microsyst. Technol. 2018, 24, 715–723. [Google Scholar] [CrossRef]
  27. Uchiyama, H.; Sakaue, R.; Kozuka, H. Preparation of nanostructured CeCO3OH particles from aqueous solutions and gels containing biological polymers and their thermal conversion to CeO2. RSC Adv. 2013, 3, 20106. [Google Scholar] [CrossRef]
  28. Sims, C.M.; Maier, R.A.; Johnston-Peck, A.C.; Gorham, J.M.; Hackley, V.A.; Nelson, B.C. Approaches for the quantitative analysis of oxidation state in cerium oxide nanomaterials. Nanotechnology 2019, 30, 085703. [Google Scholar] [CrossRef] [PubMed]
  29. Han, K.M.; Han, S.Y.; Sahir, S.; Yerriboina, N.P.; Kim, T.G.; Mahadev, N.; Park, J.G. Contamination Mechanism of Ceria Particles on the Oxide Surface after the CMP Process. ECS J. Solid State Sci. Technol. 2020, 9, 124004. [Google Scholar] [CrossRef]
  30. Li, L.; Hu, G.S.; Lu, J.Q.; Luo, M.F. Review of Oxygen Vacancies in CeO2-doped Solid Solutions as Characterized by Raman Spectroscopy. Acta Phys.-Chim. Sin. 2012, 28, 1012–1020. [Google Scholar]
  31. Taniguchi, T.; Watanabe, T.; Sugiyama, N.; Subramani, A.K.; Wagata, H.; Matsushita, N.; Yoshimura, M. Identifying Defects in Ceria-Based Nanocrystals by UV Resonance Raman Spectroscopy. J. Phys. Chem. C 2009, 113, 19789–19793. [Google Scholar] [CrossRef]
  32. Wu, Z.; Li, M.; Howe, J.; Meyer, H.M.; Overbury, S.H. Probing Defect Sites on CeO2 Nanocrystals with Well-Defined Surface Planes by Raman Spectroscopy and O 2 Adsorption. Langmuir 2010, 26, 16595–16606. [Google Scholar] [CrossRef] [PubMed]
  33. Spanier, J.E.; Robinson, R.D.; Zhang, F.; Chan, S.W.; Herman, I.P. Size-dependent properties of CeO2−y nanoparticles as studied by Raman scattering. Phys. Rev. B 2001, 64, 245407. [Google Scholar] [CrossRef]
  34. Kosacki, I.; Suzuki, T.; Anderson, H.U.; Colomban, P. Raman scattering and lattice defects in nanocrystalline CeO2 thin films. Solid State Ion. 2002, 149, 99–105. [Google Scholar] [CrossRef]
  35. Popović, Z.; Dohčević-Mitrović, Z.; Šćepanović, M.; Grujić-Brojčin, M.; Aškrabić, S. Raman scattering on nanomaterials and nanostructures. Ann. Phys. 2011, 523, 62–74. [Google Scholar] [CrossRef]
  36. Pu, Z.Y.; Liu, X.S.; Jia, A.P.; Xie, Y.L.; Lu, J.Q.; Luo, M.F. Enhanced Activity for CO Oxidation over Pr- and Cu-Doped CeO2 Catalysts: Effect of Oxygen Vacancies. J. Phys. Chem. C 2008, 112, 15045–15051. [Google Scholar] [CrossRef]
  37. Li, J.; Wang, C.; Zhu, X.; Wu, T.; Tang, B.; Li, Y. Synthesis of hierarchical CeO2 octahedrons with tunable size and the catalytic properties. Mater. Lett. 2019, 240, 73–76. [Google Scholar] [CrossRef]
  38. Zhang, Y.; Bals, S.; Van Tendeloo, G. Understanding CeO2-Based Nanostructures through Advanced Electron Microscopy in 2D and 3D. Part. Part. Syst. Charact. 2019, 36, 1800287. [Google Scholar] [CrossRef]
  39. Marciniak, A.A.; Henrique, F.J.; de Lima, A.F.; Alves, O.C.; Moreira, C.R.; Appel, L.G.; Mota, C.J. What are the preferred CeO2 exposed planes for the synthesis of dimethyl carbonate? Answers from theory and experiments. Mol. Catal. 2020, 493, 111053. [Google Scholar] [CrossRef]
  40. Trovarelli, A.; Llorca, J. Ceria Catalysts at Nanoscale: How Do Crystal Shapes Shape Catalysis? ACS Catal. 2017, 7, 4716–4735. [Google Scholar] [CrossRef]
  41. Lee, H.; Lee, D.; Jeong, H. Mechanical aspects of the chemical mechanical polishing process: A review. Int. J. Precis. Eng. Manuf. 2016, 17, 525–536. [Google Scholar] [CrossRef]
  42. Han, X.; Liu, R.; Tan, B.; Wang, F.; Yan, M.; Zhao, X.; Zhao, J. Research progress on the application of ceria nanoparticles as abrasives in dielectric layer CMP and post cleaning: Structure, morphology, doping, and mechanism. Colloids Surf. A Physicochem. Eng. Asp. 2023, 679, 132551. [Google Scholar] [CrossRef]
Figure 1. SEM images of HT-p-150 (a), HT-150 (b), HT-p-200 (d), and HT-200 (e), and particle size distribution of HT-150 (c) and HT-200 (f).
Materials 17 02001 g001
Figure 2. XRD patterns of precursors and calcination products (a,b).
Materials 17 02001 g002
Figure 3. TG−DTG curves of HT-p-150 and HT-p-200.
Materials 17 02001 g003
Figure 4. The fitted Ce 3d spectra (a) and O1s (b), and the statistical results after fitting (c) and Raman (d).
Materials 17 02001 g004
Figure 5. TEM, SEAD, and HRTEM of HT-150 (ac), and HT-200 (df).
Materials 17 02001 g005
Figure 6. The particle size distribution of polishing slurries HT-150 (a) and HT-200 (d), and the 3D surface contour map of the Si wafer before polishing (b,e), and after polishing with slurry HT-150 (c) and slurry HT-200 (f).
Materials 17 02001 g006
Figure 7. Schematic diagram of abrasive particles in the CMP: HT-150 (a) and HT-200 (bd).
Materials 17 02001 g007
Figure 8. SEM images of commercial polishing abrasives CC1 (a) and CC2 (c), and the particle size distribution of polishing slurries CC1 (b) and CC2 (d).
Materials 17 02001 g008
Table 1. Polishing parameters.
ParameterSpecifications
Head rotating speed45 rpm
Pad rotating speed15 rpm
Slurry flow rate50 mL/min
Polishing pressure5.98 Psi
Polishing time2 min
Table 2. XRD diffraction peak intensity ratio of precursors.
HT-p-150HT-p-200Standard (JCPDS No. 52-0352)
Intensity ratio of (300)/(002)1.501.790.79
Intensity ratio of (032)/(002)1.852.350.79
Table 3. MRR and Sa data of various slurries.
HT-150HT-200CC1CC2
MRR (nm/min)216324136154
Sa (nm)0.5540.5210.5920.847
Disclaimer/Publisher’s Note: The statements, opinions and data contained in all publications are solely those of the individual author(s) and contributor(s) and not of MDPI and/or the editor(s). MDPI and/or the editor(s) disclaim responsibility for any injury to people or property resulting from any ideas, methods, instructions or products referred to in the content.

