Article

Synthesis, Characterization, and Properties of a Novel Hyperbranched Polymers with Polyacrylamide Side Chains

1
School of Chemical Engineering, Sichuan University of Science and Engineering, Zigong 643000, China
2
Tianjin Key Laboratory of Brine Chemical Engineering and Resource Eco-Utilization, College of Chemical Engineering and Materials Science, Tianjin University of Science and Technology, No.29, 13th Street, Binhai New District, Tianjin 300457, China
3
Jidong Oilfield Branch Company, PetroChina Company Limited, Tangshan 063002, China
*
Author to whom correspondence should be addressed.
Materials 2024, 17(7), 1619; https://doi.org/10.3390/ma17071619
Submission received: 12 January 2024 / Revised: 9 March 2024 / Accepted: 14 March 2024 / Published: 1 April 2024

Abstract

:
A novel hyperbranched polymer with polyacrylamide side chains (HAPAM) was synthesized by aqueous solution polymerization using acrylic acid, acrylamide, 2-acrylamido-2-methyl-1-propanesulfonic acid, hydrophobic monomer of dimethyl octadecyl ammonium chloride, and the homemade skeleton monomer of modified-M2.0 as raw materials and (NH4)2S2O8-NaHSO3 as initiator. The molecular structure, functional groups, and surface morphology of HAPAM were characterized by Fourier transform infrared spectroscopy, nuclear magnetic resonance hydrogen spectroscopy, and scanning electron microscopy. It was found that the performance of HAPAM solution was higher than that of ordinary polyacrylamide solution in terms of thickening ability, shearing resistance, thermal endurance, salt-resistance, resistance-coefficient and residual-resistance-coefficient, ability to reduce interfacial tension between polymer solution and crude oil, and oil-displacement-efficiency. In particular, the enhanced oil recovery of the HAPAM solution was 13.03%, and the improvement of shearing resistance and immunity to chromatographic separation were simultaneously achieved by the HAPAM solution. These results indicate that the successful synthesis of the novel HAPAM opens a promising strategy for developing new high-performance oil-displacing polymers.

1. Introduction

After the first and second stages of oil production from the well, there were still large volumes of the original oil bypassed or trapped in the reservoir [1,2,3]. Therefore, enhanced oil recovery (EOR) methods were used to recover the additional oil [4,5,6,7]. The EOR methods were majorly classified into thermal and non-thermal EOR [8,9,10]. Unfortunately, thermal EOR methods were unsuitable for reservoirs with great depth and thin pay zones [11]. In addition, the application of thermal EOR was still challenged both economically and environmentally because of the high cost of heat supply along with excessive CO2 emission and costly post-treatment and maintenance [12,13]. Hence, non-thermal EOR methods, including physical, chemical, and biological techniques [14], have received prodigious attention in the recovery of conventional and heavy oil [15]. Amongst all non-thermal EOR methods, chemical EOR has been recognized as the most promising technique due to its technical and economic feasibility and reasonable capital cost [16]. Polymer flooding was the simplest and most widely used chemical EOR process [17].
Because of the synergistic improvement of sweep efficiency and oil-washing efficiency, binary polymeric surfactant mixtures (BPSMs) have become the main chemical EOR technique for recovering the oil in oilfields with high and ultra-high water cuts [18,19]. However, the on-site applications were still severely inhibited due to two major technical bottlenecks. First, the extensively used BPSMs (such as partially hydrolyzed linear polyacrylamide, PAM) still have relatively poor shear resistance [20], and their sweeping efficiency and oil-washing efficiency were low [21], which need to be further advanced. Second, the synergistic effect of BPSMs was significantly weakened by chromatographic separation (i.e., the differential transport speed of BPSMs flowing in the boreholes after injection into the stratum). Therefore, it is necessary to improve the poor shear resistance and avoid the chromatographic separation of BPSMs to further advance their oil-displacing performance [22,23].
In recent years, several research groups reported that oil-displacing polymers with special molecular structures (comb-type [24], star-type [25], and hyperbranched type [26]) show strong shear resistance [27,28]. Duan et al. [29] studied the flow-induced scission behavior of PAM with four-arm-star during planar elongational flow in a cross-slot flow cell. They also found that the PAM with a four-arm star exhibited better-shearing stability than that of the linear PAM at the same shearing rate. Chen et al. [30] synthesized a new type of chitosan-modified hyperbranched polymers (HPDACs) by the free-radical polymerization of surface-modified chitosan with acrylic acid (AA) and acrylamide (AM). After mechanical shearing, the viscosity retention rate of HPDACs in ultrapure water and simulated brine was higher than that of PAM and the dendritic polymer, indicating the excellent shear resistance and good viscoelasticity of HPDACs. In addition, in order to effectively avoid chromatographic separation problems of BPSMs, both hydrophobic and hydrophilic groups were introduced into BPSMs [31] to improve the ability to expand the swept volume and oil displacing efficiency [32,33]. Zhu et al. [34] synthesized an amphiphilic polymer with twin-tailed hydrophobic groups (TAP). They estimated a lower critical aggregation concentration (CAC, 800 mg/L) of TAP, and a higher apparent viscosity can be obtained when the concentration of TAP was higher than CAC due to the strong hydrophobic association. However, to date, there have been limited reports about hyperbranched amphiphilic polyacrylamides (HAPAMs) with synergistic effects of excellent shearing resistance and a strong ability to reduce interfacial tension [35,36,37,38,39,40]. To this end, in this work, a novel HAPAM with 16 branched chains was successfully synthesized by introducing hydrophobic group (dimethyl octadecyl ammonium chloride, DMCAAC-18) and hydrophilic groups (AA, AM, and AMPS, abbreviated from 2-acrylamido-2-methyl-1-propanesulfonic acid) into the molecular chain, simultaneously enhancing the shear-resistance and avoiding the phenomenon of chromatographic separation. Their microstructures, functional groups, and surface morphology were characterized using Fourier transform infrared spectroscopy (FT-IR), nuclear magnetic resonance hydrogen spectroscopy (1H-NMR), and scanning electron microscopy (SEM). The differences between HAPAM and PAM on thickening ability, shear-resistance, temperature resistance, salt resistance, resistance-coefficient and residual-resistance-coefficient, ability to reduce interfacial tension, and oil-displacement-efficiency were investigated via a series of systematic tests.

2. Experimental Section

2.1. Materials

All chemicals used in this study were of analytical grade and were used without any further purification. Acrylamide (AM), acrylic acid (AA), sodium hydroxide, sodium bicarbonate, ethanol, sodium chloride, potassium chloride, sodium bisulfite (SDS), ethylenediamine (EDA), methanol, methyl acrylate (MA), N,N-Dimethylformamide (DMF), Maleic anhydride (MAH) and anhydrous sodium sulfate were purchased from Chengdu Kelong Chemical Co., Ltd. (Chengdu, China). 2-acrylamide-2-methyl-1-propane sulfonic acid (AMPS) was purchased from Bide Pharmatech Co., Ltd. (Shanghai, China) Ammonium persulfate was supplied by Guangdong Guanghua Sci-Tech Co., Ltd. (Shantou, China). Anhydrous magnesium chloride was purchased from Tianjin Balance Bio-tech Co., Ltd. (Tianjin, China). Calcium chloride was supplied by Chengdu Jinshan Chemical Reagent Co., Ltd. (Chengdu, China). Dodecyl dimethyl allyl ammonium chloride (DMDAAC-18) was bought from Zhangjiagang Renda Chemical Co., Ltd. (Suzhou, China). And ammonium persulfate (APS) was supplied by Guangdong Guanghua Sci-Tech Co., Ltd. (Shantou, China). Especially, the composition of the simulated injection-water was given in Table 1.

2.2. Synthesis Processes

2.2.1. Synthesis of Modified-M2.0

As described in the reference [41], the skeleton-polymer of a 2.0 generation dendritic macromolecule (M2.0) with eight branch chains was synthesized as follows steps. Step (i), 18.0 g of ethylenediamine (EDA) and 60 g of methanol were added into a three-necked flask with a magnetic stirrer for stirring, a reflux condenser for reflux condensation, and a thermometer for temperature-monitoring. In addition, 113.2 g of methyl acrylate (MA) was gradually dripped into the solution. The reaction was controlled at 25 ± 0.1 °C for 24 h. After the reaction, M0.5 was purified and obtained by vacuum distillation and silica gel column. Step (ii), 40.4 g of M0.5 and 64 g of methanol were added into a fresh three-necked flask with a magnetic stirrer, reflux condenser, and thermometer, dripping with 80 g of EDA. The reaction of the stirring solution was controlled at 72 ± 0.1 °C for 24 h. After the reaction, M1.0 was purified and obtained by vacuum distillation and silica gel column. Step (iii), 30 g of M1.0 and 40 g of methanol were added into a fresh three-necked flask with a magnetic stirrer, a reflux condenser tube, and a thermometer, with dripping 50 g of MA. The reaction of the stirring solution was controlled at 72 ± 0.1 °C for 24 h. After the reaction, M1.5 was purified and obtained by vacuum distillation and silica gel column. Step (iv), 30 g of M1.5 and 50 g of methanol to a fresh three-necked flask with a magnetic stirrer, reflux condenser tube, and a thermometer, dripping with 14 g of EDA. The reaction of the stirring solution was also controlled at 72 ± 0.1 °C for 24 h. Finally, the dendritic skeleton-polymer of M2.0 was purified and obtained by vacuum distillation and silica gel column. Step (v) was the process of modifying the structure of M2.0. 8 g of M2.0 and 30 g of N, N-Dimethylformamide (DMF) were added into a beaker to dissolve M2.0 completely, slowly dripping with 4.4 g of maleic anhydride. After finishing the addition of maleic anhydride (MAH), the beaker was sealed and put into an oven to react at 70 °C for 6 h. In the end, the solution of the modified-M2.0 was obtained in the form of a brown transparent solution. Especially, the synthetic yield of M0.5, M1, M1.5, and M2 was 93.3%, 95.5%, 95.8%, and 96.1%, respectively. Additionally, there one work reported that the synthetic yield of M0.5, M1, M1.5, and M2 was 98.1%, 98.7%, 99.2%, and 99.7%, respectively [42]. Therefore, this similarity indirectly implied the accuracy of our experiments.

2.2.2. Synthesis of HAPAM and PAM

To enable the dendritic skeleton to participate in polymerization, cis-butenedioic anhydride was used to introduce double bonds into the modified dendritic M2.0. Then, the detailed synthesis process of HAPAM was given as follows: a round bottom flask with three necks was added with 30 g of deionized water and 6.0 g of AA and deaerated by N2. NaOH was added into the solution to adjust pH = 7 after the complete dissolution of AA. Besides, the solution was added with 6.1 g of AM, 0.5 g of AMPS, 1.2 g of DMCAAC-18, and 0.5 g of M2.0, respectively, stirring until complete dissolution. Again, deionized water was added to adjust the mass concentration (25 wt%) of AM, AMPS, DMCAAC-18, and M2.0 in the whole solution. The temperature of the solution was stabilized at 40 °C, gradually adding (NH4)2S2O8 and NaHSO3 (0.2 wt% and molar ratio of (NH4)2S2O8 and NaHSO3 was 1:1) as an initiator with stirring evenly. Finally, the above mixtures were sealed in a beaker for reaction about 4 h to obtain HAPAM. The synthesis formula of D-M-HPA is shown in Figure 1. The PAM was prepared using the same method without adding DMCAAC-18 and M2.0.

2.3. Characterization

The microstructures of HAPAM and PAM were characterized by a VEGA3SBU scanning electron microscope (SEM, Beijing Dongxiyi Technology Co., Ltd., Beijing, China). The sample preparation for SEM was given as follows: (i) the concentration of both PAM solution and HAPAM polymer solution was 1000 mg/L, (ii) 1-2 drops of the solutions were taken onto the conductive adhesive and treated in a vacuum freeze-drying oven for 24 h, (iii) after gold spraying, the samples were observed by scanning electron microscopy. The infrared spectrum of HAPAM was measured by a Fourier infrared spectrometer (FTIR-650, Tianjin Zhongke Ruijie Technology Co., Ltd., Tianjin, China). HAPAM was characterized by an FTIR-650 Fourier infrared spectrometer. The sample preparation for FTIR was given as follows: (i) Wash HAPAM with anhydrous ethanol three times, (ii) put it in the oven at 35 °C to get a solid with a crisp texture, (iii) take it out and grind it into powder, iv) evenly disperse the ground fine powder in potassium bromide and press it into a transparent sheet sample, (v) KBr should be dried before use, and the grinding particle size was less than 2 microns. The 1H-NMR spectrum of HAPAM was obtained by a nuclear magnetic resonance instrument (Bruker-AC-E200, Bruker, Switzerland). The sample preparation for 1H-NMR was given as follows: (i) Clean HAPAM with anhydrous ethanol 3 times to remove impurities, (ii) put it in a vacuum drying oven at 35 °C for drying, (iii) take it out and grind it into a fine powder after drying, (iv) put 1–2 mg into a nuclear magnetic tube, and (v) use 0.55 mL D2O to completely dissolve it.

2.4. Performance-Evaluation

The difference between HAPAM and PAM on thickening ability, shear-resistance, thermal endurance, and salt-resistance were evaluated via a series of static tests by measuring the apparent viscosity of HAPAM and PAM solutions using an NDJ-5S digital rotary viscometer rotor at the speed of 30 rpm (Shanghai Fangrui Instrument Co., Shanghai, China). Additionally, the interfacial tension of HAPAM and PAM solutions (with mass concentrations of 500 mg/L, 750 mg/L, and 1000 mg/L) was measured by the interfacial tension meter (Guangdong Insa Instrument Technology Co., Dongguan, China). The resistance-coefficient and residual-resistance-coefficient for 2000 mg/L of HAPAM and PAM solutions were determined using sandpack core flooding experiments at 65 °C. The sand pack core holder (Φ2.5 cm × 30 cm) was filled with quartz sand of 80–120 meshes (with a porosity of 36.69%). Before oil injection, the packed core was vacuumed with a vacuum pump to drain the core and saturated water completely. Then, the initial water permeability of the sand pack core was measured, and the porosity of the core could be calculated according to the volume of the brine absorbed by the vacuumed porous media. In addition, crude oil was injected into the sand pack core until the brine production became negligible. Secondly, the specific experimental steps of water flooding and polymer flooding were given as follows: (1) Water-driving-stage: the sand pack core holder was injected with the simulated injection water at an injection speed of 10 mL/min, recording the stabilized pressure of P w 1 (MPa). (2) Polymer-flooding-stage: 2000 mg/L of HAPAM or PAM solutions were injected into the one-dimensional sand-filling model at an injection rate of 10 mL/min, also recording the stabilized pressure of P p (MPa). (3) Subsequent-water-driving stage: the one-dimensional sand-filling model was injected with the simulated injection water again at an injection speed of 10 mL/min, recording the stabilized pressure of P w 2 (MPa). The resistance-coefficient (RF) and residual-resistance-coefficient (RRF) can be given as the following formula.
R F = P p P w 1
R R F = P w 2 P w 1
Moreover, the oil-displacement performance of HAPAM or PAM solutions (2000 mg/L) was also determined by the sand pack core flooding experiments. The detailed experimental steps are as follows: (1) The sand pack core holder was saturated with the simulated injection water, as given in Table 1 (water-flooding). (2) Then, it was saturated with crude oil (778.56 mPa·s) at a speed of 2 mL/min (polymer-flooding) until irreducible water saturation. After aging for 24 h, the simulated injection water was injected at a speed of 2 mL/min to displace the crude oil until the water cut reached above 95%. Again, the polymer solution was injected at a speed of 2 mL/min to obtain a water cut that reached above 95%. The EOR of the polymer solutions can be calculated by the following equation:
E O R = E t o t a l E w a t e r
where EOR, Etotal, and Ewater were EOR of polymer solution (%), oil recovery of water-flooding and polymer-flooding process (%), and oil recovery of water-flooding process (%).

3. Results and Discussion

3.1. Infrared Spectrum of M0.5, M1.0, M1.5, M2.0, and HAPAM

The IR spectra of M0.5, M1.0, M1.5, M2.0, and HAPAM were given in Figure 2, and the peaks were also given in Table 2, respectively. For M1.0, M1.5, and M2.0, the peaks near 3288~3295 cm−1 and 3068~3078 cm−1 can be ascribed to N-H stretching vibration [43,44], while the strong peak of HAPAM near 3433 cm−1 can be assigned to the multiple complex groups of its -CONH- and -CONH2. Meanwhile, the peaks of M0.5, M1.0, M1.5, M2.0, and HAPAM around 2928~2951 cm−1 and 2837~2860 cm−1 were categorized as antisymmetric and symmetric stretching vibration of C-H [45,46]. The C=O stretching vibrational peaks in the group of -COOC- for M0.5, M1.0, M1.5, and M2.0 were located at relatively stronger peaks of 1727~1731 cm−1 and weaker peaks of 1644~1652 cm−1. Meanwhile, the C=O stretching vibrations in several groups of -CONH-, -CONH2, and -COONa for HAPAM resulted in a strong and broad peak near 1635 cm−1 [47,48]. In particular, for M0.5, M1.0, M1.5, M2.0, and HAPAM, the N-H bending vibrational peaks of CONH-, the C-H in-plane bending vibrational peaks, and the C-N stretching vibrational peaks of tertiary amines were respectively appeared round 1549~1477 cm−1, 1416~1473 cm−1, and 1319~1361 cm−1, respectively [49,50,51]. In addition, the stretching vibrational peaks of C-C and tertiary amine C-N were observed at 1175~1199 cm−1 in M0.5, M1.0, M1.5, M2.0, and HAPAM [52]. Interestingly, the stretching vibrational peaks of C-O-C in M0.5 and M1.5, the stretching vibrational peaks of primary amine C-N in M1.0 and M2.0, the C-O bonds of -COONa in HAPAM, and the stretching vibrational peak of S=O in -SO3Na were also overlapped at this position [53,54,55]. Also, tertiary amine C-N stretching vibrational peaks of M0.5, M1.0, M1.5, M2.0, and HAPAM were observed around 1123~1127 cm−1 [56]. In addition, the primary amine C-N stretching vibration and N-H in-plane bending vibration stretching vibration peaks for M1.0 and M2.0, the C-O bond of -COONa in HAPAM, and the S-O stretching vibration peak in -SO3Na were also overlapped around this range [57,58,59]. The stretching vibration peaks of tertiary amine C-N were observed at 1036~1044 cm−1 for M0.5, M1.0, M1.5, M2.0 [60], and HAPAM. Meanwhile, the stretching vibration peaks of primary amine C-N and N-H in-plane bending vibration for M1.0 and M2.0 also overlapped around this position [61]. Thus, the strong characteristic peaks of -COONa and -SO3Na indicated the successful synthesis of HAPAM.

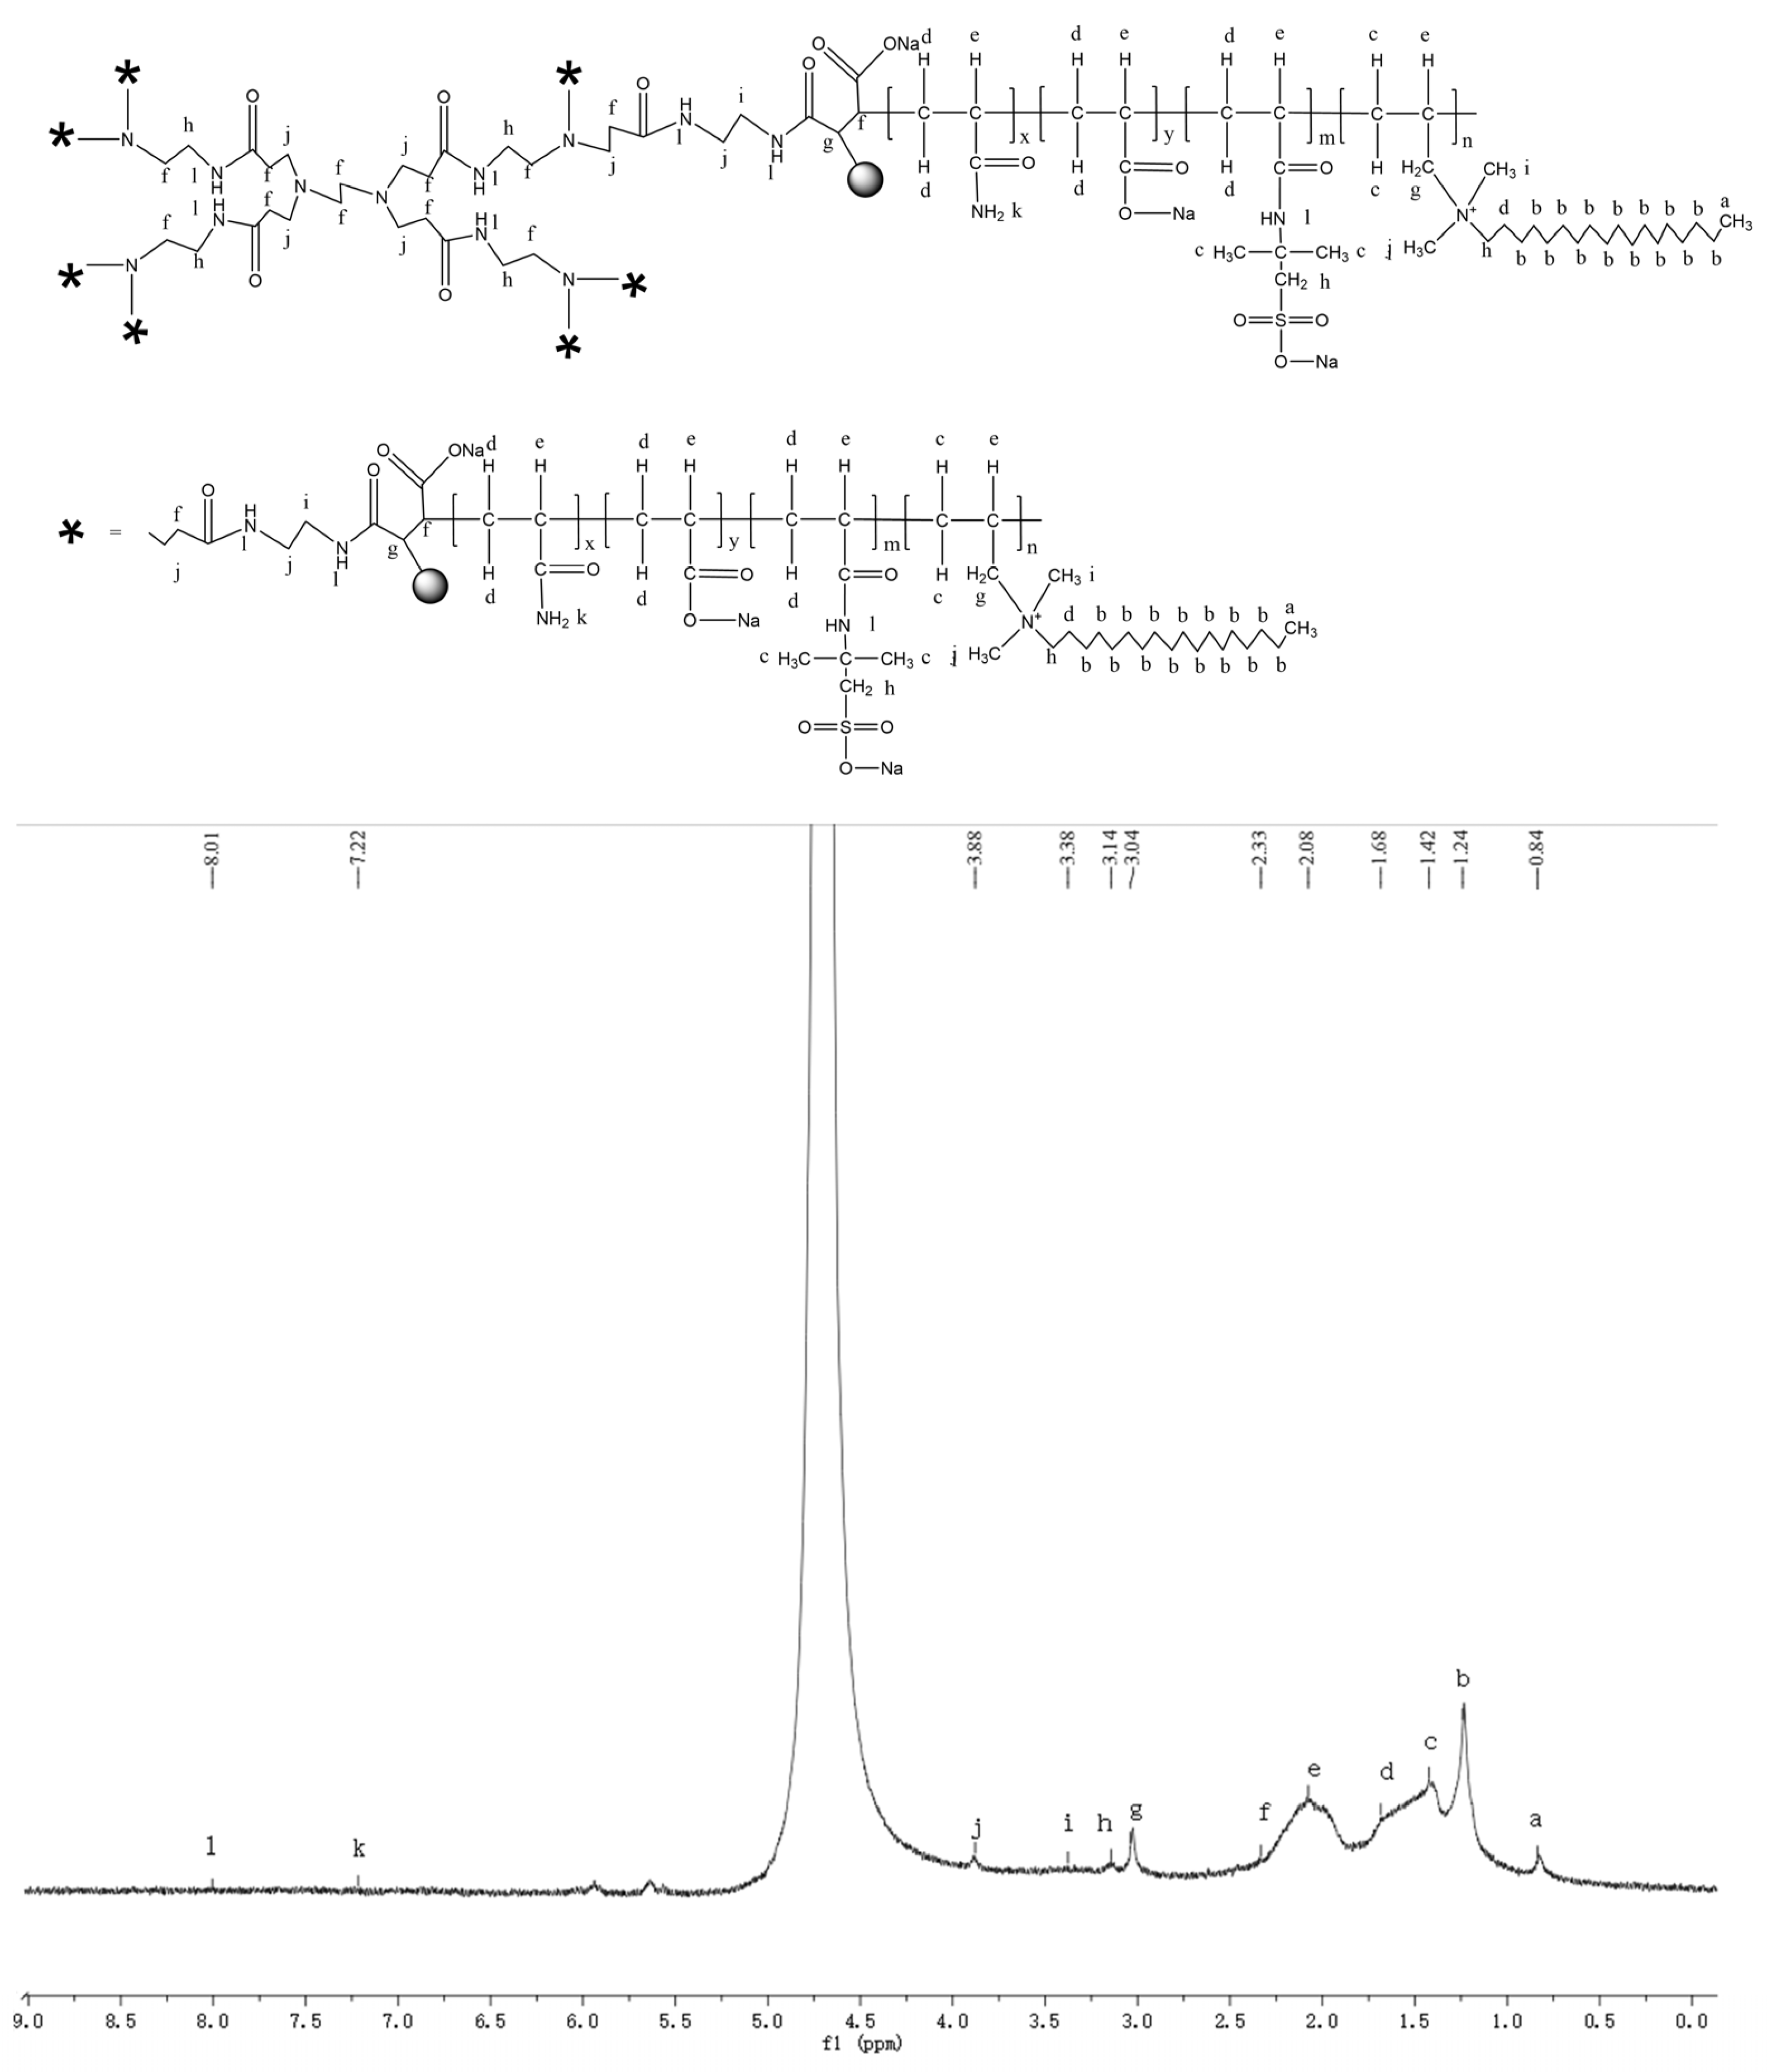
3.2. H-NMR Spectrum of HAPAM

The 1H-NMR spectrum of HAPAM is illustrated in Figure 3, and all the peaks have been labeled from a to l, and the positions in the HAPAM structure were indicated accordingly. Peak a (δ0.84) and peak b (δ1.24) resulted from the proton absorption peaks of -CH3 and -(CH2)- in the group of -N+-CH2-CH2-(CH2)15CH3 in the hydrophobic branched chain of DMCAAC-18 [62]. Peak c (δ1.42) was caused by the proton absorption peak of Materials 17 01619 i001 in the hydrophobic branched chain of DMCAAC-18 and by the proton absorption peak of -CH3 in the AMPS chain. Peak d (δ1.68) belonged to the proton absorption peak of Materials 17 01619 i002 [63], Materials 17 01619 i003, Materials 17 01619 i004, and -CH2-CH2-(CH2)15CH3 in the chain of AA, AM, AMPS, and hydrophobic branched chain of DMCAAC-18. Peak e (δ2.08) was assigned to the proton absorption peak of Materials 17 01619 i005, Materials 17 01619 i006, Materials 17 01619 i007, and Materials 17 01619 i008 in the branched chains. Peak f (δ2.33) was resulted from the proton absorption peak of Materials 17 01619 i009 [41], Materials 17 01619 i010, and Materials 17 01619 i011 in the branched chain-skeleton and the proton absorption peak of Materials 17 01619 i012 and Materials 17 01619 i013 at the branched chain. Peak g (δ3.04) was the proton absorption peak of Materials 17 01619 i014 at the branched chain and the proton absorption peak of Materials 17 01619 i015 at the hydrophobic branched chain of the DMCAAC-18 chain. The proton absorption peak of Materials 17 01619 i016 at the branched chain skeleton, the proton absorption peak of -CH2-CH2-(CH2)15CH3 in DMCAAC-18 chain, and the proton absorption peak of -CH2SO3Na in the AMPS chain resulted in Peak h (δ3.14). The proton absorption peak of Materials 17 01619 i017 at the branched chain and the proton absorption peak of Materials 17 01619 i018 in the DMCAAC-18 chain resulted in Peak i (δ3.38). Peak j (δ3.88) belonged to the proton absorption peak of Materials 17 01619 i019 and Materials 17 01619 i020 in the branched-chain and the proton absorption peak of Materials 17 01619 i021 in the branched chain-skeleton. Peak k (δ7.22) was the proton absorption peak of Materials 17 01619 i022 [63] in the branched chain. Peak l (δ8.01) was caused by the proton absorption peak of -CO-NH- at the branched chain and at the branched chain skeleton. The peaks corresponded to the expected chemical structure and functional group of HAPAM, demonstrating the successful synthesis of HAPAM.
The microstructure of PAM solution and HAPAM solution was observed by VEGA-3SBU scanning electron microscope. The SEM observations (magnifying 1000× and 5000×) of HAPAM and PAM are shown in Figure 4. From the micro-scale structures visible in SEM, it can be found that the entanglement degree of complexes formed by the aggregation of many HAPAM polymers was significantly higher than that of PAM due to drying. In other words, compared to PAM, this phenomenon indicated that HAPAM had much denser networks, which was conducive to enhancing the rigidity and strength of molecular chains and molecular volume [64] and improving its shear resistance and sweep efficiency [65].

3.3. Determination of Intrinsic Viscosity and Molecular Weight

The molecular weight of a polymer can be measured from its intrinsic viscosity by a Ubbelohde viscometer at room temperature, which can be used to estimate the size of the polymer to better understand its hydrodynamic behavior. From the analysis of the structure of the synthesized hyperbranched HAPAM, it has similar branches to PAM. However, the linear and long molecular chains of HAPAM were distributed to the individual branches, reducing the fluid mechanical volume of the molecule. Thus, it can be theoretically estimated that the fluid mechanical volume of HAPAM was smaller than that of PAM. Additionally, 1 mol/L of NaCl was prepared with deionized water as the standard solution. 10 mL and 1 mol/L of NaCl solution was transferred into the Ubbelohde viscometer. The side vent tube was sealed, then the solution was gently sucked into the timing tube until the liquid reached about 5 mm above the upper timing mark. Then, loosen the side vent tube to allow the liquid to fall freely and measure the flow time. To measure the flow time, start the stopwatch when the meniscus drops below this upper timing mark, measuring the time for the meniscus to pass from the upper timing to the bottom timing mark (stop the stopwatch when the meniscus drops below the bottom timing mark). The average value of the three tests was taken as the flow time of the standard solution (10 mL and 1 mol/L of NaCl solution). Similarly, 10 mL of 500 mg/L polymer solutions (prepared with 1 mol/L of NaCl solution) was used to determine the flow time, as shown in Table 3. For a given capillary viscometry, it provides only a relative measure of the viscosity and not an absolute one, as shown in Equation (4). The intrinsic viscosity of the polymer can be obtained by extrapolating the plot of lnηr/C vs. C to C = 0, as given in Equation (5). According to the general form of the Mark-Houwink relation, the Viscosity-average molecular weight of the polymer can be obtained in units g/mol by Equation (5).
η r = η η 0 = t t 0
[ η ] = lim C 0 ( 1 C η η 0 ) = K M α
η r : relative viscosity, dimensionless; η (cm2 s−1) and t (s): viscosity and flow time of the polymer solution; η 0 (cm2 s−1) and t 0 (s): viscosity and flow time of NaCl standard solution; [η]: intrinsic viscosity, (cm3/g); C: concentration of polymer solution, (g/cm3); K: a constant of the Ubbelohde viscometer, (cm3 mol−1); M: the Viscosity-average molecular weight of polymer (g/mol); α : a dimensionless constant, (0.5 < a < 0.8).
Table 3. Flow time measured by Ubbelohde viscometer.
Mass Concentrations1st (s)2nd (s)3rd (s)taverage (s)
1 mol/L of NaCl112.9112.6112.7112.7
500 mg/L of PAM + 1 mol/L of NaCl167.2167.3167.5167.3
500 mg/L of HAPAM + 1 mol/L of NaCl143.5143.8143.6143.6
According to experimental data and calculation, the intrinsic viscosity of PAM and HAPAM was 844 cm3/g and 500 cm3/g, respectively. Meanwhile, the Viscosity-average molecular weight of PAM and HAPAM was 3.96 × 10⁶ g/mol and 1.79 × 10⁶ g/mol, respectively. It is clear that the intrinsic viscosity and molecular weight of HAPAM were smaller than those of PAM. Due to the dendritic structure, the molecular chains of HAPAM were distributed over more branches, resulting in a smaller hydrodynamic volume per unit of polymer molecule in solution smaller than that of PAM. The smaller hydrodynamic volume possibly contributed to HAPAM having a stronger shear resistance at high speeds through small pores.

3.4. Thickening Capacity of HAPAM

The comparative thickening performance of HAPAM and PAM solutions with different concentrations is shown in Figure 5. It can be found that the overall trend of the apparent viscosity for both HAPAM and PAM solutions was increased with increasing mass concentrations. A noticeable thickening capacity behavior was observed for HAPAM. Specifically, after the mass concentration reached 1500 mg/L, the apparent viscosity of HAPAM was significantly increased with the mass concentration, and the apparent viscosity of HAPAM solution reached 590.86 mPa·s at the 2500 mg/L, which was about six times higher than that of PAM. The excellent thickening ability of HAPAM was caused by the fact that HAPAM has a spatial three-dimensional network structure and hydrophobic groups, which can be confirmed by SEM observations (Figure 4), 1H-NMR (Figure 3), and IR spectrum (Figure 2). When the concentration of hydrophobic groups exceeded a specific concentration (critical association concentration) [66,67], the association of the main chains for HAPAM was gradually converted from intramolecular association to intermolecular association, resulting in a significant increase in the thickening capacity of HAPAM solution.

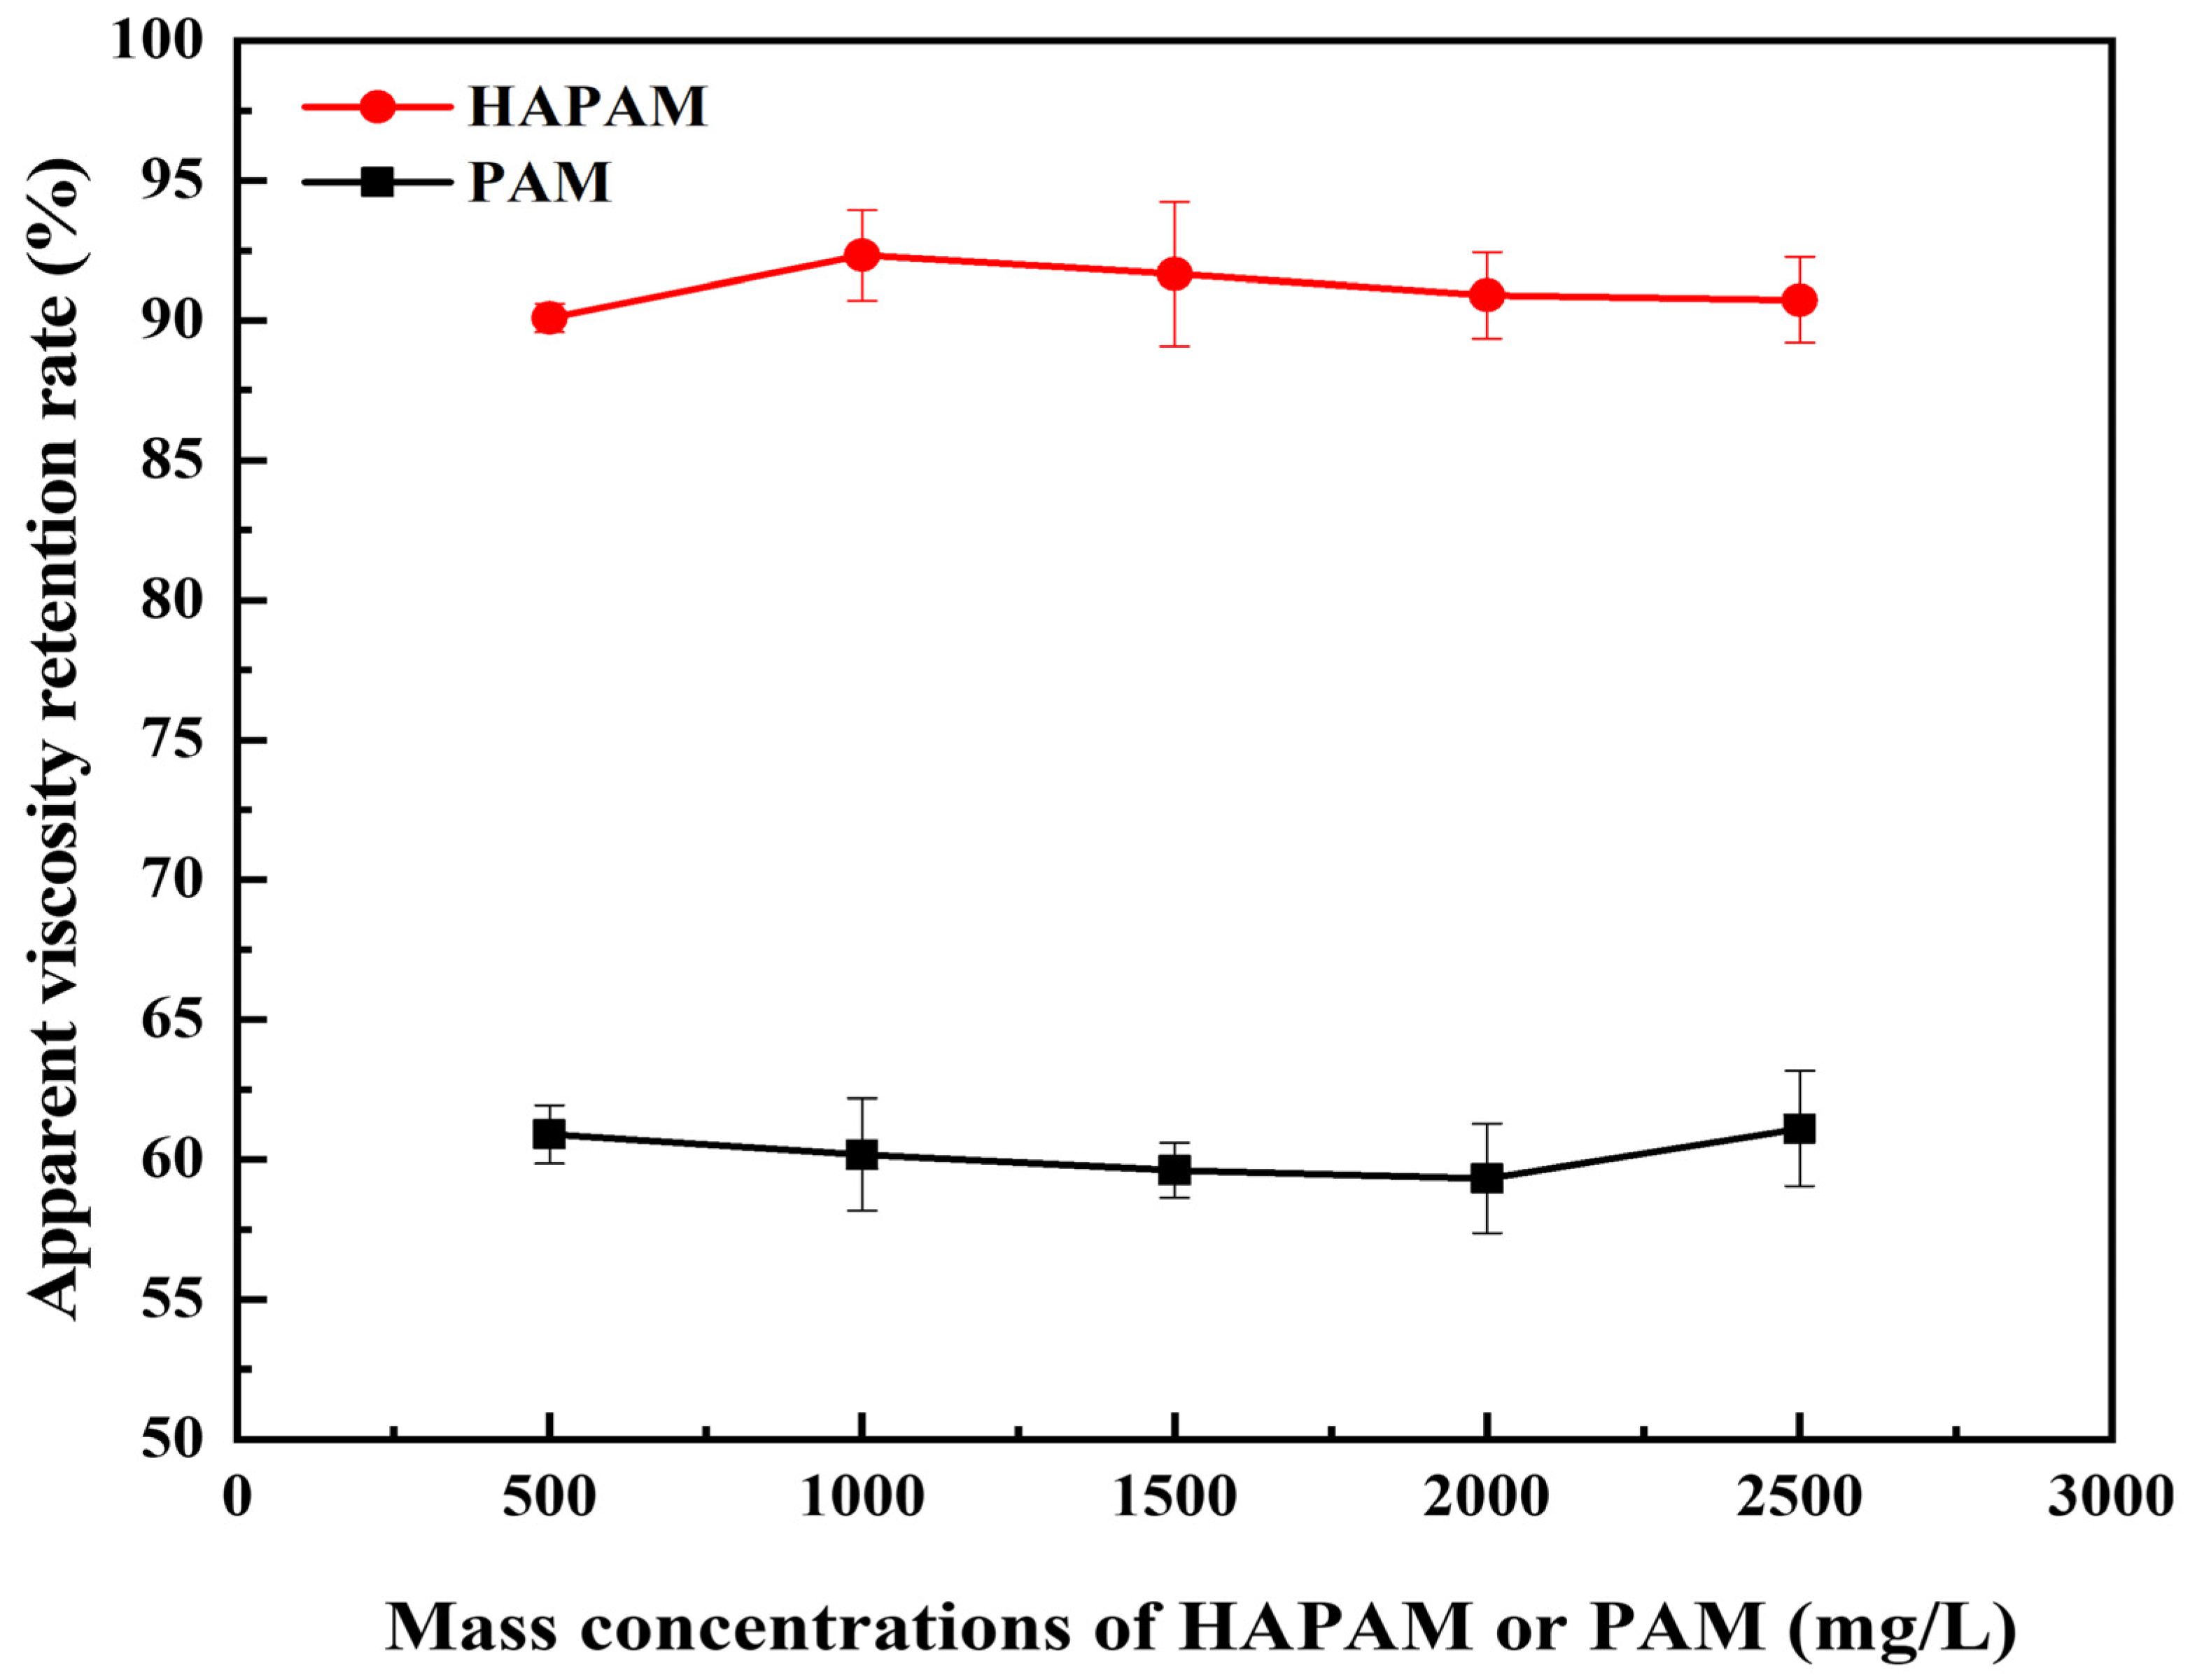
3.5. Shear-Resistance of HAPAM

HAPAM and PAM solutions prepared with mass concentrations of 500 mg/L, 1000 mg/L, 1500 mg/L, 2000 mg/L, and 2500 mg/L were sheared for 30 s using an XF crusher (Guangdong Xinfei Fashion Co., Shenzhen, China) at 20,000 r/min. After removing bubbles, the apparent viscosity of HAPAM and PAM solutions was measured before and after shearing at 65 °C. The shear-resistance and viscosity-retention of HAPAM and PAM solutions are shown in Figure 6 and Figure 7, respectively. After 30 s shearing under the same experimental condition, the viscosity retention rate of PAM was about 60%, while HAPAM had a higher shear resistance with a viscosity retention rate of over 90%. The higher shear resistance of HAPAM may result from the highly entangled spatial three-dimensional network structure of HAPAM (as shown in Figure 4), which was greatly conducive to viscosity recovery and high viscosity retention rate.

3.6. Temperature-Resistance of HAPAM

2000 mg/L of HAPAM and PAM solutions were stabilized at different temperatures for 24 h, and their apparent viscosity was measured, as shown in Figure 8. Clearly, it can be obtained that the apparent viscosity of both HAPAM and PAM solutions decreased with the increase of the temperature. Significantly, the apparent viscosity of both HAPAM and PAM solutions decreased slowly before 35 °C but rapidly decreased after 35 °C. Especially the apparent viscosity of the HAPAM solution was about 100 mPa·s at 65 °C, which was about 10 times higher than that of the PAM solution (12 mPa·s). This may be illustrated by the fact that the winding degree of HAPAM molecular chains was weakened by the enhancement of temperature. Since the mutual entanglement between macromolecular chains was caused by the Browne motion of molecules. With the increase in temperature, the thermal motion of hydrophobic chains and water molecules was intensified, which damaged the entanglement between molecular chains to a certain extent, which was not conducive to hydrophobic association and thus reduced the viscosity. At low temperatures, the destructive effect of thermal motion was not obvious. After reaching a certain temperature, the damage of thermal motion rapidly weakened the winding degree of molecular chains. Thus, the viscosity decreased significantly. Comparatively, HAPAM displayed better temperature-resistance. The viscosity retention rate of HAPAM (59.1%) at 65 °C was higher than that of PAM (48.9%), which can enable us to demonstrate the temperature-resistance of HAPAM was better than that of PAM [68].

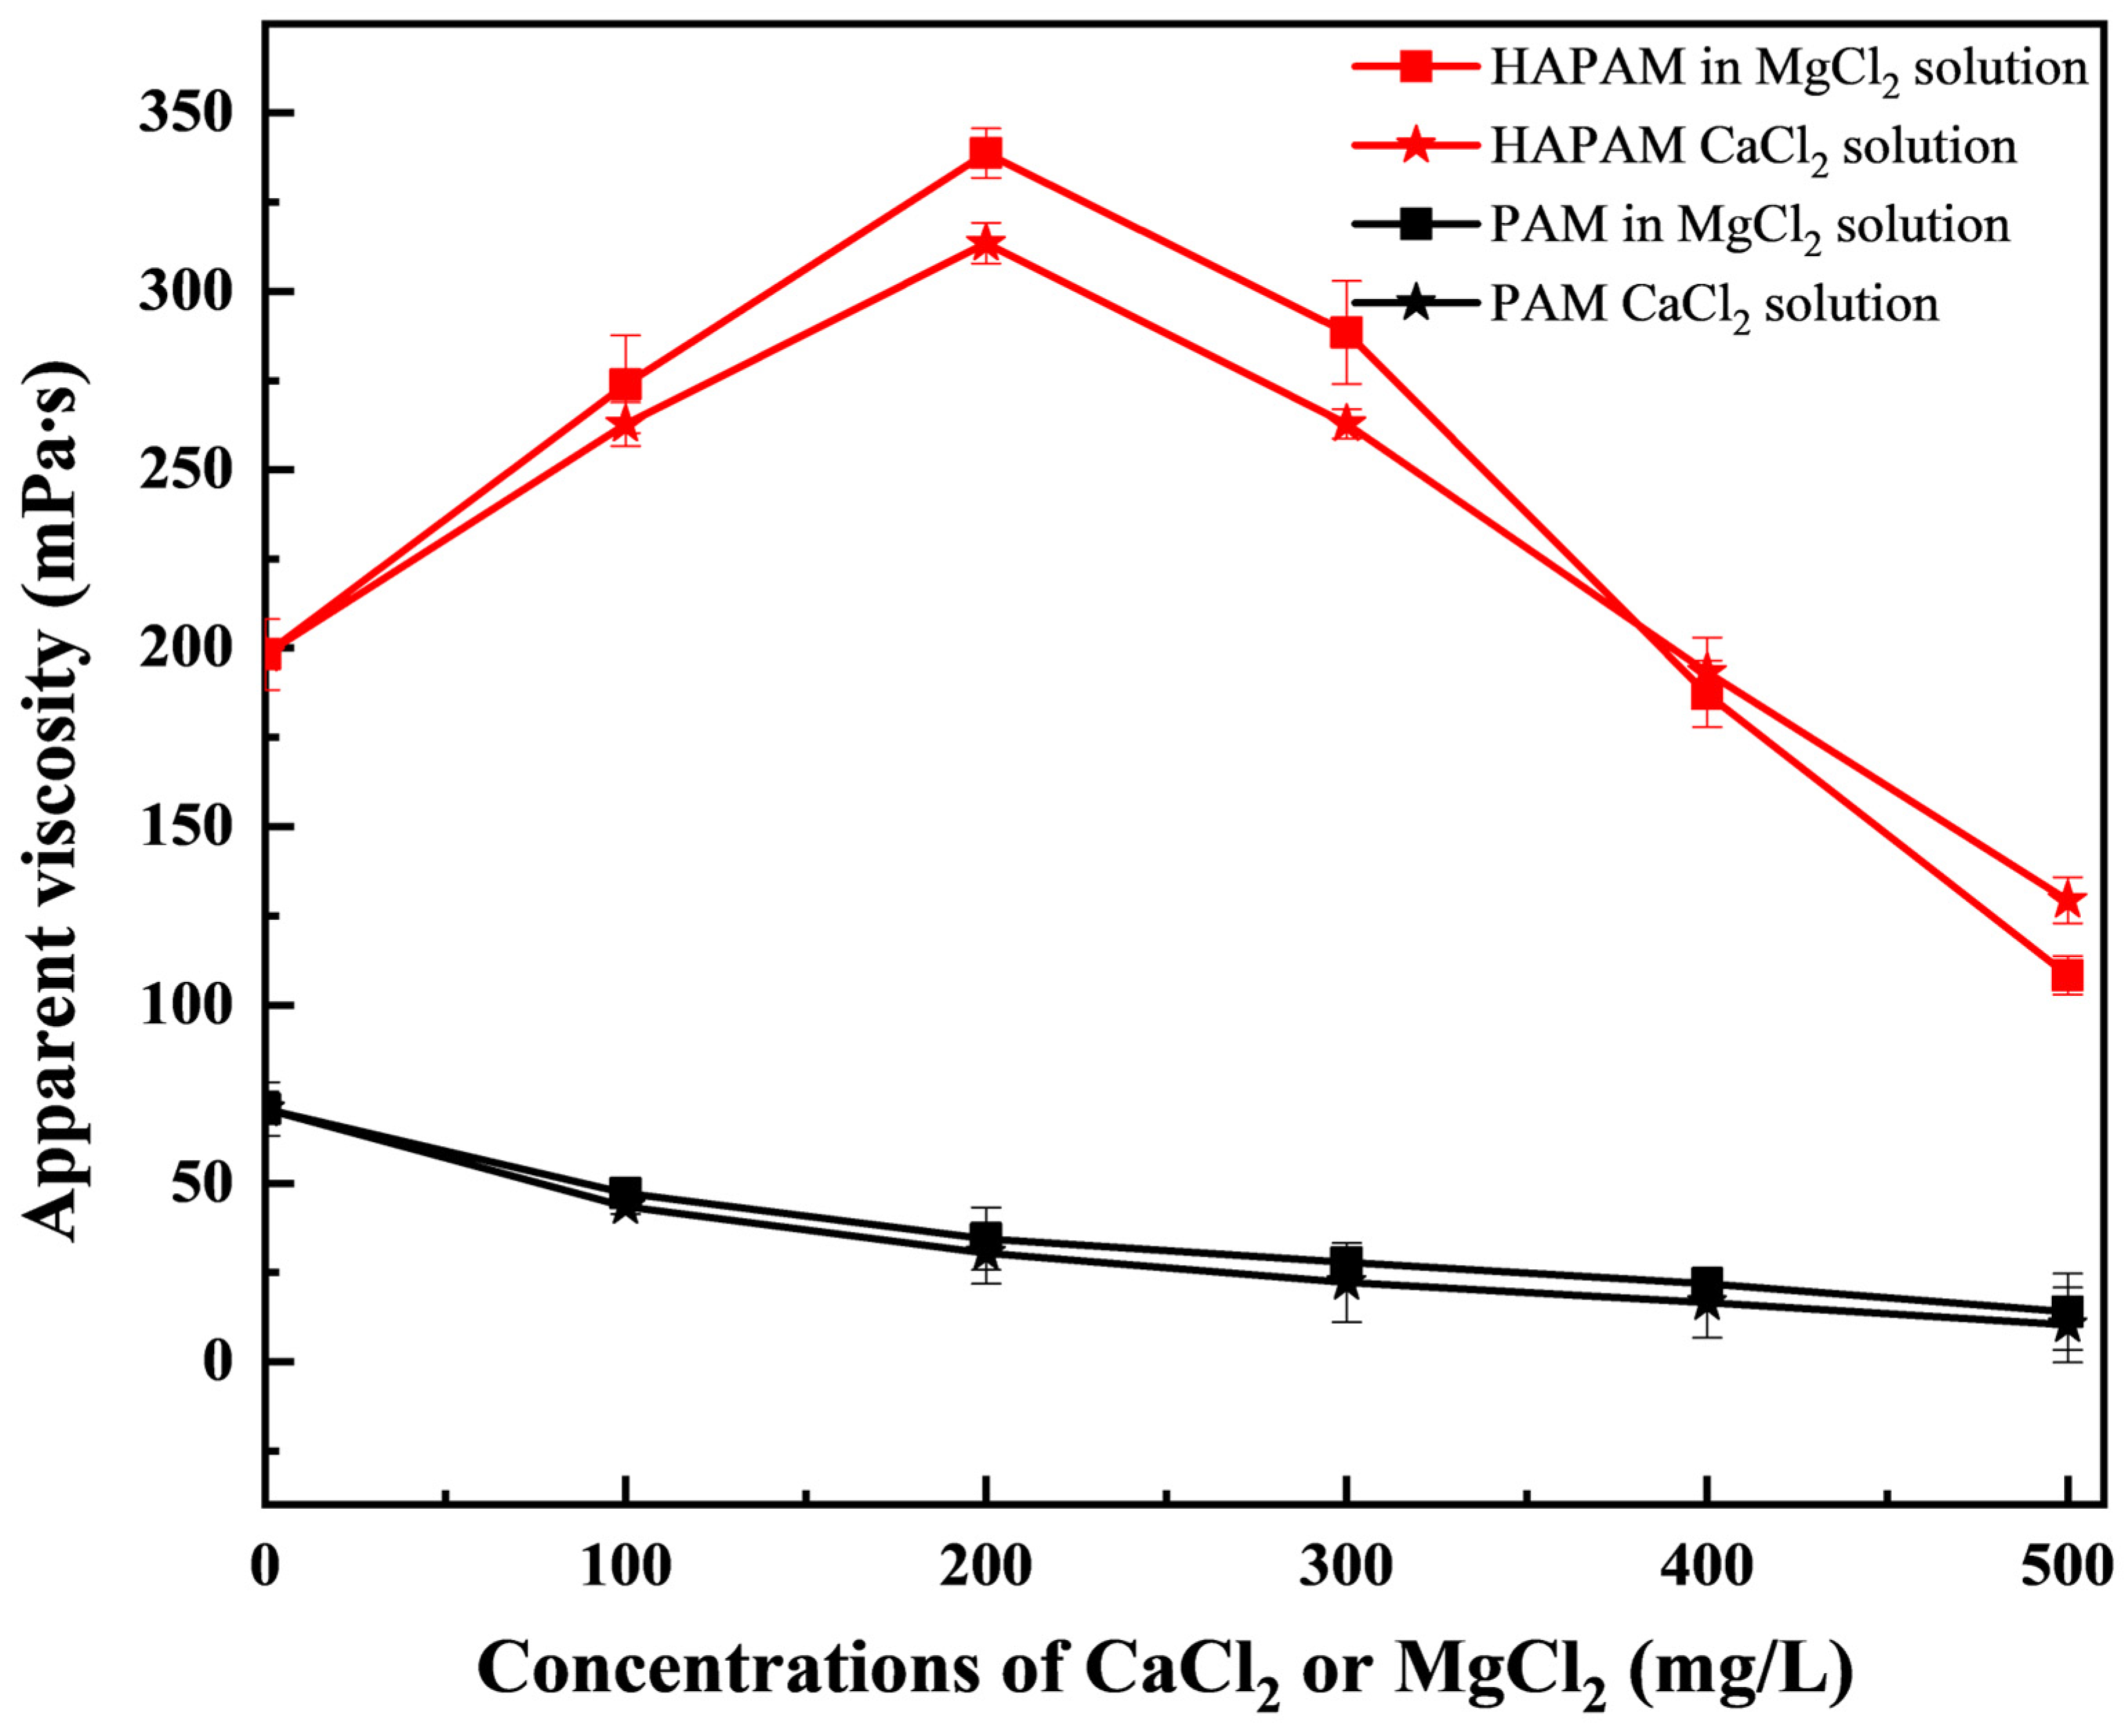
3.7. Salt-Resistance of HAPAM

2000 mg/L of HAPAM and PAM solutions were added with different kinds of salts (NaCl, CaCl2, and MgCl2) to investigate the salt resistance. Then, HAPAM and PAM solutions were stabilized at 65 °C for 30 min, and their apparent viscosity was measured. The comparative performance of salt resistance for HAPAM and PAM solutions is shown in Figure 9, respectively. Clearly, the apparent viscosity of PAM was rapidly decreased with the increase of salinity, and then it was kept at a low value. PAM was sensitive to salt, which was attributed to the fact that the presence of cations in the salt-containing solution played a shielding effect on the electricity of carboxylic acid groups generated from the hydrolysis of amide groups, weakening the electrostatic repulsion, resulting in the change of molecular chain from an extended state to a curled state. Therefore, the decrease of the hydrodynamic volume occupied in the space and the corresponding decrease in apparent viscosity of the PAM solution was observed [69]. However, at low salinity of HAPAM solution (CCaCl2 ≤ 200 mg/L and CMgCl2 ≤ 200 mg/L), the apparent viscosity of HAPAM solution gradually increased with the increase of the salinity, obtaining the maximum of 313.49 mPa·s (in CaCl2 solution) and 338.69 mPa·s (in MaCl2 solution), respectively. In the HAPAM solution, when added with salt, the association between molecular groups and molecular chains was shielded by ions, resulting in the enhancement of the interaction between solvent molecules. Hence, the molecular chains of HAPAM became stretched, which was favorable to the formation of hydrophobic micropores [70]. Therefore, the apparent viscosity did not decrease with the increase in the concentration of added salt but rather increased with the increase in the concentration of added salt. Meanwhile, at the high salinity of HAPAM solution (CCaCl2 > 200 mg/L and CMgCl2 > 200 mg/L), the apparent viscosity of HAPAM solution slowly decreased with the increase of the salinity degree. Clearly, compared with PAM, HAPAM exhibited better salt-tolerance-ability and long-term stability.

3.8. Interfacial Tension of HAPAM

HAPAM and PAM solutions (with mass concentrations of 500 mg/L, 750 mg/L, and 1000 mg/L) were prepared for measuring interfacial tension. The interfacial tensions were measured at the interface between crude oil and PAM or HAPAM solutions at 25 °C. As shown in Table 4, the interfacial tension for PAM or HAPAM solutions gradually decreased with the increase of its mass concentration. The decreased trend of interfacial tension of the oil|HAPAM interface was mainly ascribed to the directional distribution of the hydrophilic and lipophilic groups in the oil-polymer interface layer. As the n concentration of HAPAM increased, the number of hydrophilic and lipophilic groups arranged on the interface layer increased, resulting in the greater ability to reduce the interfacial tension. Significantly, HAPAM exhibited a stronger ability to reduce the interfacial tension of the oil|HAPAM interface than that of PAM solution under the same experimental condition. Moreover, the amphiphilic property of HAPAM not only enables crude oil to be stripped from the surface of the porous medium but also effectively avoids chromatographic separation with excellent injectability and flow-controlling ability [71].

3.9. Resistance-Coefficient and Residual-Resistance-Coefficient of HAPAM

The resistance-coefficient (RF) and residual-resistance-coefficient (RFF) of PAM and HAPAM solutions (2000 mg/L) are shown in Table 4, respectively. RF and RFF were two important technical indicators for evaluating and understanding the oil-displacement mechanism of the polymers [72,73], which were also important indicators for indoor screening and evaluation of polymers. RF was used to describe the increase in water viscosity and retention due to the presence of polymer in the porous media. Moreover, for a low RF value, it implied that the polymer can be easily injected in the field without pressure increase concerns. Additionally, RFF was an indicator of the ability of polymer solution to reduce the permeability of pore media. The higher the RFF value, the more significant the adsorption and retention phenomenon of the polymer in porous media, which indicated the more helpful for improving the oil-displacing ability of the polymer. As given in Table 5, it can be obtained that the RF and RFF of PAM solutions (2000 mg/L) were 11.22 and 1.45, respectively. Similarly, the RF and RFF of HAPAM solutions were 16.77 and 2.80, respectively. Obviously, the RF and RFF of the HAPAM solution were higher than those of the PAM solution, so HAPAM should be superior to PAM in improving swept volume and building percolating resistance. The strong percolating resistance to the porous medium was readily facilitated by the high resistance coefficient of the HAPAM solution, allowing them to spread into more pores. Also, the permeability of the porous medium was greatly affected by the high residual resistance coefficient of the HAPAM solution, which can expand the coverage range of subsequent water flooding.

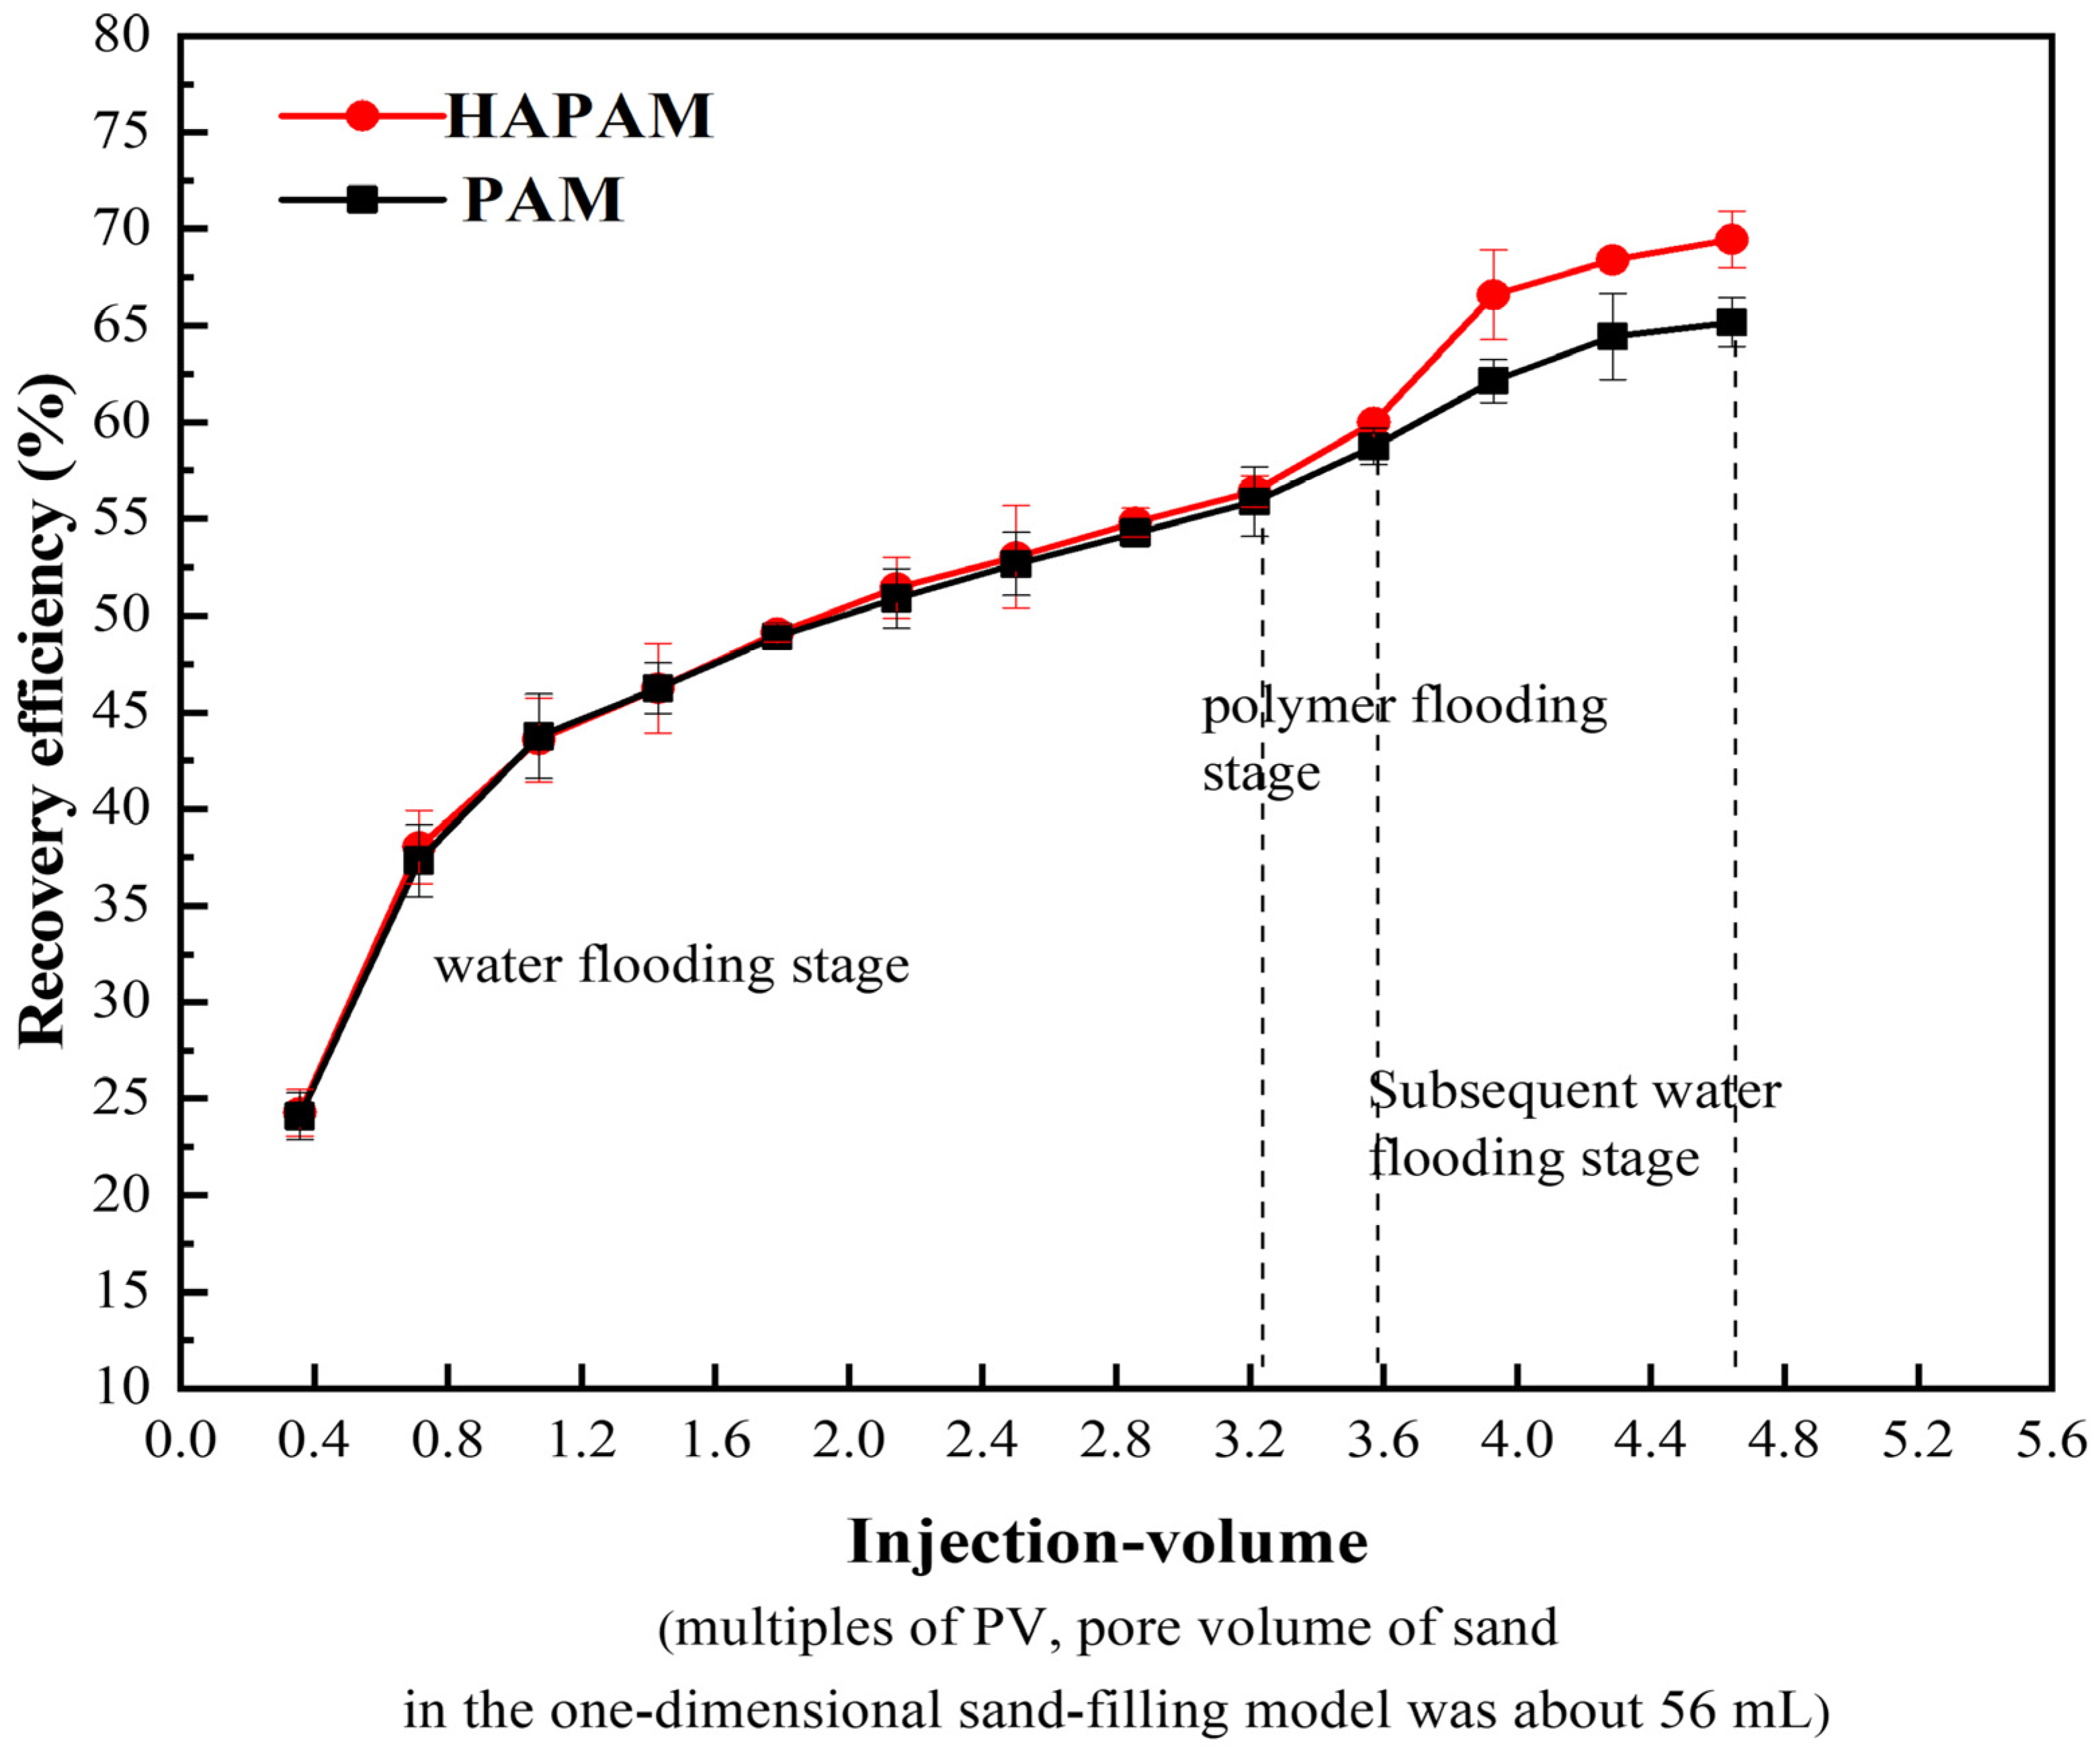
3.10. EOR of HAPAM Solutions

The oil-displacing performance of PAM and HAPAM solutions (2000 mg/L) is given in Figure 10. As the permeability of the sand pack core holder was approximately 0.293 μm2, following water cut to 95% for water flooding, the recovery efficiency increased with the increase of injection volume (PV) of the injected water. The recovery efficiency was about 56.43% at 3.2PV. During 3.2–3.6PV, using HAPAM solution at the same injection rate, the recovery efficiency was 60.00%, with an increase of 3.57%. The subsequent water flooding could further increase the oil recovery, reaching 69.46%, with an increase of 3.57%. Overall, the enhanced oil recovery (EOR) of PAM and HAPAM solutions was 9.29% and 13.03%, respectively. Obviously, HAPAM exhibited a stronger oil recovery ability than that of PAM. The higher EOR of HAPAM solution can be assigned to the improved sweep efficiency and sweep volume by the excellent thickening performance, shear-resistance, and hydrophobic association of HAPAM solution. In addition, HAPAM had surface activity to reduce the interfacial tension at the interface between the crude oil and HAPAM solution, which was also beneficial for improving oil washing efficiency.

4. Conclusions

In this study, a novel hyperbranched polymer with polyacrylamide side chains, HAPAM, was successfully synthesized by polymerization of AA, AM, AMPS, DMAAC-18, and M2.0 in aqueous solution at 40 °C and pH = 7 for 4 h, using (NH4)2S2O8-NaHSO3 as initiator. The properties of HAPAM solution were superior to those of PAM solution, regarding thickening ability, shear-resistance, temperature-resistance, salt-resistance, the ability to reduce the interfacial tension between polymer solution and crude oil, and oil-displacement-efficiency. The excellent performance of HAPAM demonstrated the effectiveness and possibility of introducing hydrophobic groups (dimethyl octadecyl ammonium chloride, DMCAAC-18) and hydrophilic groups (AA, AM, and AMPS, abbreviated from 2-acrylamido-2-methyl-1-propanesulfonic acid) into the polymer chain to simultaneously enhance the shear-resistance and avoid the phenomenon of chromatographic separation. In addition, the successful synthesis of HAPAM and this novel synthetic scheme are important inspirations for the development of new high-performance oil-displacing agents.

Author Contributions

Methodology, X.Q.; Validation, Q.W. and X.Y.; Investigation, P.T.; Data curation, Q.W., H.Y., C.L., X.Y. and T.P.; Writing—original draft, Q.W.; Writing—review and editing, X.Q. and P.T.; Supervision, X.Q., C.L. and H.Y. All authors have read and agreed to the published version of the manuscript.

Funding

This work was supported by the Sichuan Key Technologies Research and Development Program (2023YFG0209) of Sichuan Provincial Department of Science and Technology, the Talent Introduction Project (2023R C21) of Sichuan University of Science and Engineering and the Open Project Program of Tianjin Key Laboratory of Brine Chemical Engineering and Resource Eco-utilization (No. BCERE202203).

Institutional Review Board Statement

Not applicable.

Informed Consent Statement

Not applicable.

Data Availability Statement

Data are contained within the article.

Acknowledgments

The authors would like to thank the Analytical Testing Center of Sichuan University of Science and Engineering for their assistance in the characterization of polymers.

Conflicts of Interest

Authors Hui Yang, Xiaoliang Yang and Tong Peng were employed by the company Jidong Oilfield Branch Company, PetroChina Company Limited. The remaining authors declare that the research was conducted in the absence of any commercial or financial relationships that could be construed as a potential conflict of interest.

References

  1. Shuker, M.T.; Buriro, M.A.; Hamza, M.M. Enhanced oil recovery: A future for Pakistan. In Proceedings of the SPE/PAPG Annual Technical Conference, Islamabad, Pakistan, 3–5 December 2012; OnePetro: Richardson, TX, USA, 2012. [Google Scholar]
  2. Gbadamosi, A.O.; Kiwalabye, J.; Junin, R.; Augustine, A. A review of gas enhanced oil recovery schemes used in the North Sea. J. Pet. Explor. Prod. Technol. 2018, 8, 1373–1387. [Google Scholar] [CrossRef]
  3. Gbadamosi, A.; Patil, S.; Kamal, M.S.; Adewunmi, A.A.; Yusuff, A.S.; Agi, A.; Oseh, J. Application of polymers for chemical enhanced oil recovery: A review. Polymers 2022, 14, 1433. [Google Scholar] [CrossRef] [PubMed]
  4. Agi, A.; Junin, R.; Jaafar, M.Z.; Sidek, M.A.; Yakasai, F.; Gbadamosi, A.; Oseh, J. Laboratory evaluation to field application of ultrasound: A state-of-the-art review on the effect of ultrasonication on enhanced oil recovery mechanisms. J. Ind. Eng. Chem. 2022, 110, 100–119. [Google Scholar] [CrossRef]
  5. Malozyomov, B.V.; Martyushev, N.V.; Kukartsev, V.V.; Tynchenko, V.S.; Bukhtoyarov, V.V.; Wu, X.; Tyncheko, Y.A.; Kukartsev, V.A. Overview of methods for enhanced oil recovery from conventional and unconventional reservoirs. Energies 2023, 16, 4907. [Google Scholar] [CrossRef]
  6. Sikiru, S.; Soleimani, H.; Yusuf, J.Y.; Hassan, Y.M.; Hamza, M.F.; Singh, R. Recent advance and prospect of enhanced oil recovery mech-anisms in reservoir sandstone. Preprints 2023, 2023091654. [Google Scholar]
  7. Tahir, M.U.; Zhou, H.; Memon, B.S.; Liu, W.D.; Memon, A.; Khan, D.; Bakhsh, A. Comparative studies of enhancing oil recovery optimization for optimum oil field development. Model. Earth Syst. Environ. 2023, 9, 1477–1503. [Google Scholar] [CrossRef]
  8. Gbadamosi, A.; Patil, S.; Al Shehri, D.; Kamal, M.S.; Hussain, S.S.; Al-Shalabi, E.W.; Hassan, A.M. Recent advances on the application of low salinity waterflooding and chemical enhanced oil recovery. Energy Rep. 2022, 8, 9969–9996. [Google Scholar] [CrossRef]
  9. Jain, S.; Pachisia, H.; Sharma, A.; Patel, S.; Patel, S.; Ragunathan, B. A systematic review—Chemical EOR using surfactants and polymers. Mater. Today Proc. 2022, 62, 7220–7223. [Google Scholar] [CrossRef]
  10. Mokheimer, E.M.; Hamdy, M.; Abubakar, Z.; Shakeel, M.R.; Habib, M.A.; Mahmoud, M. A comprehensive review of thermal enhanced oil recovery: Techniques evaluation. J. Energy Resour. Technol. 2019, 141, 030801. [Google Scholar] [CrossRef]
  11. Hazarika, K. Chapter-8 classification of EOR technologies. In Oil Recovery Principles & Practices; CIIR Scientific Publications: Taipei, Taiwan, 2023; Volume 21. [Google Scholar]
  12. Gray, L.; Goodyear, S. Overcoming the CO2 supply challenge for CO2 EOR. In Proceedings of the Abu Dhabi International Petroleum Exhibition and Conference, Abu Dhabi, United Arab Emirates, 10–13 November 2014; SPE: Kuala Lumpur, Malaysia, 2014; p. D021S032R005. [Google Scholar]
  13. Núñez-López, V.; Moskal, E. Potential of CO2-EOR for near-term decarbonization. Front. Clim. 2019, 1, 5. [Google Scholar] [CrossRef]
  14. Khan, A.; Saxena, S.; Baloni, S.; Sharma, M.; Kodavaty, J. Overview and methods in enhanced oil recovery. J. Phys. Conf. Ser. 2021, 2070, 012061. [Google Scholar]
  15. Abbas, A.H.; Sulaiman, W.R.W.; Jaafar, M.Z.; Gbadamosi, A.O.; Ebrahimi, S.S.; Elrufai, A. Numerical study for continuous surfactant flooding considering adsorption in heterogeneous reservoir. J. King Saud Univ. Eng. Sci. 2020, 32, 91–99. [Google Scholar] [CrossRef]
  16. Levitt, D.B.; Pope, G.A. Selection and screening of polymers for enhanced-oil recovery. In Proceedings of the SPE Improved Oil Recovery Conference, Tulsa, OK, USA, 20–23 April 2008; SPE: Kuala Lumpur, Malaysia, 2008; p. SPE–113845-MS. [Google Scholar]
  17. Pope, G.A. Recent developments and remaining challenges of enhanced oil recovery. J. Pet. Technol. 2011, 63, 65–68. [Google Scholar] [CrossRef]
  18. Ayirala, S.; Sofi, A.; Li, Z.; Xu, Z. Surfactant and surfactant-polymer effects on wettability and crude oil liberation in carbonates. J. Pet. Sci. Eng. 2021, 207, 109117. [Google Scholar] [CrossRef]
  19. Caili, D.; Qing, Y.; Fulin, Z.; Hanqiao, J. Residual polymer reutilization for IOR after polymer flooding: From laboratory to field application in daqing oilfield. Pet. Sci. Technol. 2011, 29, 2441–2449. [Google Scholar] [CrossRef]
  20. Viken, A.L.; Spildo, K.; Reichenbach-Klinke, R.; Djurhuus, K.; Skauge, T. Influence of weak hydrophobic interactions on in situ viscosity of a hydrophobically modified water-soluble polymer. Energy Fuels 2018, 32, 89–98. [Google Scholar] [CrossRef]
  21. Wang, S.; Shi, L.; Ye, Z.; Zhang, X.; Zhang, L.; Li, X. Experimental study on improving oil recovery in fluvial reservoir with polymer solutions. AIP Adv. 2021, 11, 055121. [Google Scholar] [CrossRef]
  22. Wang, X.; Liu, W.; Shi, L.; Liang, X.; Wang, X.; Zhang, Y.; Wu, X.; Gong, Y.; Shi, X.; Qin, G. Application of a novel amphiphilic polymer for enhanced offshore heavy oil recovery: Mechanistic study and core displacement test. J. Pet. Sci. Eng. 2022, 215, 110626. [Google Scholar] [CrossRef]
  23. Lei, T.; Wang, Y.; Zhang, H.; Cao, J.; Xiao, C.; Ding, M.; Chen, W.; Chen, M.; Zhang, Z. Preparation and performance evaluation of a branched functional polymer for heavy oil recovery. J. Mol. Liq. 2022, 363, 119808. [Google Scholar] [CrossRef]
  24. Yao, T.; Liu, Q.; Liu, W.; Liu, F. Structural images of partially hydrolyzed polyacrylamide. Acta Pet. Sin. 2005, 26, 81. [Google Scholar]
  25. Wenli, L.; Dong, H.; Li, W.; Qingxia, L.; Jian, F. Synthesis and property evaluation of a salt-and alkali-resistant star-polymer. Pet. Explor. Dev. 2010, 37, 477–482. [Google Scholar] [CrossRef]
  26. Pu, W.-F.; Liu, R.; Li, B.; Jin, F.-Y.; Peng, Q.; Sun, L.; Du, D.-J.; Yao, F.-S. Amphoteric hyperbranched polymers with multistimuli-responsive behavior in the application of polymer flooding. RSC Adv. 2015, 5, 88002–88013. [Google Scholar] [CrossRef]
  27. Lai, N.; Guo, X.; Zhou, N.; Xu, Q. Shear resistance properties of modified nano-SiO2/aa/am copolymer oil displacement agent. Energies 2016, 9, 1037. [Google Scholar] [CrossRef]
  28. Lai, N.; Zhang, Y.; Xu, Q.; Zhou, N.; Wang, H.; Ye, Z. A water-soluble hyperbranched copolymer based on a dendritic structure for low-to-moderate permeability reservoirs. RSC Adv. 2016, 6, 32586–32597. [Google Scholar] [CrossRef]
  29. Duan, M.; Fang, S.; Zhang, L.; Wang, F.; Zhang, P.; Zhang, J. Shear degradation resistance of star poly(ethyleneimine)-polyacrylamides during elongational flow. e-Polymers 2011, 11, 86–99. [Google Scholar] [CrossRef]
  30. Chen, Q.; Ye, Z.; Tang, L.; Wu, T.; Jiang, Q.; Lai, N. Synthesis and solution properties of a novel hyperbranched polymer based on chitosan for enhanced oil recovery. Polymers 2020, 12, 2130. [Google Scholar] [CrossRef]
  31. Dong, L.; Li, Y.; Wen, J.; Gao, W.; Tian, Y.; Deng, Q.; Liu, Z. Functional characteristics and dominant enhanced oil recovery mechanism of polymeric surfactant. J. Mol. Liq. 2022, 354, 118921. [Google Scholar] [CrossRef]
  32. Zhang, Q.; Mao, J.; Liao, Y.; Xu, T.; Zhang, H.; Du, A.; Yang, X.; Lin, C.; Mao, J. Evaluation of temperature resistance of non chemical crosslinked double-tailed hydrophobically associating polymer fracturing fluid. React. Funct. Polym. 2022, 175, 105268. [Google Scholar] [CrossRef]
  33. Zhi, J.; Liu, Y.; Chen, J.; Jiang, N.; Xu, D.; Bo, L.; Qu, G. Performance evaluation and oil displacement effect of amphiphilic polymer heavy oil activator. Molecules 2023, 28, 5257. [Google Scholar] [CrossRef]
  34. Zhu, Z.; Kang, W.; Sarsenbekuly, B.; Yang, H.; Dai, C.; Yang, R.; Fan, H. Preparation and solution performance for the amphiphilic polymers with different hydrophobic groups. J. Appl. Polym. Sci. 2017, 134. [Google Scholar] [CrossRef]
  35. Zhao, Y.; Ke, Y.; Hu, X.; Peng, F. Synthesis, characterization and emulsification properties of an amphiphilic copolymer for enhanced oil recovery. IOP Conf. Ser. Mater. Sci. Eng. 2019, 493, 012121. [Google Scholar] [CrossRef]
  36. Sui, Y.; Cao, G.; Guo, T.; Zhang, Z.; Zhang, Z.; Xiao, Z. Synthesis and mechanism study of temperature- and salt-resistant amphoteric polyacrylamide with MAPTAC and DTAB as monomers. Processes 2022, 10, 1666. [Google Scholar] [CrossRef]
  37. Qin, X.; Zhu, S.; Shi, Q.; Li, C. Synthesis and properties of a dendrimer amphiphilic polymer as enhanced oil recovery chemical. J. Chem. 2023, 2023, 4271446. [Google Scholar] [CrossRef]
  38. Shi, L.; Zhu, S.; Ye, Z.; Zhang, J.; Xue, X.; Zhao, W. The seepage flow characteristics of hydrophobically associated polymers with different aggregation behaviours in porous media. R. Soc. Open Sci. 2020, 7, 191270. [Google Scholar] [CrossRef]
  39. Quan, H.; Li, Z.; Huang, Z. Self-assembly properties of a temperature- and salt-tolerant amphoteric hydrophobically associating polyacrylamide. RSC Adv. 2016, 6, 49281–49288. [Google Scholar] [CrossRef]
  40. Shi, J.; Wu, Z.; Deng, Q.; Liu, L.; Zhang, X.; Wu, X.; Wang, Y. Synthesis of hydrophobically associating polymer: Temperature resistance and salt tolerance properties. Polym. Bull. 2022, 79, 4581–4591. [Google Scholar] [CrossRef]
  41. Lai, N.; Qin, X.; Ye, Z.; Peng, Q.; Zhang, Y.; Ming, Z. Synthesis and evaluation of a water-soluble hyperbranched polymer as enhanced oil recovery chemical. J. Chem. 2013, 2013, 824785. [Google Scholar] [CrossRef]
  42. Peng, H. Development and Performance Evaluation of a New Type of Low-Damage Fracturing Fluid. Master’s Thesis, Southwest Petroleum University, Chengdu, China, 2014. [Google Scholar]
  43. Izadi, M.; Mardani, H.; Roghani-Mamaqani, H.; Salami-Kalajahi, M.; Khezri, K. Hyperbranched poly (amidoamine)-grafted graphene oxide as a multifunctional curing agent for epoxy-terminated polyurethane composites. ChemistrySelect 2021, 6, 2692–2699. [Google Scholar] [CrossRef]
  44. Lin, S.-Y.; Chu, H.-L. Fourier transform infrared spectroscopy used to evidence the prevention of β-sheet formation of amyloid β (1–40) peptide by a short amyloid fragment. Int. J. Biol. Macromol. 2003, 32, 173–177. [Google Scholar] [CrossRef] [PubMed]
  45. Georges, R.; Freytes, M.; Hurtmans, D.; Kleiner, I.; Vander Auwera, J.; Herman, M. Jet-cooled and room temperature FTIR spectra of the dimer of formic acid in the gas phase. Chem. Phys. 2004, 305, 187–196. [Google Scholar] [CrossRef]
  46. Yamamoto, M.; Sakurai, Y.; Hosoi, Y.; Ishii, H.; Kajikawa, K.; Ouchi, Y.; Seki, K. Softened CH stretching vibration of a long-chain n-alkane, n-C44H90, physisorbed on a Ag (111) surface: An infrared reflection absorption spectroscopic study. J. Phys. Chem. B 2000, 104, 7370–7376. [Google Scholar] [CrossRef]
  47. Ahmad, H.; Hossain, M.E.; Rahman, M.A.; Rahman, M.M.; Miah, M.J.; Tauer, K. Carboxyl functionalized poly (methyl methacrylate-acrylic acid-ethylene glycol dimethacrylate) copolymer particles and their amination with amine-nucleophiles. e-Polymers 2008, 8, 96. [Google Scholar] [CrossRef]
  48. Yilmaz, M.K. Palladium (II) complexes with new bidentate phosphine-imine ligands for the Suzuki CC coupling reactions in supercritical carbon dioxide. J. Supercrit. Fluids 2018, 138, 221–227. [Google Scholar] [CrossRef]
  49. Lv, J.; Liu, S.; Feng, J.; Liu, Y.; Zhou, S.; Chen, R. Effective identification of paints pigments in hit-and-run cases with confocal Raman microscope. Pigment Resin Technol. 2016, 45, 294–300. [Google Scholar] [CrossRef]
  50. Shanmugasundaram, A.; Krishnamoorthy, S. A systematically evolved method for the effective use of essential oil blends for the structural maintenance of palm leaf manuscripts. J. Inst. Conserv. 2024, 47, 82–98. [Google Scholar] [CrossRef]
  51. Girma, W.; Diaz, I. Encapsulation of Co (II) complex with a schiff base ligands derived from 1, 10- phenantroline-5, 6-dione and o-phenylene diamine in zeolite y. Int. J. Basic Appl. Sci. 2015, 1, 35–41. [Google Scholar] [CrossRef]
  52. Podstawka, E.; Światłowska, M.; Borowiec, E.; Proniewicz, L.M. Food additives characterization by infrared, Raman, and surface-enhanced Raman spectroscopies. J. Raman Spectrosc. 2007, 38, 356–363. [Google Scholar] [CrossRef]
  53. Bahadur, A.; Shoaib, M.; Saeed, A.; Iqbal, S. FT-IR spectroscopic and thermal study of waterborne polyurethane-acrylate leather coatings using tartaric acid as an ionomer. e-Polymers 2016, 16, 463–474. [Google Scholar] [CrossRef]
  54. Chen, Y.; Li, Y.; Chen, W.; Xu, W.W.; Han, Z.-k.; Waheed, A.; Ye, Z.; Li, G.; Baiker, A. Continuous dimethyl carbonate synthesis from CO2 and methanol over BixCe1−xOδ monoliths: Effect of bismuth do** on population of oxygen vacancies, activity, and reaction pathway. Nano Res. 2022, 15, 1366–1374. [Google Scholar] [CrossRef]
  55. Fourneta, I.; Gall, E.A.; Deslandes, E.; Huvenne, J.-P.; Sombret, B.; Floc’h, J. In situ measurements of cell wall components in the red alga Solieria chordalis (Solieriaceae, Rhodophyta) by FTIR microspectrometry. Bot. Mar. 1997, 40, 45–48. [Google Scholar] [CrossRef]
  56. Paradkar, M.; Irudayaraj, J. A rapid FTIR spectroscopic method for estimation of caffeine in soft drinks and total methylxanthines in tea and coffee. J. Food Sci. 2002, 67, 2507–2511. [Google Scholar] [CrossRef]
  57. Ramis, G.; Larrubia, M.; Busca, G. On the chemistry of ammonia over oxide catalysts: Fourier transform infrared study of ammonia, hydrazine and hydroxylamine adsorption over iron–titania catalyst. Top. Catal. 2000, 11, 161–166. [Google Scholar] [CrossRef]
  58. Yahaya, N.P.; Ali, I.; Modu, K.A.; Adamu, S. Adsorption study of methylene blue onto power activated carbon prepared from ananas comosus peels. Nanochemistry Res. 2023, 8, 231–242. [Google Scholar]
  59. Huang, X.; Huang, D.; Ou, X.; Ding, F.; Chen, Z. Synthesis and properties of side-chain-type ion exchange membrane PEEK-g-StSO3Na for bipolar membranes. Appl. Surf. Sci. 2012, 258, 2312–2318. [Google Scholar] [CrossRef]
  60. Zhuang, J.; Li, M.; Pu, Y.; Ragauskas, A.J.; Yoo, C.G. Observation of potential contaminants in processed biomass using fourier transform infrared spectroscopy. Appl. Sci. 2020, 10, 4345. [Google Scholar] [CrossRef]
  61. Bahraeian, S.; Abron, K.; Pourjafarian, F.; Majid, R.A. Study on synthesis of polypyrrole via chemical polymerization method. Adv. Mater. Res. 2013, 795, 707–710. [Google Scholar] [CrossRef]
  62. Quan, H.; Lu, Q.; Chen, Z.; Huang, Z.; Jiang, Q. Adsorption–desorption behavior of the hydrophobically associating copolymer AM/APEG/C-18/SSS. RSC Adv. 2019, 9, 12300–12309. [Google Scholar] [CrossRef] [PubMed]
  63. Salih, N.A. Synthesis of new heterocyclic compounds derived from anthrone and evaluation of their biological activity. Synthesis 2008, 12, 13. [Google Scholar] [CrossRef]
  64. Sun, J.; Du, W.; Pu, X.; Zou, Z.; Zhu, B. Synthesis and evaluation of a novel hydrophobically associating polymer based on acrylamide for enhanced oil recovery. Chem. Pap. 2015, 69, 1598–1607. [Google Scholar] [CrossRef]
  65. Jadhawar, P.; Saeed, M. Low salinity water and polymer flooding in sandstone reservoirs: Upscaling from nano-to macro-scale using the maximum energy barrier. J. Pet. Sci. Eng. 2023, 220, 111247. [Google Scholar] [CrossRef]
  66. Ji, Y.; Wang, D.; Cao, X.; Guo, L.; Zhu, Y. Both-branch amphiphilic polymer oil displacing system: Molecular weight, surfactant interactions and enhanced oil recovery performance. Colloids Surf. A Physicochem. Eng. Asp. 2016, 509, 440–448. [Google Scholar] [CrossRef]
  67. González Coronel, V.J.; Jiménez-Regalado, E.J. Rheological properties of three different microstructures of water-soluble polymers prepared by solution polymerization. Polym. Bull. 2011, 67, 251–262. [Google Scholar] [CrossRef]
  68. Yang, H.; Zhang, H.; Zheng, W.; Li, X.; Wang, F.; Li, X.; Zhang, D.; Turtabayev, S.; Kang, W. Research on synthesis and salt thickening behavior of a binary copolymer amphiphilic polymer. J. Pet. Sci. Eng. 2021, 204, 108713. [Google Scholar] [CrossRef]
  69. Jin, Z.; Shan, G.; Pan, P. Preparation and heat and salt resistance of AM/AMPS/SSS terpolymer. CIESC J. 2023, 74, 916–923. [Google Scholar] [CrossRef]
  70. Wang, D.; Tan, J.; Han, Y.; Guo, Y.; An, H. Synthesis and properties of temperature-resistant and salt-tolerant tetra-acrylamide copolymer. J. Macromol. Sci. Part A 2019, 56, 1148–1155. [Google Scholar] [CrossRef]
  71. Liu, Z.; Cheng, H.; Li, Y.; Li, Y.; Chen, X.; Zhuang, Y. Experimental investigation of synergy of components in surfactant/polymer flooding using three-dimensional core model. Transp. Porous Media 2019, 126, 317–335. [Google Scholar] [CrossRef]
  72. Liang, K.; Han, P.; Chen, Q.; Su, X.; Feng, Y. Comparative study on enhancing oil recovery under high temperature and high salinity: Polysaccharides versus synthetic polymer. ACS Omega 2019, 4, 10620–10628. [Google Scholar] [CrossRef]
  73. Bhatkar, S.; Kshirsagar, L.; Wadgaonkar, V.; Dulakhe, P.; Jhamtani, V. Application of chemical eor in viscous, heavy crude in thin stacked heterogeneous reservoirs using CMG simulator. Pet. Coal 2022, 64, 1000. [Google Scholar]
Figure 1. Synthetic route and structure of HAPAM.
Materials 17 01619 g001
Figure 2. IR Spectrum of M0.5, M1.0, M1.5, M2.0, and HAPAM.
Materials 17 01619 g002
Figure 3. 1H-NMR Spectrum of HAPAM.
Materials 17 01619 g003
Figure 4. SEM observations of PAM ((a,b), magnifying ×1000 and ×5000) and HAPAM ((c,d), magnifying ×1000 and ×5000).
Materials 17 01619 g004
Figure 5. Thickening ability of HAPAM and PAM.
Materials 17 01619 g005
Figure 6. Shear-resistance of HAPAM and PAM.
Materials 17 01619 g006
Figure 7. Viscosity-retention of HAPAM and PAM.
Materials 17 01619 g007
Figure 8. Temperature-resistance of HAPAM and PAM.
Materials 17 01619 g008
Figure 9. The salt-resistance of HAPAM and PAM in CaCl2 and MgCl2 solutions.
Materials 17 01619 g009
Figure 10. Variation of crude oil recovery rate with injection-volume during displacement of HAPAM and PAM (2000 mg/L).
Materials 17 01619 g010
Table 1. Compositions of ions in the simulated injection water.
IonsNa+K+Ca2+Mg2+HCO3SO42−Cl
Concentrations (mg/L)66728201337968870
Table 2. Main peaks obtained from FTIR of M0.5, M1.0, M1.5, M2.0, and HAPAM.
No.1234567891011121314
Peaks (wavelength/cm−1) of M 0.5 3315 2951283717341662 14421361119911261043
Peaks (wavelength/cm−1) of M 1.0 329030782943284517271644156114731321119411201039
Peaks (wavelength/cm−1) of M 1.5 329530682946284417311652154914461360119411271044
Peaks (wavelength/cm−1) of M 2.0 328830742943284717291644155614591359119611231036
Peaks (wavelength/cm−1) of HAPAM3433 29282860 1635157714161319117511231042
Table 4. Interfacial tension at the interface between HAPAM/PAM and crude oil.
Mass ConcentrationsPAMHAPAM
Interfacial Tension (mN/m) ± Standard Deviations
500 mg/L22.94 ± 0.0519.95 ± 0.02
750 mg/L21.45 ± 0.0518.64 ± 0.03
1000 mg/L19.87 ± 0.0315.84 ± 0.03
Table 5. Experimental parameters for measuring RF and RFF of HAPAM and PAM.
Pressure in Water-Driving-Stage (MPa)Pressure in Polymer-Flooding-Stage (MPa)Pressure in Subsequent-Water-Driving-Stage (MPa)RFRFF
2000 mg/L of PAM0.00940.10570.013711.221.45
2000 mg/L of HAPAM0.01220.20490.034216.772.80
Disclaimer/Publisher’s Note: The statements, opinions and data contained in all publications are solely those of the individual author(s) and contributor(s) and not of MDPI and/or the editor(s). MDPI and/or the editor(s) disclaim responsibility for any injury to people or property resulting from any ideas, methods, instructions or products referred to in the content.

