
Online Detection of Laser Welding Penetration Depth Based on Multi-Sensor Features

 and
and
Abstract
1. Introduction
2. Experimental Setup and Methods
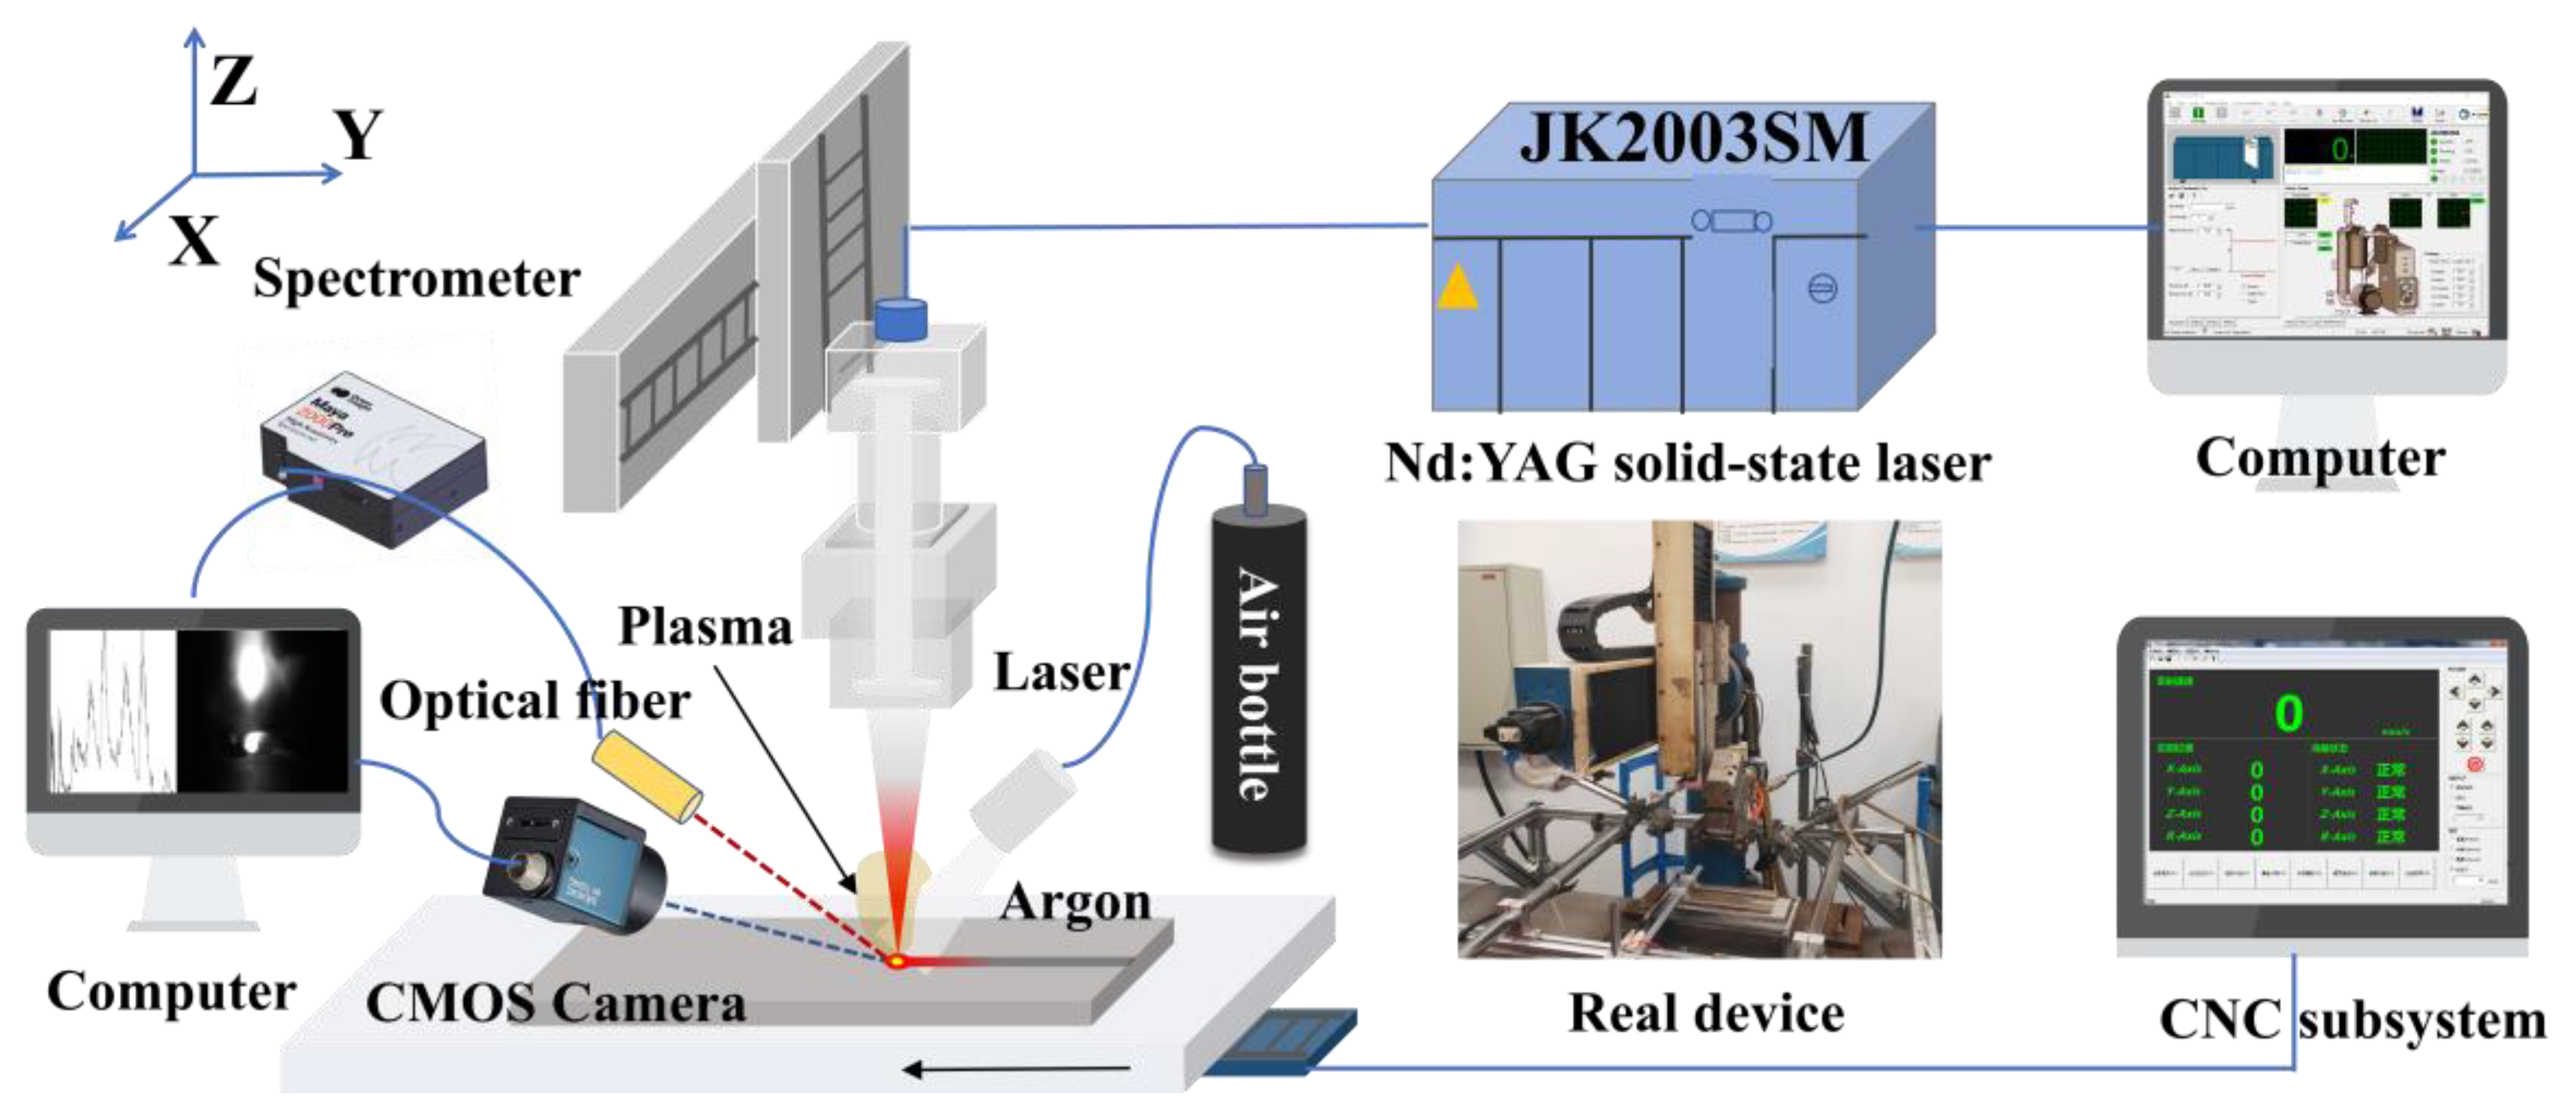
2.1. Experiment System
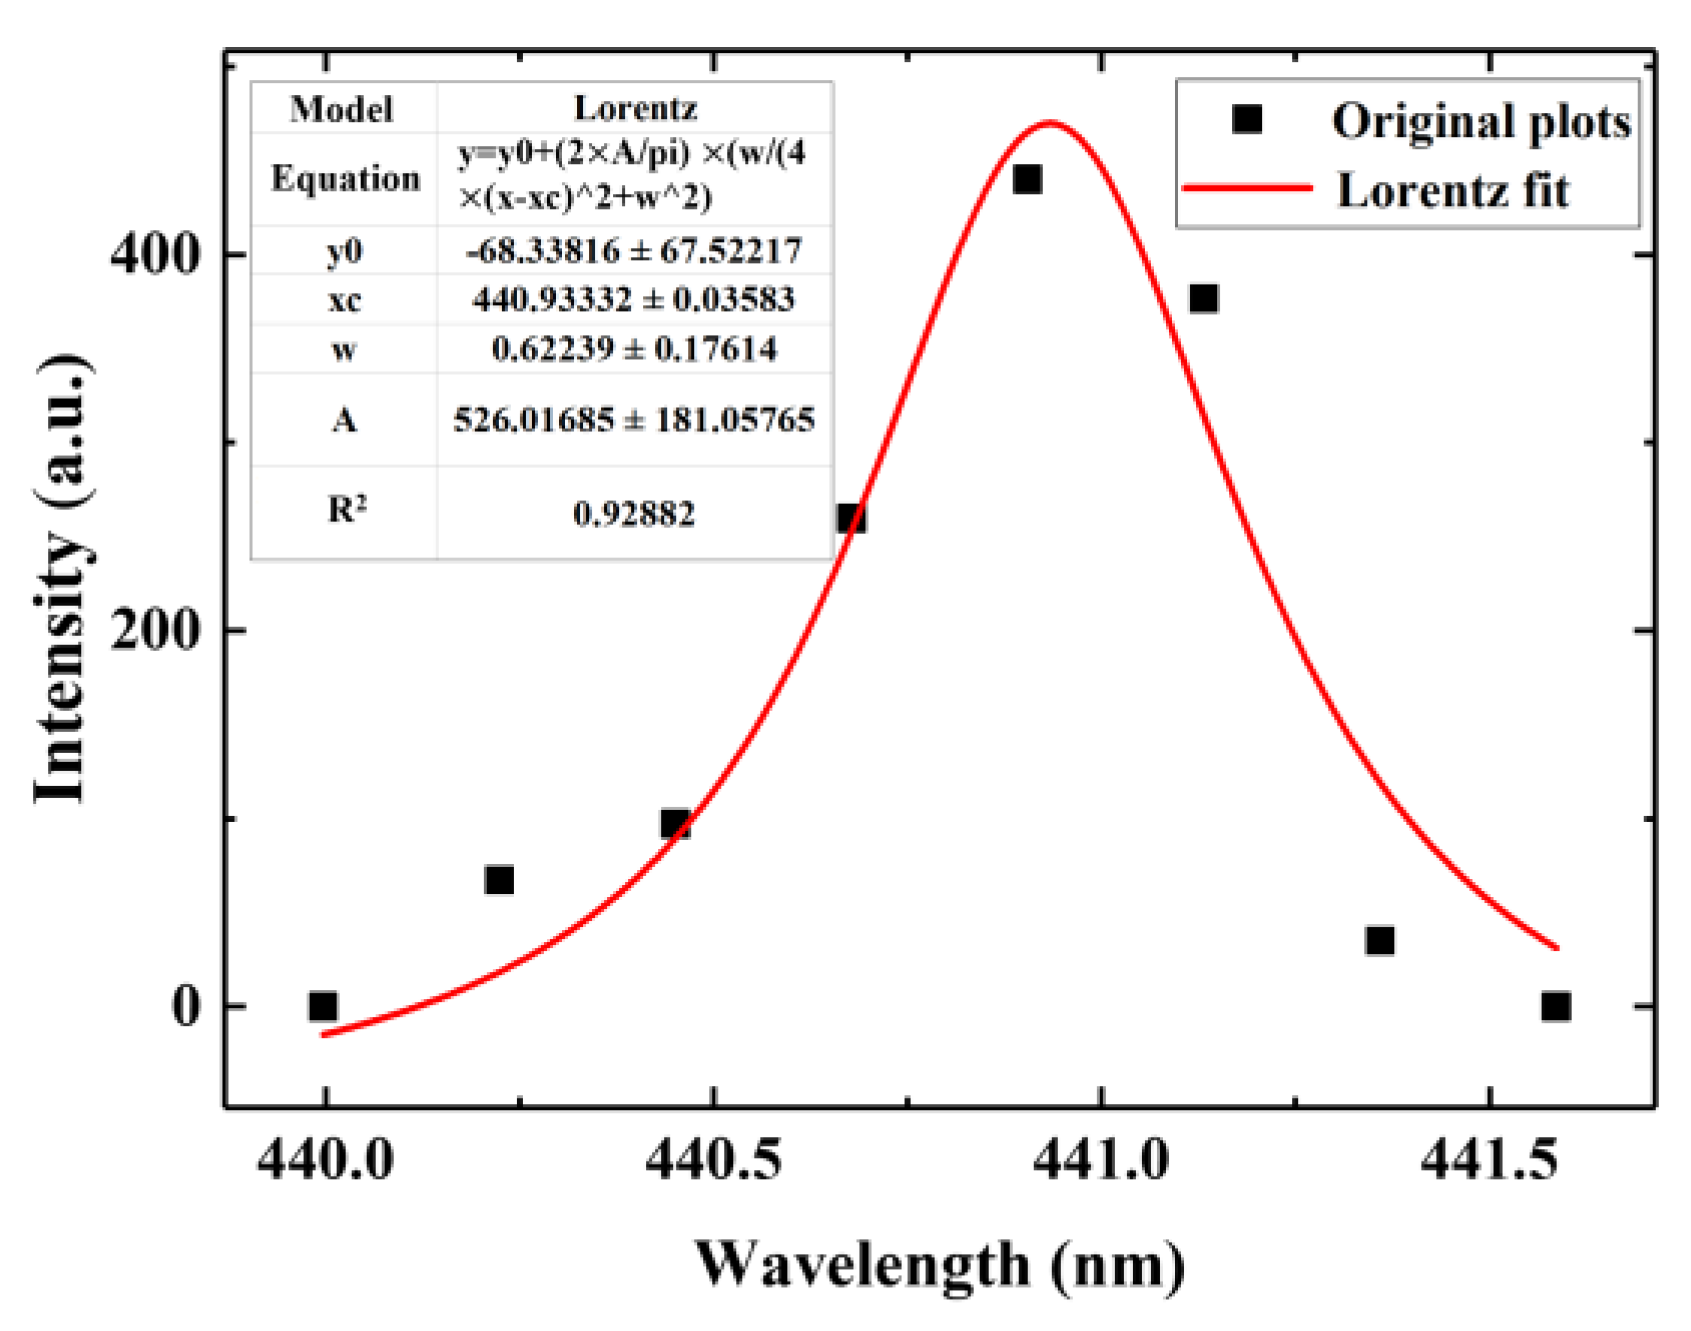
2.2. Plasma Spectrum Processing Method
2.2.1. Electron Temperature Calculation
2.2.2. Electron Density Calculation
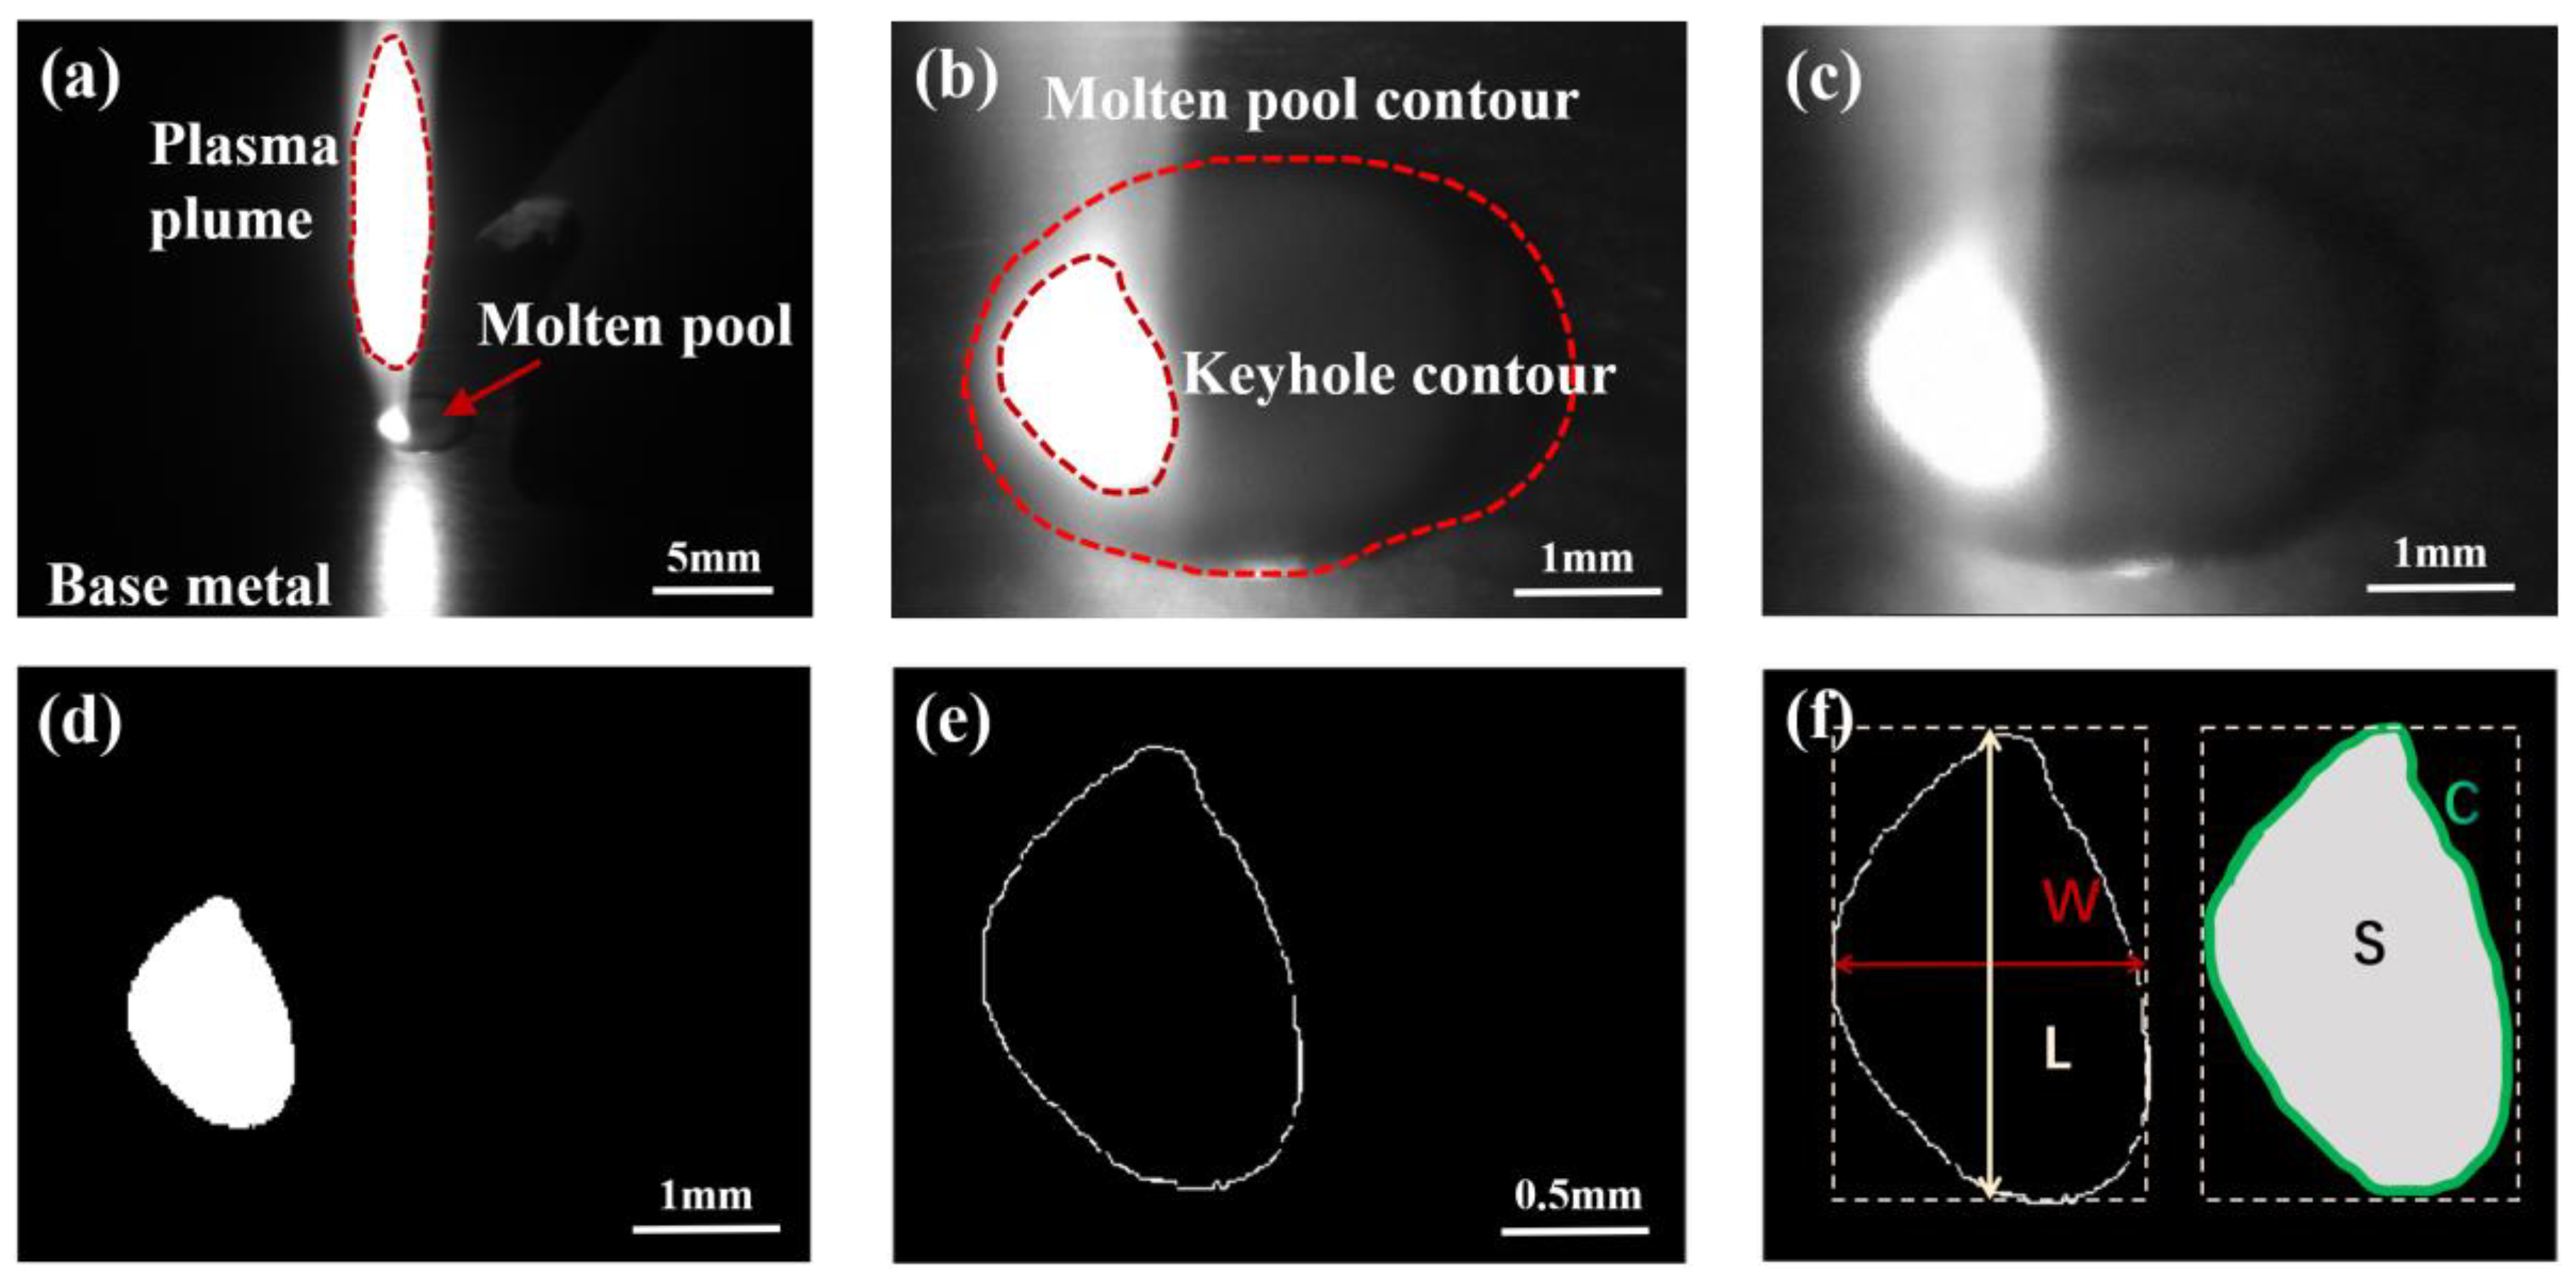
2.3. Image Feature Extraction
3. Results and Discussion
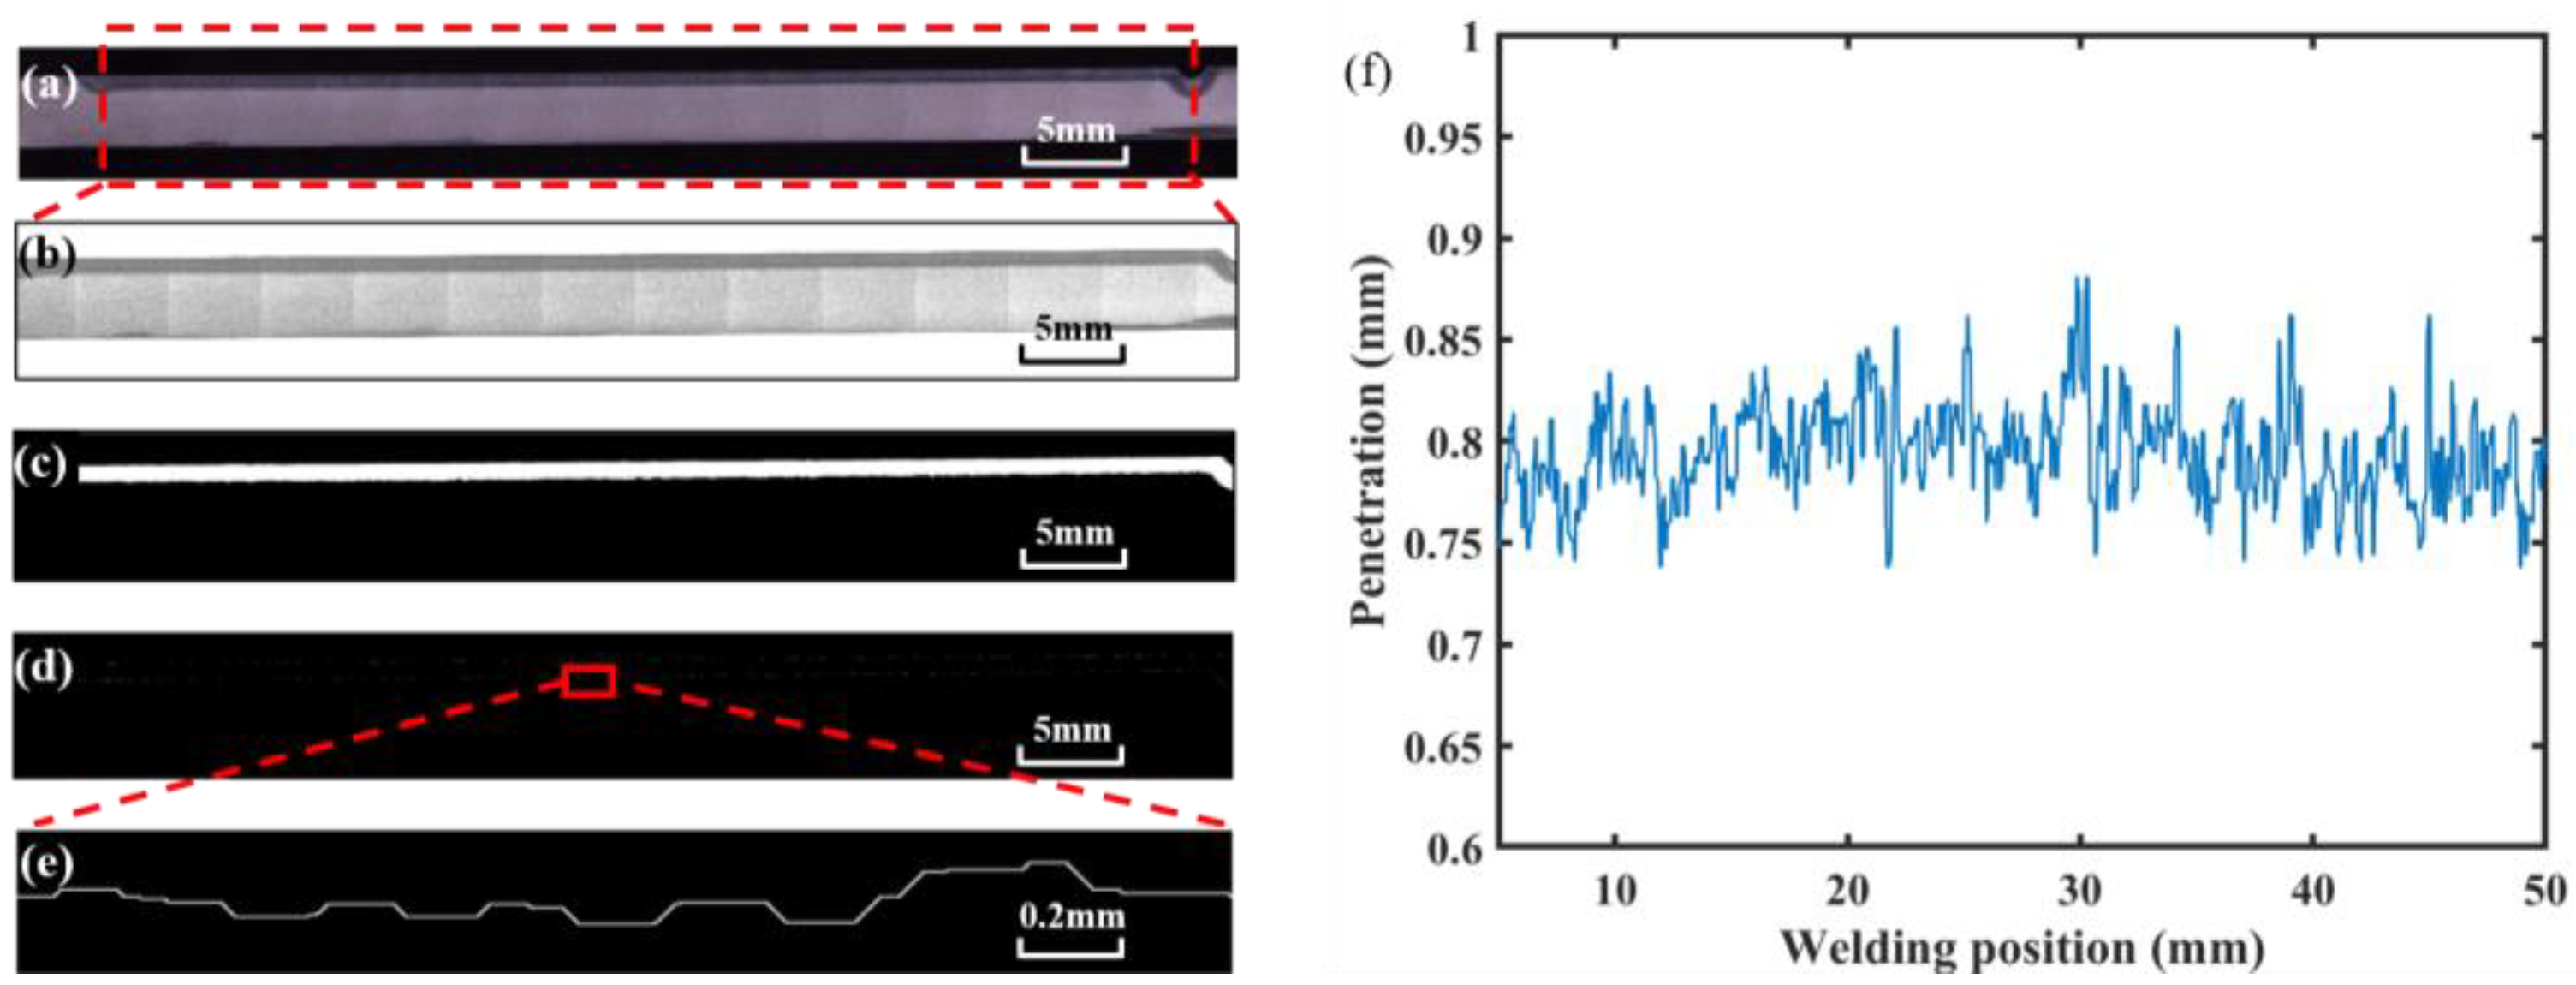
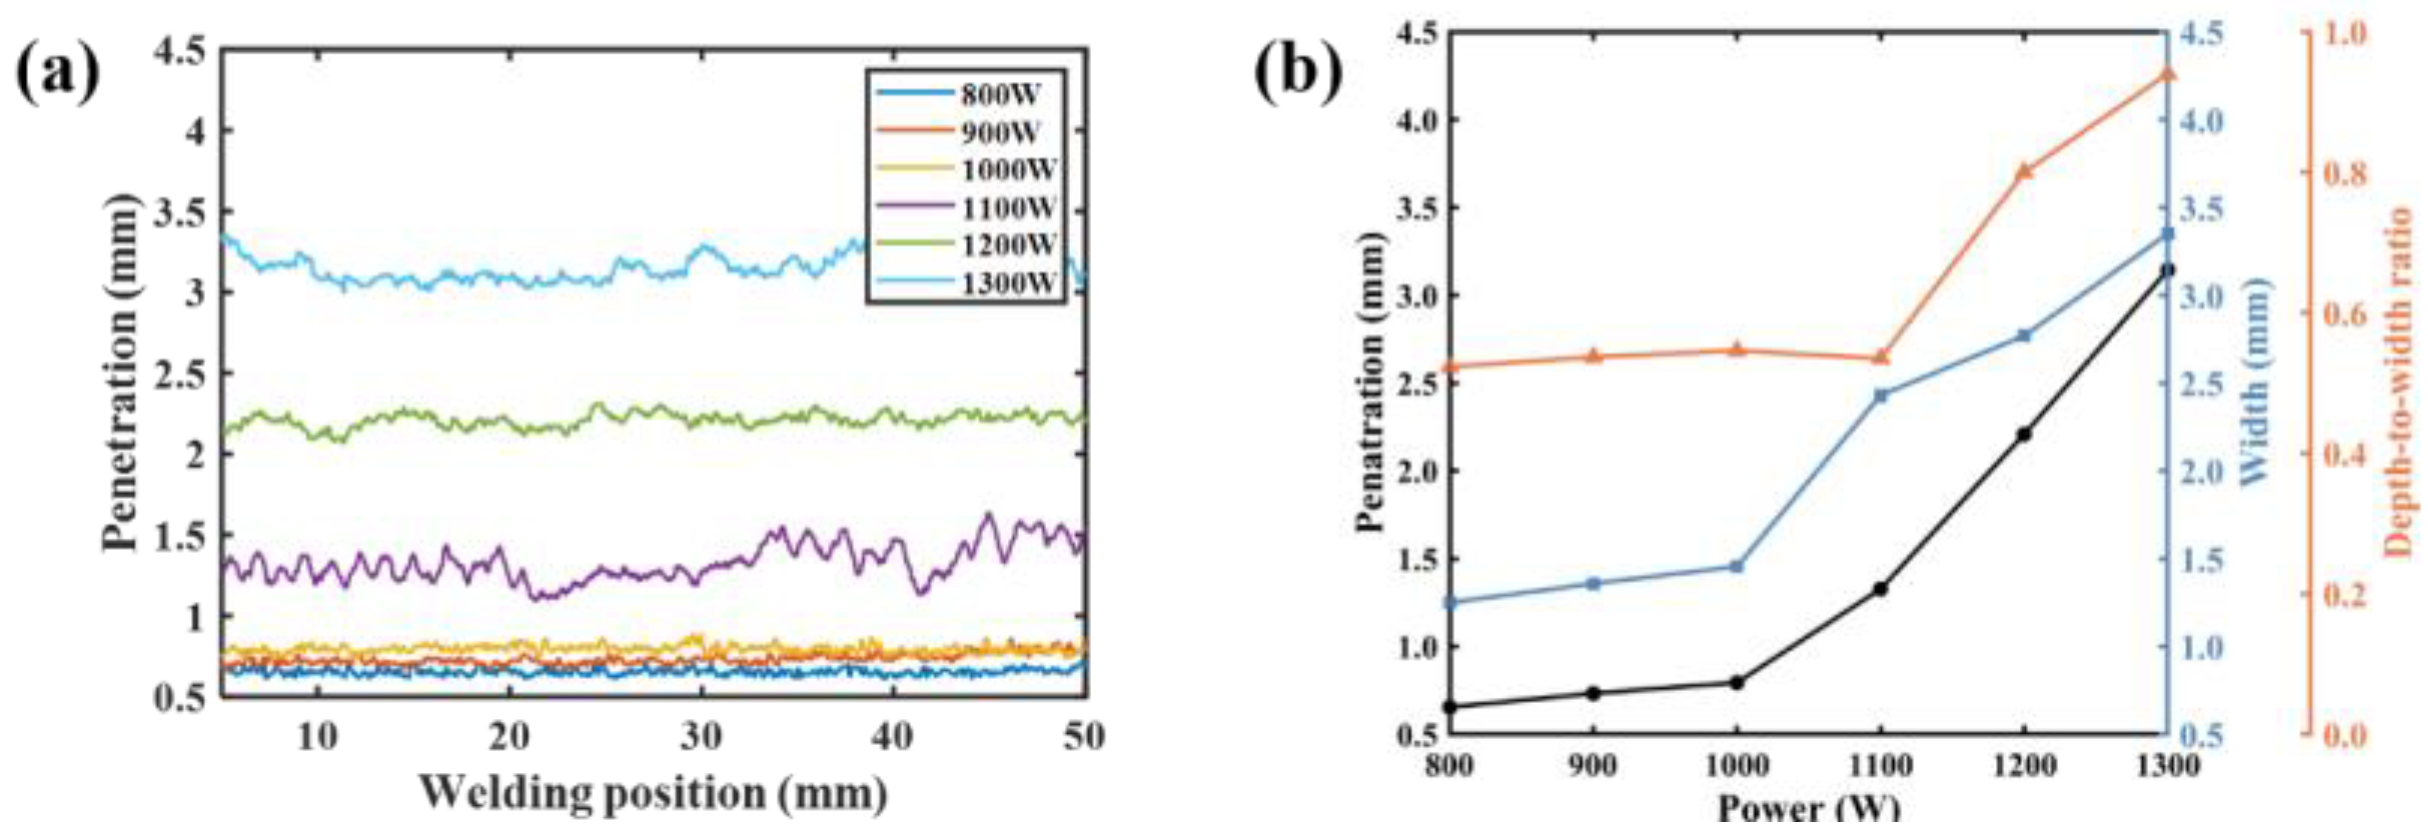
3.1. Influence of Process Parameters on Penetration Depth
3.2. Plasma Spectral Analysis
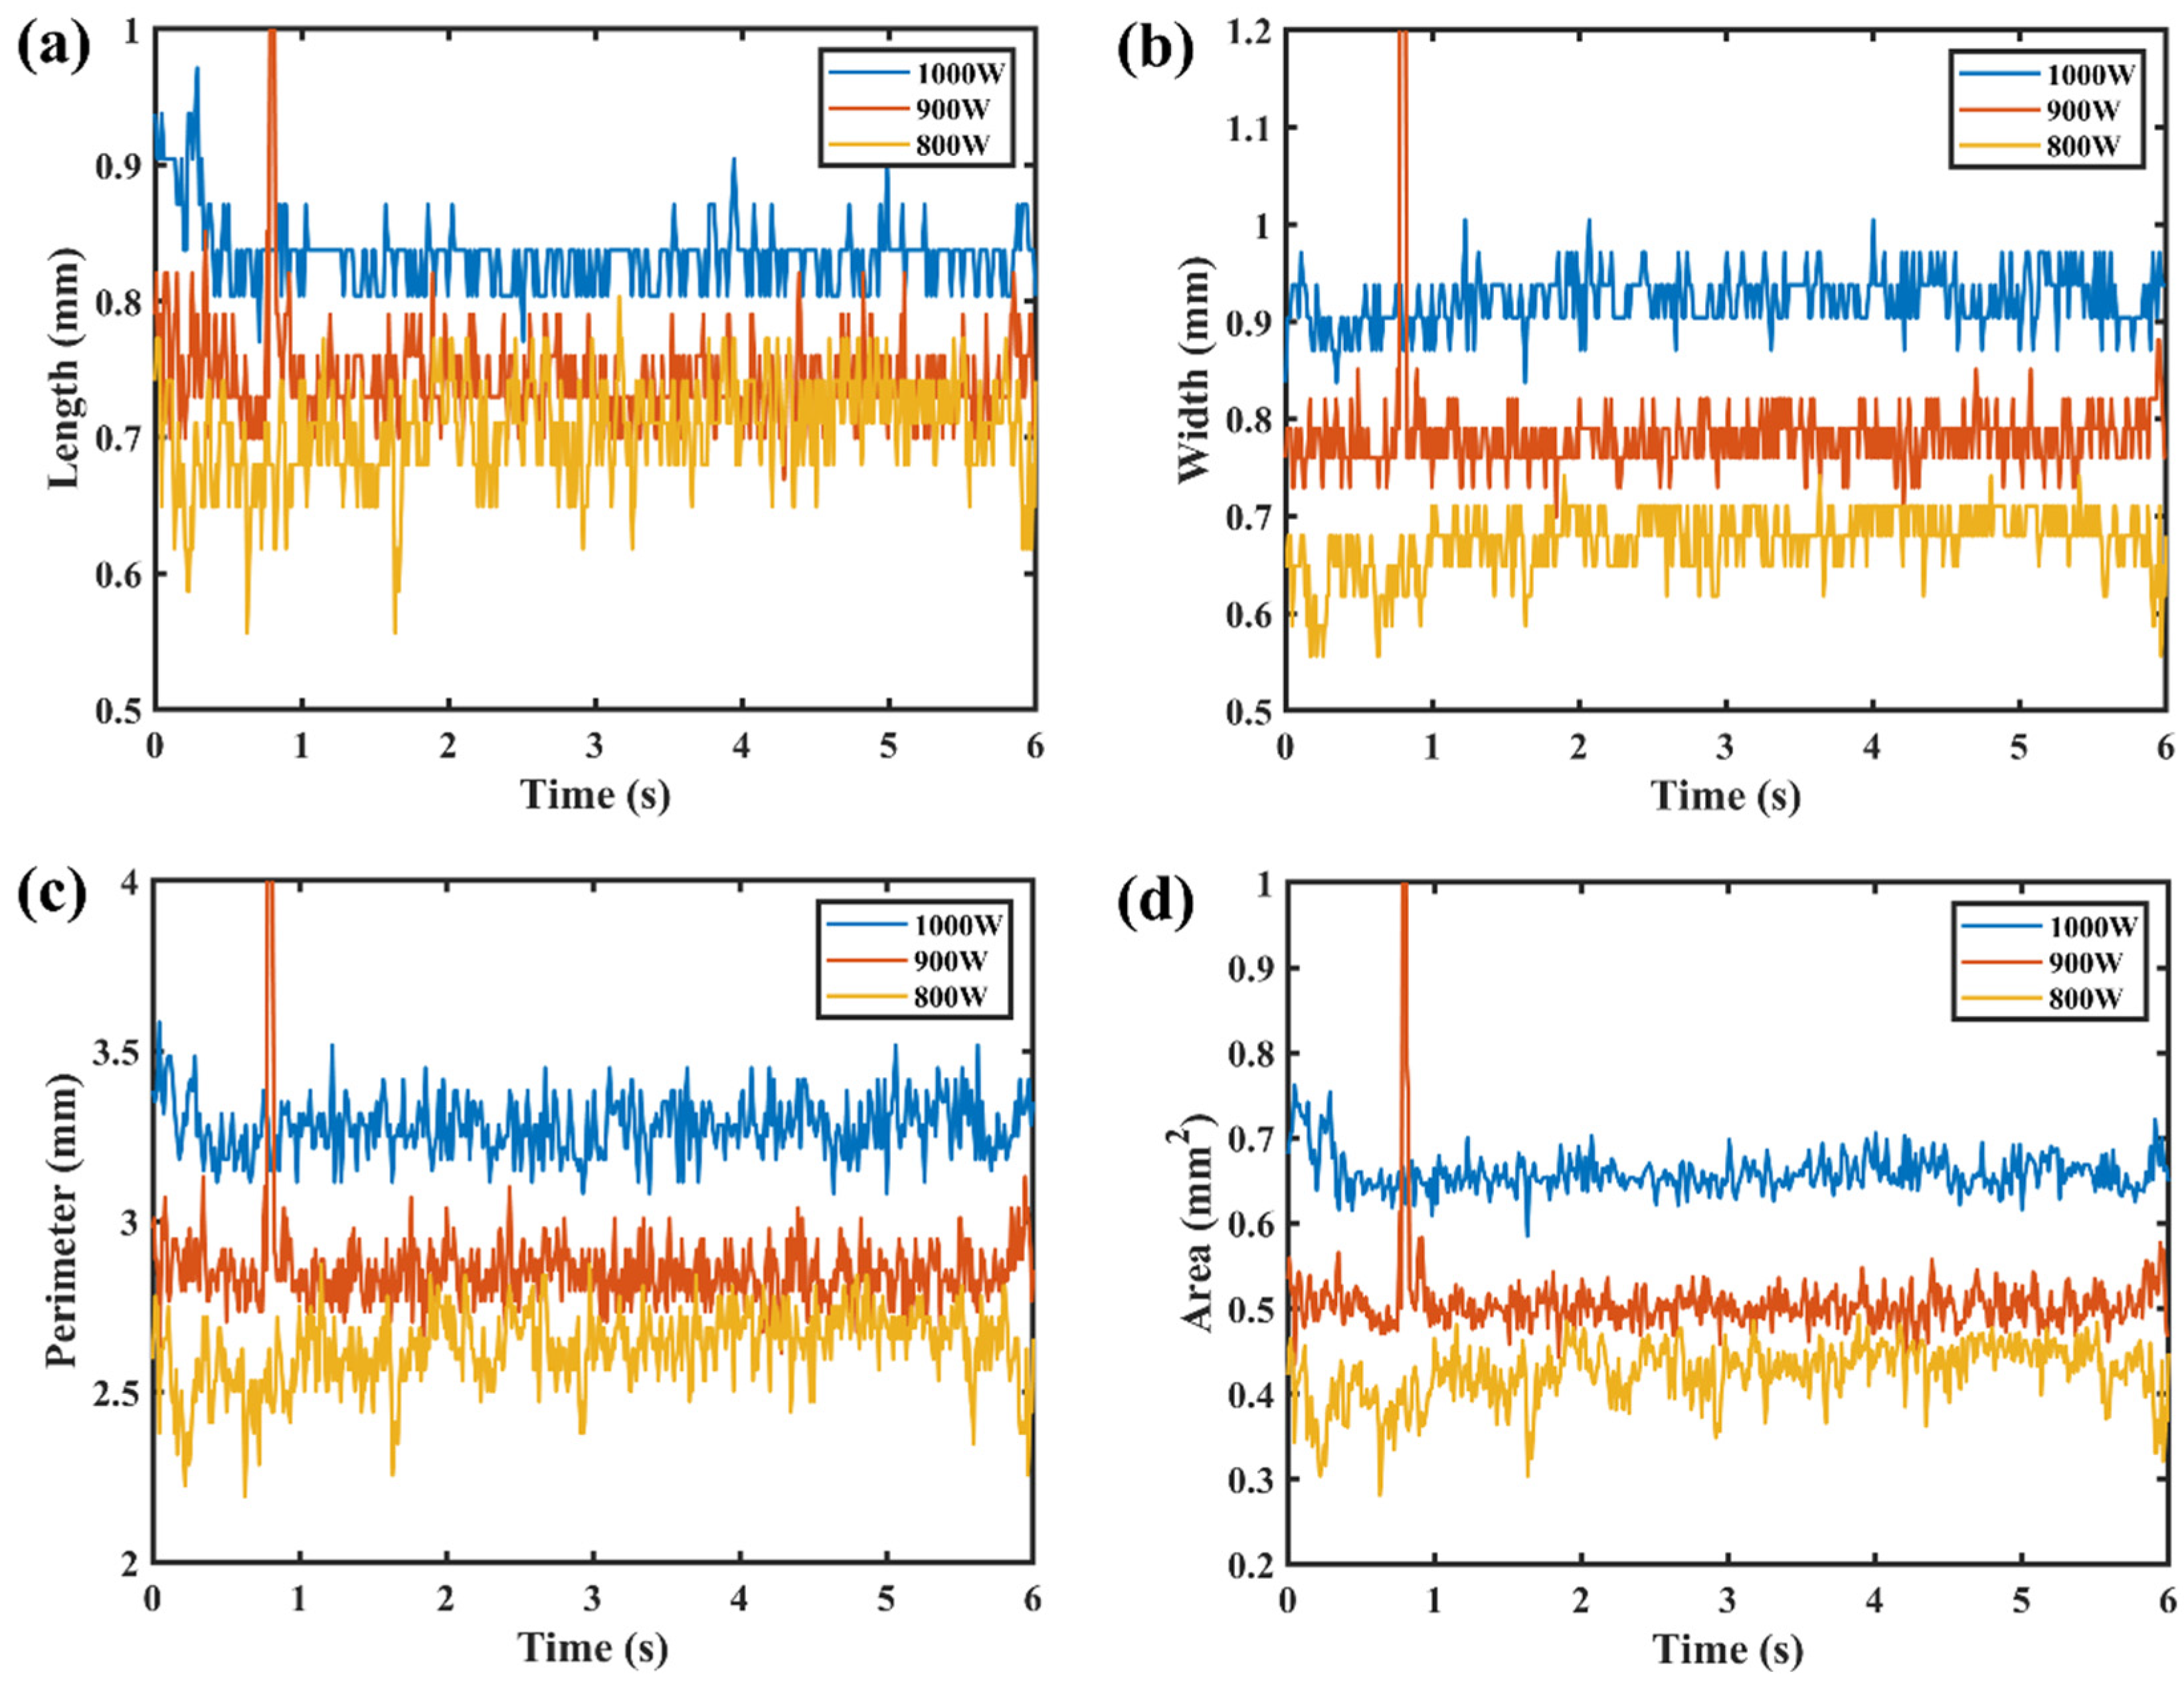
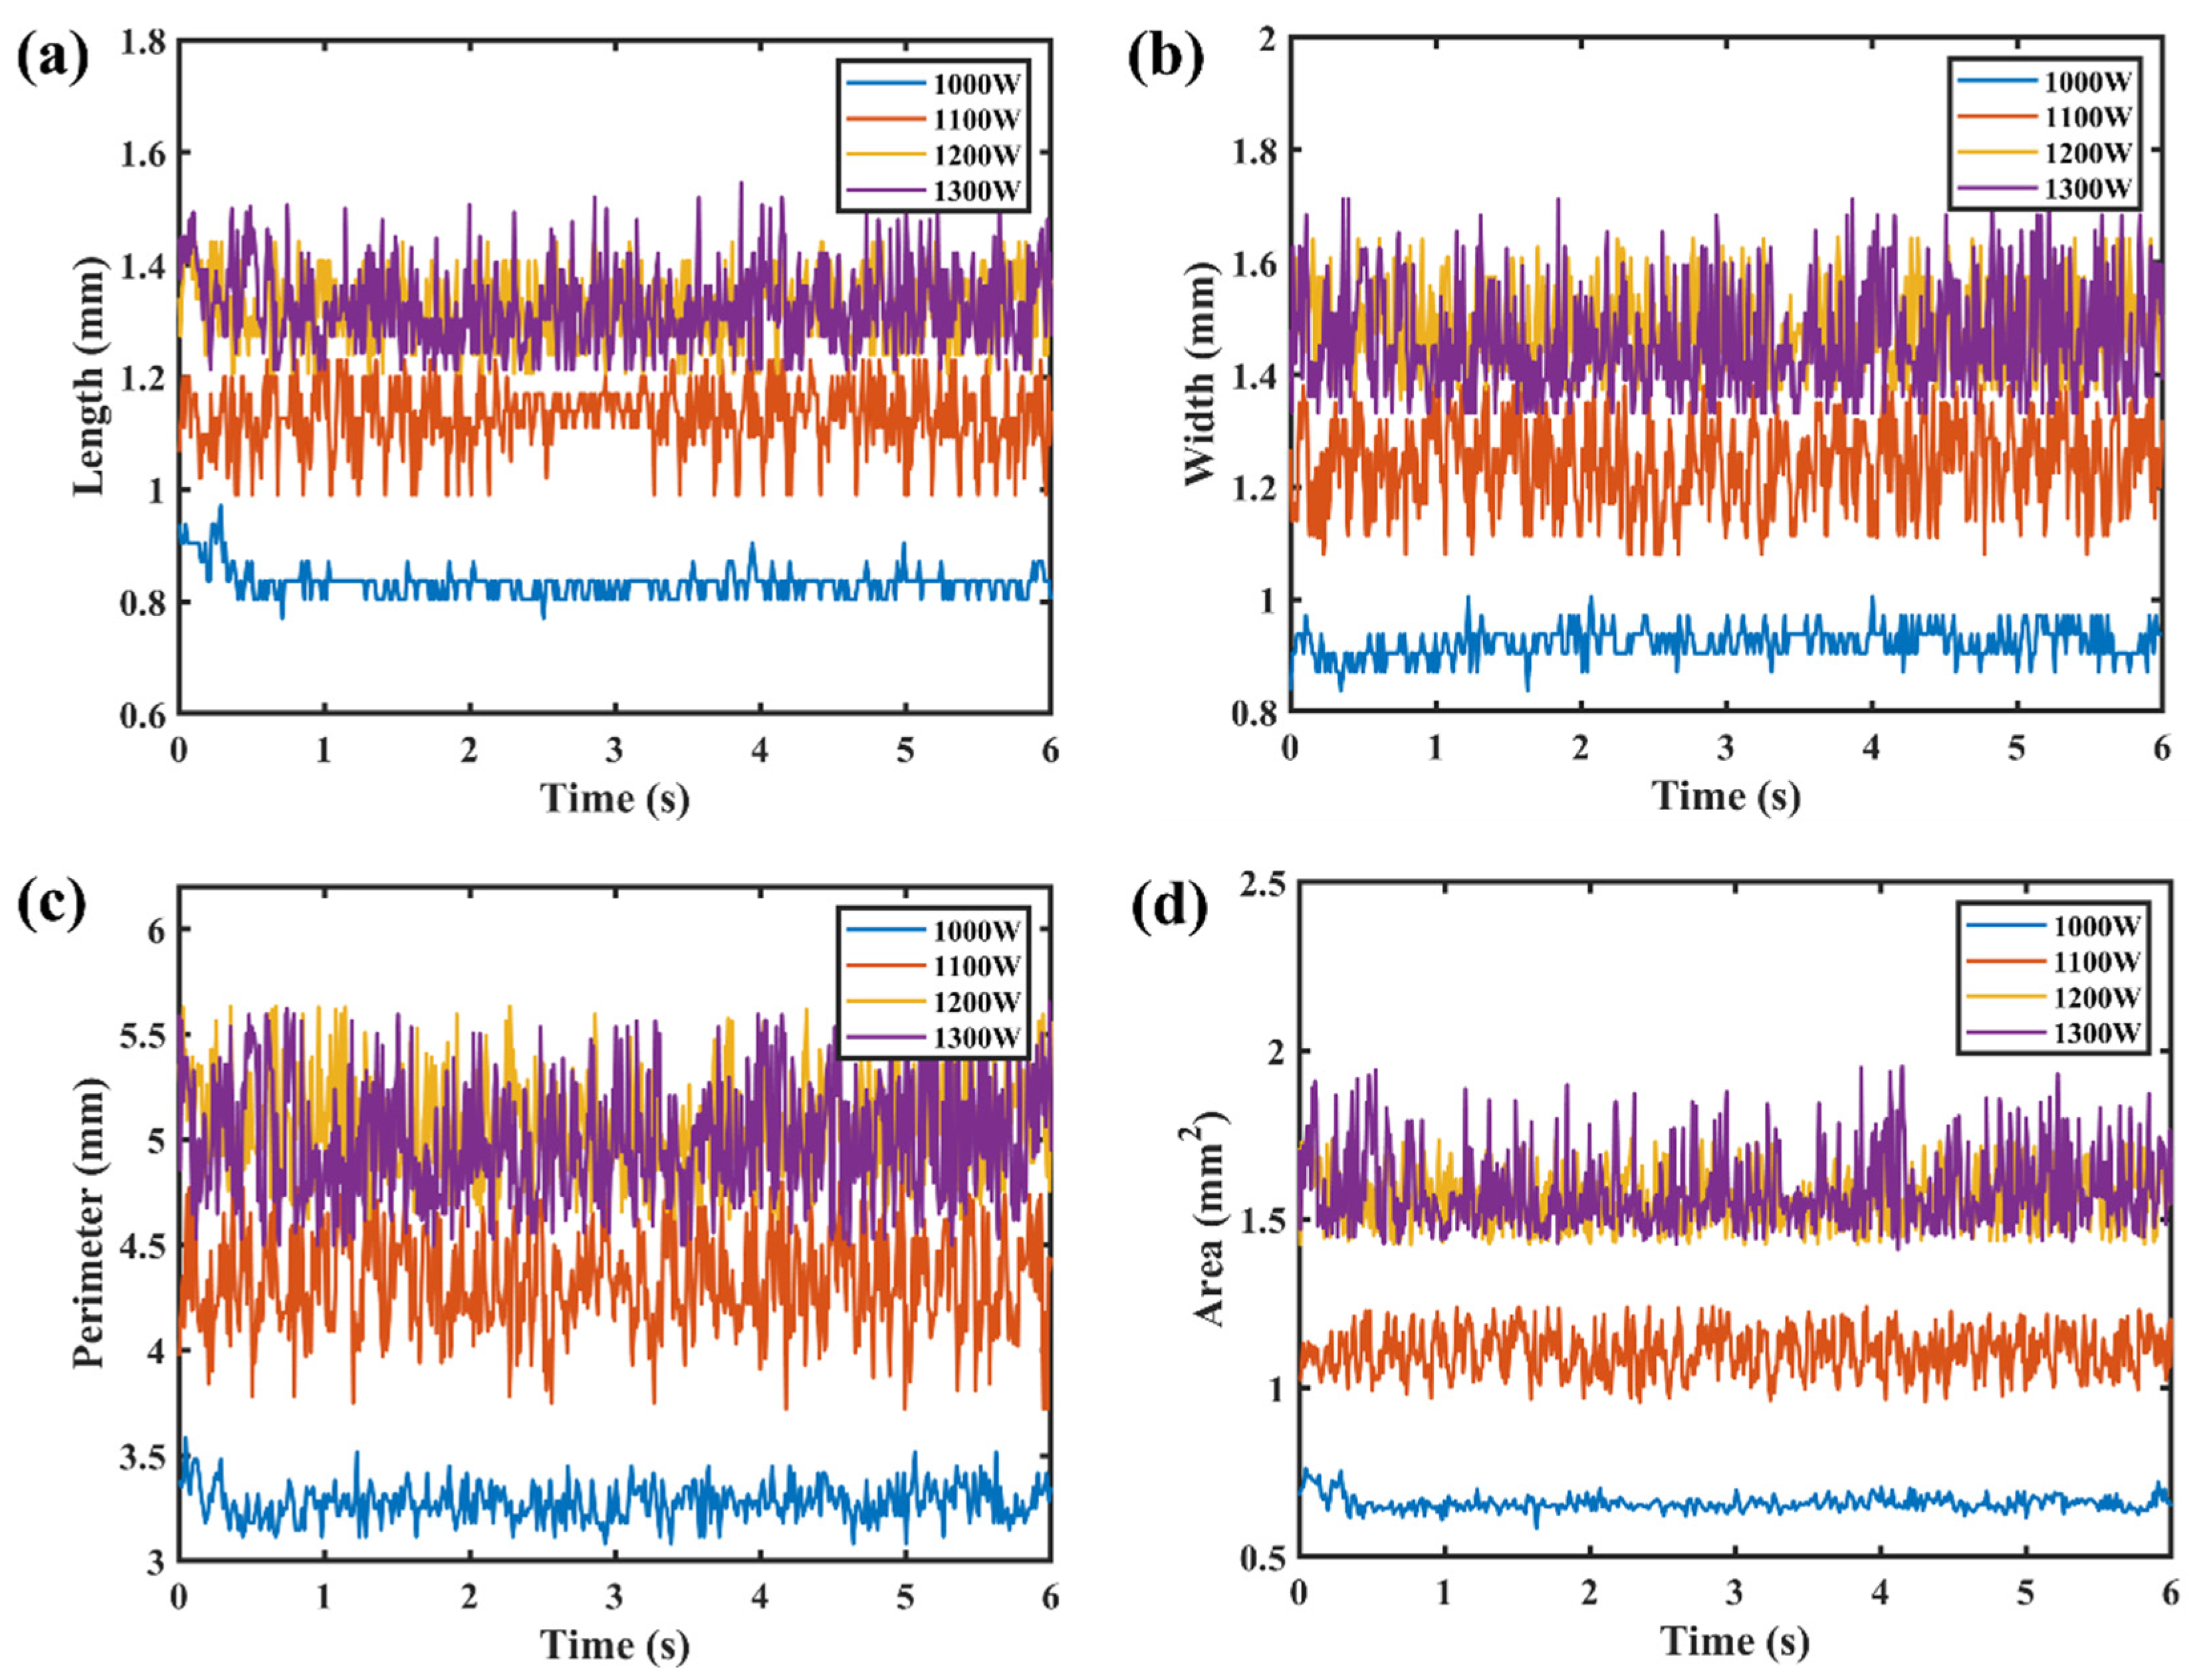
3.3. Keyhole–Molten Pool Images Analysis
3.4. Establishment of Penetration Prediction Models
4. Conclusions
- The thermomechanical characteristics of titanium alloy laser-induced plasma under different laser powers were studied. The time series of electron temperature and density during titanium alloy laser welding were calculated by using 6 Ti I spectral lines and 1 VI spectral line. When the laser power increased from 800 W to 1300 W, the average electron temperature increased from 7516.1 K to 7708.3 K and then decreased to 7438.9 K. The average electron density increased from 1.94 × 1017 cm−3 to 2.26 × 1017 cm−3 and then decreased to 1.78 × 1017 cm−3;
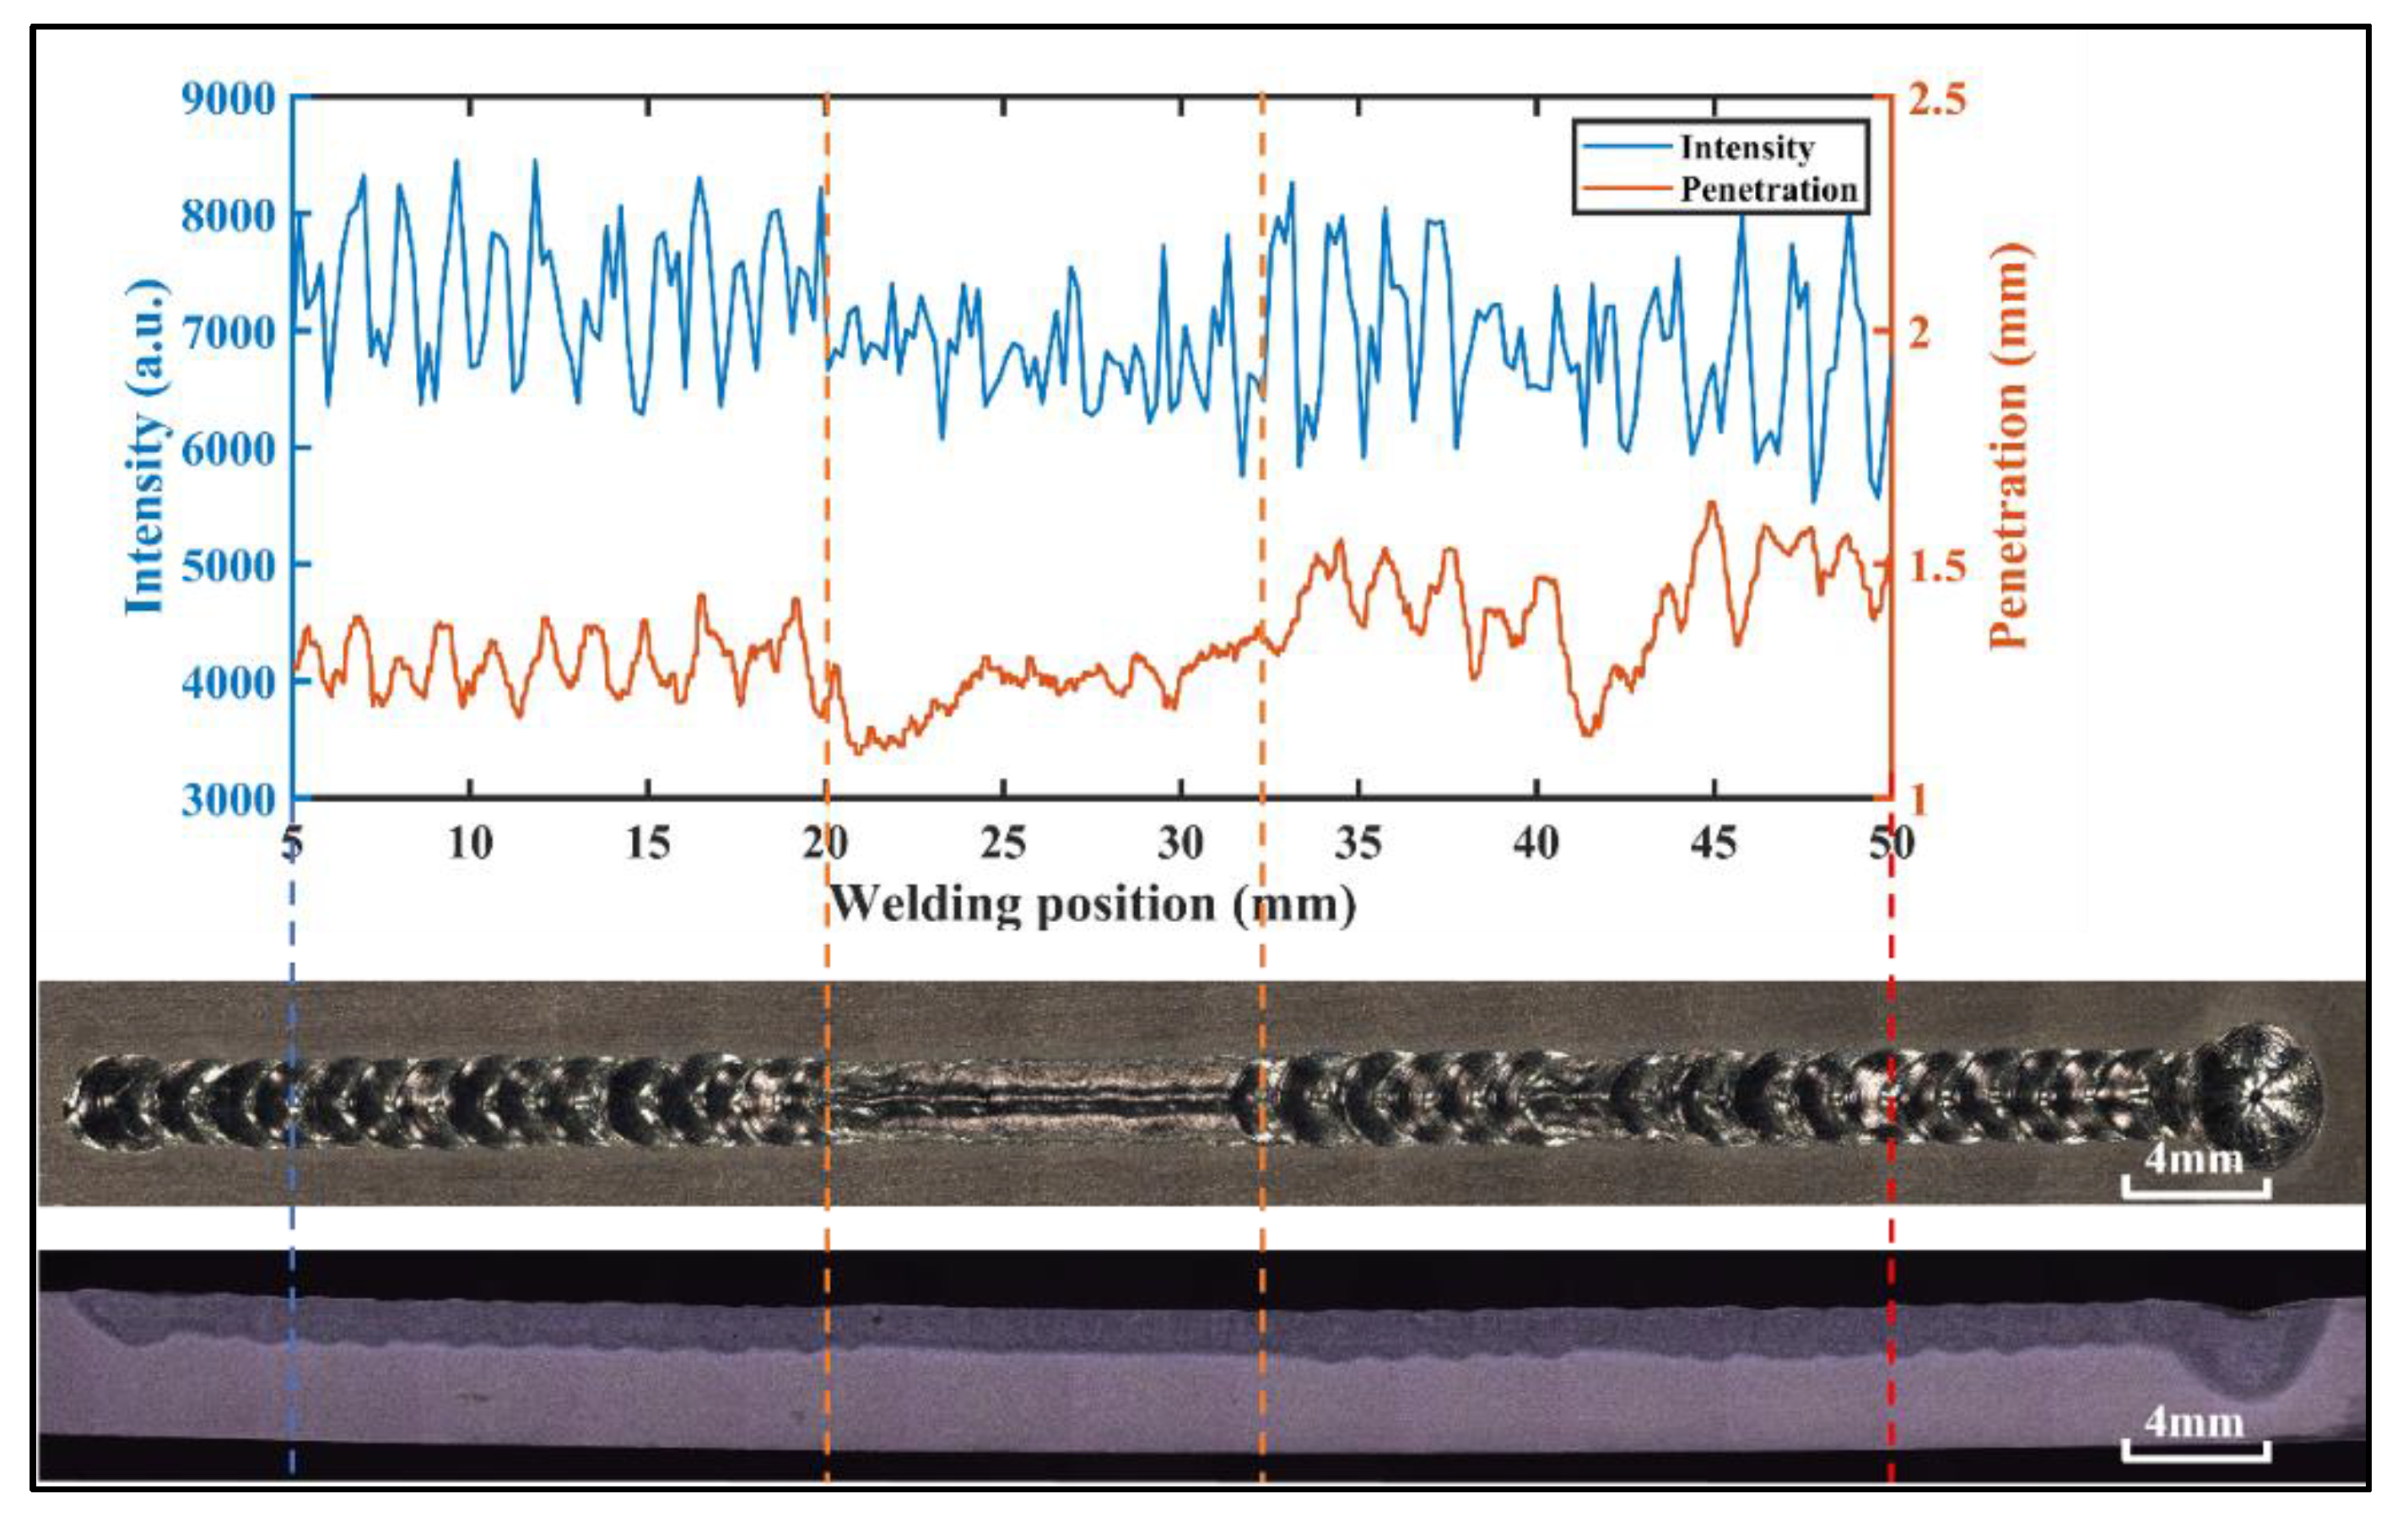
- The penetration depth, the spectral intensity of Ti I 506.47 nm, and four features of the keyhole–molten pool images were obtained by feature extraction. The feature values showed the same change trend with the increase in laser power. The penetration depth increased from 0.65 mm to 3.14 mm, and the spectral intensity of Ti I 506.47 nm changed from 4860 a.u. to 8363 a.u. The keyhole/molten pool area increased from 0.42 mm2 to 1.62 mm2;
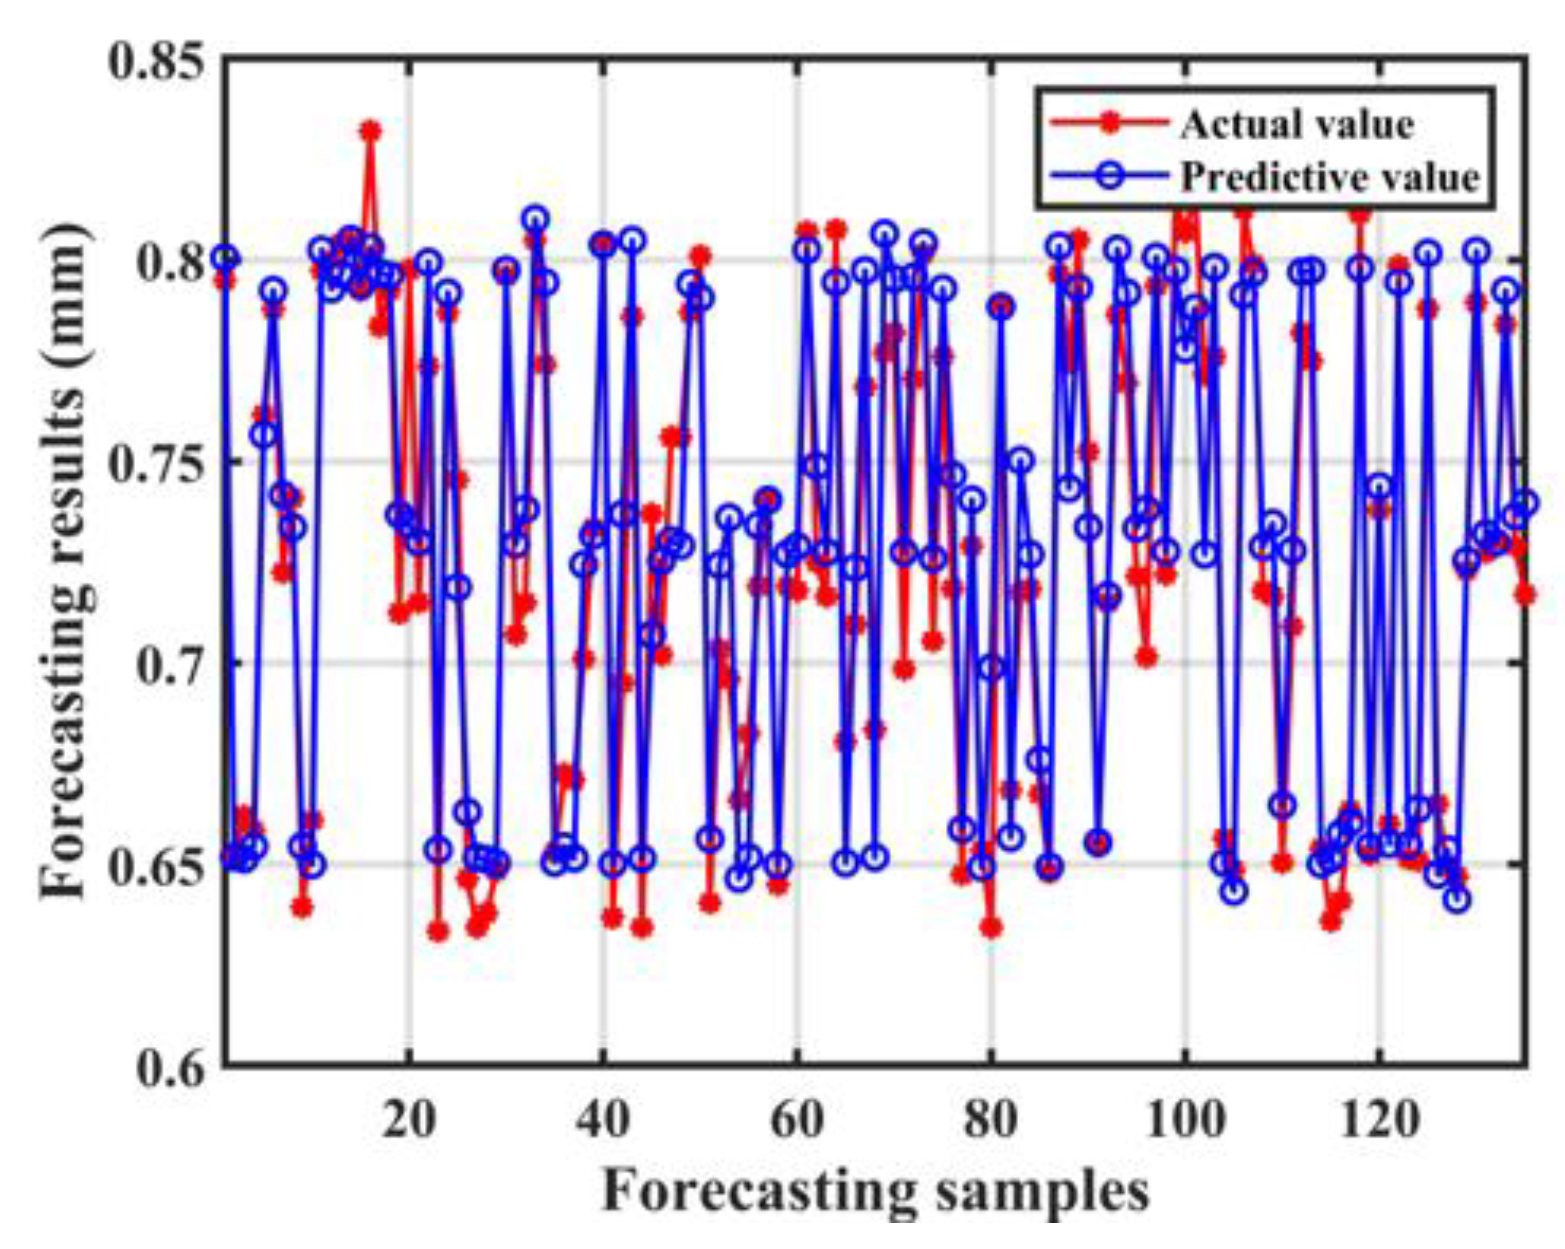
- The sensor features and weld penetration depth had a positive correlation. Two BP neural network prediction models of penetration depth based on single-sensor features were established. The correlation coefficients between the four image features and penetration depth were larger than 0.768. The R2, RMSE, and MAE of the neural network model established by image features were 0.8966, 0.0189, and 0.0149, respectively. As for spectral data, with four features obtained by t-SNE dimensionality reduction as inputs, the R2, RMSE, and MAE are 0.9052, 0.0194, and 0.0146, respectively;
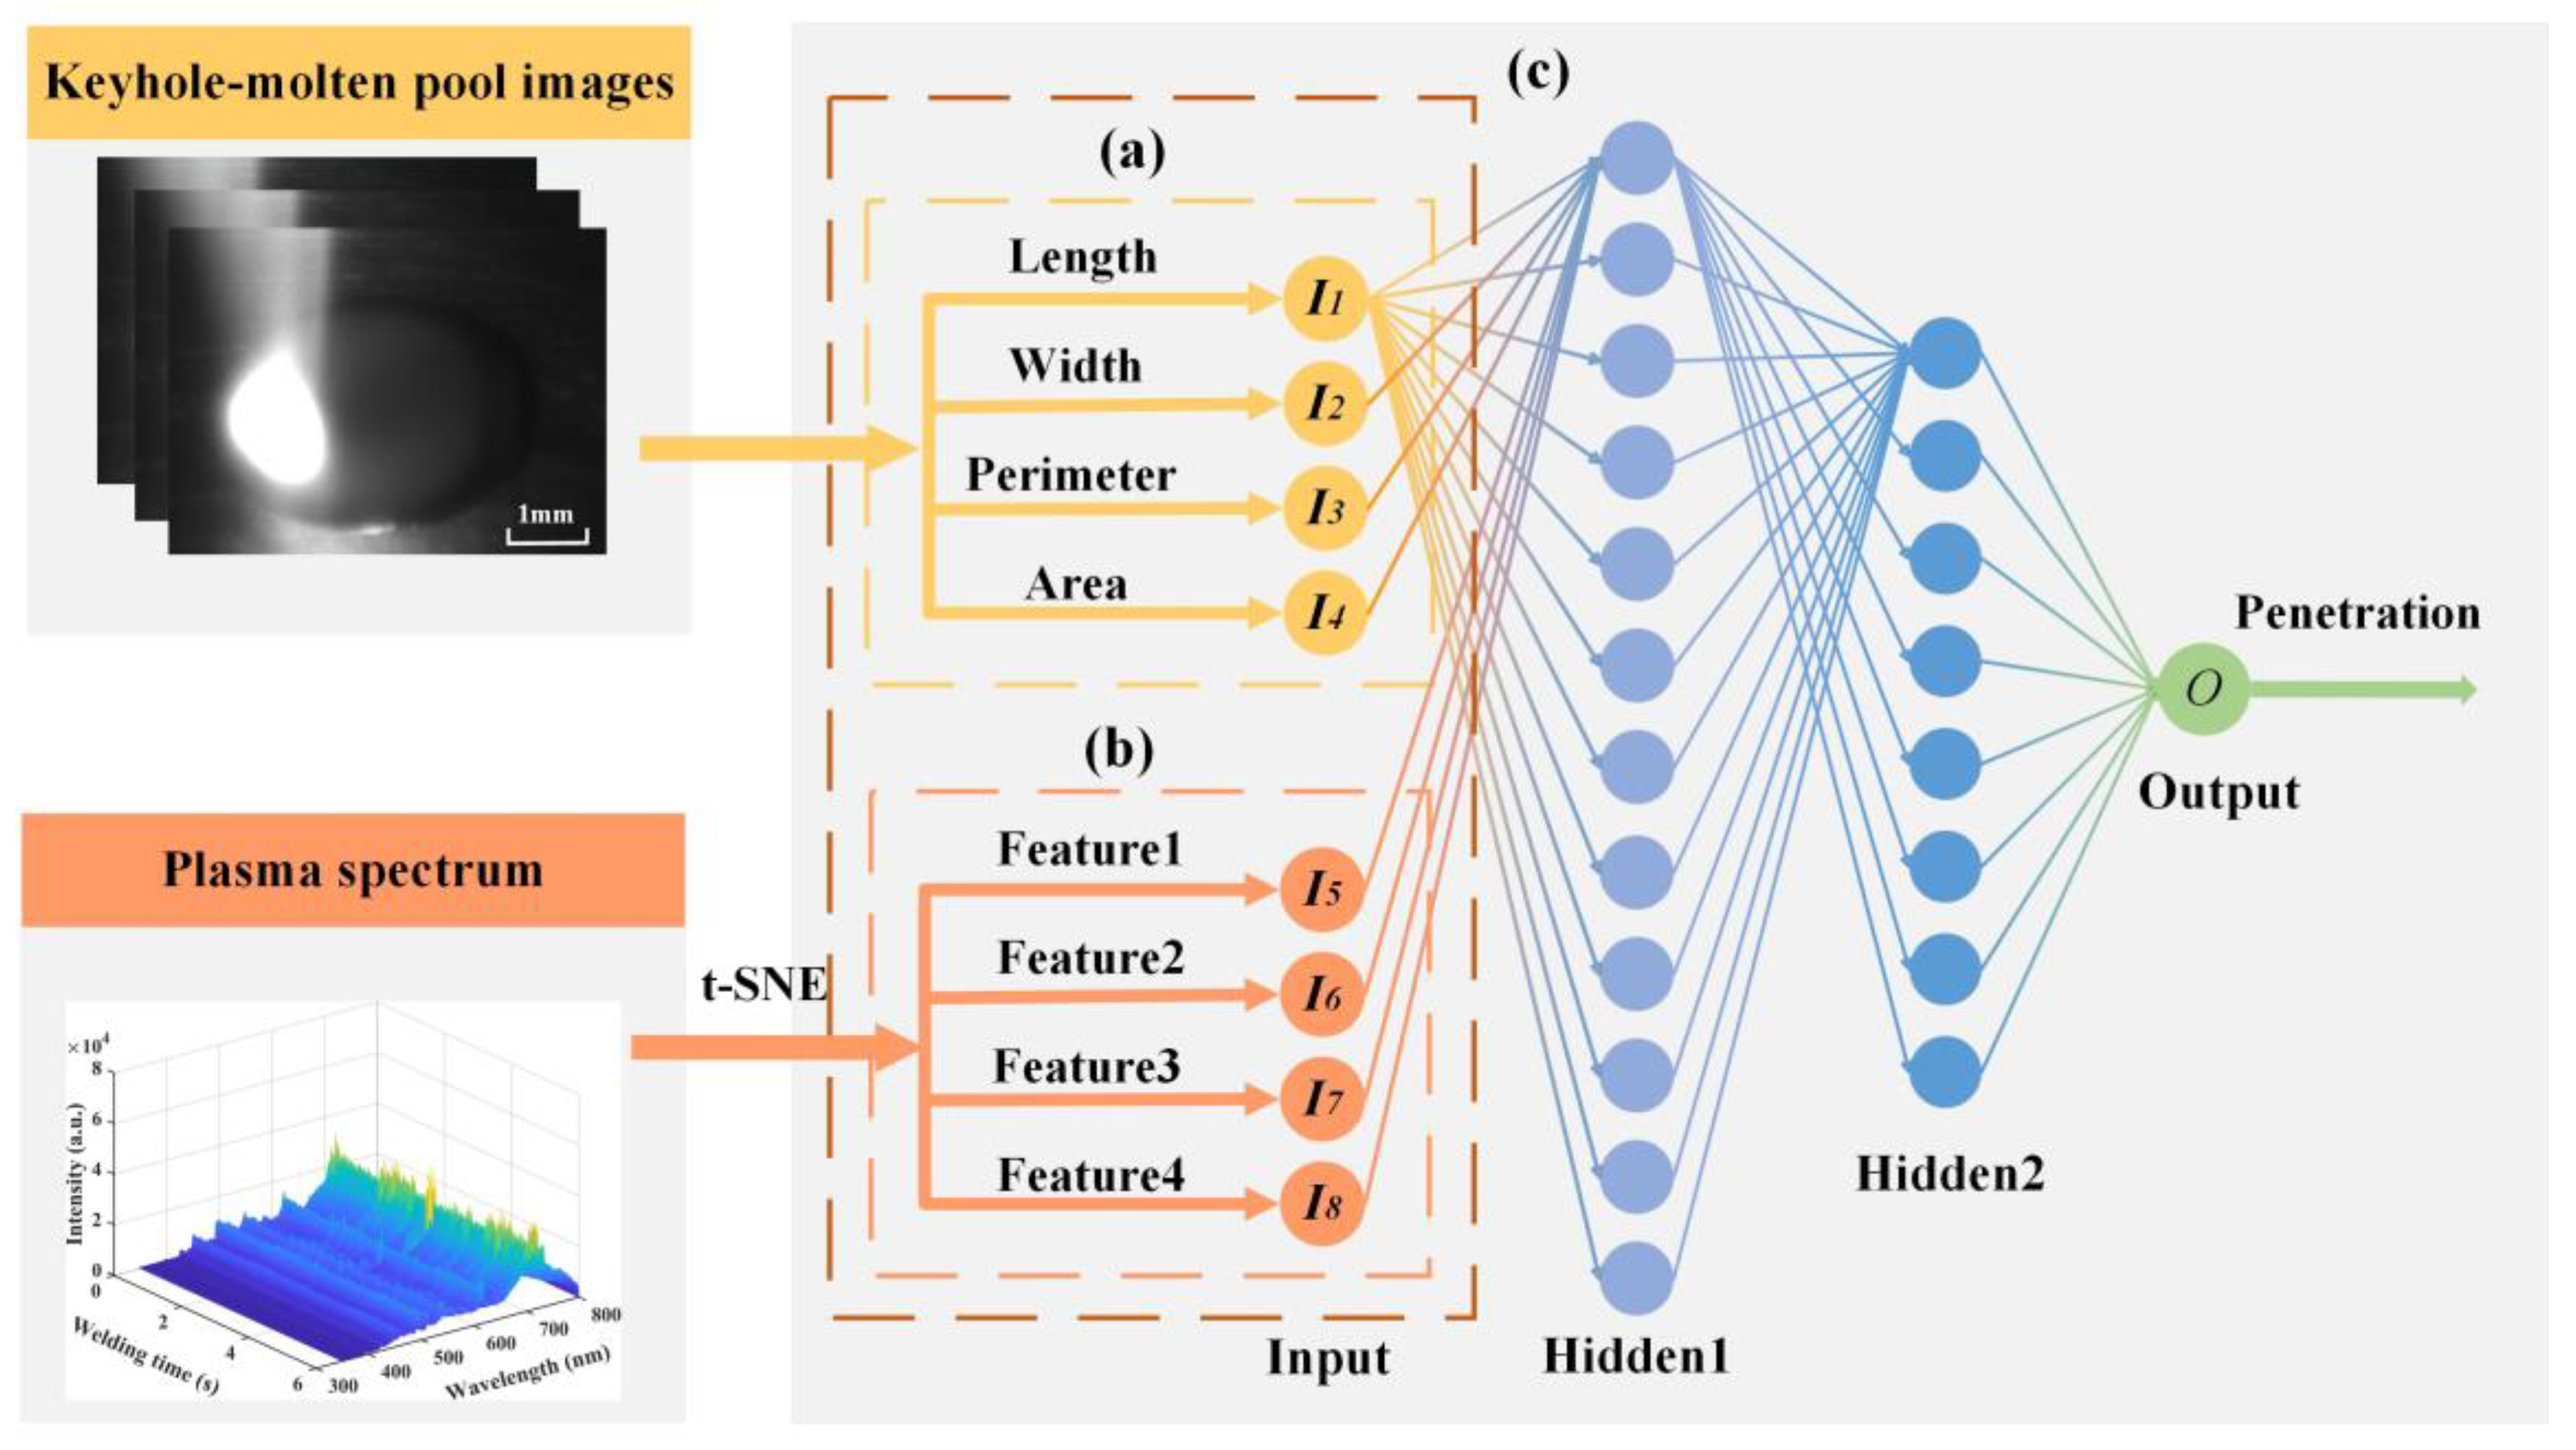
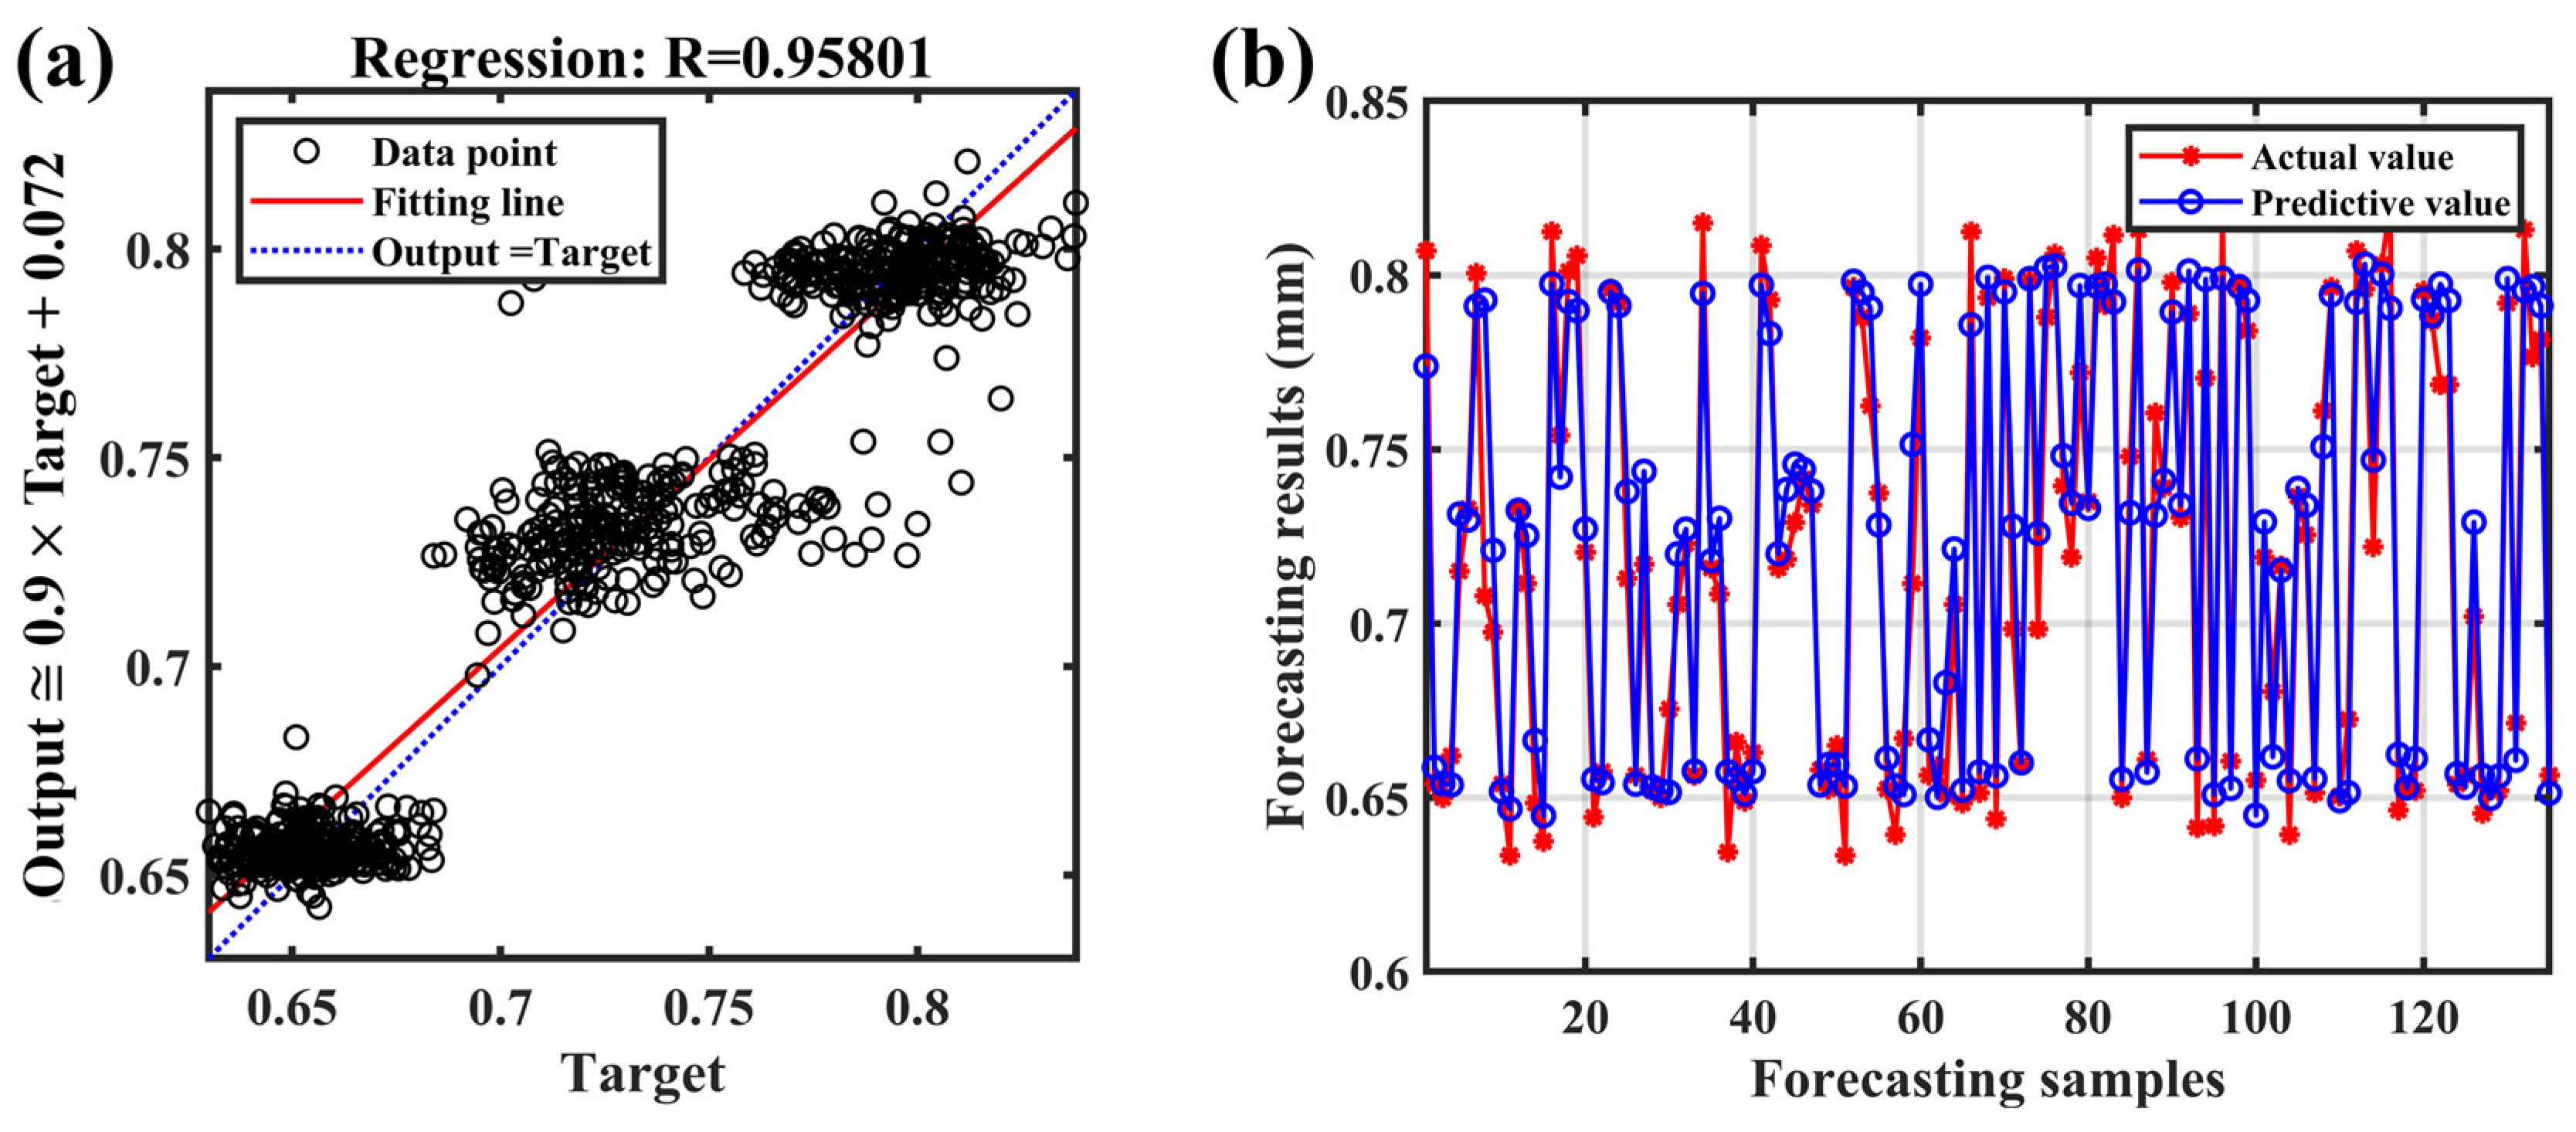
- A BP neural network prediction model of penetration depth was established by using the four image features and the four spectral features after dimensionality reduction as inputs. The R2 was 0.9313, and the RMSE was 0.0162, which meant the fitting degree was higher, and the error was smaller than those of the BP neural network model trained by single-sensor features;
- In this study, the relationship between sensing features and penetration depth was investigated. A high-precision penetration depth prediction model was established. On the basis of the above model, an online detection software system of the penetration depth will be built through open-source language as well as a control model of the penetration depth.
Author Contributions
Funding
Institutional Review Board Statement
Informed Consent Statement
Data Availability Statement
Conflicts of Interest
Correction Statement
References
- Auwal, S.T.; Ramesh, S.; Yusof, F.; Manladan, S.M. A review on laser beam welding of titanium alloys. Int. J. Adv. Manuf. Technol. 2018, 97, 1071–1098. [Google Scholar] [CrossRef]
- Paranthaman, V.; Dhinakaran, V.; Sai, M.S.; Devaraju, A. A systematic review of fatigue behaviour of laser welding titanium alloys. Mater. Today Proc. 2021, 39, 520–523. [Google Scholar] [CrossRef]
- Quazi, M.M.; Ishak, M.; Fazal, M.A.; Arslan, A.; Rubaiee, S.; Qaban, A.; Aiman, M.H.; Sultan, T.; Ali, M.M.; Manladan, S.M. Current research and development status of dissimilar materials laser welding of titanium and its alloys. Opt. Laser Technol. 2020, 126, 106090. [Google Scholar] [CrossRef]
- Wu, D.; Zhang, P.; Yu, Z.; Gao, Y.; Zhang, H.; Chen, H.; Chen, S.; Tian, Y. Progress and perspectives of in-situ optical monitoring in laser beam welding: Sensing, characterization and modeling. J. Manuf. Process. 2022, 75, 767–791. [Google Scholar] [CrossRef]
- Lednev, V.N.; Sdvizhenskii, P.A.; Stavertiy, A.Y.; Grishin, M.Y.; Tretyakov, R.S.; Asyutin, R.D.; Pershin, S.M. Online and in situ laser-induced breakdown spectroscopy for laser welding monitoring. Spectrochim. Acta Part B At. Spectrosc. 2021, 175, 106032. [Google Scholar] [CrossRef]
- Cai, W.; Wang, J.; Jiang, P.; Cao, L.; Mi, G.; Zhou, Q. Application of sensing techniques and artificial intelligence-based methods to laser welding real-time monitoring: A critical review of recent literature. J. Manuf. Syst. 2020, 57, 1–18. [Google Scholar] [CrossRef]
- Sokolov, M.; Franciosa, P.; Sun, T.; Ceglarek, D.; Dimatteo, V.; Ascari, A.; Fortunato, A.; Nagel, F. Applying optical coherence tomography for weld depth monitoring in remote laser welding of automotive battery tab connectors. J. Laser Appl. 2021, 33, 012028. [Google Scholar] [CrossRef]
- Tomcic, L.; Ederer, A.; Grabmann, S.; Kick, M.; Kriegler, J.; Zaeh, M.F. Interpreting acoustic emissions to determine the weld depth during laser beam welding. J. Laser Appl. 2022, 34, 042052. [Google Scholar] [CrossRef]
- Xiao, X.; Liu, X.; Cheng, M.; Song, L. Towards monitoring laser welding process via a coaxial pyrometer. J. Mater. Process. Technol. 2020, 277, 116409. [Google Scholar] [CrossRef]
- Huang, Y.; Hou, S.; Xu, S.; Zhao, S.; Yang, L.; Zhang, Z. EMD- PNN based welding defects detection using laser-induced plasma electrical signals. J. Manuf. Process. 2019, 45, 642–651. [Google Scholar] [CrossRef]
- Kim, H.; Nam, K.; Oh, S.; Ki, H. Deep-learning-based real-time monitoring of full-penetration laser keyhole welding by using the synchronized coaxial observation method. J. Manuf. Process. 2021, 68, 1018–1030. [Google Scholar] [CrossRef]
- Huang, Y.; Xu, S.; Yang, L.; Zhao, S.; Liu, Y.; Shi, Y. Defect detection during laser welding using electrical signals and high-speed photography. J. Mater. Process. Technol. 2019, 271, 394–403. [Google Scholar] [CrossRef]
- Will, T.; Jeron, T.; Hoelbling, C.; Muller, L.; Schmidt, M. In-Process Analysis of Melt Pool Fluctuations with Scanning Optical Coherence Tomography for Laser Welding of Copper for Quality Monitoring. Micromachines 2022, 13, 1937. [Google Scholar] [CrossRef] [PubMed]
- Mrna, L.; Sarbort, M.; Rerucha, S.; Jedlicka, P. Autocorrelation analysis of plasma plume light emissions in deep penetration laser welding of steel. J. Laser Appl. 2017, 29, 012009. [Google Scholar] [CrossRef]
- Li, S.; Jiang, P.; Gao, Y.; Song, M.; Shu, L. A penetration depth monitoring method for Al-Cu laser lap welding based on spectral signals. J. Mater. Process. Technol. 2023, 317, 117972. [Google Scholar] [CrossRef]
- Zhang, Y.; Li, F.; Liang, Z.; Ying, Y.; Lin, Q.; Wei, H. Correlation analysis of penetration based on keyhole and plasma plume in laser welding. J. Mater. Process. Technol. 2018, 256, 1–12. [Google Scholar] [CrossRef]
- Liu, Y.; Yang, B.; Han, X.; Tan, C.; Liu, F.; Zeng, Z.; Chen, B.; Song, X. Predicting laser penetration welding states of high-speed railway Al butt-lap joint based on EEMD-SVM. J. Mater. Res. Technol. 2022, 21, 1316–1330. [Google Scholar] [CrossRef]
- Liu, S.; Wu, D.; Luo, Z.; Zhang, P.; Ye, X.; Yu, Z. Measurement of pulsed laser welding penetration based on keyhole dynamics and deep learning approach. Measurement 2022, 199, 111579. [Google Scholar] [CrossRef]
- Li, J.; Zhou, Q.; Cao, L.; Wang, Y.; Hu, J. A convolutional neural network-based multi-sensor fusion approach for in-situ quality monitoring of selective laser melting. J. Manuf. Syst. 2022, 64, 429–442. [Google Scholar] [CrossRef]
- Ma, D.; Jiang, P.; Shu, L.; Geng, S. Multi-sensing signals diagnosis and CNN-based detection of porosity defect during Al alloys laser welding. J. Manuf. Syst. 2022, 62, 334–346. [Google Scholar] [CrossRef]
- Li, J.; Zhang, Y.; Liu, W.; Li, B.; Yin, X.; Chen, C. Prediction of penetration based on plasma plume and spectrum characteristics in laser welding. J. Manuf. Process. 2022, 75, 593–604. [Google Scholar] [CrossRef]
- Huang, Y.; Zhang, F.; Yuan, J.; Jia, C.; Ren, X.; Yang, L. Investigation on surface morphology and microstructure of double-wire+ arc additive manufactured aluminum alloys based on spectral analysis. J. Manuf. Process. 2022, 84, 639–651. [Google Scholar] [CrossRef]
- Kramida, A.; Ralchenko, Y.; Reader, J.; NIST ASD Team. NIST Atomic Spectra Database (Version 5.11). 2023. Available online: https://physics.nist.gov/PhysRefData/ASD/Html/verhist.shtml (accessed on 5 February 2024).
- Bekefi, G. Principles of Laser Plasmas; Wiley Interscience: New York, NY, USA, 1976. [Google Scholar]
- Colón, C.; de Andrés-García, M.I.; Isidoro-García, L.; Moya, A. Theoretical Stark Broadening Parameters for UV–Blue Spectral Lines of Neutral Vanadium in the Solar and Metal-Poor Star HD 84937 Spectra. Atoms 2020, 8, 64. [Google Scholar] [CrossRef]
- Cunningham, R.; Zhao, C.; Parab, N.; Kantzos, C.; Pauza, J.; Fezzaa, K.; Sun, T.; Rollett, A.D. Keyhole threshold and morphology in laser melting revealed by ultrahigh-speed x-ray imaging. Science 2019, 363, 849–852. [Google Scholar] [CrossRef]
- Volpp, J.; Vollertsen, F. Keyhole stability during laser welding—Part I: Modeling and evaluation. Prod. Eng. 2016, 10, 443–457. [Google Scholar] [CrossRef]
- Anisimov, S.I. Vaporization of Metal Absorbing Laser Radiation. J. Exp. Theor. Phys. 1968, 27, 182. [Google Scholar]


| Element | Ti | Al | V | Fe | O | C | N | H |
|---|---|---|---|---|---|---|---|---|
| Weight (%) | Balance | 5.5~6.8 | 3.5~4.5 | ≤0.30 | ≤0.20 | ≤0.10 | ≤0.05 | ≤0.015 |
| Line | Λ (nm) | Transitions | Excitation Energy (eV) | gk | Aki (s−1) | |
|---|---|---|---|---|---|---|
| Ek | Ei | |||||
| Ti I | 499.11 | 3.3194250 | 0.8359952 | 11 | 5.84 × 10⁷ | |
| Ti I | 500.10 | 4.4754008 | 1.9968989 | 7 | 3.65 × 10⁷ | |
| Ti I | 500.72 | 3.2935658 | 0.8181426 | 7 | 4.92 × 10⁷ | |
| Ti I | 506.47 | 2.4953137 | 0.0479663 | 7 | 4.37 × 10⁶ | |
| Ti I | 519.30 | 2.4079690 | 0.0210938 | 7 | 3.86 × 10⁶ | |
| Ti I | 521.04 | 2.4268635 | 0.0479663 | 9 | 3.89 × 10⁶ | |
| Ti II | 430.00 | 4.0626145 | 1.1801004 | 8 | 1.63 × 10⁷ | |
| V I | 440.82 | 3.0870583 | 0.2752643 | 6 | 5.1 × 10⁷ | |
| Laser Power (W) | Keyhole–Molten Pool Images | Plasma Spectrum | Weld Morphologies |
|---|---|---|---|
| 800 | 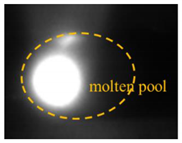 | 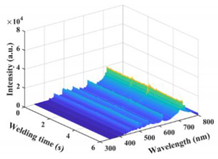 | 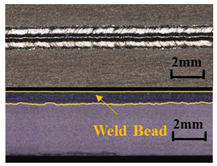 |
| 1100 | 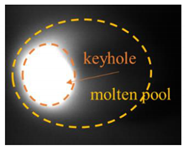 | 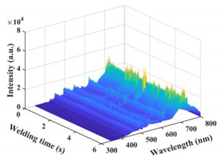 |  |
| 1200 | 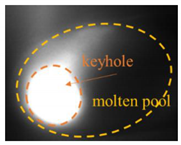 | 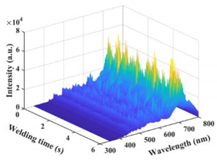 | 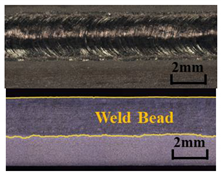 |
Disclaimer/Publisher’s Note: The statements, opinions and data contained in all publications are solely those of the individual author(s) and contributor(s) and not of MDPI and/or the editor(s). MDPI and/or the editor(s) disclaim responsibility for any injury to people or property resulting from any ideas, methods, instructions or products referred to in the content. |
© 2024 by the authors. Licensee MDPI, Basel, Switzerland. This article is an open access article distributed under the terms and conditions of the Creative Commons Attribution (CC BY) license (https://creativecommons.org/licenses/by/4.0/).
Share and Cite
She, K.; Li, D.; Yang, K.; Li, M.; Wu, B.; Yang, L.; Huang, Y. Online Detection of Laser Welding Penetration Depth Based on Multi-Sensor Features. Materials 2024, 17, 1580. https://doi.org/10.3390/ma17071580
She K, Li D, Yang K, Li M, Wu B, Yang L, Huang Y. Online Detection of Laser Welding Penetration Depth Based on Multi-Sensor Features. Materials. 2024; 17(7):1580. https://doi.org/10.3390/ma17071580
Chicago/Turabian StyleShe, Kun, Donghui Li, Kaisong Yang, Mingyu Li, Beile Wu, Lijun Yang, and Yiming Huang. 2024. "Online Detection of Laser Welding Penetration Depth Based on Multi-Sensor Features" Materials 17, no. 7: 1580. https://doi.org/10.3390/ma17071580
APA StyleShe, K., Li, D., Yang, K., Li, M., Wu, B., Yang, L., & Huang, Y. (2024). Online Detection of Laser Welding Penetration Depth Based on Multi-Sensor Features. Materials, 17(7), 1580. https://doi.org/10.3390/ma17071580