

Investigation of Mold Flux Entrapment in Deep Oscillation Mark of Interstitial-Free Steel Shell Using Mold Simulator

 ,
,
Abstract
1. Introduction
2. Experimental Materials and Apparatus
2.1. Materials
2.2. Mold Simulator
3. Results and Discussion
3.1. Temperature in Mold
3.2. Slag Film Structure
3.3. Heat Flux Analysis
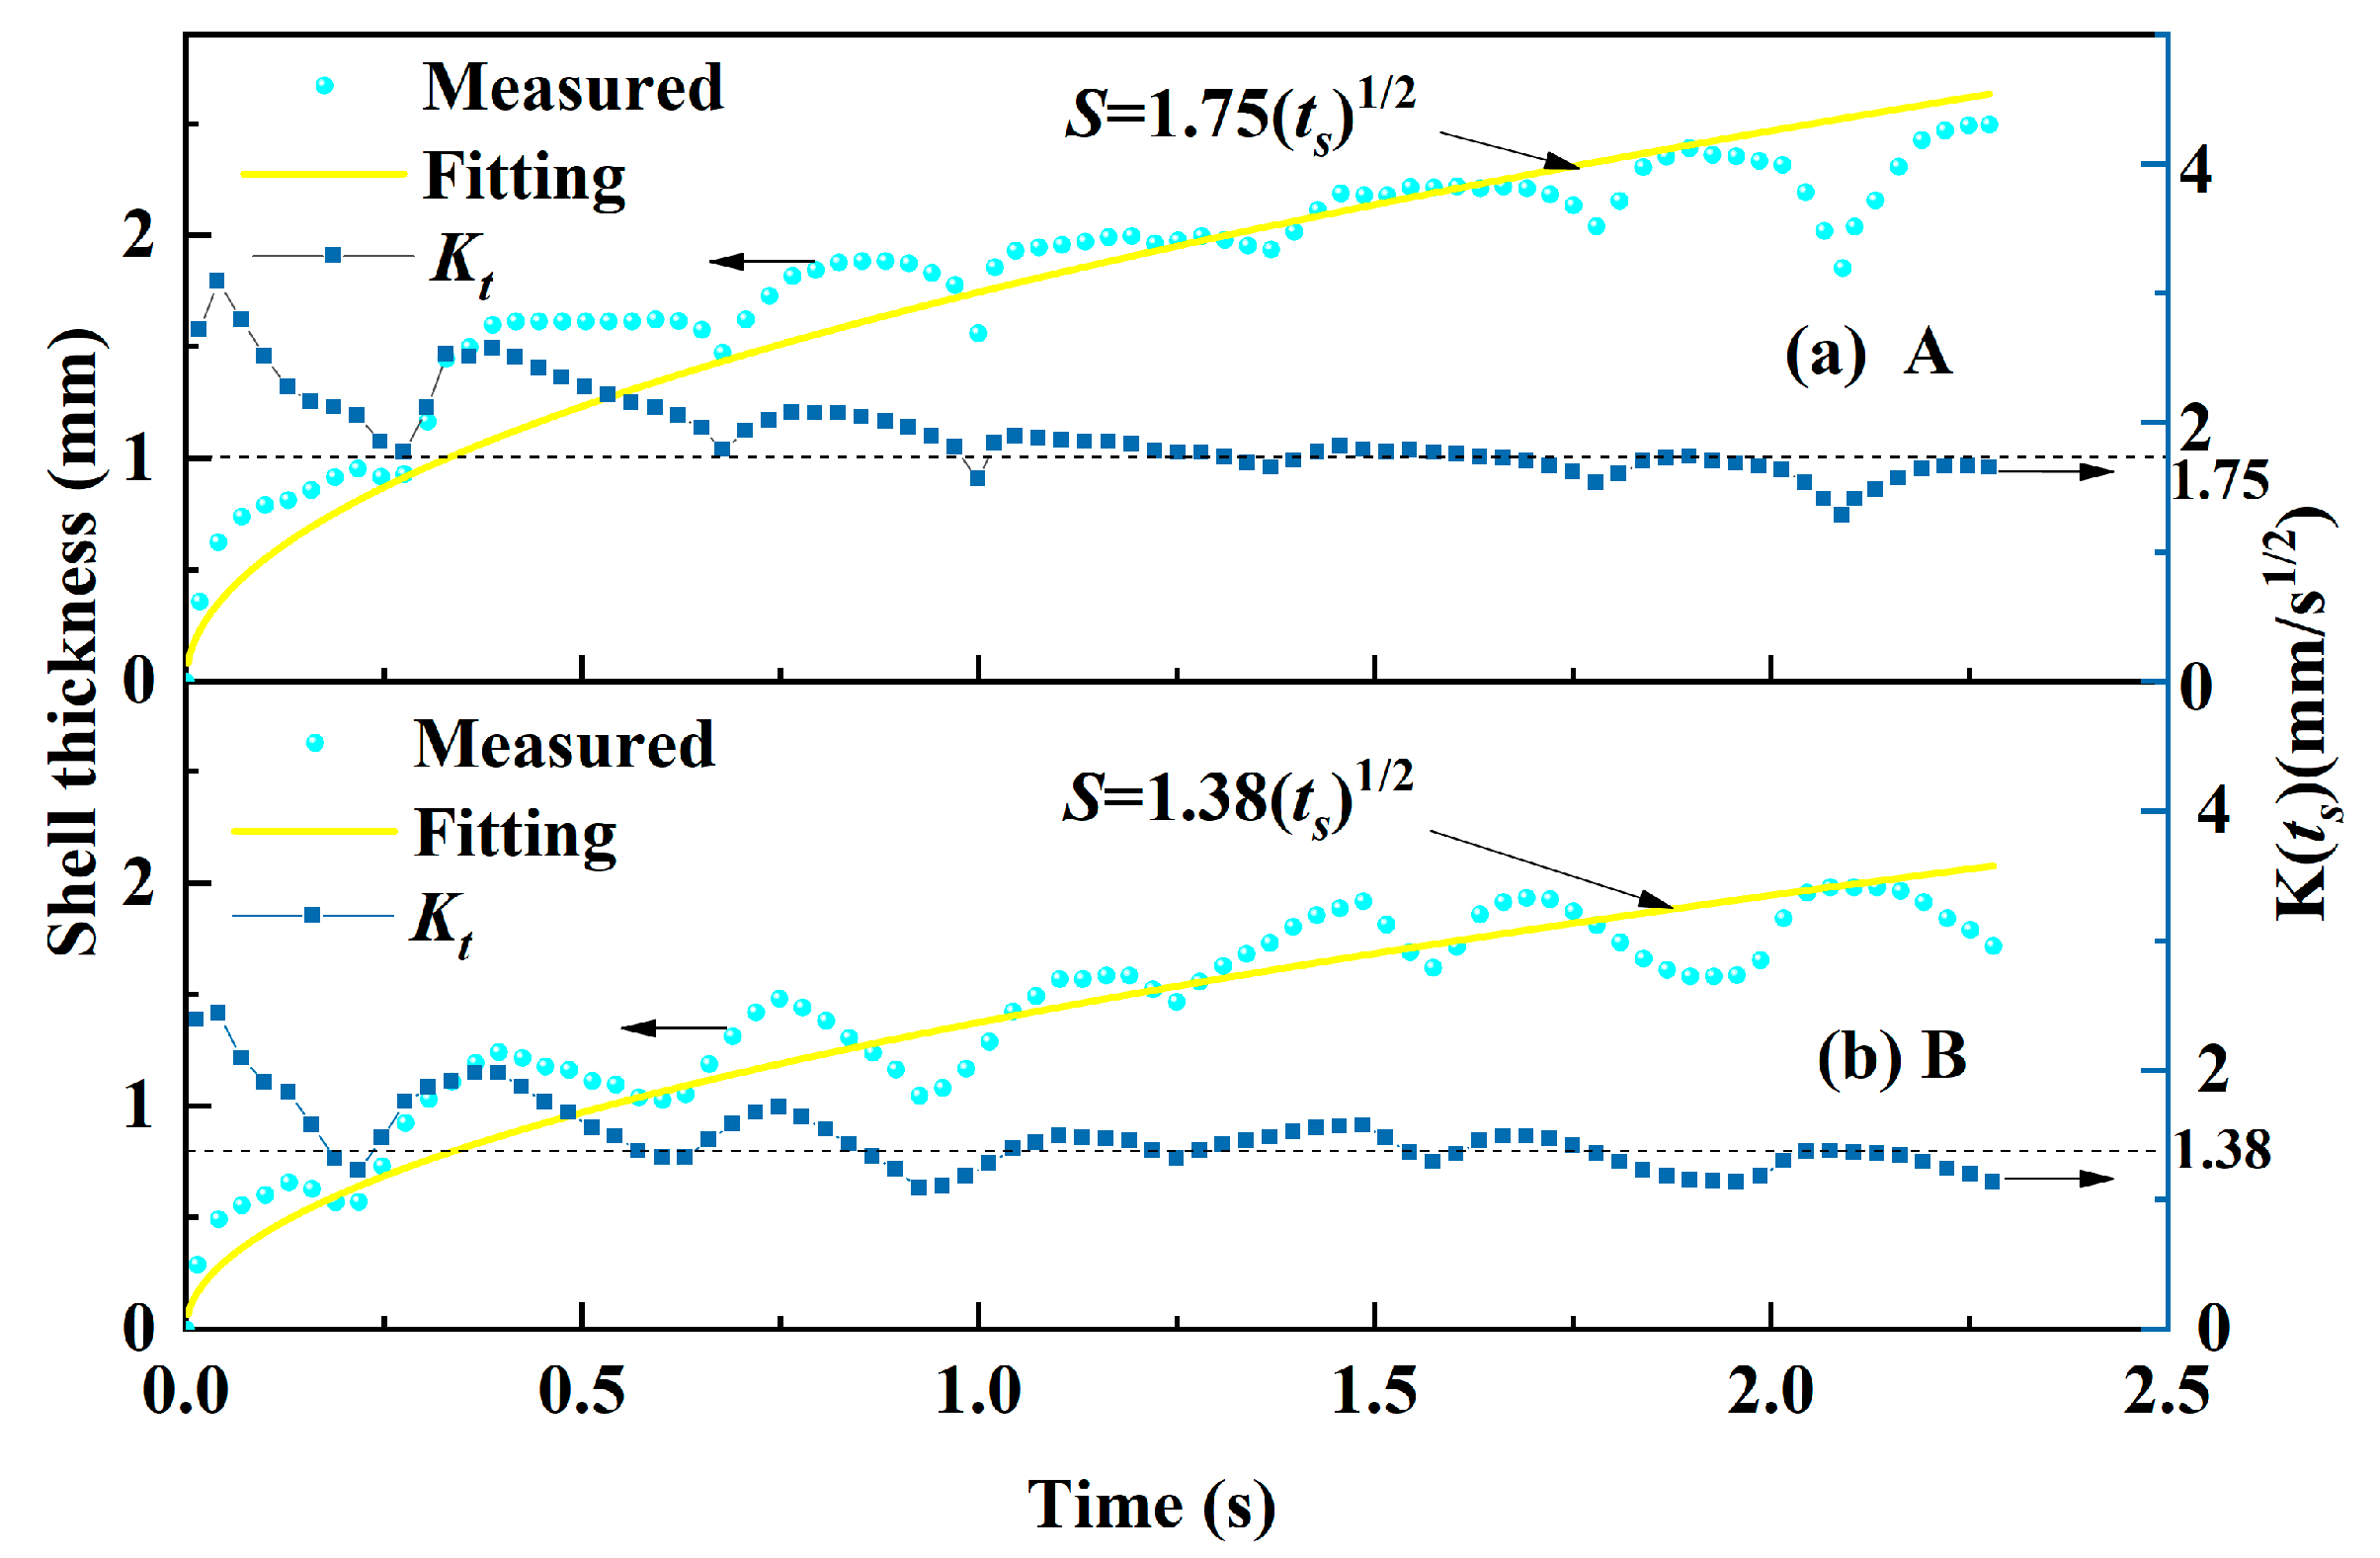
3.4. Solidified Shell Profile
4. Conclusions
- (1)
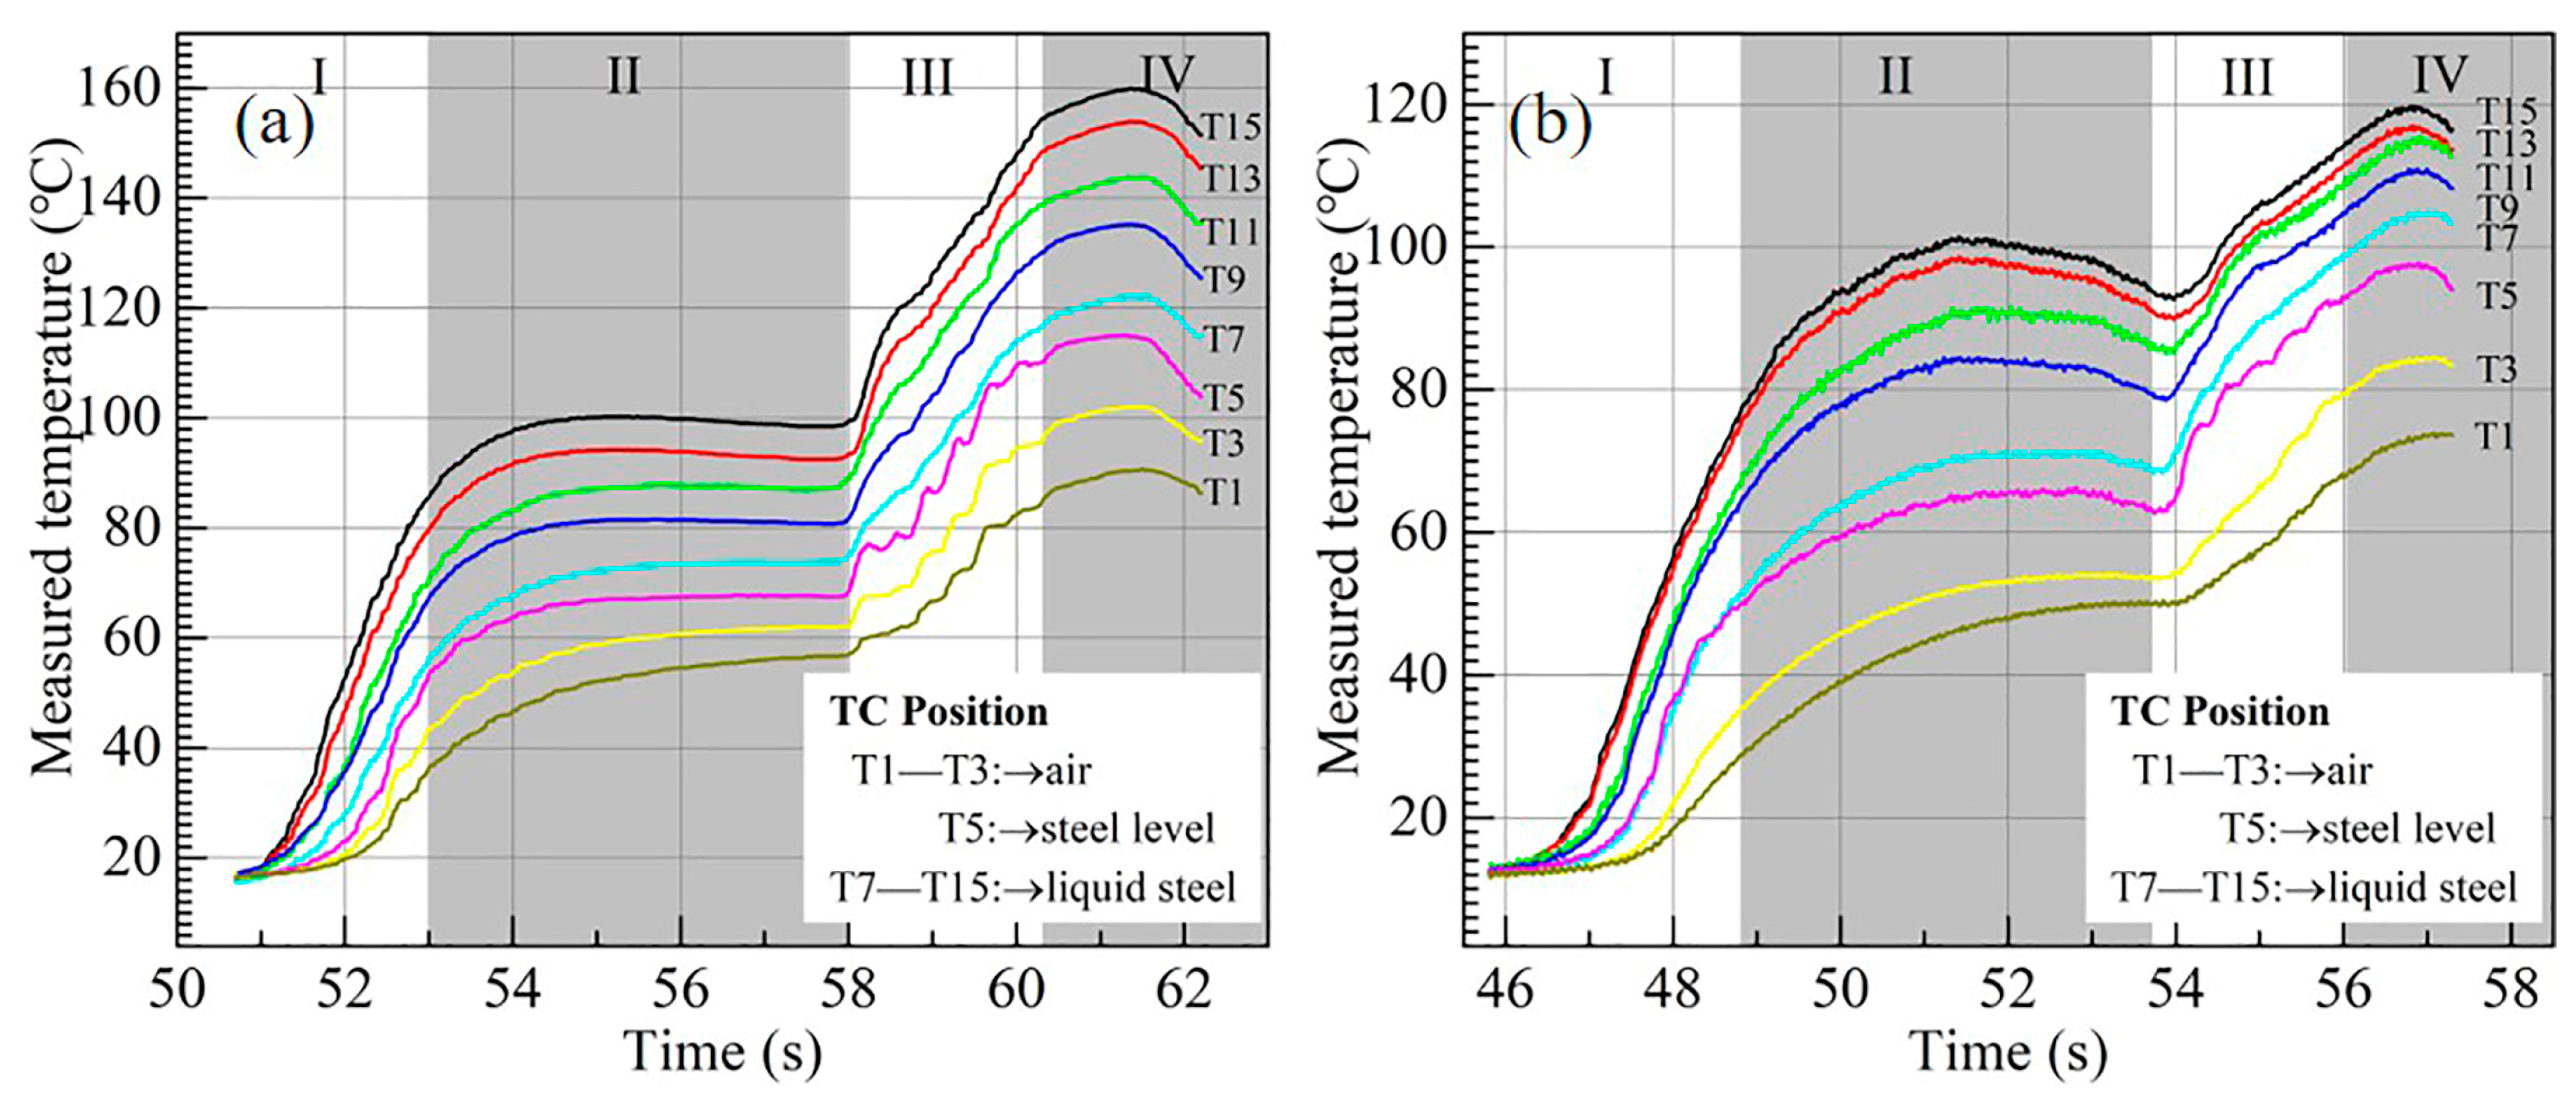
- The temperature in the copper mold becomes lower when mold flux B was used, compared with that when mold flux A was used. Also, the temperature fluctuation becomes weaker for mold flux B than that for mold flux A.
- (2)
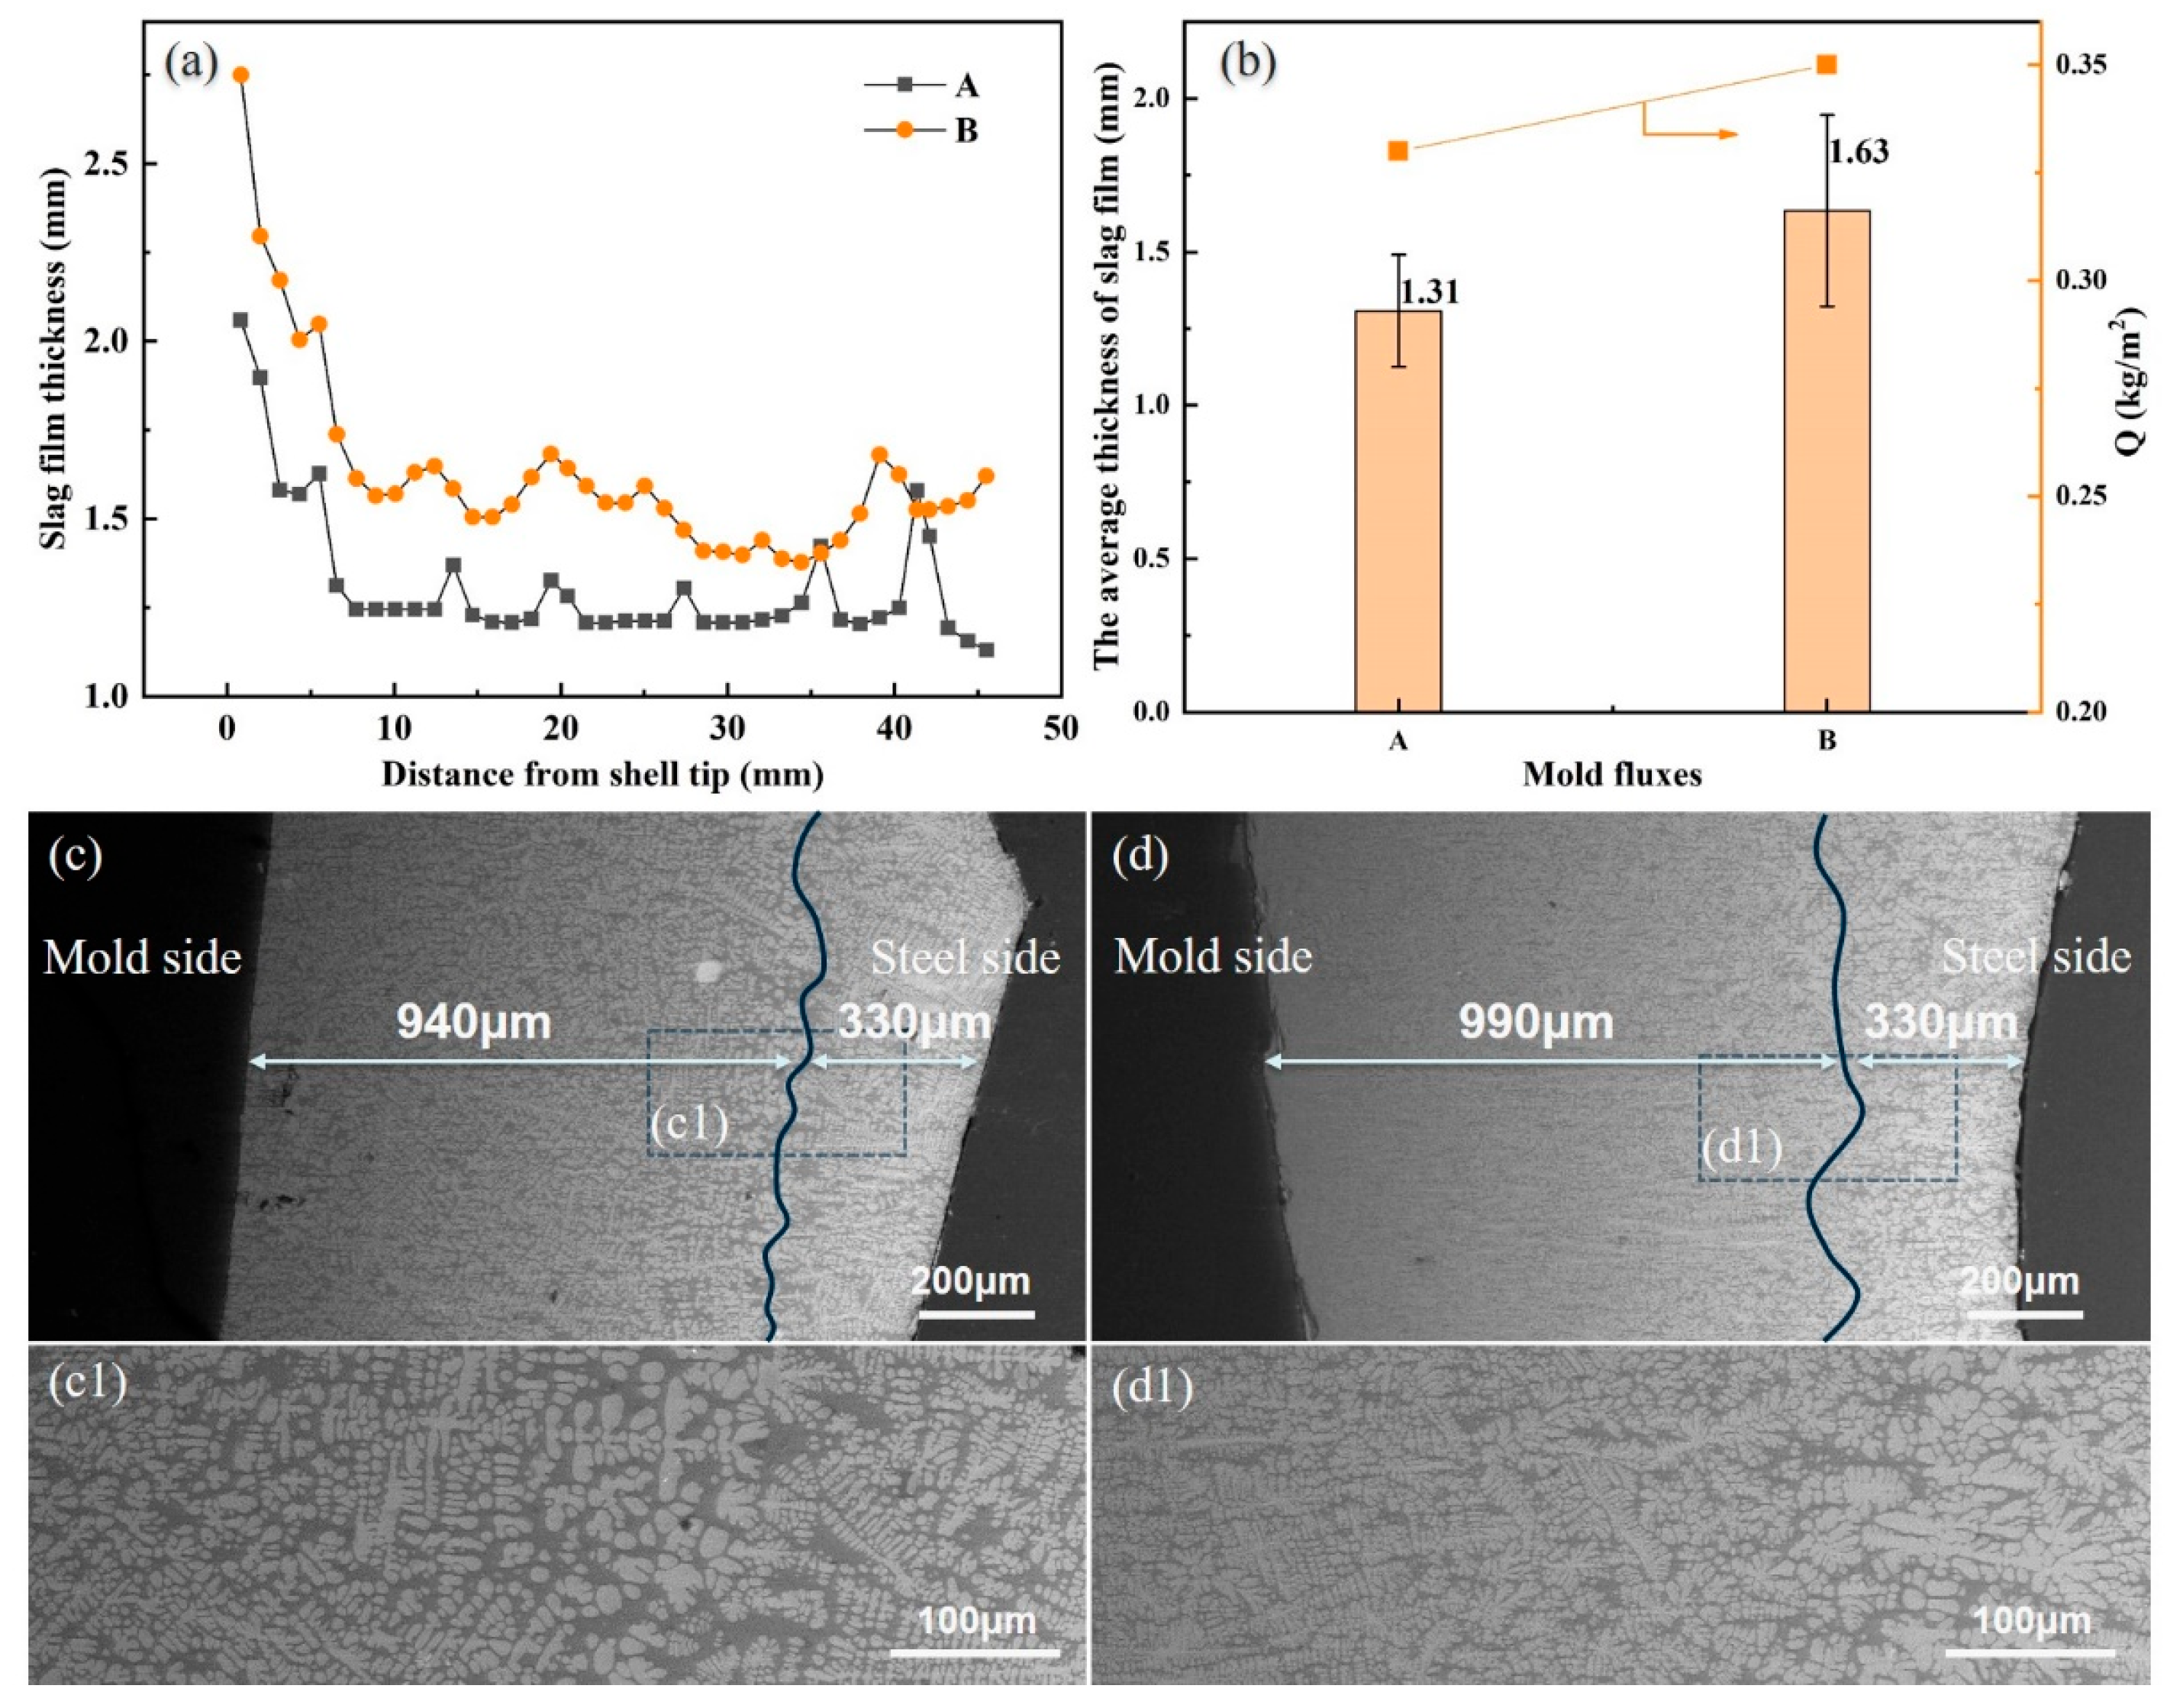
- The average thickness of slag films for mold fluxes A and B are 1.31 mm and 1.63 mm. The slag consumption of them is 0.33 kg/m2 and 0.35 kg/m2, respectively. So, both the average thickness and consumption of mold flux B are larger than mold flux A.
- (3)
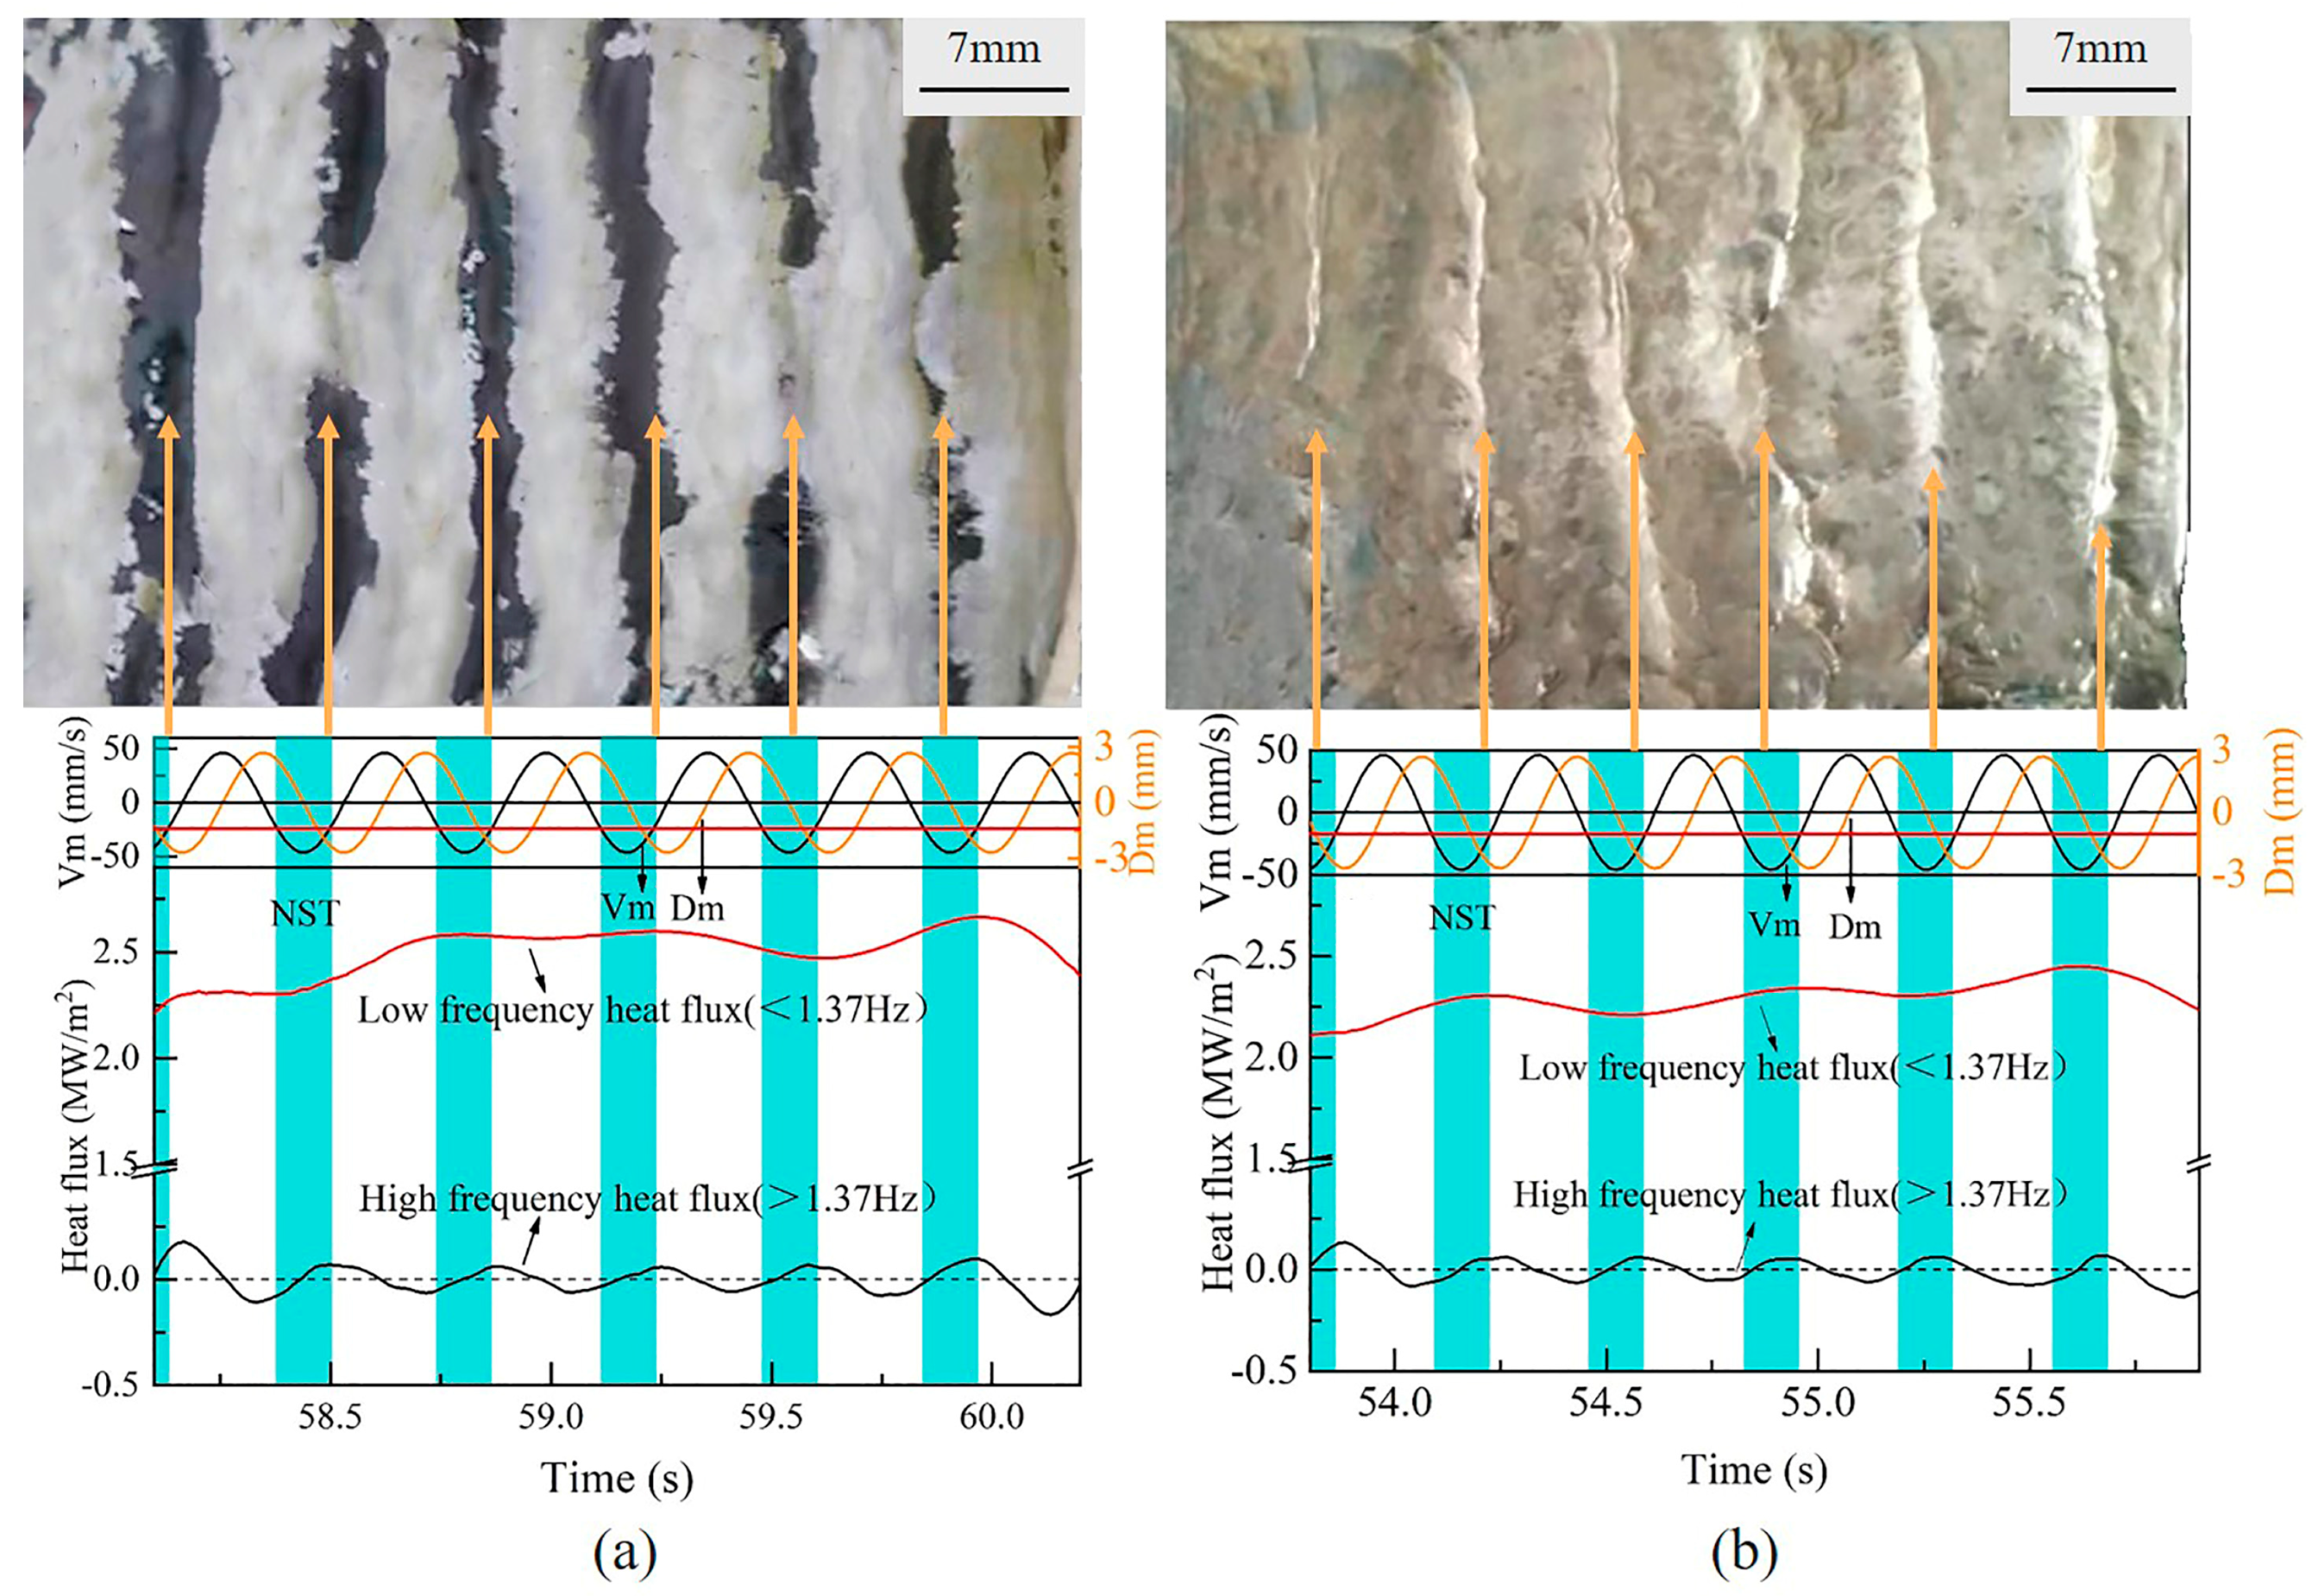
- The heat flux for mold flux B is smaller compared with that for mold flux A, and the amplitude of fluctuation in heat fluxes with both low frequency and high frequency for mold flux B is relative smaller than that for mold flux A. It is due to the thicker slag film and crystalline layer which has a stronger heat transfer control ability.
- (4)
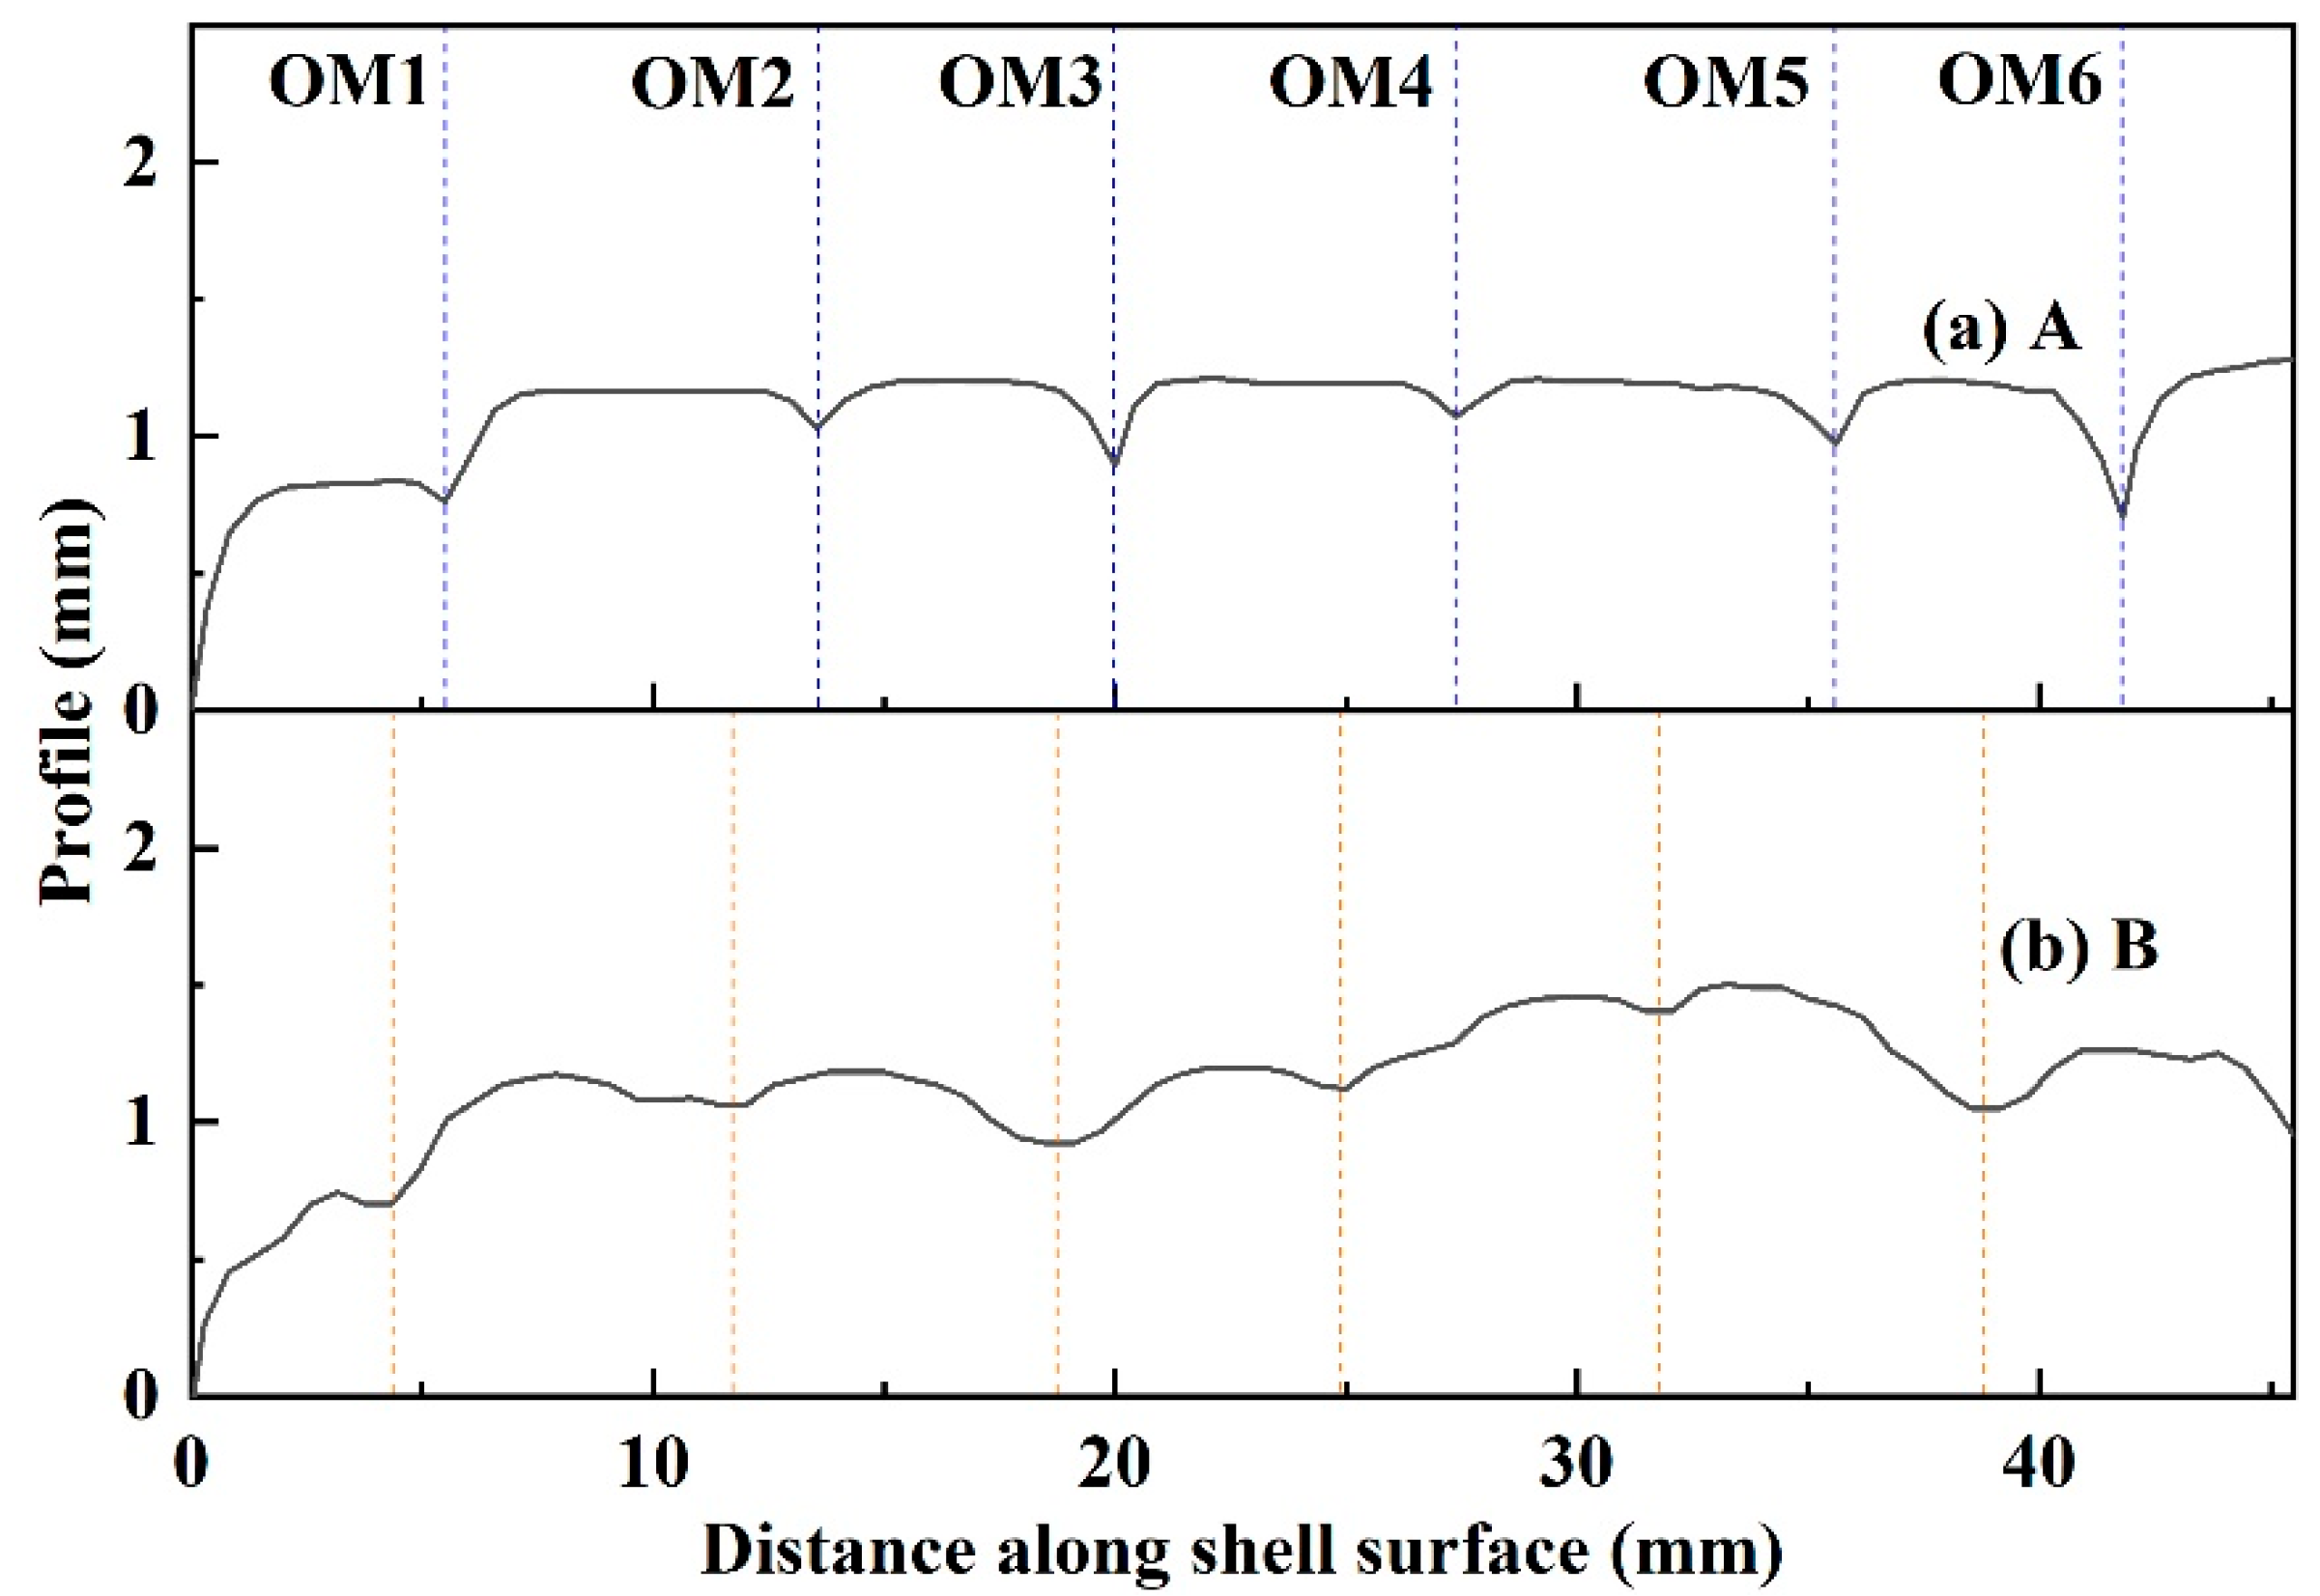
- The shell for mold flux A exhibits sharper oscillation marks, while the shell for mold flux B has shallower oscillation marks. The sharper and deeper oscillation marks for mold flux A capture a substance composed of Ca, Si, Al, Na and Mg, which are the main components of the mold flux.
- (5)
- From the results above, it can be concluded that the mechanism of slag entrapment in the oscillation mark mainly results from the formation of different thicknesses of the slag film and crystalline layer, which affects the heat transfer in the mold, and then leads to a deeper oscillation mark. Those deeper oscillation marks capture the mold flux and produce slag entrapment defect by overflow of molten steel at the meniscus.
Author Contributions
Funding
Institutional Review Board Statement
Informed Consent Statement
Data Availability Statement
Conflicts of Interest
References
- Hoile, S. Processing and Properties of Mild Interstitial Free Steels. Mater. Sci. Technol. 2000, 16, 1079–1093. [Google Scholar] [CrossRef]
- Davies, G. Materials for Automobile Bodies; Elsevier: Amsterdam, The Netherlands, 2012. [Google Scholar]
- Chakraborty, A.; Dutta, M.; Pais, R.; Ray, R.K. Analysis of an Uncommon Coating Defect on Industrial Galvannealed High Strength Interstitial Free Steel. Surf. Coat. Technol. 2010, 204, 3481–3489. [Google Scholar] [CrossRef]
- Pawar, S.; Chakraborty, S.; Giri, S.S.; Pandit, A. Study of Brown Patch Defect in Automotive Grade Interstitial Free Steel. J. Fail. Anal. Prev. 2023, 23, 636–642. [Google Scholar] [CrossRef]
- Kumar, A.; Choudhary, S.K.; Ajmani, S.K. Distribution of Macroinclusions across Slab Thickness. ISIJ Int. 2012, 52, 2305–2307. [Google Scholar] [CrossRef]
- Wang, Y.; Yang, S.; Wang, F.; Li, J. Optimization on Reducing Slag Entrapment in 150\times 1270 Mm Slab Continuous Casting Mold. Materials 2019, 12, 1774. [Google Scholar] [CrossRef]
- Mills, K.C.; Fox, A.B.; Li, Z.; Thackray, R.P. Performance and Properties of Mould Fluxes. Ironmak. Steelmak. 2005, 32, 26–34. [Google Scholar] [CrossRef]
- Cho, S.-M.; Thomas, B.G.; Kim, S.-H. Effect of Nozzle Port Angle on Transient Flow and Surface Slag Behavior During Continuous Steel-Slab Casting. Metall. Mater. Trans. B 2019, 50, 52–76. [Google Scholar] [CrossRef]
- Chougale, V.V.; Kumar, S.; Rajendra, T.; Balachandran, G. Effect of SEN Immersion Depth on Mold Flow Profile and Slag Entrapment during Continuous Casting of Steel. Metall. Mater. Eng. 2021, 27, 557–573. [Google Scholar]
- Zhang, X.; Ren, Y.; Zhang, L. Influence of Casting Parameters on Hooks and Entrapped Inclusions at the Subsurface of Continuous Casting Slabs. Metall. Mater. Trans. A 2018, 49, 5469–5477. [Google Scholar] [CrossRef]
- Sengupta, J.; Thomas, B.G.; Shin, H.-J.; Lee, G.-G.; Kim, S.-H. A New Mechanism of Hook Formation during Continuous Casting of Ultra-Low-Carbon Steel Slabs. Metall. Mater. Trans. A 2006, 37, 1597–1611. [Google Scholar] [CrossRef]
- Kaushik, P.; Kruse, D.; Ozgu, M. Assessment of castability issues in interstitial-free (IF) steels. Rev. Met. 2008, 105, 92–101. [Google Scholar] [CrossRef]
- Shin, H.-J.; Kim, S.-H.; Thomas, B.G.; Lee, G.-G.; Park, J.-M.; Sengupta, J. Measurement and Prediction of Lubrication, Powder Consumption, and Oscillation Mark Profiles in Ultra-Low Carbon Steel Slabs. ISIJ Int. 2006, 46, 1635–1644. [Google Scholar] [CrossRef]
- Cho, S.M.; Thomas, B.G. Electromagnetic Effects on Solidification Defect Formation in Continuous Steel Casting. JOM 2020, 72, 3610–3627. [Google Scholar] [CrossRef]
- Deng, X.; Ji, C.; Cui, Y.; Tian, Z.; Yin, X.; Shao, X.; Yang, Y.; McLean, A. Formation and Evolution of Macro Inclusions in IF Steels during Continuous Casting. Ironmak. Steelmak. 2017, 44, 739–749. [Google Scholar] [CrossRef]
- Wang, D.; Jiang, M.; Matsuura, H.; Tsukihashi, F. Dynamic Evolution of Inclusions in Ti-Bearing Al-Deoxidized Molten Irons at 1873 K. Steel Res. Int. 2014, 85, 16–25. [Google Scholar] [CrossRef]
- GB/T 5213-2008; Cold Rolled Low Carbon Steel Sheet and Strip. Standardization Administration of the People’s Republic of China: Beijing, China, 2008. (In Chinese)
- Zhou, L.; Wang, W.; Zhou, K.; Zhang, C. An Investigation of the Mold-Flux Performance for the Casting of Cr12MoV Steel Using a Mold Simulator Technique. Metall. Mater. Trans. B 2017, 48, 2017–2026. [Google Scholar] [CrossRef]
- Yoon, D.; Cho, J.; Kim, S. Assessment of Heat Transfer Through Mold Slag Film Considering Radiative Absorption Behavior of Mold Fluxes. Met. Mater. Int. 2015, 21, 580–587. [Google Scholar] [CrossRef]
- Nakada, H.; Susa, M.; Seko, Y.; Hayashi, M.; Nagata, K. Mechanism of Heat Transfer Reduction by Crystallization of Mold Flux for Continuous Casting. ISIJ Int. 2008, 48, 446–453. [Google Scholar] [CrossRef]
- Cho, J.; Shibata, H.; Emi, T.; Suzuki, M. Thermal Resistance at the Interface between Mold Flux Film and Mold for Continuous Casting of Steels. ISIJ Int. 1998, 38, 440–446. [Google Scholar] [CrossRef]
- Zhou, L.; Wang, W.; Wei, J.; Zhou, K. Melting and Heat Transfer Behavior of Fluorine-Free Mold Fluxes for Casting Medium Carbon Steels. ISIJ Int. 2015, 55, 821–829. [Google Scholar] [CrossRef]
- Badri, A.; Natarajan, T.T.; Snyder, C.C.; Powers, K.D.; Mannion, F.J.; Byrne, M.; Cramb, A.W. A Mold Simulator for Continuous Casting of Steel: Part II. The Formation of Oscillation Marks during the Continuous Casting of Low Carbon Steel. Metall. Mater. Trans. B 2005, 36, 373–383. [Google Scholar] [CrossRef]
- Zhou, L.; Wang, W.; Wei, J.; Jin, M. Effect of Na2O and B2O3 on Heat Transfer Behavior of Low Fluorine Mold Flux for Casting Medium Carbon Steels. ISIJ Int. 2013, 53, 665–672. [Google Scholar] [CrossRef][Green Version]
- Emi, T. Influence of Physical and Chemical Properties of Mold Powders on the Solidification and Occurrence of Surface Defects of Strand Cast Slabs. Steelmak. Proc. 1978, 61, 350–360. [Google Scholar]
- Zhou, L.; Zhu, C.; Zhou, L. Initial Solidification and Its Related Heat Transfer Phenomena in the Continuous Casting Mold. Steel Res. Int. 2017, 88, 1600488. [Google Scholar]


| C | Mn | P | S | Altot | Ti |
|---|---|---|---|---|---|
| ≤0.0025 | ≤0.14 | ≤0.014 | ≤0.006 | 0.03–0.08 | 0.06–0.09 |
| Mold Flux | CaO | SiO2 | Al2O3 | Na2O | MgO | F | Melting Temperature Range (°C) | Viscosity at 1300 °C (Pa·s) | Break Temperature (°C) |
|---|---|---|---|---|---|---|---|---|---|
| A | 37–42 | 42–46 | 4–6 | 2.5–3.5 | 1–1.6 | 7 | 1113–1328 | 0.53 | 1171 |
| B | 32–39 | 36–43 | 4–6 | 3.5–6 | 2–3 | 4–7 | 1096–1323 | 0.44 | 1192 |
| Pouring Temperature (°C) | Casting Speed (m/min) | Frequency (cpm) | Stroke (mm) |
|---|---|---|---|
| 1563 | 1.2 | 164 (2.73 Hz) | 4.6 |
| OM1 | OM2 | OM3 | OM4 | OM5 | OM6 | Ave. | STD | ||
|---|---|---|---|---|---|---|---|---|---|
| Depth (mm) | A | 0.08 | 0.19 | 0.30 | 0.13 | 0.21 | 0.55 | 0.24 | 0.15 |
| B | 0.08 | 0.20 | 0.40 | 0.07 | 0.15 | 0.30 | 0.20 | 0.12 |
Disclaimer/Publisher’s Note: The statements, opinions and data contained in all publications are solely those of the individual author(s) and contributor(s) and not of MDPI and/or the editor(s). MDPI and/or the editor(s) disclaim responsibility for any injury to people or property resulting from any ideas, methods, instructions or products referred to in the content. |
© 2024 by the authors. Licensee MDPI, Basel, Switzerland. This article is an open access article distributed under the terms and conditions of the Creative Commons Attribution (CC BY) license (https://creativecommons.org/licenses/by/4.0/).
Share and Cite
Yan, X.; Wang, W.; Zhou, L.; Zhong, X.; Lin, H.; Liu, X.; Zeng, S.; Zhang, L. Investigation of Mold Flux Entrapment in Deep Oscillation Mark of Interstitial-Free Steel Shell Using Mold Simulator. Materials 2024, 17, 1435. https://doi.org/10.3390/ma17061435
Yan X, Wang W, Zhou L, Zhong X, Lin H, Liu X, Zeng S, Zhang L. Investigation of Mold Flux Entrapment in Deep Oscillation Mark of Interstitial-Free Steel Shell Using Mold Simulator. Materials. 2024; 17(6):1435. https://doi.org/10.3390/ma17061435
Chicago/Turabian StyleYan, Xiong, Wanlin Wang, Lejun Zhou, Xiaocan Zhong, Hongliang Lin, Xiaokang Liu, Sibao Zeng, and Liwu Zhang. 2024. "Investigation of Mold Flux Entrapment in Deep Oscillation Mark of Interstitial-Free Steel Shell Using Mold Simulator" Materials 17, no. 6: 1435. https://doi.org/10.3390/ma17061435
APA StyleYan, X., Wang, W., Zhou, L., Zhong, X., Lin, H., Liu, X., Zeng, S., & Zhang, L. (2024). Investigation of Mold Flux Entrapment in Deep Oscillation Mark of Interstitial-Free Steel Shell Using Mold Simulator. Materials, 17(6), 1435. https://doi.org/10.3390/ma17061435