
Test Rig for Investigating the Functional and Structural Fatigue of Shape Memory Alloy Wires Based on Different Activation Profiles


Abstract
:1. Introduction
2. Shape Memory Alloys
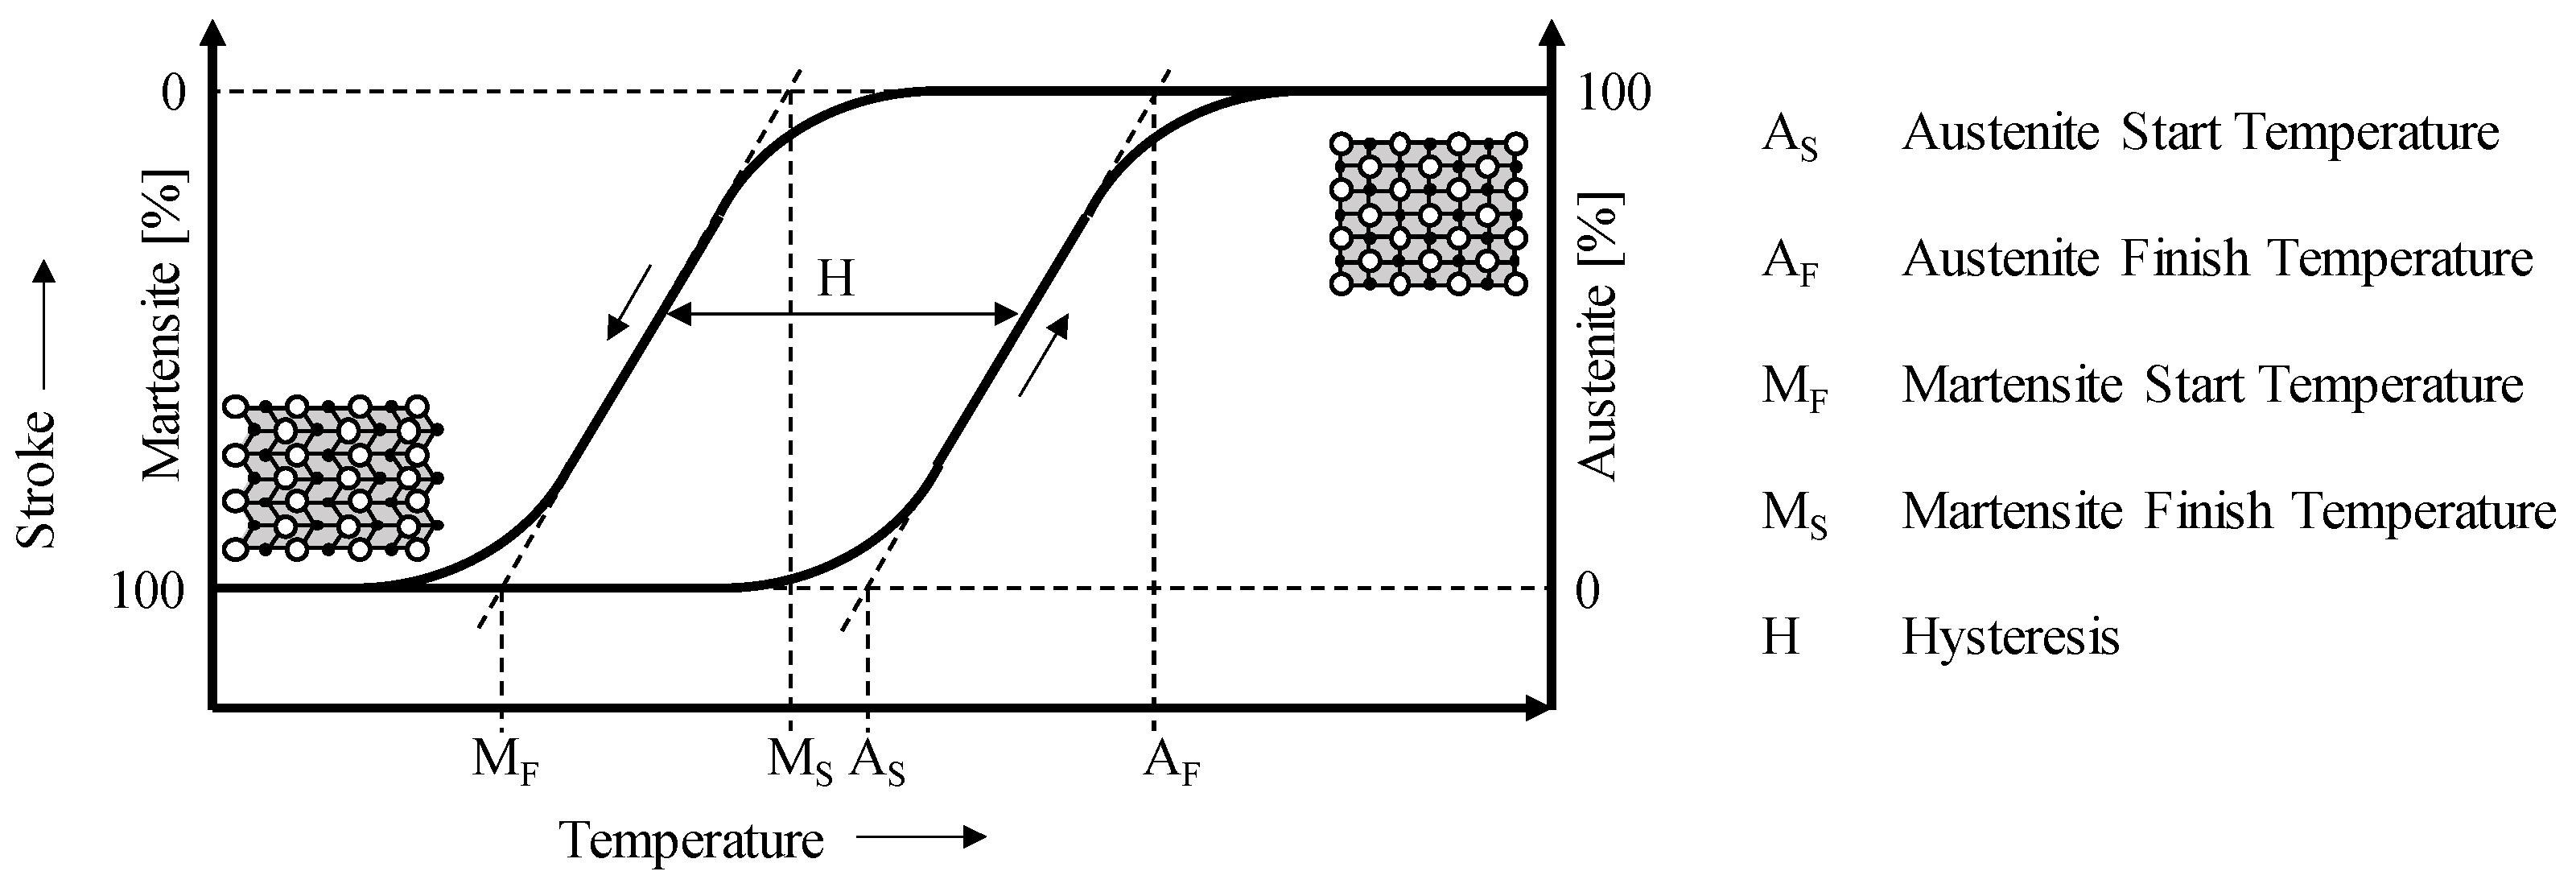
2.1. Phase Transformation of SMAs
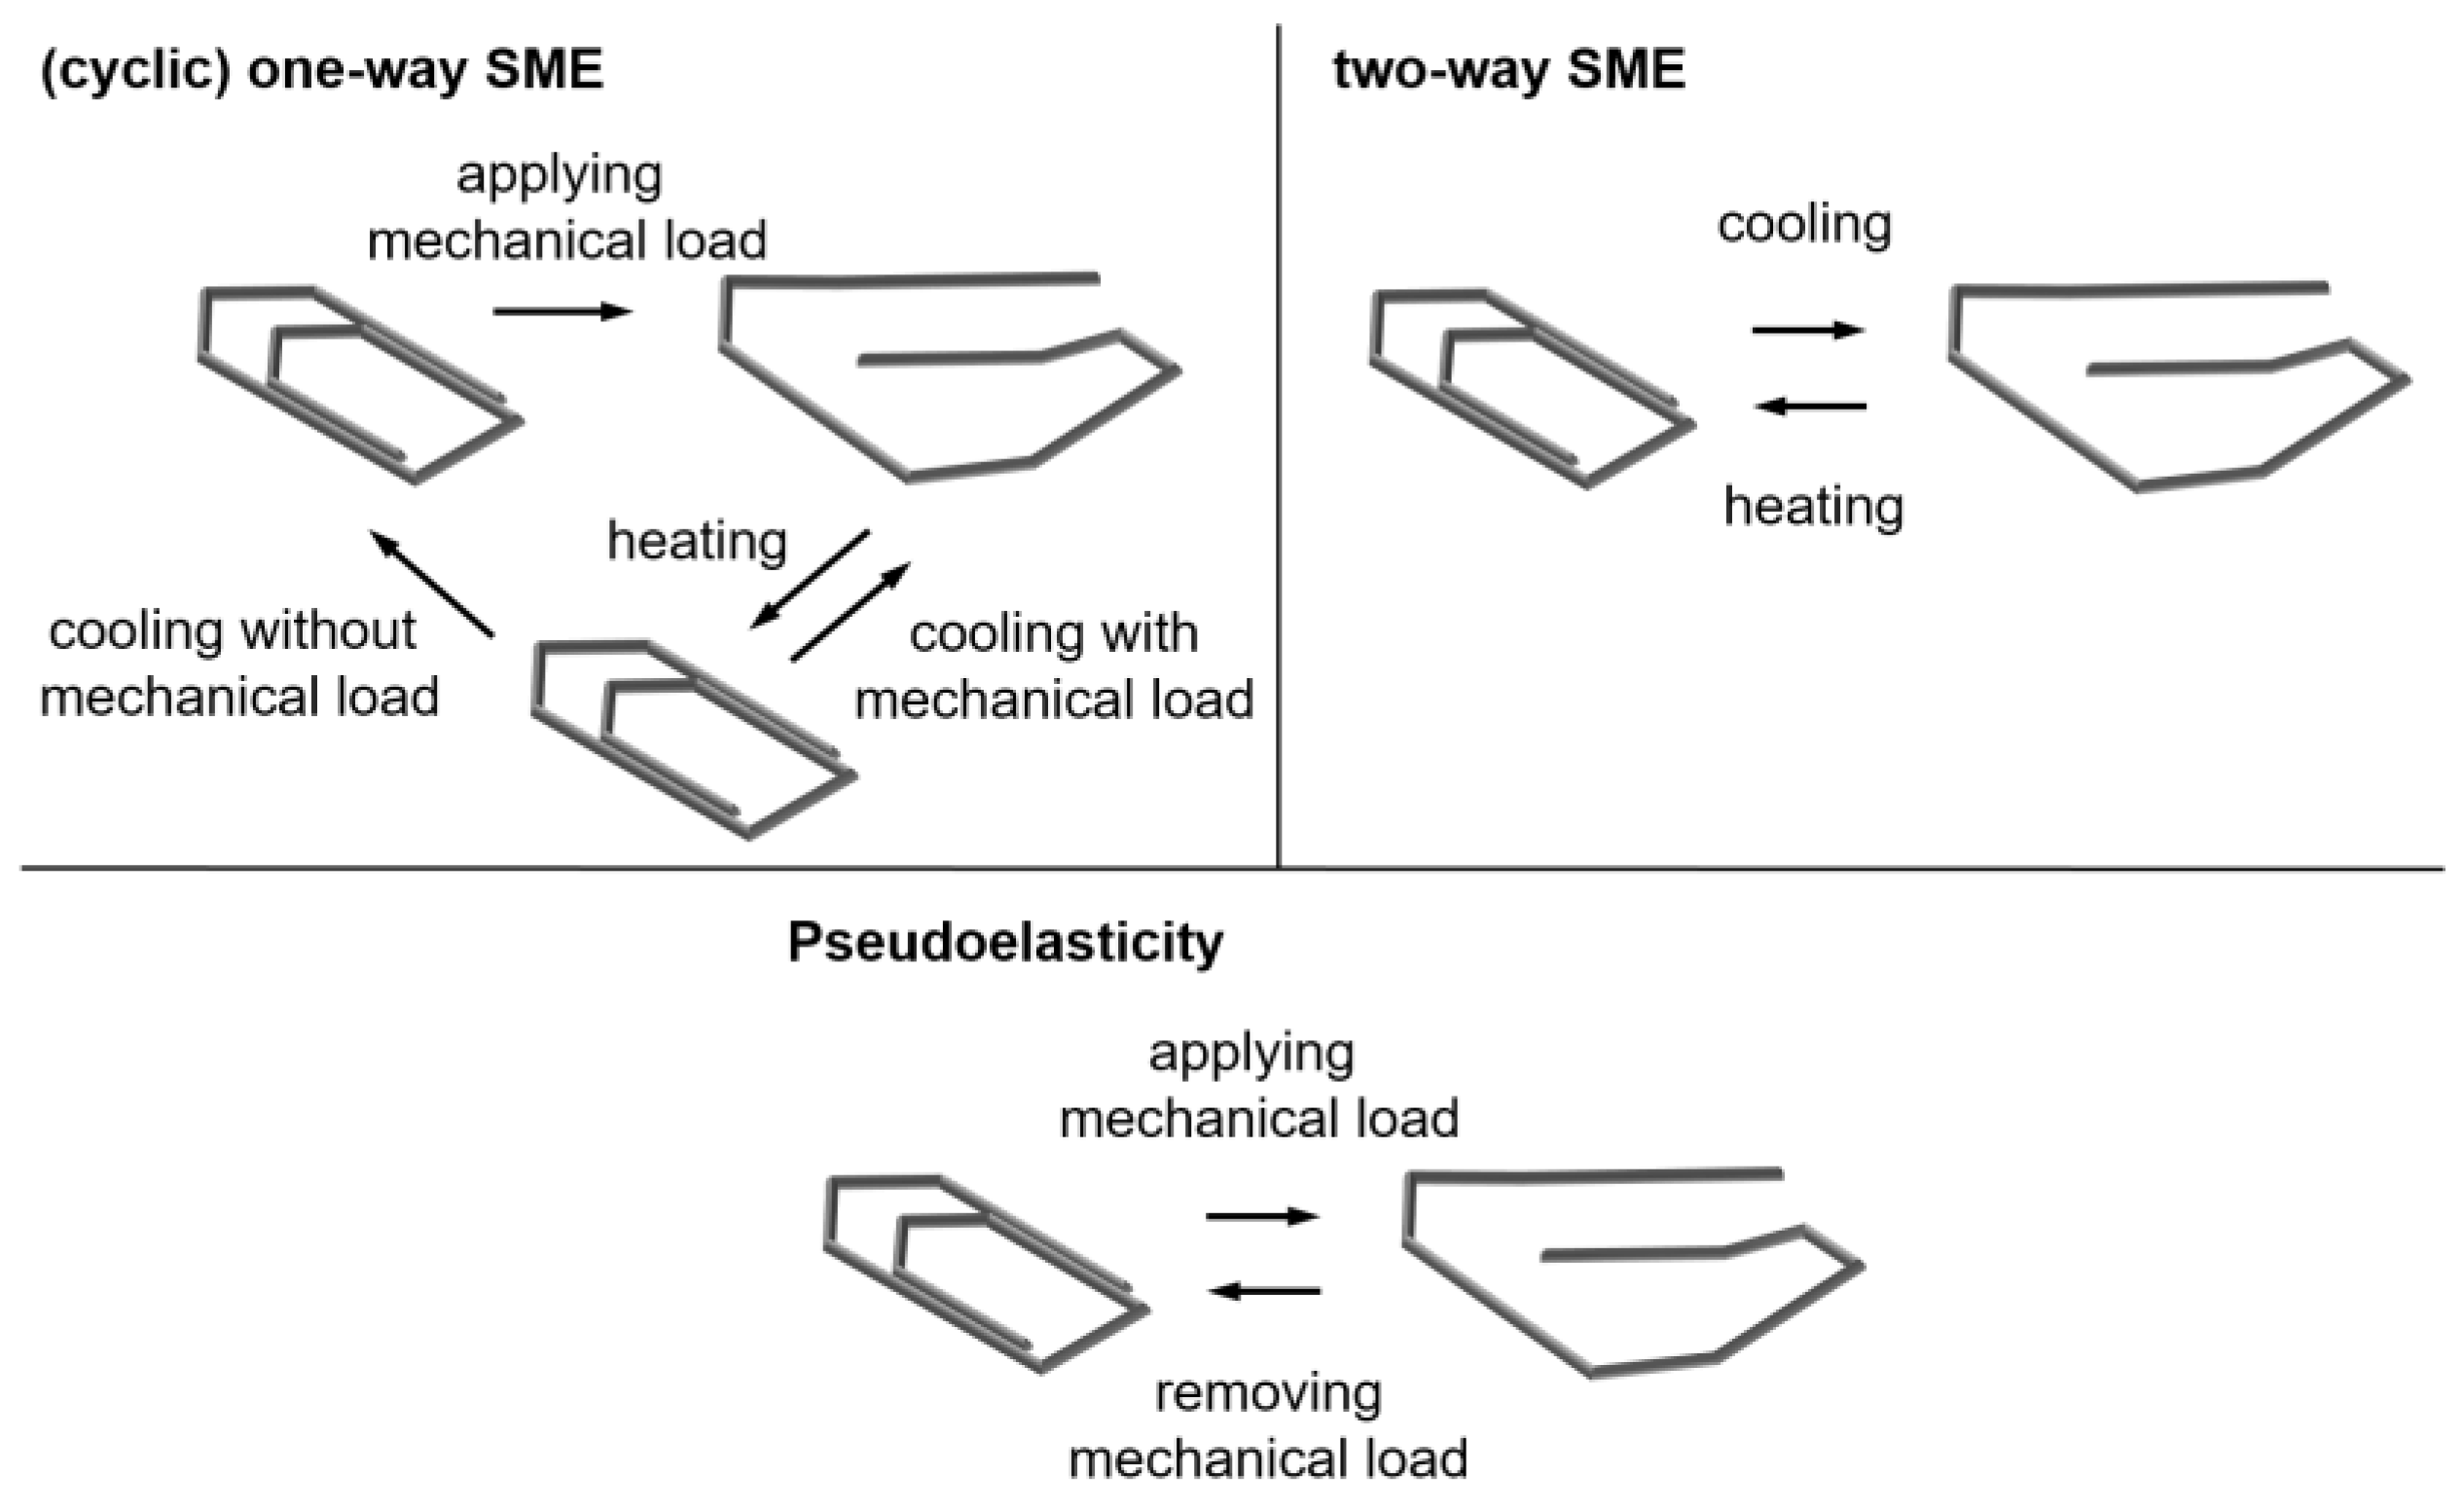
2.2. Shape Memory Effects
2.3. Fatigue Behavior
2.4. Activation Profiles—State of the Art
3. Design and Development of the Test Rig
3.1. Requirements for the New Test Rig
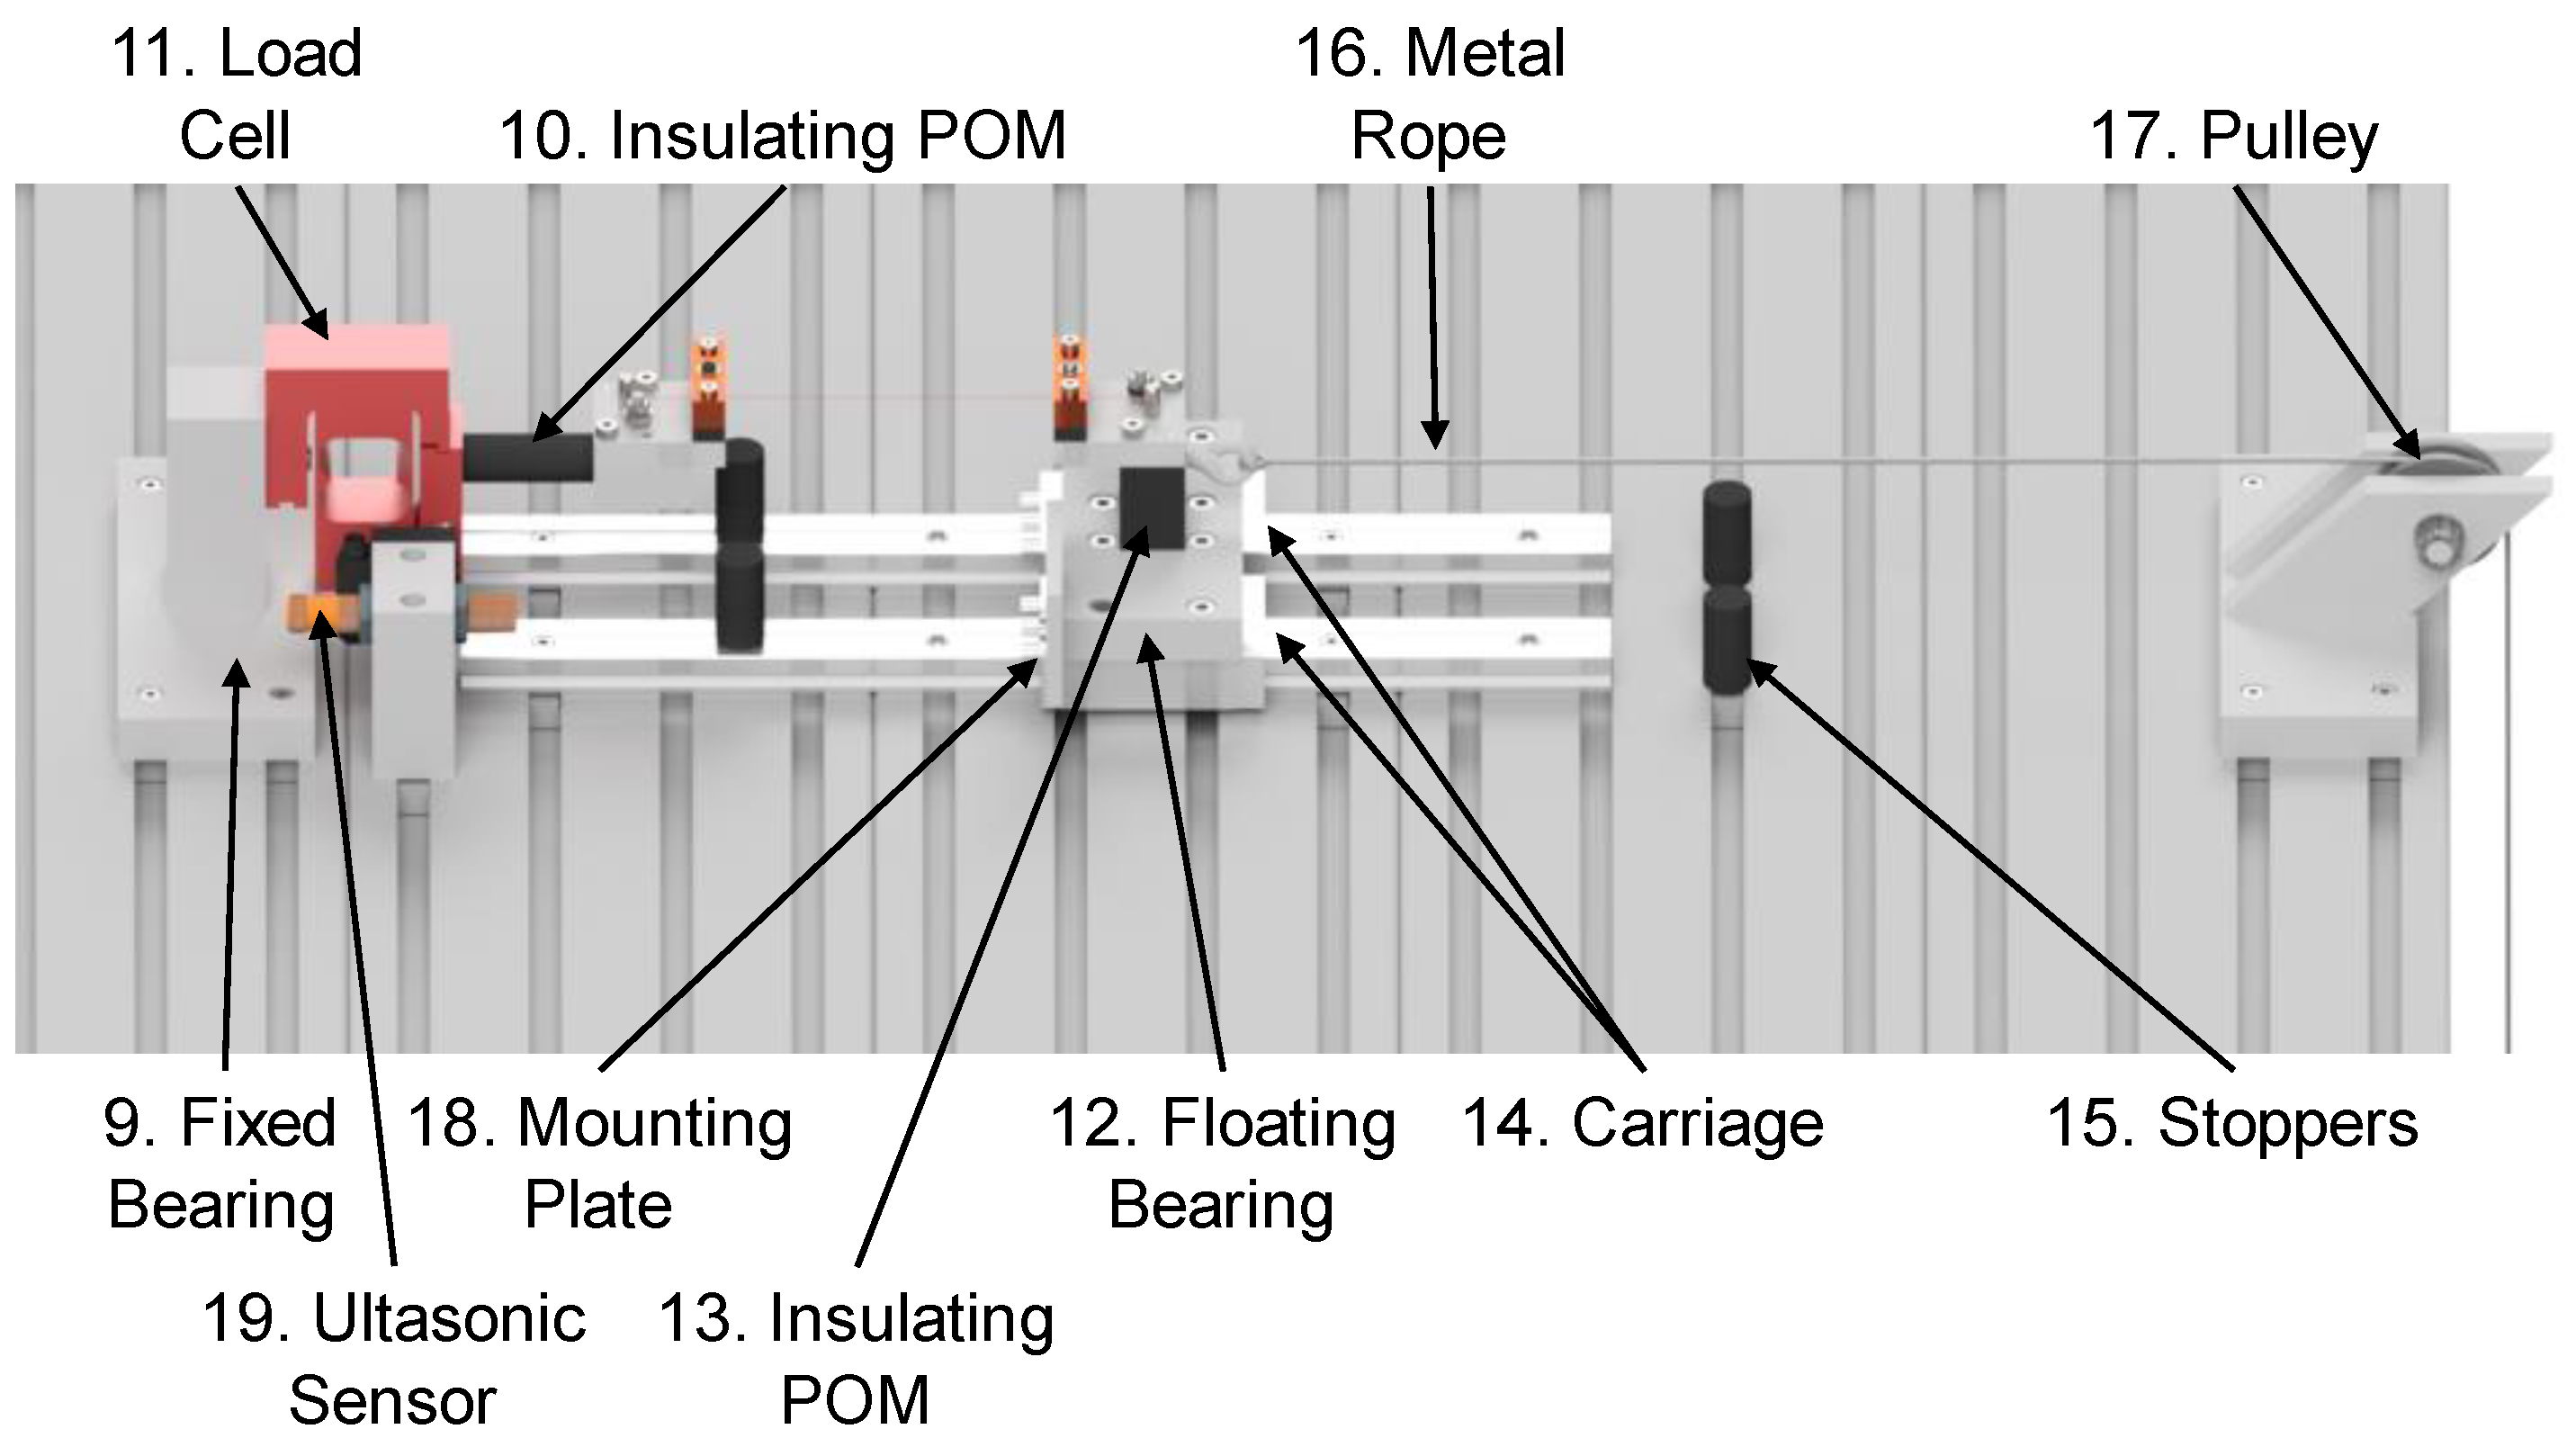
3.2. Final Mechanical Design
3.3. Sensor Technology
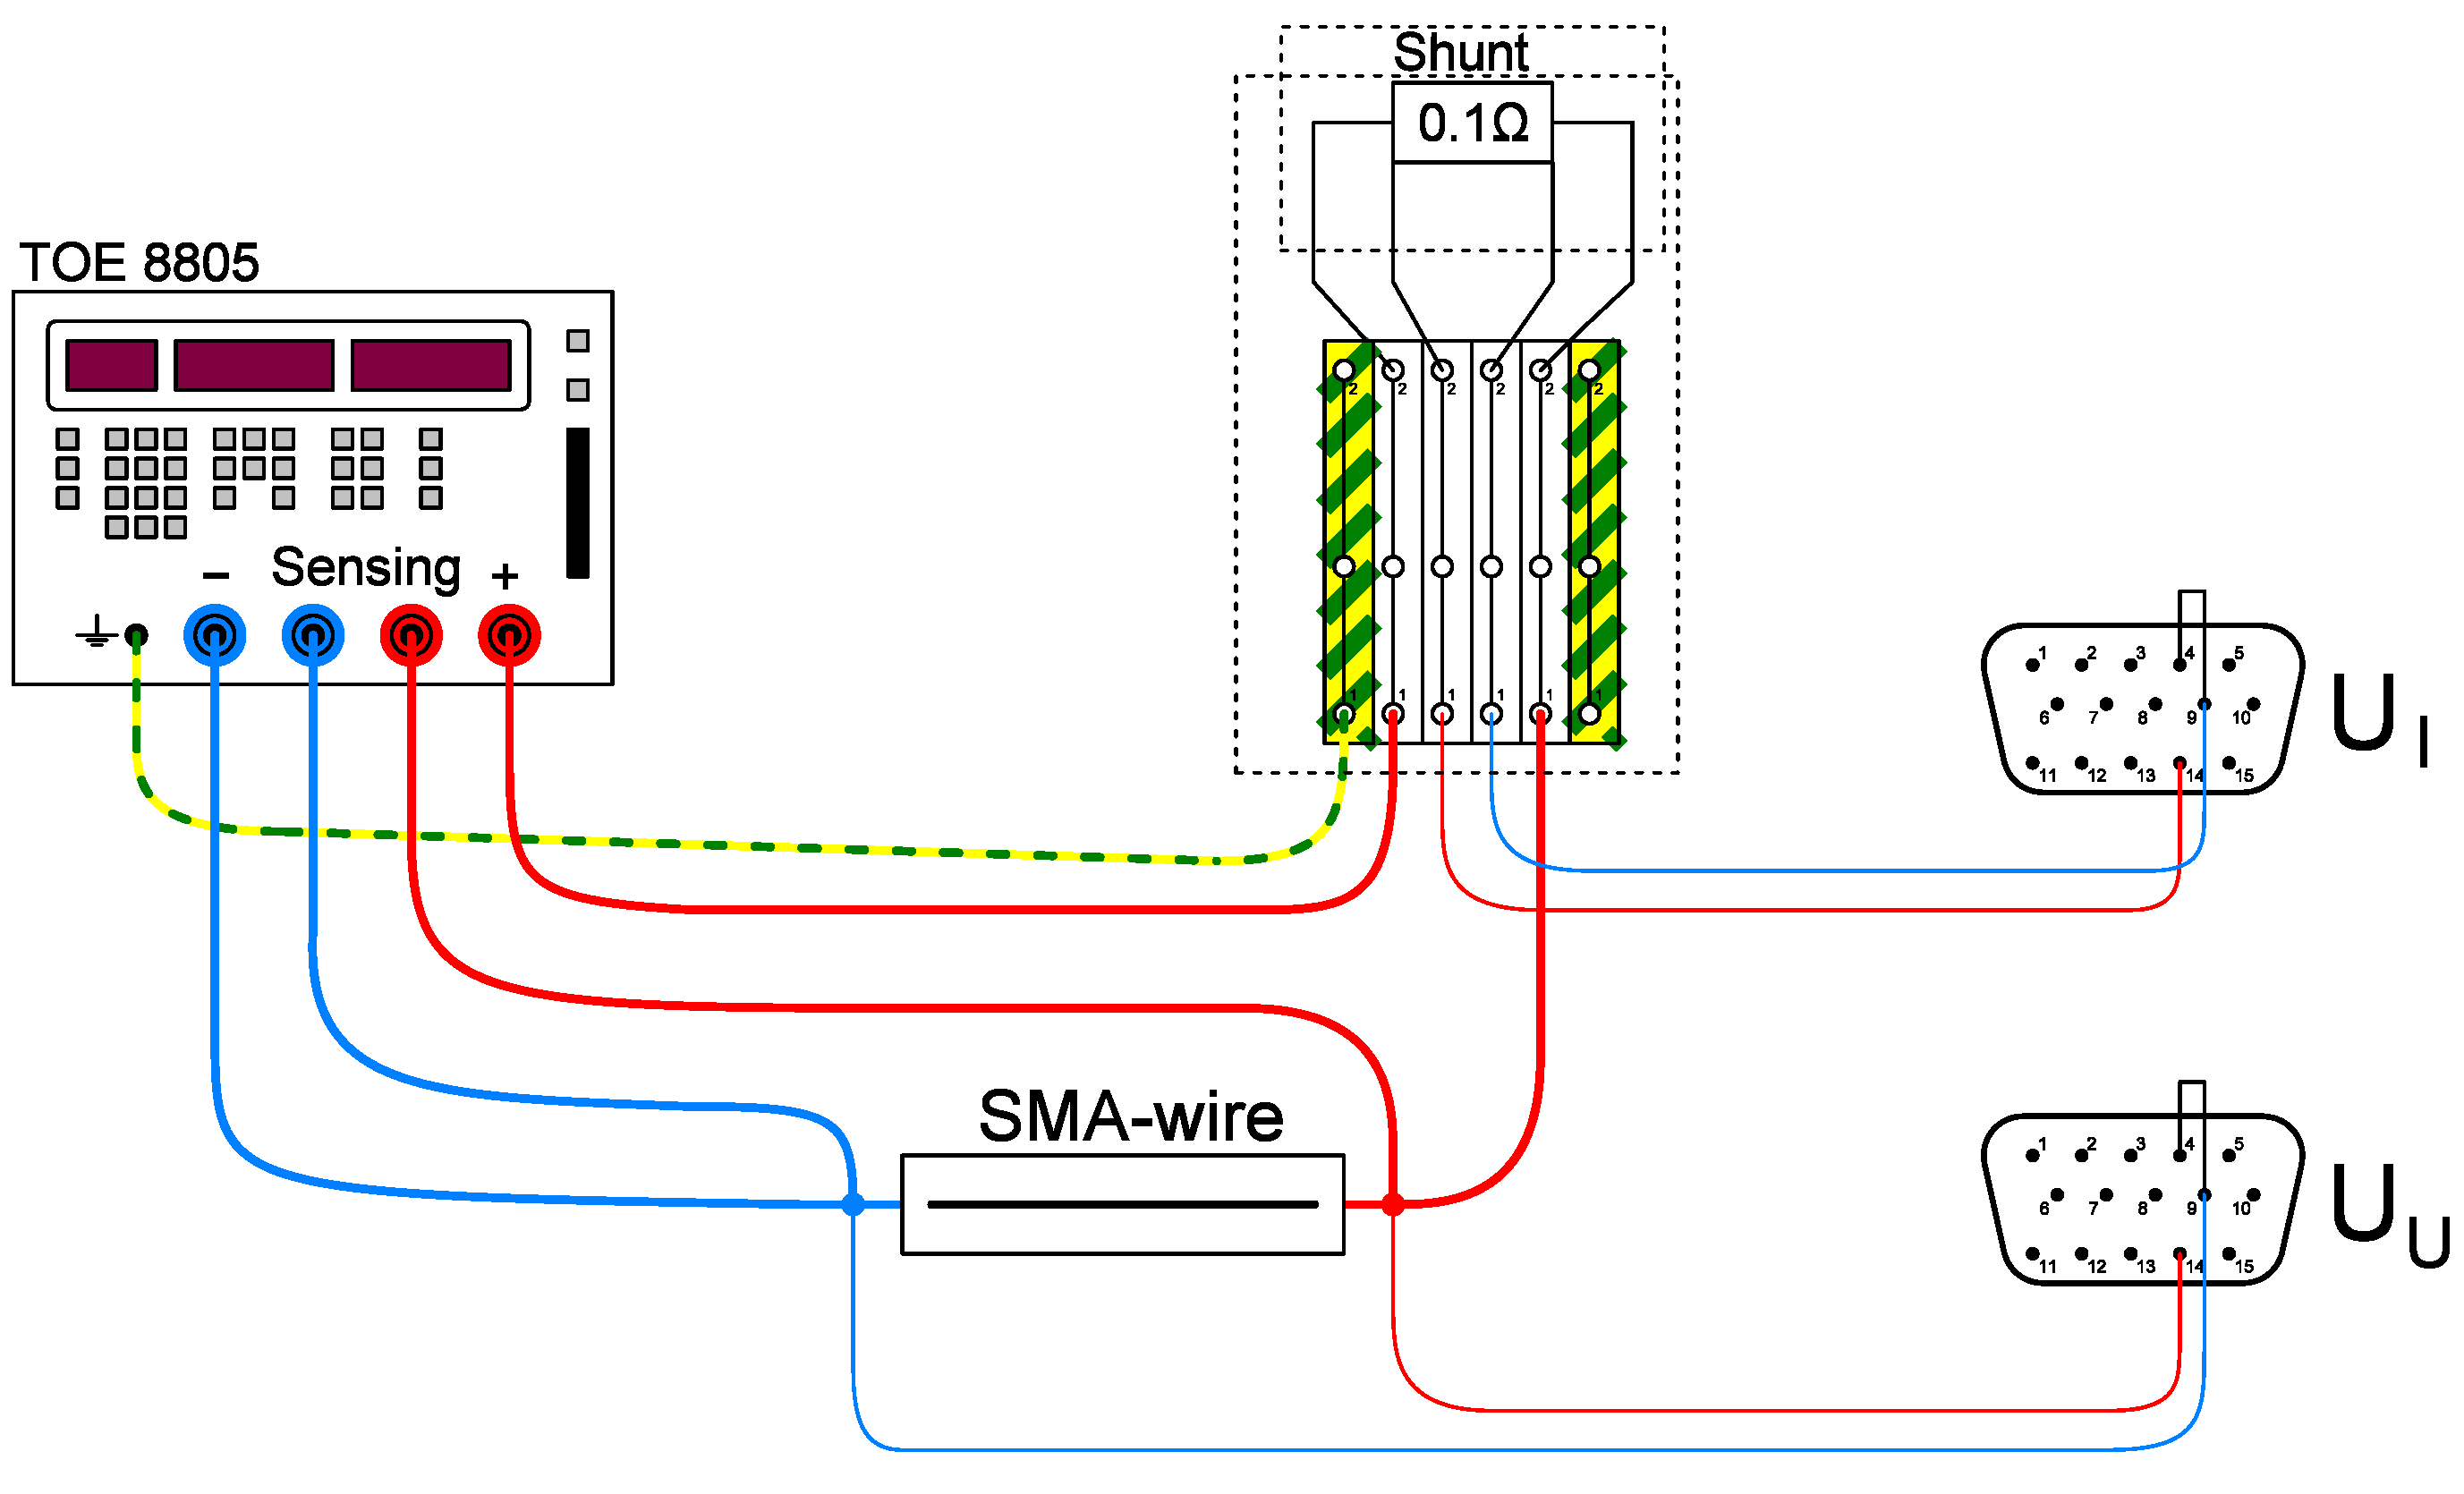
3.4. Electrical Design
3.5. Structure of Data Recording and Evaluation
4. Pre-Test: Adjustment of the Current Intensity to Evaluate 4% Stroke
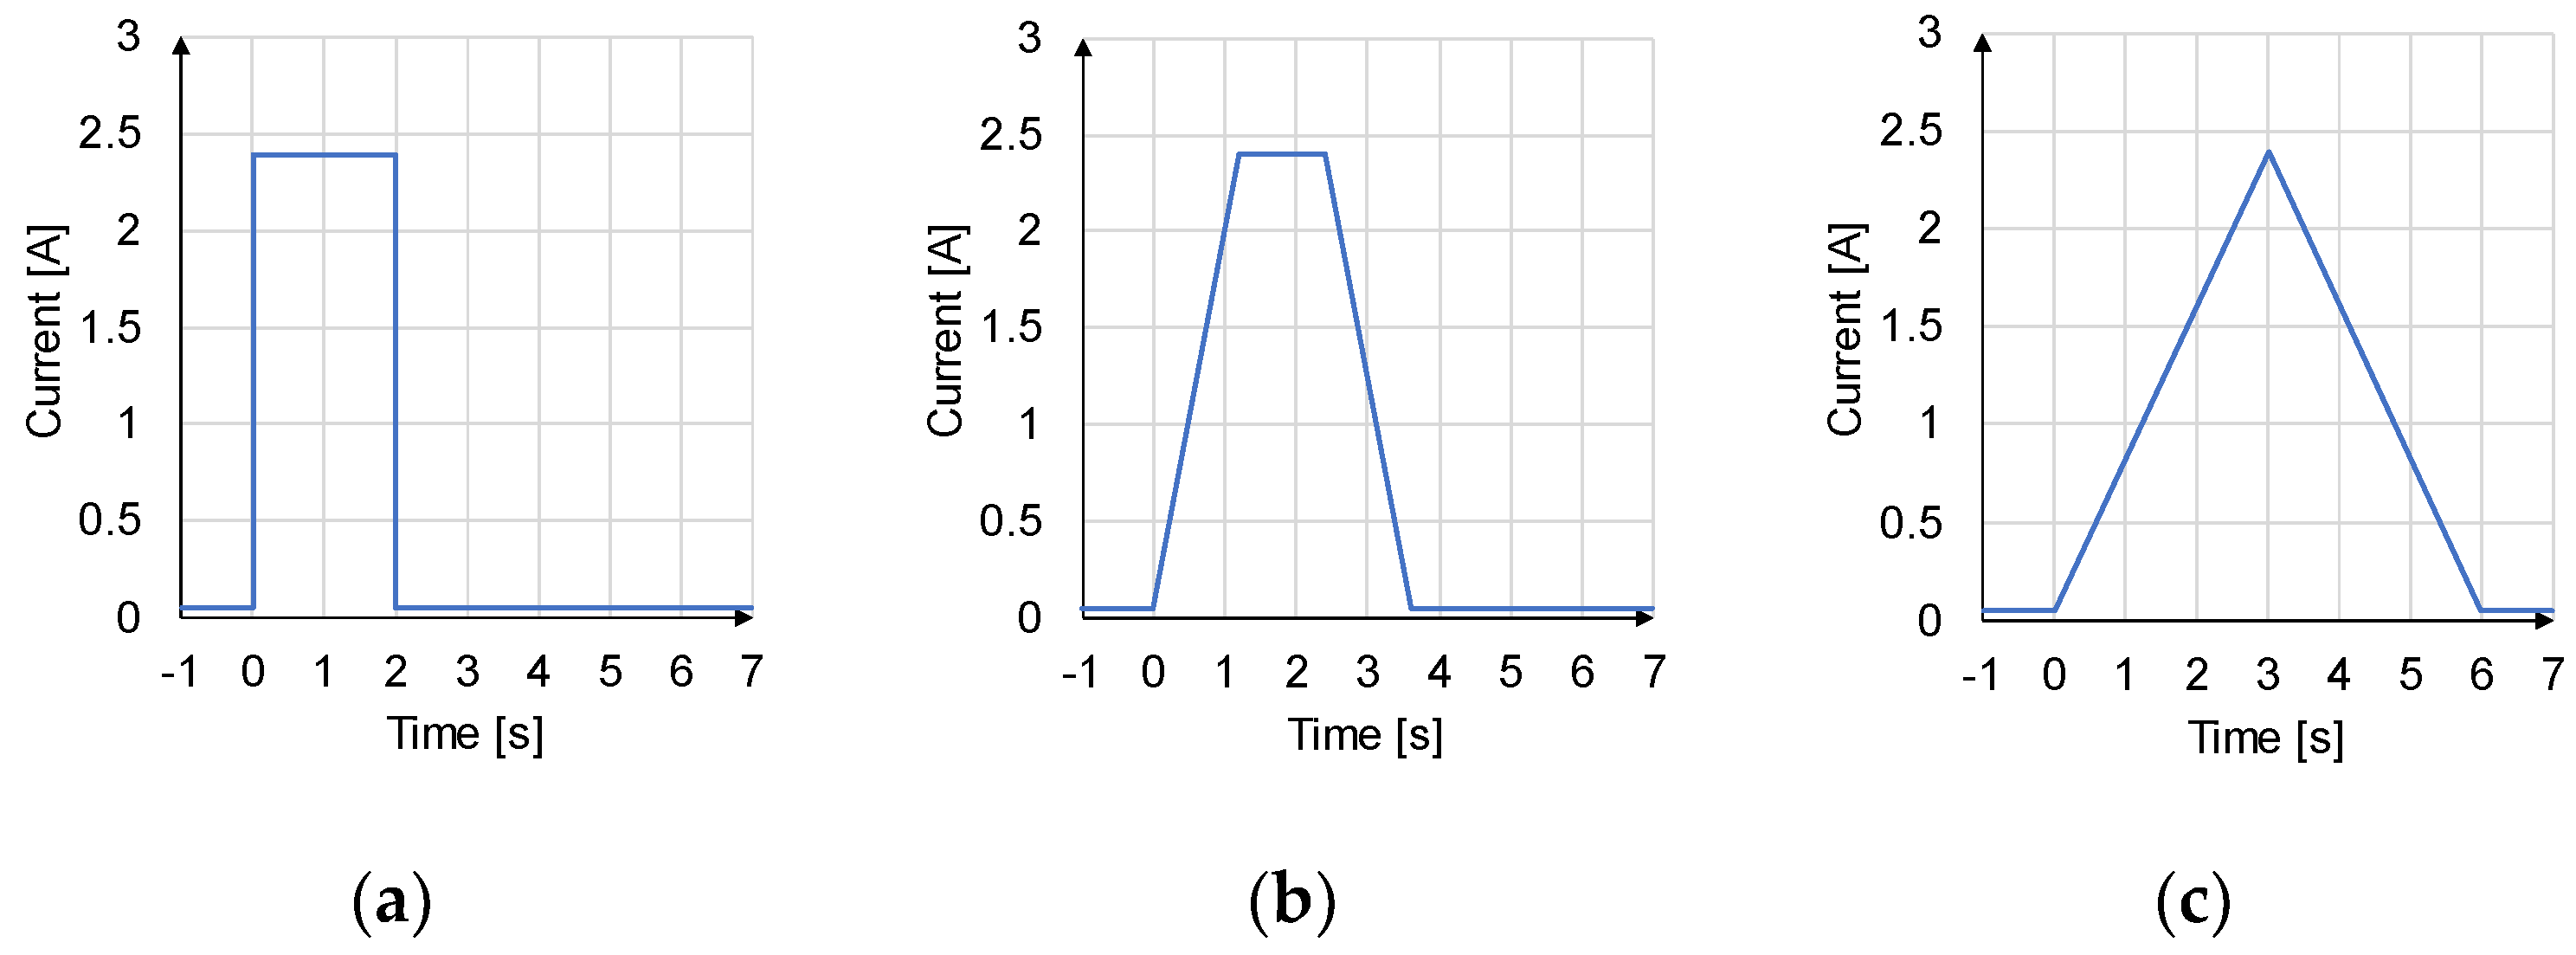
5. Experiment Procedure: Variation of the Activation Profiles
6. Evaluation of Results
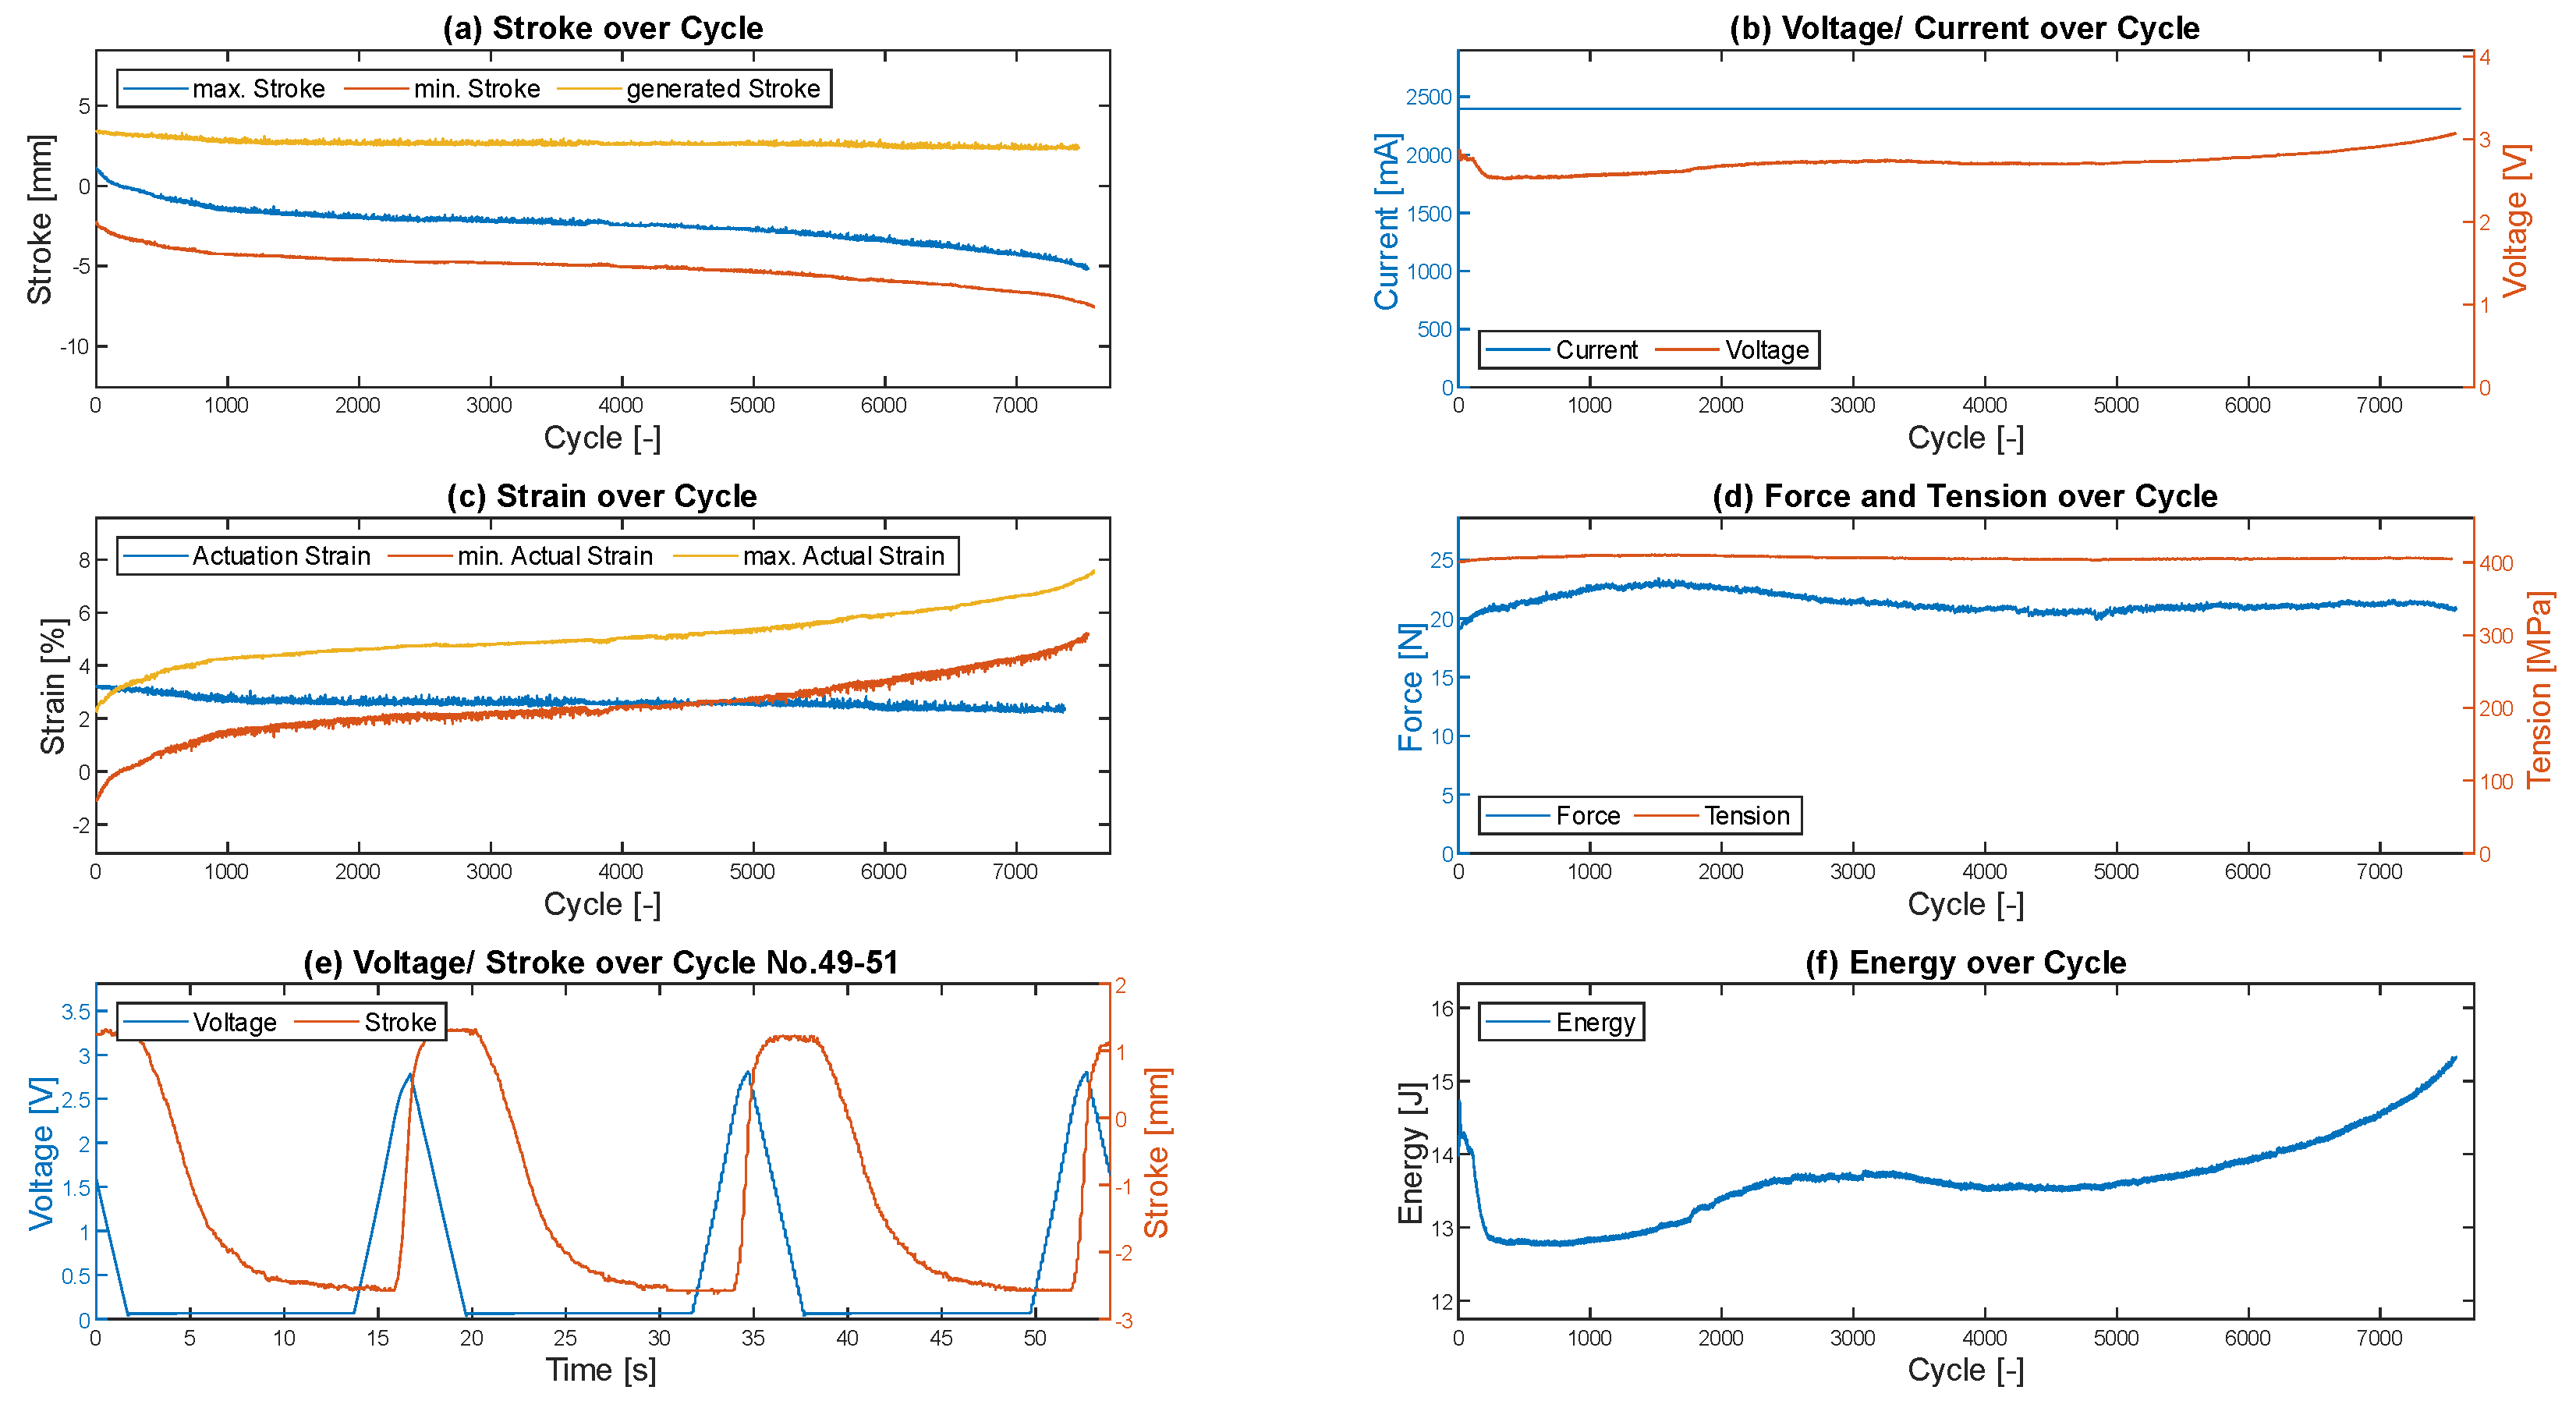
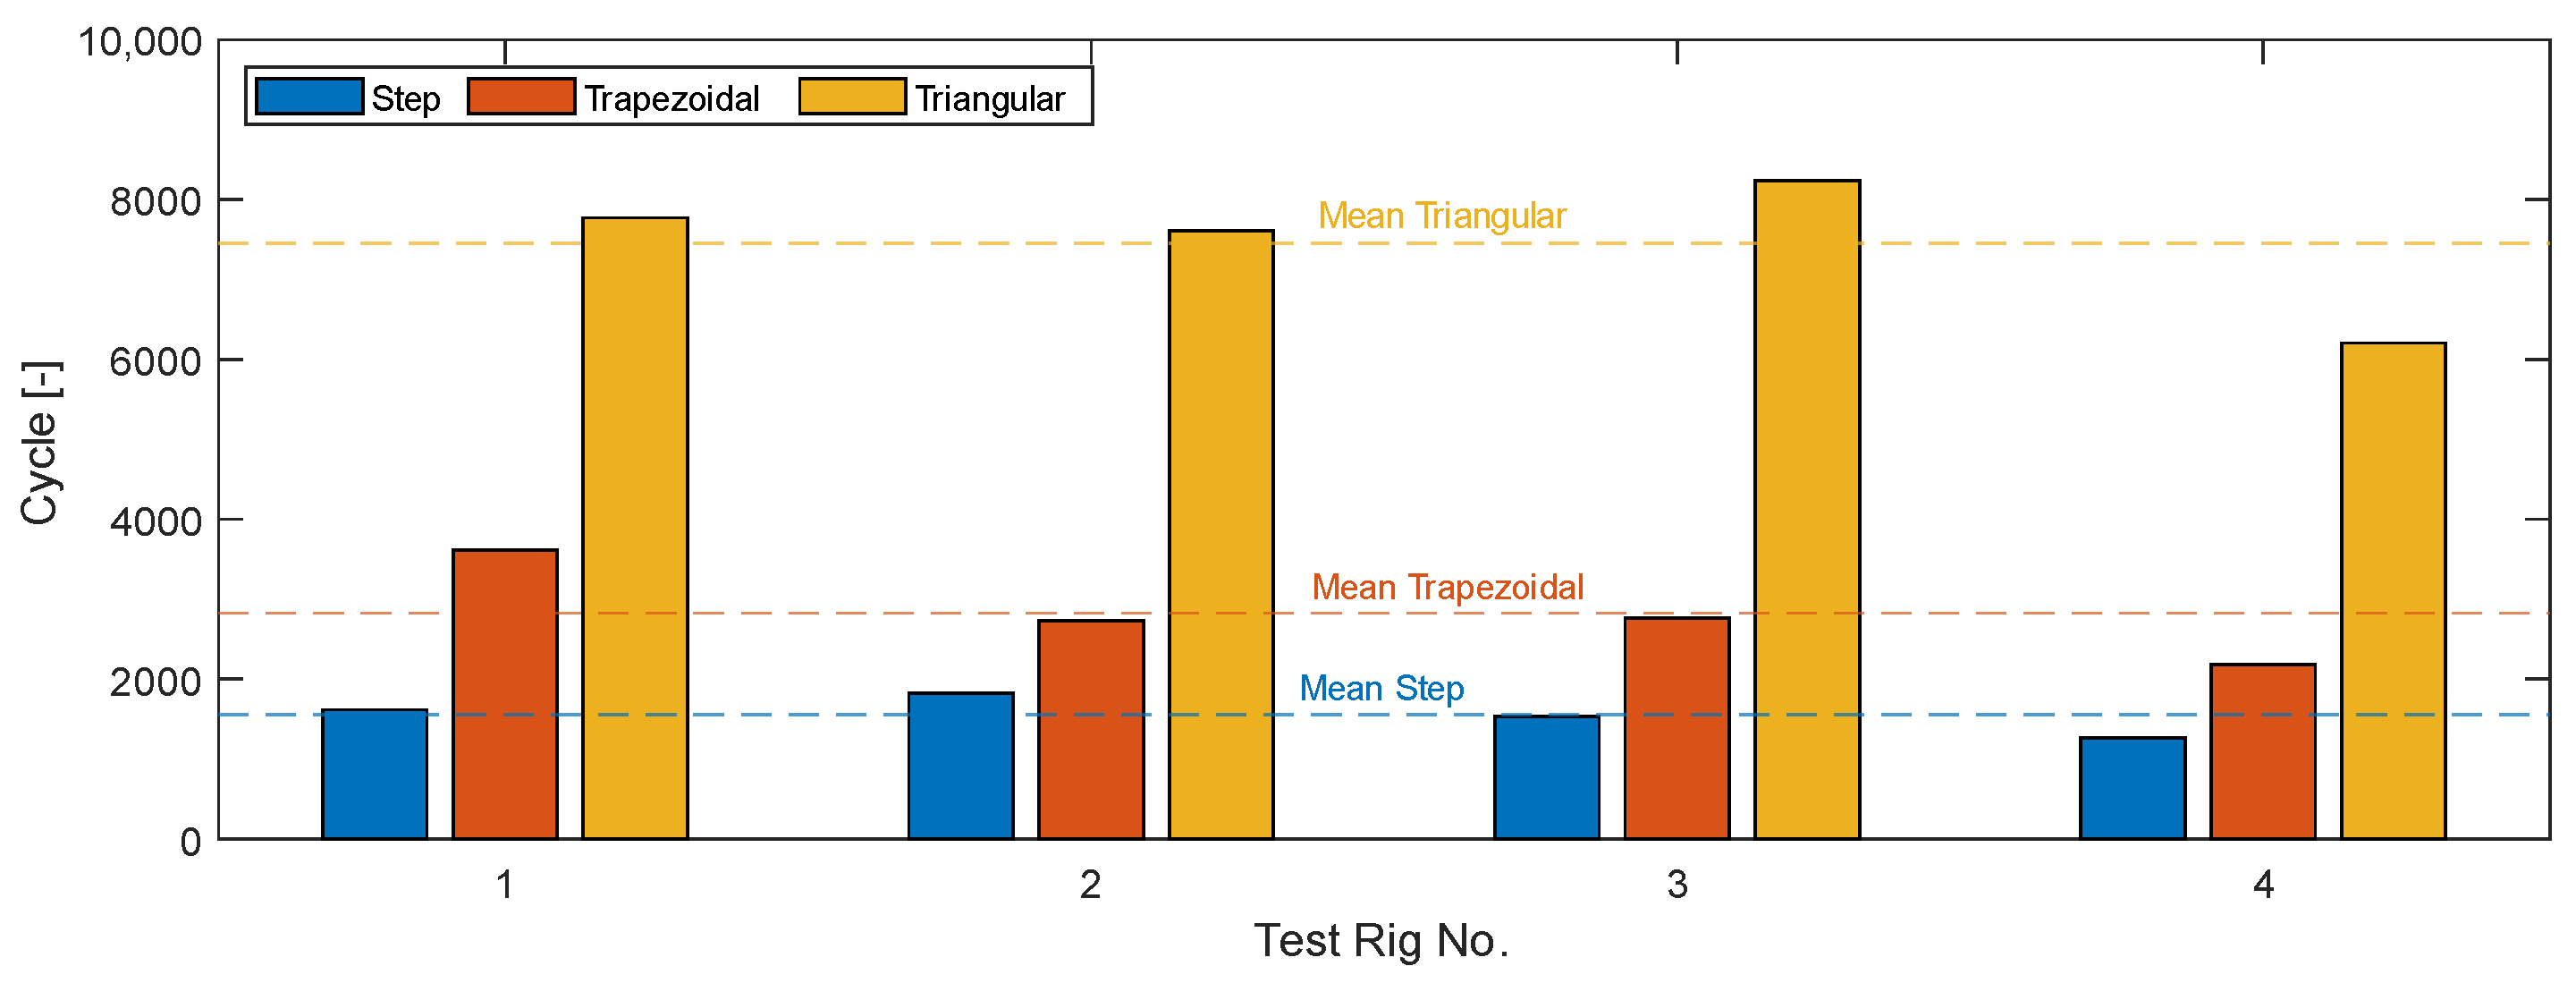
6.1. Stroke
6.2. Voltage
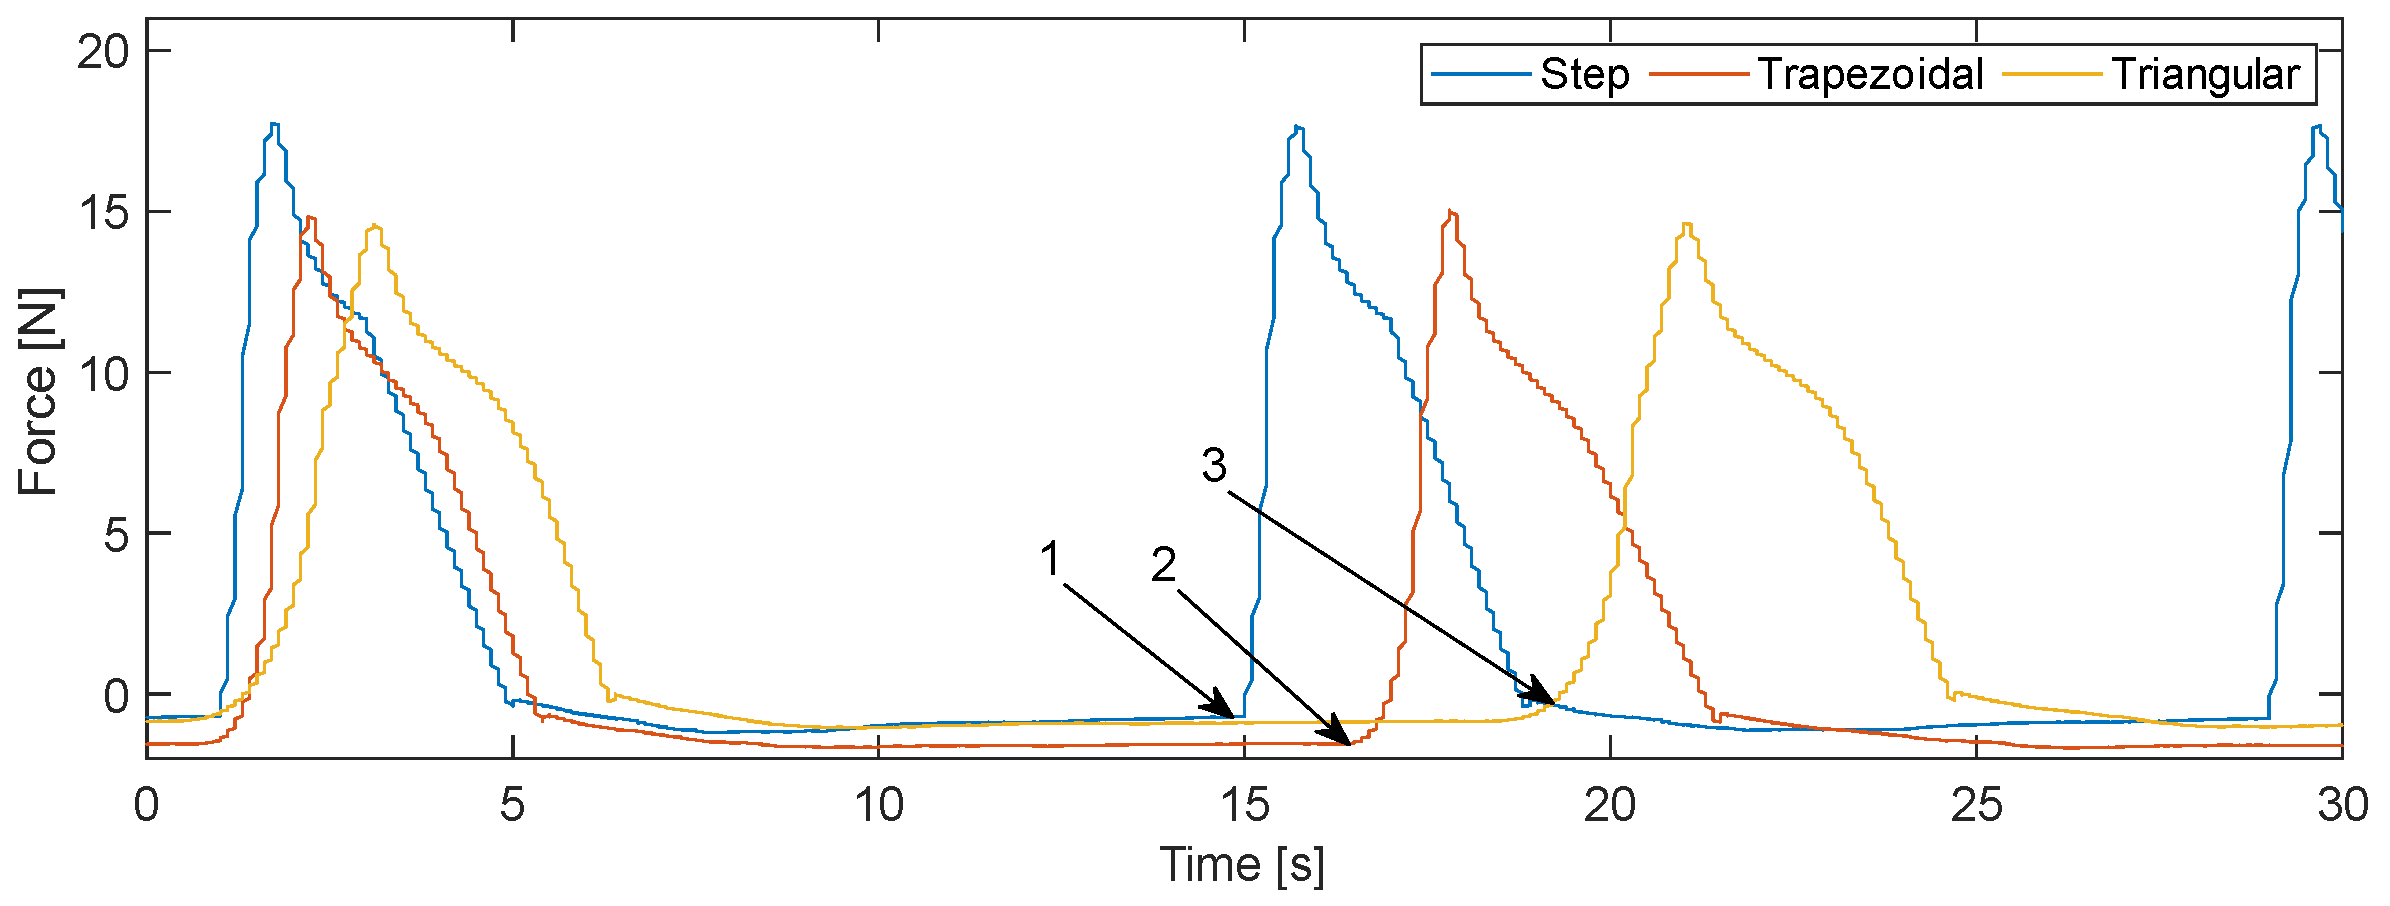
6.3. Force
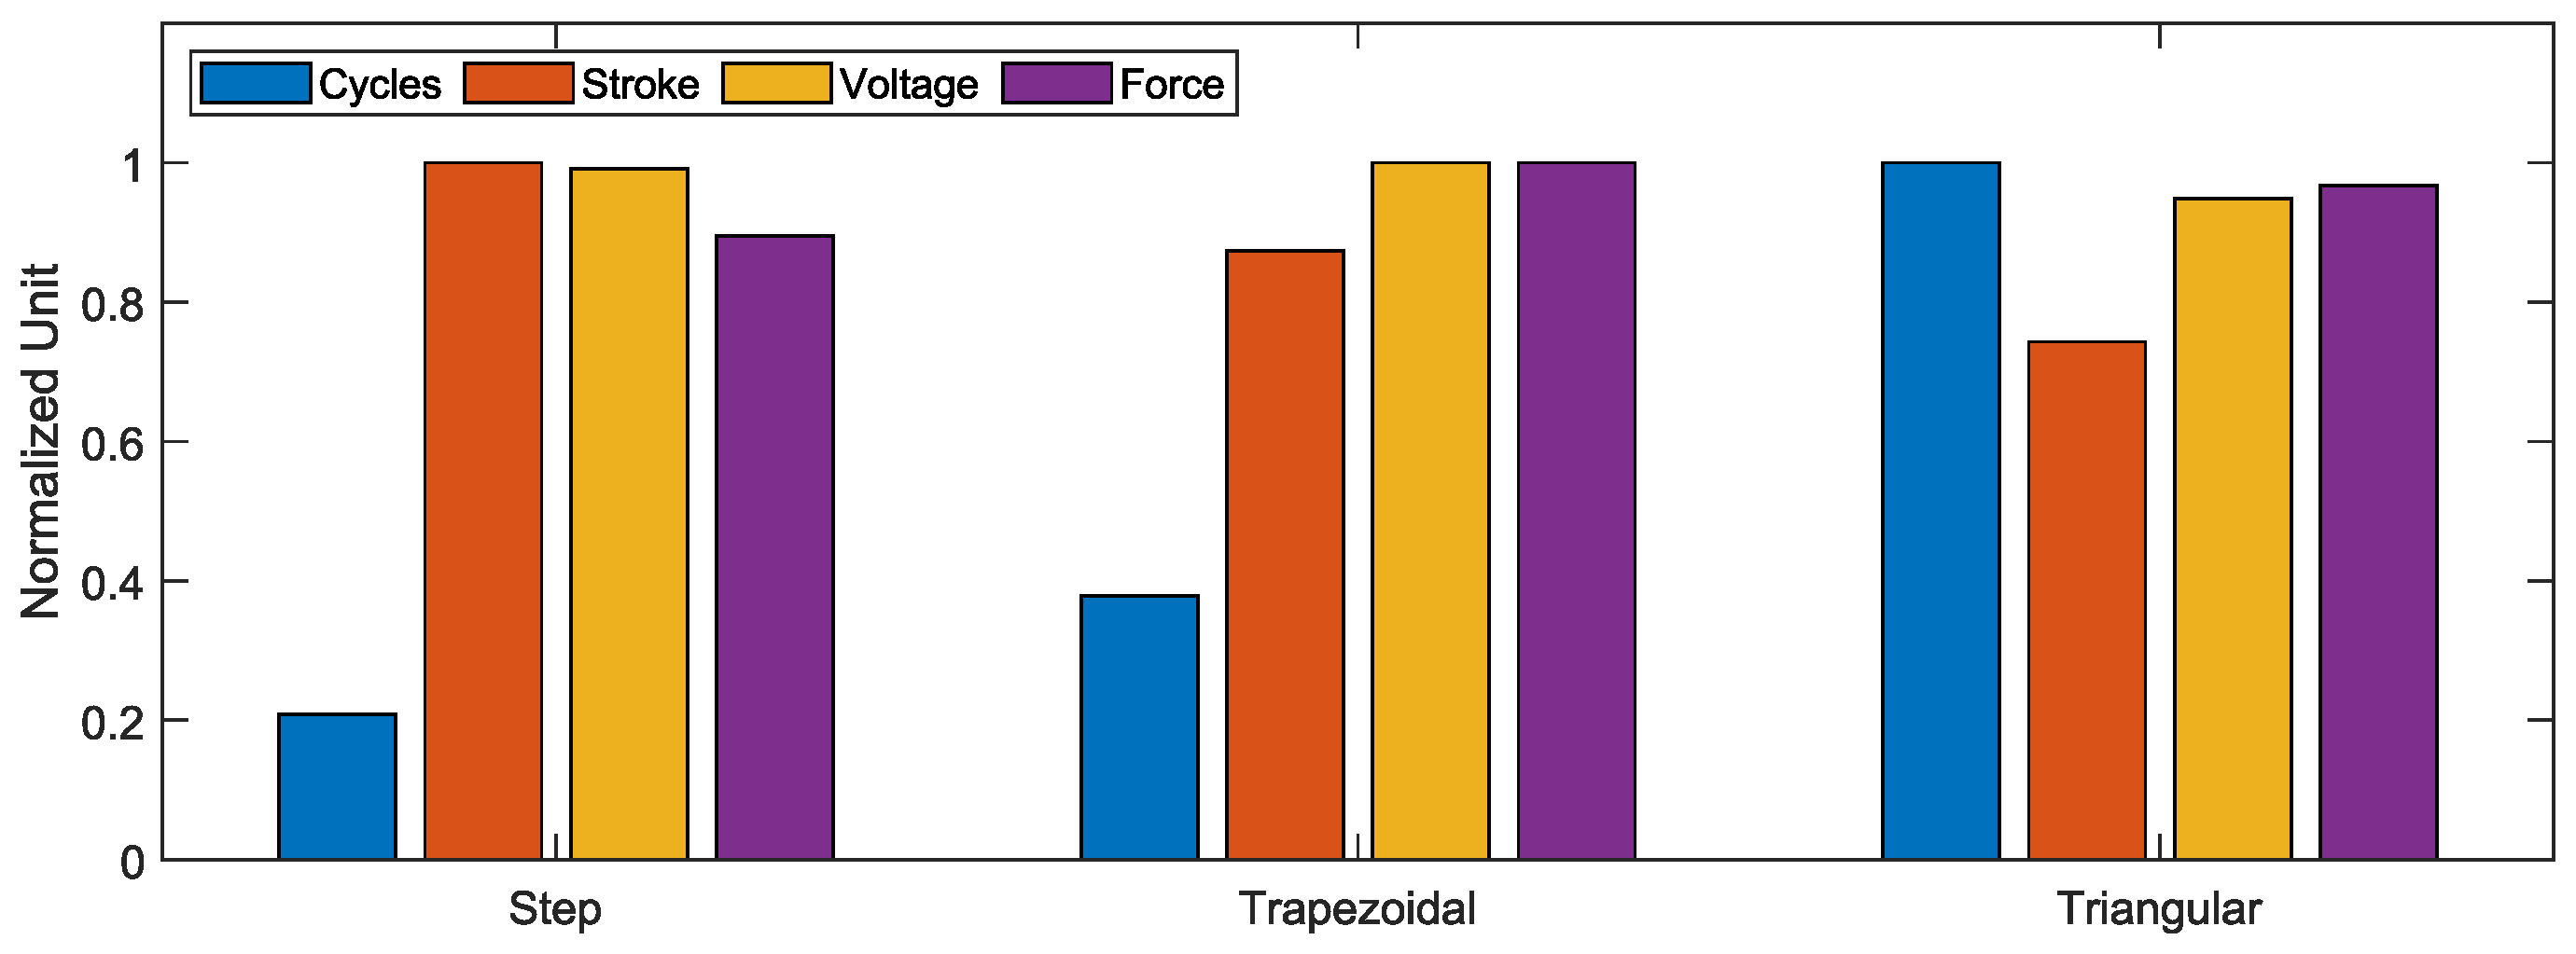
6.4. Comparison with Existing Literature on Activation Profiles
7. Conclusions
7.1. Conclusion Concerning the Activation Profiles
7.2. Conclusion on the Functional Testing of the Developed Test Rig
8. Outlook
Author Contributions
Funding
Data Availability Statement
Conflicts of Interest
References
- Lagoudas, D.C. Shape Memory Alloys; Springer: Boston, MA, USA, 2008; ISBN 978-0-387-47684-1. [Google Scholar]
- Gümpel, P.; Gläser, S.; Jost, N.; Mertmann, M.; Seitz, N.; Strittmatter, J. Formgedächtnislegierungen: Einsatzmöglichkeiten in Maschinenbau, Medizintechnik und Aktuatorik, 2nd ed.; Expert Verlag: Renningen, Germany, 2018; ISBN 978-3-8169-2727-3. [Google Scholar]
- Kohl, M. Entwicklung von Mikroaktoren aus Formgedächtnislegierungen. Wissenschaftliche Bericht (FZKA 6718); Forschungszentrum Karlsruhe: Karlsruhe, Germany, 2002. [Google Scholar]
- Yamauchi, K. Shape Memory and Superelastic Alloys: Technologies and Applications; Woodhead Pub: Cambridge, UK; Philadelphia, PA, USA, 2011; ISBN 9780857092625. [Google Scholar]
- Actuator Solutions GmbH. Smallest, Strongest, Simplest—The SMA Actuator: 3/3 Module AS5P. Available online: https://www.actuatorsolutions.de/products/pneumatics-and-fluidics/3-3-module-as5p/ (accessed on 5 March 2024).
- Feinmechanisches Fertigungszentrum Glashütte GmbH. Greif Tech Nik. Available online: https://ffz-glashuette.com/greiftechnik/ (accessed on 5 March 2024).
- Egelhof. Thermostatregler (RTL). Available online: https://www.egelhof.com/de/entwicklung-innovation/formgedachtnis-technik/thermostatregler-rtl/ (accessed on 5 March 2024).
- Weirich, A.; Kuhlenkötter, B. Applicability of Shape Memory Alloys in Aircraft Interiors. Actuators 2019, 8, 61. [Google Scholar] [CrossRef]
- Eppler, C. Entriegelung von Sauerstoffmasken mit Formgedächtnislegierungen; Fraunhofer IWU: Chemitz, Germany, 2013. [Google Scholar]
- Motzki, P. Advanced Design and Control Concepts for Actuators Based on Shape Memory Alloy Wires. Ph.D. Thesis, Universität des Saarlandes, Saarbrücken, Germany, 2018. [Google Scholar]
- Verein Deutscher Ingenieure. Produktentwicklung mit Formgedächtnislegierungen (FGL); 77.100, 77.120.99 (2248-1); Beuth Verlag GmbH: Berlin, Germany, 2017. [Google Scholar]
- Treppmann, D. Thermomechanische Behandlung von NiTi: (mit Lösungsansätzen für Qualitätssicherung und Normung von Formgedächtnislegierungen); Ph.D. Thesis, Ruhr-Universität Bochum; VDI-Verl.: Düsseldorf, Germany, 1997; ISBN 3183462052. [Google Scholar]
- Hornbogen, E.; Warlimont, H.; Skrotzki, B. Metalle: Struktur und Eigenschaften der Metalle und Legierungen; Springer: Berlin/Heidelberg, Germany, 2019; ISBN 978-3-662-57762-2. [Google Scholar]
- Akhras, G. Smart Materials and Smart Sytems for the future. Can. Mil. J. 2000, 1, 25–32. [Google Scholar]
- Choi, S.-B. The Grand Challenges in Smart Materials Research. Front. Mater. 2014, 1, 11. [Google Scholar] [CrossRef]
- Maaß, B. Strukturbildungsprozesse bei der Herstellung und Funktionelle Eigenschaften Pseudoelastischer Ni-Ti-Cu-(X)-Formgedächtnislegierungen. Ph.D. Thesis, Ruhr-Universität Bochum, Bochum, Germany, 2012. [Google Scholar]
- Megnin, C.; Kohl, M. Shape memory alloy microvalves for a fluidic control system. J. Micromech. Microeng. 2014, 24, 25001. [Google Scholar] [CrossRef]
- Schiedeck, F. Entwicklung Eines Modells für Formgedächtnisaktoren im Geregelten Dynamischen Betrieb; Ph.D. Thesis, Leibnitz Universität Hannover; PZH Produktionstechn. Zentrum: Garbsen, Germany, 2009; ISBN 978-3-941416-23-9. [Google Scholar]
- Elahinia, M.H. Shape Memory Alloy Actuators: Design, Fabrication, and Experimental Evaluation; Wiley: Chichester, UK, 2016; ISBN 978-1-118-35944-0. [Google Scholar]
- Tadaki, T.; Otsuka, K.; Shimizu, K. Shape memory alloys. Annu. Rev. Mater. Sci. 1988, 18, 25–45. [Google Scholar] [CrossRef]
- Mohd Jani, J.; Leary, M.; Subic, A. Designing shape memory alloy linear actuators: A review. J. Intell. Mater. Syst. Struct. 2016, 28, 1699–1718. [Google Scholar] [CrossRef]
- Robertson, S.W.; Pelton, A.R.; Ritchie, R.O. Mechanical fatigue and fracture of Nitinol. Int. Mater. Rev. 2012, 57, 1–37. [Google Scholar] [CrossRef]
- Weirich, A.T. Methodisch Unterstützte Entwicklung Eines Bistabilen Antagonistischen Formgedächtnisdrahtaktors; Ruhr-Universität Bochum: Bochum, Germany, 2021. [Google Scholar]
- Kaack, M. Elastische Eigenschaften von NiTi-Formgedächtnis-Legierungen. Ph.D. Thesis, Ruhr-Universität Bochum, Bochum, Germany, 2002. [Google Scholar]
- Lygin, K. Eine Methodik zur Entwicklung von Umgebungsaktivierten FG-Aktoren Mit Geringer Thermischer Hysterese am Beispiel der Heizungs- und Klimatechnik; Verlag Dr. Hut: München, Germany, 2014; ISBN 978-3-8439-1620-2. [Google Scholar]
- Stork, H. Aufbau, Modellbildung und Regelung von Formgedächtnis-Aktorsystemen. Ph.D. Thesis, Technische Universität Braunschweig, Braunschweig, Germany, 1997. [Google Scholar]
- Liu, Y. Formgedächtnis—Mikroventile mit Hoher Energiedichte. Ph.D. Thesis, Universität Karlsruhe, Karlsruhe, Germany, 2003. [Google Scholar]
- Ikuta, K.; Tsukamoto, M.; Hirose, S. Shape memory alloy servo actuator system with electric resistance feedback and application for active endoscope. In Proceedings of the 1988 IEEE International Conference on Robotics and Automation, Philadelphia, PA, USA, 24–29 April 1988; IEEE Computer Society Press: Washington, DC, USA, 1988; pp. 427–430, ISBN 0-8186-0852-8. [Google Scholar]
- Huang, W. On the selection of shape memory alloys for actuators. Mater. Des. 2002, 23, 11–19. [Google Scholar] [CrossRef]
- Eggeler, G.; Hornbogen, E.; Yawny, A.; Heckmann, A.; Wagner, M. Structural and functional fatigue of NiTi shape memory alloys. Mater. Sci. Eng. A 2004, 378, 24–33. [Google Scholar] [CrossRef]
- Großmann, C. Makroskopische und Mikromechanische Finite-Elemente-Analysen an Martensitischen und Austenitischen Nickel-Titan Formgedächtnislegierungen. Ph.D. Thesis, Ruhr-Universität Bochum, Universitätsbibliothek, Bochum, Germany, 2012. [Google Scholar]
- Stöckel, D. (Ed.) Legierungen mit Formgedächtnis: Industrielle Nutzung des Shape-Memory-Effektes; Expert-Verlag: Ehningen bei Böblingen, Germany, 1988; ISBN 9783816903239. [Google Scholar]
- Frenzel, J. On the Importance of Structural and Functional Fatigue in Shape Memory Technology. Shap. Mem. Superelast. 2020, 6, 213–222. [Google Scholar] [CrossRef]
- Langbein, S.; Czechowicz, A. Konstruktionspraxis Formgedächtnistechnik; Springer Fachmedien Wiesbaden: Wiesbaden, Germany, 2013; ISBN 978-3-8348-1957-4. [Google Scholar]
- Simon, T.; Kröger, A.; Somsen, C.; Dlouhy, A.; Eggeler, G. On the multiplication of dislocations during martensitic transformations in NiTi shape memory alloys. Acta Mater. 2010, 58, 1850–1860. [Google Scholar] [CrossRef]
- Tyc, O.; Heller, L.; Šittner, P. Lattice Defects Generated by Cyclic Thermomechanical Loading of Superelastic NiTi Wire. Shap. Mem. Superelast. 2021, 7, 65–88. [Google Scholar] [CrossRef]
- Wagner, M.F.-X.; Nayan, N.; Ramamurty, U. Healing of fatigue damage in NiTi shape memory alloys. J. Phys. D Appl. Phys. 2008, 41, 185408. [Google Scholar] [CrossRef]
- Bigeon, M.J.; Morin, M. Thermomechanical study of the stress assisted two way memory effect fatigue in TiNi and CuZnAl wires. Scr. Mater. 1996, 35, 1373–1378. [Google Scholar] [CrossRef]
- Rahim, M.; Frenzel, J.; Frotscher, M.; Pfetzing-Micklich, J.; Steegmüller, R.; Wohlschlögel, M.; Mughrabi, H.; Eggeler, G. Impurity levels and fatigue lives of pseudoelastic NiTi shape memory alloys. Acta Mater. 2013, 61, 3667–3686. [Google Scholar] [CrossRef]
- Robertson, S.W.; Launey, M.; Shelley, O.; Ong, I.; Vien, L.; Senthilnathan, K.; Saffari, P.; Schlegel, S.; Pelton, A.R. A statistical approach to understand the role of inclusions on the fatigue resistance of superelastic Nitinol wire and tubing. J. Mech. Behav. Biomed. Mater. 2015, 51, 119–131. [Google Scholar] [CrossRef]
- Mahtabi, M.J.; Shamsaei, N.; Mitchell, M.R. Fatigue of Nitinol: The state-of-the-art and ongoing challenges. J. Mech. Behav. Biomed. Mater. 2015, 50, 228–254. [Google Scholar] [CrossRef]
- Pelton, A.R.; Fino-Decker, J.; Vien, L.; Bonsignore, C.; Saffari, P.; Launey, M.; Mitchell, M.R. Rotary-bending fatigue characteristics of medical-grade Nitinol wire. J. Mech. Behav. Biomed. Mater. 2013, 27, 19–32. [Google Scholar] [CrossRef]
- Miyazaki, S.; Mizukoshi, K.; Ueki, T.; Sakuma, T.; Liu, Y. Fatigue life of Ti–50 at.% Ni and Ti–40Ni–10Cu (at.%) shape memory alloy wires. Mater. Sci. Eng. A 1999, 273–275, 658–663. [Google Scholar] [CrossRef]
- Roy, D.; Buravalla, V.; Mangalgiri, P.D.; Allegavi, S.; Ramamurty, U. Mechanical characterization of NiTi SMA wires using a dynamic mechanical analyzer. Mater. Sci. Eng. A 2008, 494, 429–435. [Google Scholar] [CrossRef]
- Brinson, L. Stress-induced transformation behavior of a polycrystalline NiTi shape memory alloy: Micro and macromechanical investigations via in situ optical microscopy. J. Mech. Phys. Solids 2004, 52, 1549–1571. [Google Scholar] [CrossRef]
- Wagner, M.F.-X. Ein Beitrag zur Strukturellen und Funktionalen Ermüdung von Drähten und Federn aus NiTi-Formgedächtnislegierungen; Europäischer. Universitätsverlag: London, UK; Paris, France, 2005; ISBN 978-3-86515-030-1. [Google Scholar]
- Hornbogen, E.; Eggeler, G.; Werner, E. Werkstoffe: Aufbau und Eigenschaften von Keramik-, Metall-, Polymer- und Verbundwerkstoffen, 12th ed.; Springer: Berlin/Heidelberg, Germany, 2019; ISBN 9783662588468. [Google Scholar]
- Rathmann, C. Formgedächtnisaktorsysteme als Enabler für Smarte Produkt-Service-Systeme, 1st ed.; Shaker: Herzogenrath, Germany, 2018; ISBN 9783844061741. [Google Scholar]
- Morgan, N.B.; Friend, C.M. A review of shape memory stability in NiTi alloys. J. Phys. IV Fr. 2001, 11, Pr8-325–Pr8-332. [Google Scholar] [CrossRef]
- Strnadel, B.; Ohashi, S.; Ohtsuka, H.; Ishihara, T.; Miyazaki, S. Cyclic stress-strain characteristics of Ti-Ni and Ti-Ni-Cu shape memory alloys. Mater. Sci. Eng. A 1995, 202, 148–156. [Google Scholar] [CrossRef]
- Miyazaki, S.; Imai, T.; Igo, Y.; Otsuka, K. Effect of cyclic deformation on the pseudoelasticity characteristics of Ti-Ni alloys. Met. Trans. A 1986, 17, 115–120. [Google Scholar] [CrossRef]
- Pelton, A.R.; Huang, G.H.; Moine, P.; Sinclair, R. Effects of thermal cycling on microstructure and properties in Nitinol. Mater. Sci. Eng. A 2012, 532, 130–138. [Google Scholar] [CrossRef]
- Rao, A.; Srinivasa, A.R.; Reddy, J.N. Design of Shape Memory Alloy (SMA) Actuators; Springer International Publishing: Cham, Switzerland, 2015; ISBN 978-3-319-03187-3. [Google Scholar]
- Zhang, Y.; Zhu, J.; Moumni, Z.; van Herpen, A.; Zhang, W. Energy-based fatigue model for shape memory alloys including thermomechanical coupling. Smart Mater. Struct. 2016, 25. [Google Scholar] [CrossRef]
- Zhang, Y.; Zhang, X.; Jiang, J.; Zhang, Q.; Ke, Y.; Qiu, S. Actuation response of typical biased shape memory alloy wire under variable electric heating rates: Experimental investigation and modeling. J. Intell. Mater. Syst. Struct. 2023, 34, 1932–1946. [Google Scholar] [CrossRef]
- Vollach, S.; Shilo, D. The Mechanical Response of Shape Memory Alloys Under a Rapid Heating Pulse. Exp. Mech. 2010, 50, 803–811. [Google Scholar] [CrossRef]
- Vollach, S.; Shilo, D.; Shlagman, H. Mechanical Response of Shape Memory Alloys Under a Rapid Heating Pulse—Part II. Exp. Mech. 2016, 56, 1465–1475. [Google Scholar] [CrossRef]
- Guan, J.-H.; Pei, Y.-C.; Wu, J.-T. A driving strategy of shape memory alloy wires with electric resistance modeled by logistic function for power consumption reduction. Mech. Syst. Signal Process. 2021, 160, 107839. [Google Scholar] [CrossRef]
- Mosley, M.J.; Mavroidis, C. Experimental Nonlinear Dynamics of a Shape Memory Alloy Wire Bundle Actuator. J. Dyn. Syst. Meas. Control 2001, 123, 103–112. [Google Scholar] [CrossRef]
- Sgambitterra, E.; Greco, C.; Rodinò, S.; Niccoli, F.; Furgiuele, F.; Maletta, C. Fully coupled electric-thermo-mechanical model for predicting the response of a SMA wire activated by electrical input. Sens. Actuators A Phys. 2023, 362, 114643. [Google Scholar] [CrossRef]
- Fleczok, B.; Rathmann, C.; Otibar, D.; Weirich, A.; Kuhlenkötter, B. Impact of Different Electrical Time-Based Activations on NiTi Shape Memory Alloys. IOP Conf. Ser. Mater. Sci. Eng. 2017, 216, 12008. [Google Scholar] [CrossRef]
- Feldhusen, J.; Grote, K.-H. Pahl/Beitz Konstruktionslehre; Springer: Berlin/Heidelberg, Germany, 2013; ISBN 978-3-642-29568-3. [Google Scholar]
- Böttcher, J.; Jahn, M.; Tatzko, S. Characterization of mechanical properties of pseudoelastic shape memory alloys under harmonic excitation. Mater. Res. Express 2017, 4, 126505. [Google Scholar] [CrossRef]
- Daudpoto, J.; Dehghani-Sanij, A.; Richardson, R. A Measurement System for Shape Memory Alloy Wire Actuators. Meas. Control 2015, 48, 285–288. [Google Scholar] [CrossRef]
- Heß, P.; Bracke, S. Estimation of the Remaining Lifetime of Shape Memory Alloy Actuators during Prototype Testing: Analysis of the Impact of Different Currents. In Proceedings of the 31st European Safety and Reliability Conference, Angers, France, 19–23 September 2021; Castanier, B., Cepin, M., Bigaud, D., Berenguer, C., Eds.; Research Publishing Services: Singapore, 2021; pp. 3170–3177, ISBN 978-981-18-2016-8. [Google Scholar]
- Löffler, R.; Tremmel, S.; Hornfeck, R. Owl-Neck-Spine-Inspired, Additively Manufactured, Joint Assemblies with Shape Memory Alloy Wire Actuators. Biomimetics 2023, 8, 117. [Google Scholar] [CrossRef]
- Meier, H.; Czechowicz, A.; Haberland, C. Control loops with detection of inner electrical resistance and fatigue-behaviour by activation of NiTi -Shape Memory Alloys. In Proceedings of the ESOMAT 2009, Prague, Czech Republic, 7–11 September 2009. [Google Scholar]
- Schmelter, T.; Theren, B.; Kielczewski, A.; Kuhlenkötter, B. Investigations of the Long-Term Behavior of Electrically Heated Shape Memory Alloy Wires Deflected by a 90° Pulley. In Proceedings of the ASME 2022 Conference on Smart Materials, Adaptive Structures and Intelligent Systems, Dearborn, MI, USA, 12–14 September 2022; American Society of Mechanical Engineers: New York, NY, USA, 2022. ISBN 978-0-7918-8627-4. [Google Scholar]
- SAES Getters Group. SmartFlex Wire & Spring Datasheet. Available online: https://www.saesgetters.com/wp-content/uploads/sites/8/2024/01/SmartFlex-wires.pdf (accessed on 10 December 2020).


| Number | Type of Requirement | Requirement |
|---|---|---|
| Concept | ||
| Material | ||
| 1.1 | D | Nickel–titanium-based wires |
| 1.2 | D | Conductive material: copper |
| 1.3 | D | Insulating material: POM |
| 1.6 | D | Cooling medium: air |
| Geometry | ||
| 2.1 | D | Clamping of wires with diameters up to 1 mm |
| 2.7 | D | Horizontal test bench setup |
| Mechanics | ||
| 3.1 | D | Adjustable load up to 10 kg |
| 3.3 | D | Exploiting the wrap-around friction |
| 3.8 | D | Low-friction movement of the floating bearing |
| Energy | ||
| 4.1 | D | Type of activation: Joule heating of the wire |
| 4.2 | D | Cooling through thermal convection and radiation |
| 4.3 | D | Option of switching the power supply on and off at timed intervals |
| Electrics/Electronics | ||
| 5.1 | D | Min. power of the power supply unit: 50 W |
| 5.4 | D | Adjustability of an (infinite) number of cycles |
| Software | ||
| 6.2 | D | Computer-aided programming of power supply units and activation profiles |
| Signal/Sensors | ||
| 7.1 | D | Measurement of the voltage applied to the wire |
| 7.2 | D | Measurement of the current applied to the wire |
| 7.3 | D | Measurement of the force applied to the wire |
| 7.4 | D | Measurement of the stroke performed by the wire |
| 7.5 | R | Monitoring the ambient temperature |
| Safety | ||
| 8.1 | D | Electrical insulation |
| 8.4 | D | Production of components by qualified personnel |
| 8.5 | D | Installation and connection of the electronics by qualified personnel |
| Ergonomics | ||
| 9.1 | D | Performing hand movements at upper torso height at most |
| 9.2 | D | Performing hand movements at least at lower torso height |
| Product life cycle phases | ||
| Assembly | ||
| 10.1 | D | Mountability of the test setup |
| 10.3 | D | Can be dismantled and reassembled at any time if required |
| Usage | ||
| 11.2 | D | For use at room temperature (20 °C) |
| Organization | ||
| Planning | ||
| 12.1 | D | End date of the construction: 30 June 2023 |
| 12.2 | D | Investment costs as low as possible |
| Sustainability | ||
| 13.1 | D | Maximum utilization of existing resources |
| 13.2 | D | Production of components in our own workshop |
| Sensor | Specification | Data Recording | Explanation |
|---|---|---|---|
| Ultrasonic sensor (UNAM 12U9914/S14 by Baumer) | Range: 20–200 mm Repeatability: 0.5 mm Resolution: <0.3 mm | Change in length of the wire (stroke) | The ultrasonic sensor continuously determines the length of the wire. The data can then be used to determine the stroke generated per activation cycle and the (overall) elongation of the wire. The change in stroke over the activation cycles can be used to investigate the functional fatigue behavior of the wires. |
| Load cell (S2M/500N by HBK) | Accuracy: 0.02% Force: <500 N | The force applied by the wire | Along with the change in the length of the wire, a force is generated, lifting an attached weight. To date, there have been no detailed studies on the force progression in SMA wires and resulting findings regarding the fatigue behavior. |
| Current sensor | Measured via: precision resistor Resistance: 0.1 Ω Tolerance: 0.5% Capacity: 10 W | Current applied to the wire | Both functional and structural fatigue result in a change in resistance in the wire due to elongation of the wire but are also based on the proportions of the martensitic and austenitic microstructure. As the resistance cannot be measured directly, it is calculated using the current and voltage (Ohm’s law). |
| Voltage sensor | Electrical voltage applied to the wire | see Current sensor | |
| All measured values are combined and recorded in a QuantumX MX840B measuring amplifier with an accuracy class of 0.05% and a measuring rate of up to 40 kS/s | |||
| Start Cycle | End Cycle | Current [A] | Activation Duration [s] |
|---|---|---|---|
| 0 | 250 | 1.8 | 2 |
| 251 | 500 | 2.0 | 2 |
| 501 | 750 | 2.2 | 2 |
| 751 | 1000 | 2.4 | 2 |
| 1001 | 1250 | 2.6 | 2 |
| 1251 | 1500 | 2.8 | 2 |
| Test Parameter | Specification |
|---|---|
| Duration auf activation | 2–6 s |
| Duration of cooling | 12 s |
| Mechanical preload | 350 MPa |
| Voltage | 2.4 A |
| Diameter of wire | 0.35 mm |
| Wire manufacturer | SAES Getters |
| Step | Trapezoidal | Triangular | |
|---|---|---|---|
| Rig 1 (cycles) | 1615 | 3615 | 7774 |
| Rig 2 (cycles) | 1821 | 2732 | 7613 |
| Rig 3 (cycles) | 1530 | 2763 | 8240 |
| Rig 4 (cycles) | 1261 | 2180 | 6205 |
| Average (cycles) | 1556.75 | 2822.5 | 7458 |
| Step | Trapezoidal | Triangular | |||||||
|---|---|---|---|---|---|---|---|---|---|
| Min [mm] | Max [mm] | Mean [mm] | Min [mm] | Max [mm] | Mean [mm] | Min [mm] | Max [mm] | Mean [mm] | |
| Rig 1 | 3.286 | 4.179 | 3.621 | 3.003 | 4.121 | 3.361 | 2.653 | 3.754 | 2.996 |
| Rig 2 | 3.198 | 4.364 | 3.540 | 2.7 | 4.038 | 3.075 | 2.26 | 3.437 | 2.657 |
| Rig 3 | 3.473 | 4.678 | 3.898 | 2.847 | 4.425 | 3.364 | 2.43 | 3.928 | 2.968 |
| Rig 4 | 2.735 | 4.020 | 3.136 | 2.213 | 3.81 | 2.605 | 1.574 | 2.615 | 1.927 |
| AVG | 3.173 | 4.310 | 3.549 | 2.691 | 4.099 | 3.101 | 2.229 | 3.433 | 2.637 |
| Maximum | Step | Trapezoidal | Triangular | ||||
|---|---|---|---|---|---|---|---|
| Lifetime | 7458 | 1556.75 | 20.9% | 2822.5 | 37.8% | 7458 | 100% |
| Stroke | 3.549 mm | 3.549 mm | 100% | 3.101 mm | 87.4% | 2.637 mm | 74.3% |
Disclaimer/Publisher’s Note: The statements, opinions and data contained in all publications are solely those of the individual author(s) and contributor(s) and not of MDPI and/or the editor(s). MDPI and/or the editor(s) disclaim responsibility for any injury to people or property resulting from any ideas, methods, instructions or products referred to in the content. |
© 2024 by the authors. Licensee MDPI, Basel, Switzerland. This article is an open access article distributed under the terms and conditions of the Creative Commons Attribution (CC BY) license (https://creativecommons.org/licenses/by/4.0/).
Share and Cite
Schmelter, T.; Gawlik, O.; Weirich, A.; Kuhlenkötter, B. Test Rig for Investigating the Functional and Structural Fatigue of Shape Memory Alloy Wires Based on Different Activation Profiles. Materials 2024, 17, 1400. https://doi.org/10.3390/ma17061400
Schmelter T, Gawlik O, Weirich A, Kuhlenkötter B. Test Rig for Investigating the Functional and Structural Fatigue of Shape Memory Alloy Wires Based on Different Activation Profiles. Materials. 2024; 17(6):1400. https://doi.org/10.3390/ma17061400
Chicago/Turabian StyleSchmelter, Tobias, Olivia Gawlik, Antonia Weirich, and Bernd Kuhlenkötter. 2024. "Test Rig for Investigating the Functional and Structural Fatigue of Shape Memory Alloy Wires Based on Different Activation Profiles" Materials 17, no. 6: 1400. https://doi.org/10.3390/ma17061400