
Luminescence Properties of ZrO2: Ti Ceramics Irradiated with Electrons and High-Energy Xe Ions

 , , , , ,
Abstract
:1. Introduction
2. Materials and Methods
3. Results and Discussion
4. Conclusions
Author Contributions
Funding
Data Availability Statement
Acknowledgments
Conflicts of Interest
References
- Carter, B.C.; Norton, G.M. Ceramic Materials; Science and Engineering; Springer: New York, NY, USA, 2007; Volume XXII, p. 716. [Google Scholar] [CrossRef]
- Çetinkaya, Z.; Güneş, E.; Şavklıyıldız, İ. Investigation of biochemical properties of flash sintered ZrO2–SnO2 nanofibers. Mater. Chem. Phys. 2023, 293, 126900. [Google Scholar] [CrossRef]
- Biçer, H.; Degnah, A.; Salur, E.; Şavklıyıldız, I.; Tsakalakos, T.; Akdogan, K.E. Multicycle flash sintering of cubic Y2O3-stabilized ZrO2: An in situ energy dispersive synchrotron x-ray diffraction study with high temporal resolution. Mater. Today Commun. 2022, 33, 104272. [Google Scholar] [CrossRef]
- Horowitz, Y.S. Thermoluminescence and Thermoluminescent Dosimetry, 1st ed.; CRC Press Taylor and Francis Group: New York, NY, USA, 2019; Volume 3, p. 200. [Google Scholar]
- Salah, N.; Khan, Z.H.; Habib, S.S. Nanoparticles of Al2O3: Cr as a sensitive thermoluminescent material for high exposures of gamma rays irradiations. Nucl. Instrum. Methods Phys. Res. Sect. B Beam Interact. Mater. At. 2011, 269, 401–404. [Google Scholar] [CrossRef]
- Frolov, E.I.; Zvonarev, S.V.; Moschensky, Y.V.; Chesnokov, K.Y.; Chukin, A.V.; Abramov, A.V.; Churkin, V.Y.; Moiseykin, E.V.; Obvintseva, N.V. Synthesis, characterization and luminescent properties of Mg-and Cr-doped alumina ceramics. AIP Conf. Proc. 2020, 2280, 050019. [Google Scholar] [CrossRef]
- Zvonarev, S.V.; Churkin, V.Y.; Pankov, V.A.; Chesnokov, K.Y.; Chukin, A.V.; Abramov, A.V. Luminescence of alumina ceramic doped with lanthanum under medium-and high-dose irradiation. Nucl. Instrum. Methods Phys. Res. Sect. B Beam Interact. Mater. At. 2020, 465, 42–46. [Google Scholar] [CrossRef]
- Zvonarev, S.V.; Frolov, E.I.; Pankov, V.A.; Churkint, V.Y. Pulse cathodo-and thermoluminescence of alumina ceramic with manganese. J. Phys. Conf. Ser. 2018, 1115, 052014. [Google Scholar] [CrossRef]
- Zvonarev, S.V.; Pankov, V.A.; Churkin, V.Y.; Chesnokov, K.Y.; Chukin, A.V.; Abramov, A.V. Luminescence of impurity and intrinsic defects of Na-doped alumina ceramic. Nucl. Instrum. Methods Phys. Res. Sect. B Beam Interact. Mater. At. 2020, 471, 53–58. [Google Scholar] [CrossRef]
- Salas-Juarez, C.J.; Ugalde-Vald’es, M.A.; Guzman-Mendoza, J.; Nolasco-Altamirano, D.; Martínez-Gil, M.; Gomez-Dominguez, C.E.; Guarin, C.A.; Melendrez, R.; Rivera-Montalvo, T. Persistent luminescence of commercial TLD-100 dosimeter: Using shallow traps for radiation dosimetry. Radiat. Meas. 2023, 167, 106997. [Google Scholar] [CrossRef]
- Sinclair, S.A.; Pech-Canul, M.I. Development feasibility of TLD phosphors and thermoluminescent composite materials for potential applications in dosimetry: A review. Chem. Eng. J. 2022, 443, 136522. [Google Scholar] [CrossRef]
- Seth, P.; Jain, A.; Goswami, L.; Gupta, G.; Aggarwal, S. Defect Induced MgO: Li, Sm nanophosphor as a new highly sensitive material for thermoluminescence dosimetry. J. Alloys Compd. 2023, 965, 171329. [Google Scholar] [CrossRef]
- Sommer, M.; Jahn, A.; Henniger, J. A new personal dosimetry system for HP (10) and HP (0.07) photon dose based on OSL-dosimetry of beryllium oxide. Radiat. Meas. 2011, 46, 1818–1821. [Google Scholar] [CrossRef]
- Altunal, V.; Guckan, V.; Yu, Y.; Dicker, A.; Yegingil, Z. A newly developed OSL dosimeter based on beryllium oxide: BeO: Na, Dy, Er. J. Lumin. 2020, 222, 117140. [Google Scholar] [CrossRef]
- Zahedifar, M.; Mehrabi, M.; Modarres, M.; Harooni, S. Thermoluminescece properties of BeO: Mg nanoparticles produced by sol-gel method. J. Nanostructures 2011, 1, 199–203. [Google Scholar] [CrossRef]
- Rivera, T.; Vega, H.R.; Azorin, J.; Manzanares, E.; Gonzalez, P.R.; Furetta, C. Thermal neutron equivalent dose measurements with nanostructured zirconia. Radiat. Eff. Defects Solids 2009, 164, 224–231. [Google Scholar] [CrossRef]
- Horowitz, Y.S.; Oster, L.; Eliyahu, I. The saga of the thermoluminescence (TL) mechanisms and dosimetric characteristics of LiF: Mg, Ti (TLD-100). J. Lumin. 2019, 214, 116527. [Google Scholar] [CrossRef]
- Kafadar, V.E.; Majeed, K.F. The effect of heating rate on the dose dependence and thermoluminescence characteristics of CaSO4: Dy (TLD-900). Thermochim. Acta 2014, 590, 266–269. [Google Scholar] [CrossRef]
- Chopra, V.; El-Faramawy, N.; Dhoble, S.J. Thermoluminescent study of borates for dosimetric applications. In Phosphor Handbook; Woodhead Publishing: Sawston, UK, 2023; pp. 393–415. [Google Scholar] [CrossRef]
- Nieto, J.A. Present status and future trends in the development of thermoluminescent materials. Appl. Radiat. Isot. 2016, 117, 135–142. [Google Scholar] [CrossRef]
- Ekdal, E.; Karal, T.; Kelemen, A.; Ignatovych, M.; Holovey, V.; Harmansah, C. Thermoluminescence characteristics of Li2B4O7 single crystal dosimeters doped with Mn. Radiat. Phys. Chem. 2014, 96, 201–204. [Google Scholar] [CrossRef]
- Li, Y.; Xu, S.; Meng, F.; Jiang, H.; Yao, S.; Zhang, X.; Liu, J.; Sun, X.; Wang, L.; Mahadevan, C.K. Insight into the structural, mechanical and optical properties of NaCl:Tb crystals for the WLED and TLD applications. Ceram. Int. 2023, 49, 28274–28282. [Google Scholar] [CrossRef]
- Duragkar, A.; Muley, A.; Pawar, N.R.; Chopra, V.; Dhoble, N.S.; Chimankar, O.P.; Dhoble, S.J. Versatility of thermoluminescence materials and radiation dosimetry—A review. Luminescence 2019, 34, 656–665. [Google Scholar] [CrossRef]
- Cruz-Vázquez, C.; Bernal, R.; Burruel-Ibarra, S.E.; Grijalva-Monteverde, H.; Barboza-Flores, M. Thermoluminescence properties of new ZnO nanophosphors exposed to beta irradiation. Opt. Mater. 2005, 27, 1235–1239. [Google Scholar] [CrossRef]
- Dhar, A.; DeWerd, L.A.; Stoebe, T.G. Direct-response ultraviolet thermoluminescent dosimeter. Med. Phys. 1976, 3, 415–417. [Google Scholar] [CrossRef] [PubMed]
- Soliman, C. Thermoluminescence behavior of magnesium oxide exposed to gamma and ultraviolet radiations. Radiat. Eff. Defects Solids 2009, 164, 257–265. [Google Scholar] [CrossRef]
- Nattudurai, R.; Arous, D.; Edin, N.F.J.; Pandey, A.; Malinen, E. New characterization and evaluation of BaSO4: Eu as a thermoluminescent radiation dosimeter. Nucl. Inst. Methods Phys. Res. B 2023, 541, 19–25. [Google Scholar] [CrossRef]
- Cañez-Morales, M.; Cruz-Vázquez, C.; Avilés-Monreal, R.; Bernal, R. Beta particle excited thermoluminescence of new ZnO:Ce phosphors. Opt. Mater. 2023, 141, 113963. [Google Scholar] [CrossRef]
- Azorín-Vega, J.C.; Azorin-Nieto, J.; Garcia-Hipolito, M.; Rivera-Montalvo, T. Thermoluminescence properties of TiO2 nanopowder. Radiat. Meas. 2007, 42, 613–616. [Google Scholar] [CrossRef]
- Zahedifar, M.; Sadeghi, E. Thermoluminescence dosimetry properties of new Cu doped CaF2 nanoparticles. Radiat. Prot. Dosim. 2013, 157, 303–309. [Google Scholar] [CrossRef]
- Wang, Z.; Zhang, J.; Zheng, G.; Liu, Y.; Zhao, Y. The unusual variations of photoluminescence and afterglow properties in monoclinic ZrO2 by annealing. J. Lumin. 2012, 132, 2817–2821. [Google Scholar] [CrossRef]
- Aleksanyan, E.; Kirm, M.; Feldbach, E.; Harutyunyan, V. Identification of F+ centers in hafnia and zirconia nanopowders. Radiat. Meas. 2016, 90, 84–89. [Google Scholar] [CrossRef]
- Paje, S.E.; Llopis, J. Photoluminescence decay and time-resolved spectroscopy of cubic yttria-stabilized zirconia. Appl. Phys. A 1994, 59, 569–574. [Google Scholar] [CrossRef]
- Phatak, G.M.; Gangadharan, K.; Pal, H.; Mittal, J.P. Luminescence properties of Ti-doped gem-grade zirconia powders. Bull. Mater. Sci. 1994, 17, 163–169. [Google Scholar] [CrossRef]
- Ito, T.; Maeda, M.; Nakamura, K. Similarities in photoluminescence in hafnia and zirconia induced by ultraviolet photons. J. Appl. Phys. 2005, 97, 054104. [Google Scholar] [CrossRef]
- Cong, Y.; Li, B.; Yue, S.; Fan, D.; Wang, X. Effect of oxygen vacancy on phase transition and photoluminescence properties of nanocrystalline zirconia synthesized by the one-pot reaction. J. Phys. Chem. C 2009, 113, 13974–13978. [Google Scholar] [CrossRef]
- Smits, K.; Grigorjeva, L.; Millers, D.; Sarakovskis, A.; Grabis, J.; Lojkowski, W. Intrinsic defect related luminescence in ZrO2. J. Lumin. 2011, 131, 2058–2062. [Google Scholar] [CrossRef]
- Carvalho, J.M.; Rodrigues, L.C.V.; Hölsä, J.; Lastusaari, M.; Nunes, L.A.O.; Felinto, C.F.C.; Malta, O.L.; Brito, H.F. Influence of titanium and lutetium on the persistent luminescence of ZrO2. Opt. Mater. Express 2012, 2, 331–340. [Google Scholar] [CrossRef]
- Puust, L.; Kiisk, V.; Utt, K.; Mändar, H.; Sildos, I. Afterglow and thermoluminescence of ZrO2 nanopowders. Cent. Eur. J. Phys. 2014, 12, 415–420. [Google Scholar] [CrossRef]
- Kiisk, V.; Puust, L.; Utt, K.; Maaroos, A.; Mändar, H.; Erica, V.; Fabio, P.; Rando, S.; Urmas, J.; Ilmo, S. Photo-, thermo-and optically stimulated luminescence of monoclinic zirconia. J. Lumin. 2016, 74, 49–55. [Google Scholar] [CrossRef]
- Salas-Juarez, C.J.; Burruel-Ibarra, S.E.; Gil-Tolano, M.I.; Perez Rodriguez, A.; Romo-Garcia, F.; Garcia-Haro, A.R.; Brown, F.; Yacaman-Valdez, M.; Iriqui-Razcon, J.L.; Martinez-Gil, M.; et al. Persistent luminescence of ZrO2:Tb3+ after beta particle irradiation for dosimetry applications. J. Lumin. 2023, 257, 119712. [Google Scholar] [CrossRef]
- Lokesha, H.S.; Chithambo, M.L.; Chikwembani, S. Thermoluminescence of monoclinic ZrO2: Kinetic analysis and dosimetric features. J. Lumin. 2020, 218, 116864. [Google Scholar] [CrossRef]
- Bettinali, C.; Ferraresso, G.; Manconi, J.W. Thermoluminescence of ZrO2. J. Chem. Phys. 1969, 50, 3957–3961. [Google Scholar] [CrossRef]
- Iacconi, P.; Lapraz, D.; Caruba, R. Traps and emission centres in thermoluminescent ZrO2. Phys. Stat. Sol. (A) 1978, 50, 275–283. [Google Scholar] [CrossRef]
- Costantini, J.M.; Beuneu, F. Color center annealing and ageing in electron and ion-irradiated yttria-stabilized zirconia. Nucl. Instrum. Methods Phys. Res. Sect. B Beam Interact. Mater. At. 2005, 230, 251–256. [Google Scholar] [CrossRef]
- Costantini, J.M.; Beuneu, F.; Fasoli, M.; Galli, A.; Vedda, A.; Martini, M. Thermo-stimulated luminescence of ion-irradiated yttria-stabilized zirconia. J. Phys. Condens. Matter 2011, 23, 115901. [Google Scholar] [CrossRef]
- Nikiforov, S.V.; Menshenina, A.A.; Konev, S.F. The influence of intrinsic and impurity defects on the luminescent properties of zirconia. J. Lumin. 2019, 212, 219–226. [Google Scholar] [CrossRef]
- Cleland, M.R.; Parks, L.A.; Cheng, S. Applications for radiation processing of materials. Nucl. Instrum. Methods Phys. Res. Sect. B Beam Interact. Mater. At. 2003, 208, 66–73. [Google Scholar] [CrossRef]
- Yücel, E.; Yücel, Y. Fabrication and characterization of Sr-doped PbS thin films grown by CBD. Ceram. Int. 2017, 43, 407–413. [Google Scholar] [CrossRef]
- Ravishankar, S.; Balu, A.R.; Usharani, K.; Balamurugan, S.; Prabha, D.; Nagarethinam, V.S. Optical and magnetic properties of PbS thin films doped with Fe2+ ions. Optik 2017, 134, 121–127. [Google Scholar] [CrossRef]
- Altunal, V.; Guckan, V.; Ozdemir, A.; Sotelo, A.; Yegingil, Z. Effect of sintering temperature on dosimetric properties of BeO ceramic pellets synthesized using precipitation method. Nucl. Instrum. Methods Phys. Res. Sect. B Beam Interact. Mater. At. 2019, 441, 46–55. [Google Scholar] [CrossRef]
- Atas, M.S. The relationship between reinforcement ratio and e-beam irradiation in Y2O3 reinforced Al6061 Alloys: A crystallographic assessment. Nucl. Instrum. Methods Phys. Res. B 2024, 548, 165252. [Google Scholar] [CrossRef]
- Kitis, G.; Gomez-Ros, J.M.; Tuyn, J.W.N. Thermoluminescence glow-curve deconvolution functions for first, second and general orders of kinetics. J. Phys. D Appl. Phys. 1998, 31, 2636–2641. [Google Scholar] [CrossRef]
- Chen, R.; McKeever, S.W.S. Theory of Thermoluminescence and Related Phenomena; World Scientific: Singapore, 1997; 559p. [Google Scholar] [CrossRef]
- Nikiforov, S.V.; Kortov, V.S.; Kazantseva, M.G.; Petrovykh, K.A. Luminescent properties of monoclinic zirconium oxide. J. Lumin. 2015, 166, 111–116. [Google Scholar] [CrossRef]
- Ananchenko, D.V.; Nikiforov, S.V.; Sobyanin, K.V.; Konev, S.F.; Dauletbekova, A.K.; Akhmetova-Abdik, G.; Akilbekov, A.T.; Popov, A.I. Paramagnetic Defects and Thermoluminescence in Irradiated Nanostructured Monoclinic Zirconium Dioxide. Materials 2022, 15, 8624. [Google Scholar] [CrossRef]
- Garcia, S.J.; Bausa, L.E.; Jaque, D. An Introduction to the Optical Spectroscopy of Inorganic Solids; John Wiley and Sons, Ltd.: Hoboken, NJ, USA, 2005; 283p. [Google Scholar]
- Chen, R.; Lawless, L.L.; Pagonis, V. A model for explaining the concentration quenching of thermoluminescence. Radiat. Meas. 2011, 46, 1380–1384. [Google Scholar] [CrossRef]
- Pagonis, V.; Kitis, G.; Polymeris, G.S. Quantum tunneling processes in feldspars: Using thermoluminescence signals in thermochronometry. Radiat. Meas. 2020, 134, 106325. [Google Scholar] [CrossRef]


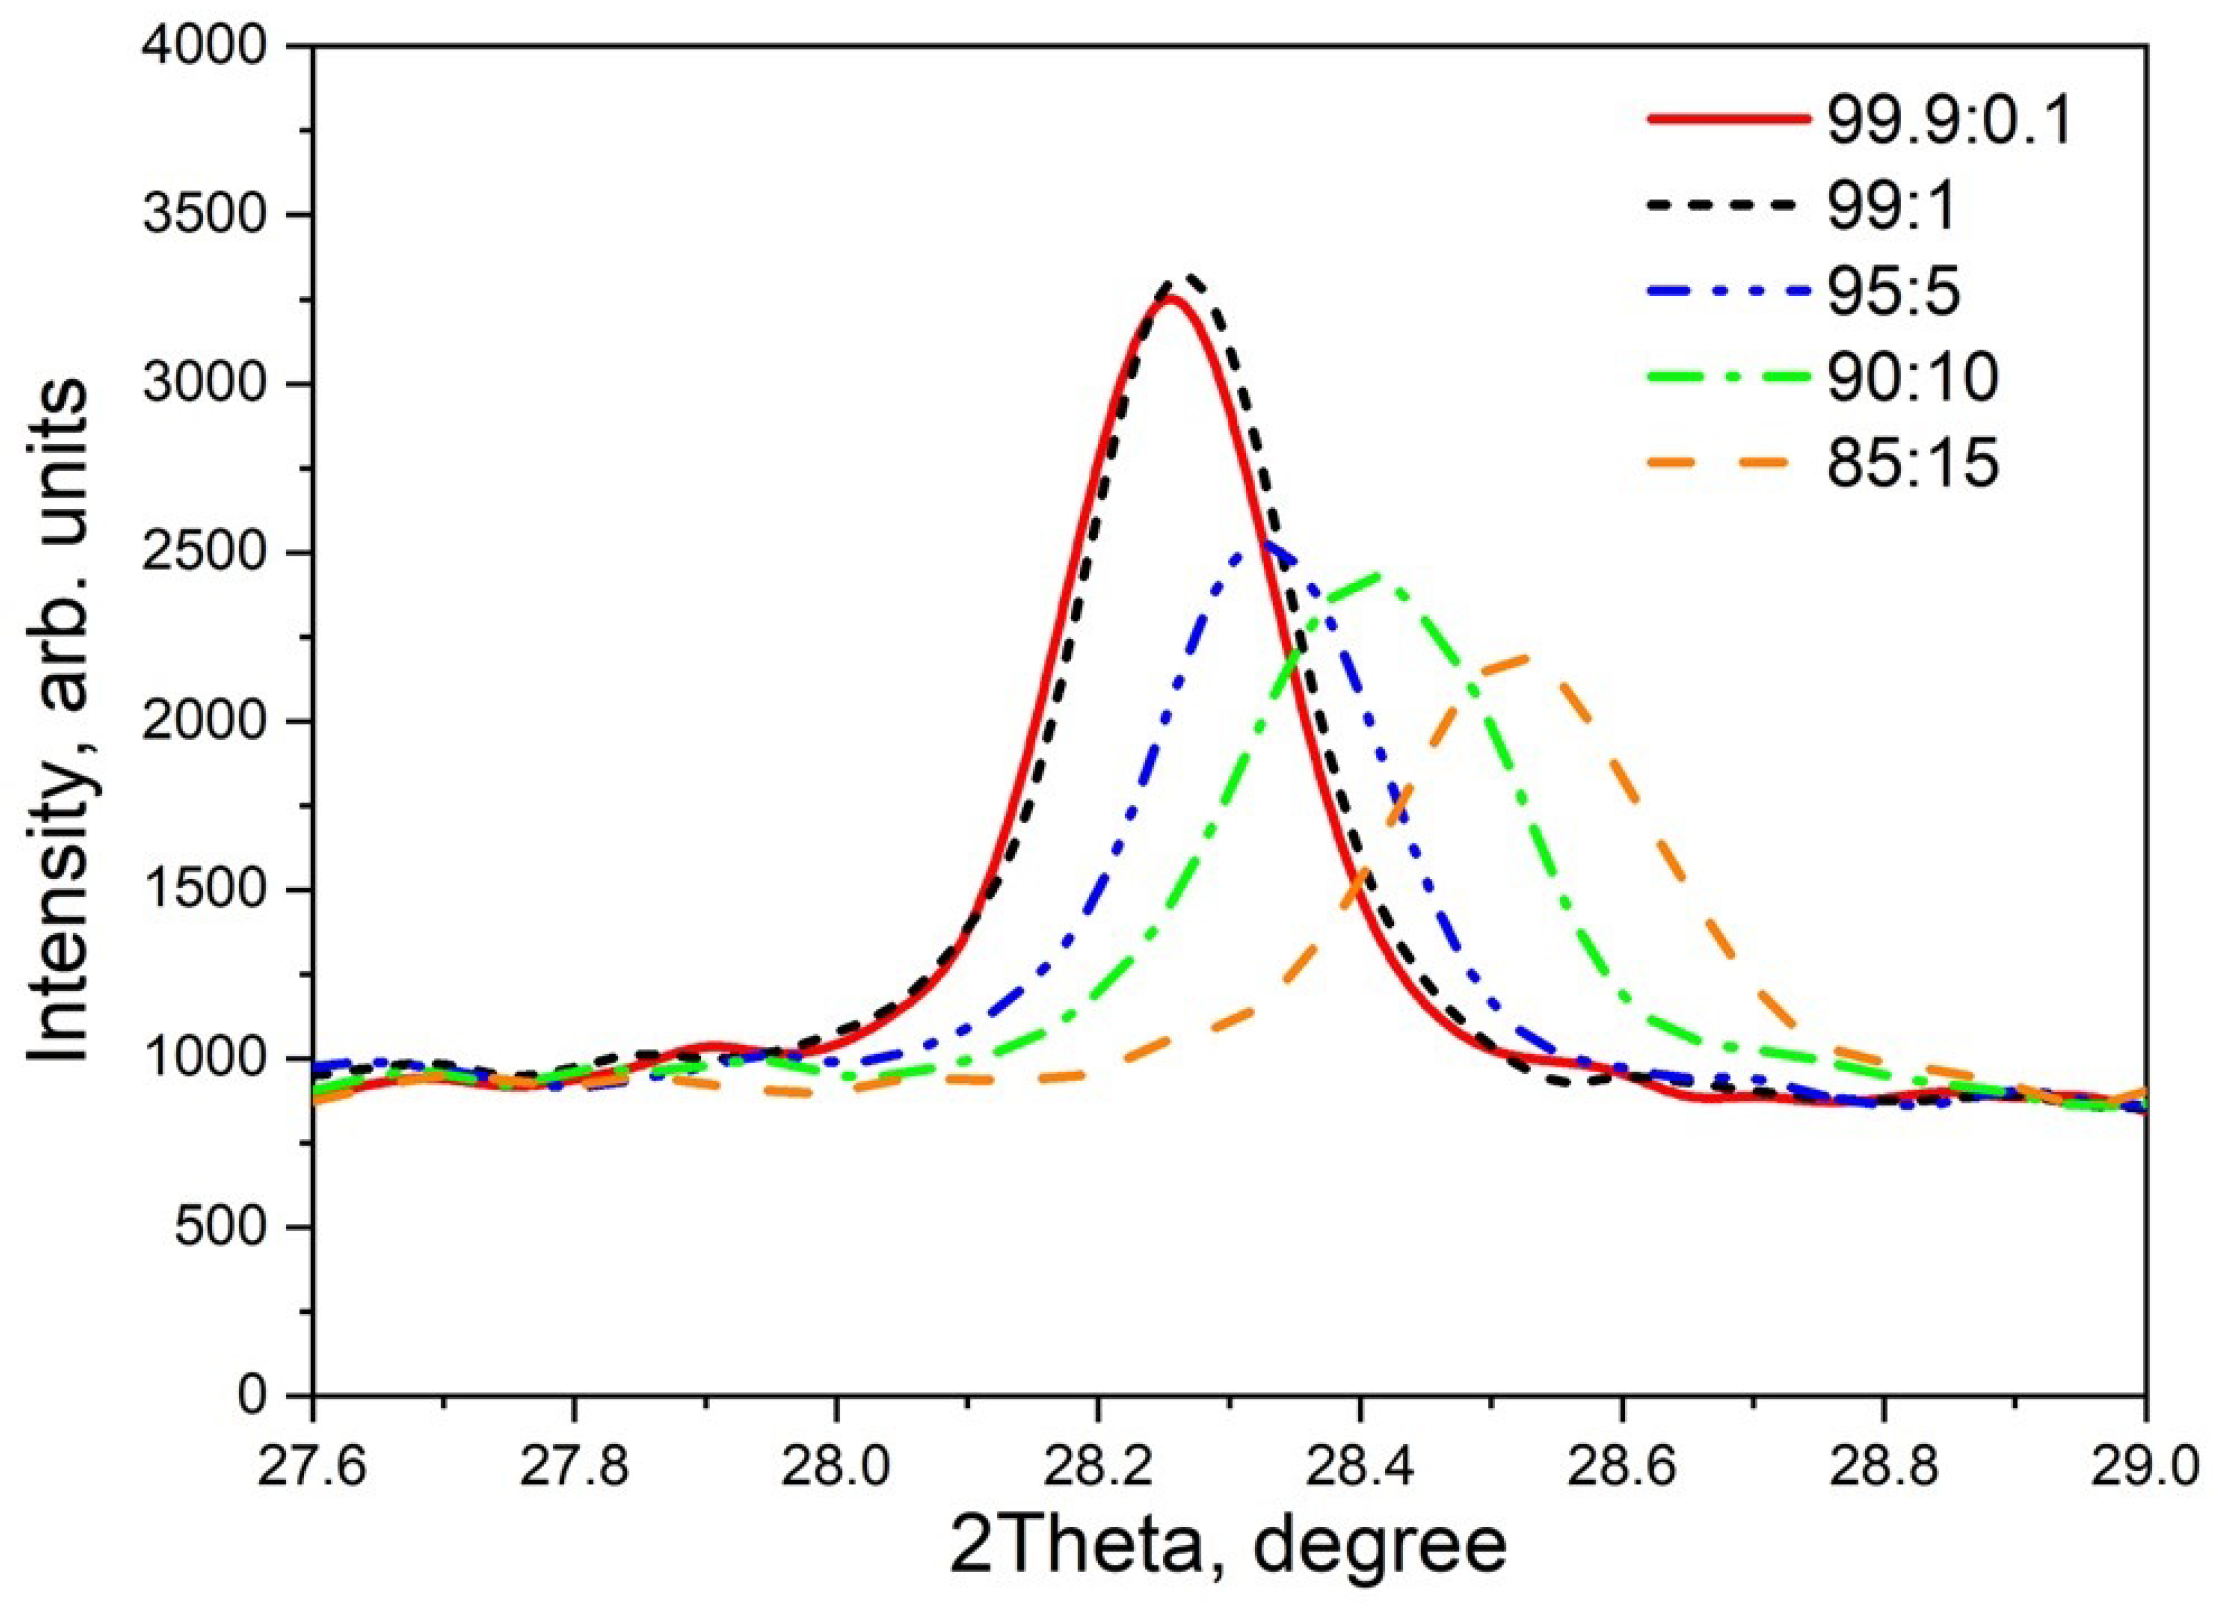
| Sample (ZrO2:TiO2) | Lattice Parameters, Å | Reflex 2θ = 28.3° Half-Width | Crystallite Size, nm |
|---|---|---|---|
| 99.9:0.1 | a = 5.1493 b = 5.2013 c = 5.32003 beta = 99.23° | 0.1514 | 200 |
| 99:1 | a = 5.1464 b = 5.1996 c = 5.3178 beta = 99.22° | 0.1554 | 180 |
| 95:5 | a = 5.1360 b = 5.1801 c = 5.3167 beta = 99.15° | 0.1634 | 150 |
| 90:10 | a = 5.1265 b = 5.1535 c = 5.3216 beta = 99.32° | 0.2070 | 85 |
| 85:15 | a = 5.1115 Å b = 5.1344 Å c = 5.3223 Å beta = 98.82° | 0.2121 | 80 |
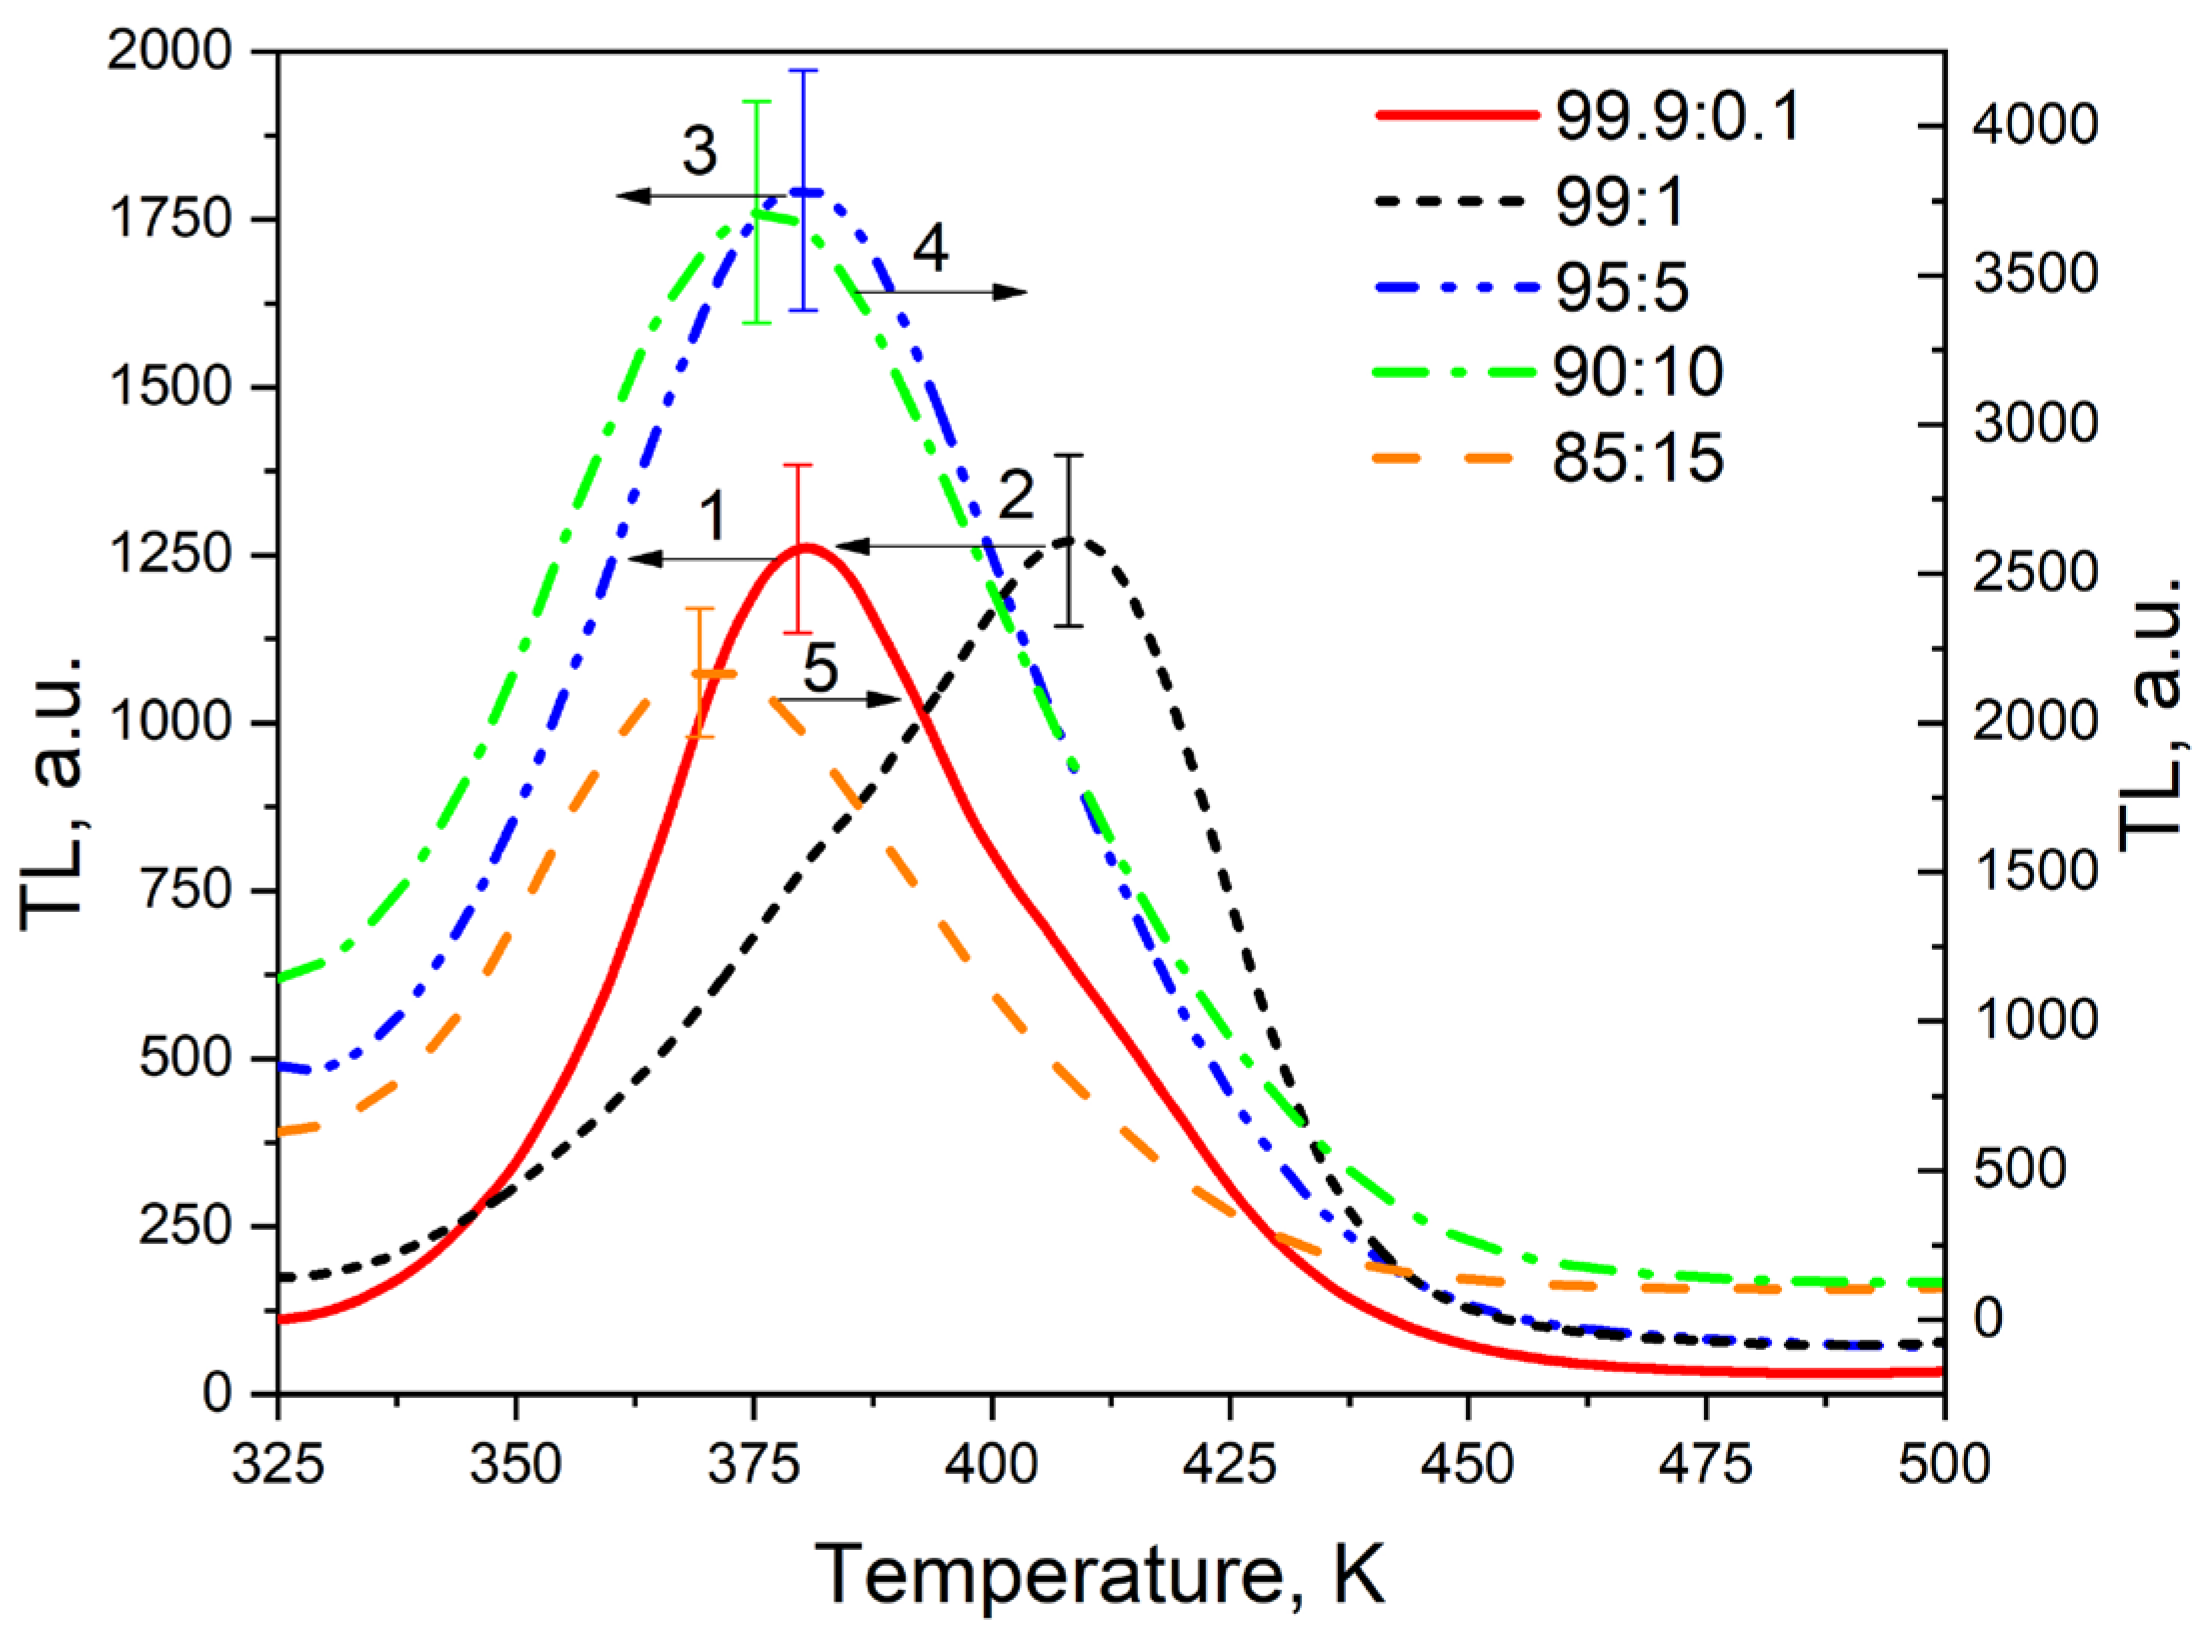
| Peak | Parameter | Impurity Level (ZrO2:TiO2) | ||||
|---|---|---|---|---|---|---|
| 99.9:0.1 | 99:1 | 95:5 | 90:10 | 85:15 | ||
| A | Tm, K | 358 | 355 | 361 | 363 | 363 |
| E, eV | 0.80 | 0.80 | 0.80 | 0.80 | 0.80 | |
| S, s−1 | 2.5·1010 | 3.1·1010 | 1.9·1010 | 1.7·1010 | 1.7·1010 | |
| b | 2.00 | 1.96 | 2.00 | 2.00 | 2.00 | |
| B | Tm, K | 379 | 379 | 383 | 384 | 376 |
| E, eV | 0.94 | 0.95 | 0.94 | 0.93 | 0.94 | |
| S, s−1 | 5.1·1011 | 5.7·1011 | 3.1·1011 | 2.3·1011 | 5.5·1011 | |
| b | 1.51 | 1.51 | 1.59 | 1.58 | 1.61 | |
| C | Tm, K | 410 | 409 | 411 | 413 | 404 |
| E, eV | 1.09 | 1.11 | 1.08 | 1.09 | 1.10 | |
| S, s−1 | 3.2·1012 | 6.8·1012 | 2.7·1012 | 3.0·1012 | 8.2·1012 | |
| b | 1.58 | 1.49 | 1.59 | 1.60 | 1.59 | |
| FOM, % | 2.7 | 2.4 | 4.4 | 4.5 | 3.4 | |
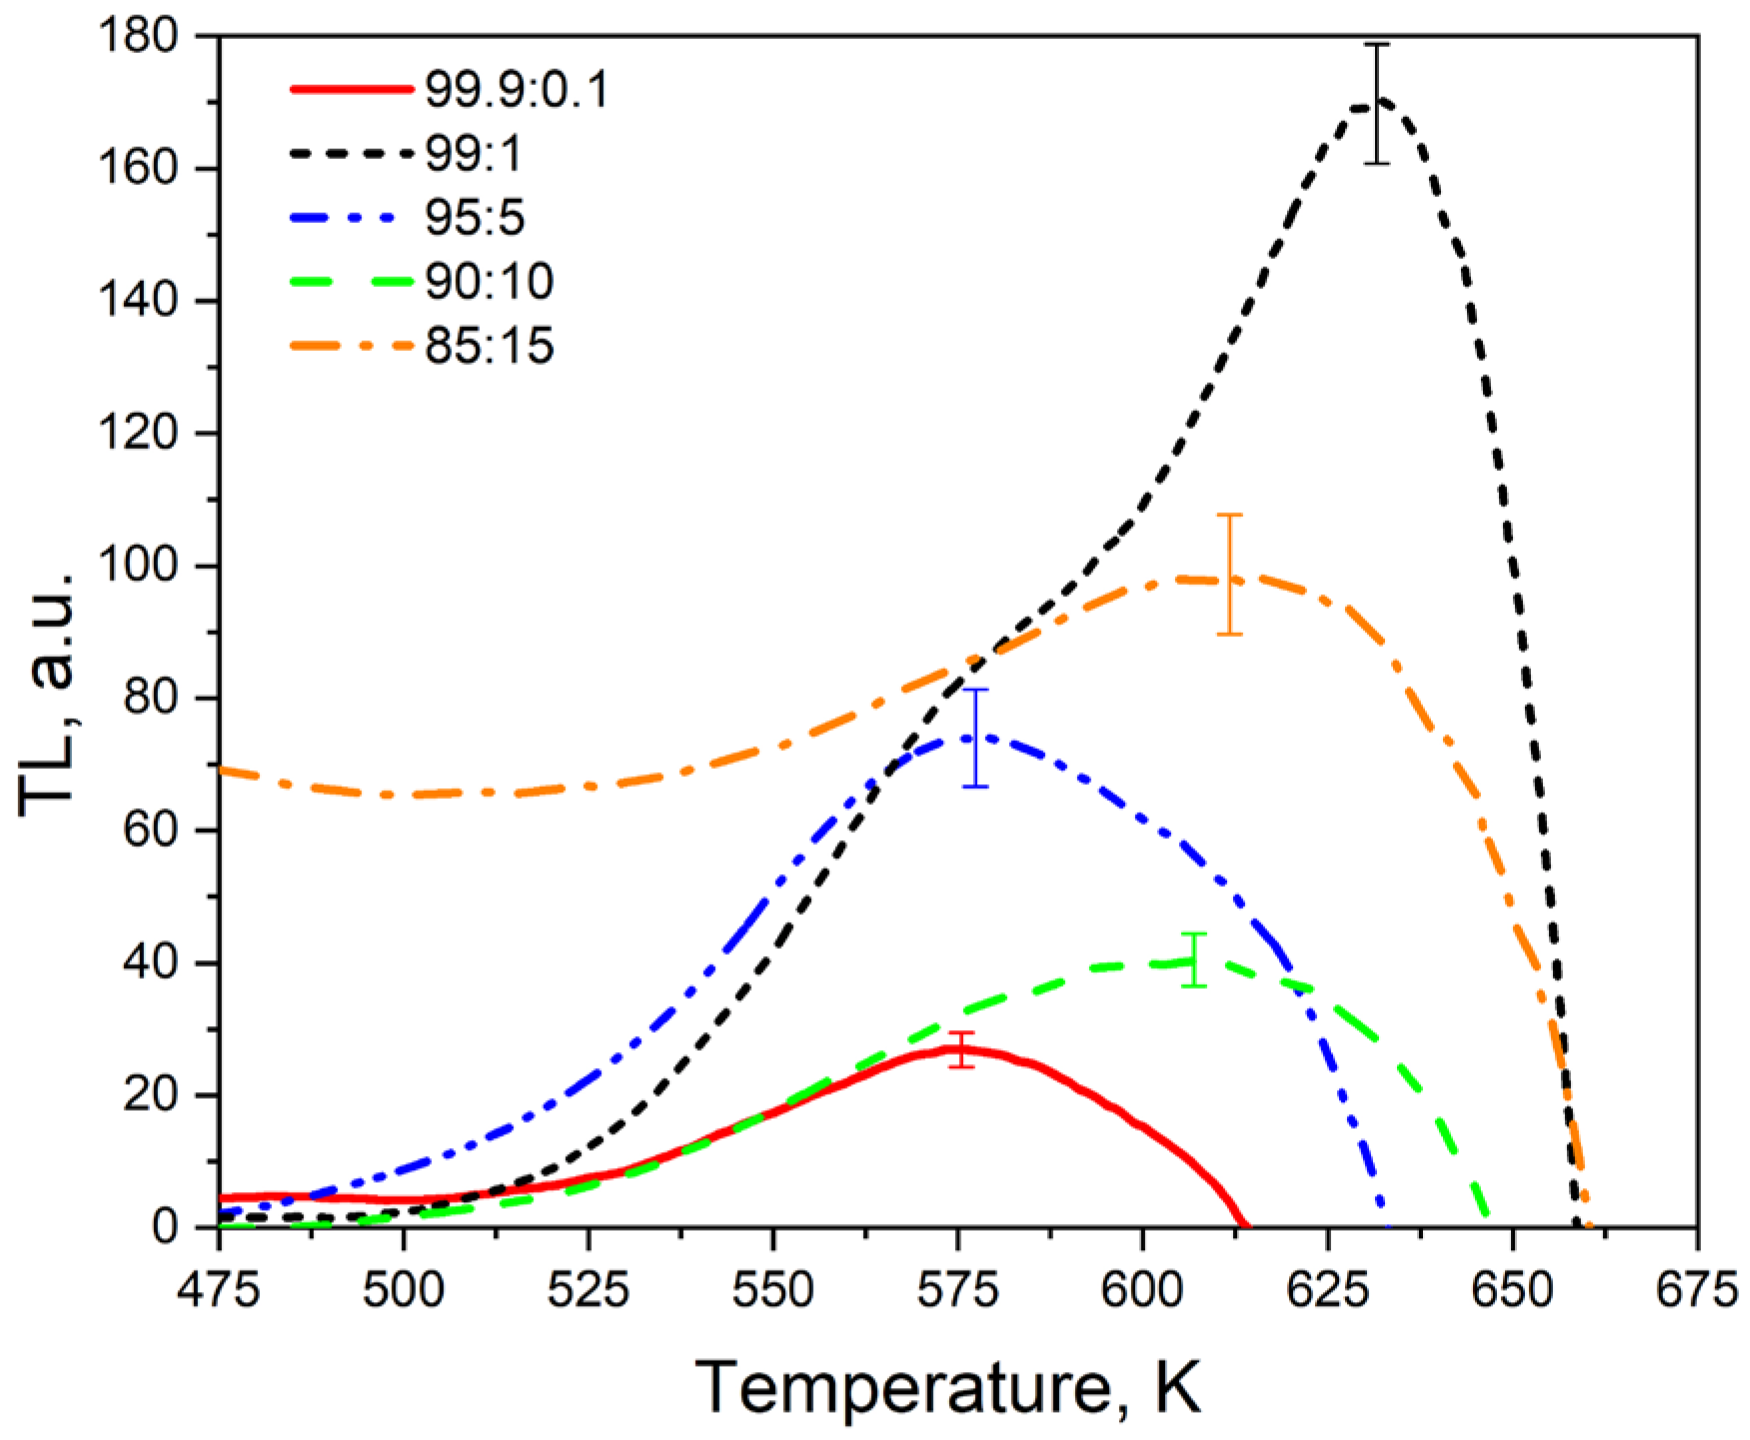
| Peak | Parameter | Impurity Level (ZrO2:TiO2) | |||
|---|---|---|---|---|---|
| 99.9:0.1 | 99:1 | 95:5 | 90:10 | ||
| A | Tm, K | 575 | 577 | 570 | 577 |
| E, eV | 1.23 | 1.23 | 1.14 | 1.20 | |
| S, s−1 | 5.2·109 | 4.7·109 | 9.7·108 | 2.4·109 | |
| b | 1.11 | 1.14 | 1.17 | 1.19 | |
| B | Tm, K | - | 611 | 611 | 607 |
| E, eV | - | 2.09 | 2.11 | 2.10 | |
| S, s−1 | - | 2.5·1016 | 3.2·1016 | 3.4·1016 | |
| b | - | 1.00 | 1.00 | 1.00 | |
| C | Tm, K | - | 636 | - | 627 |
| E, eV | - | 2.20 | - | 2.20 | |
| S, s−1 | - | 3.4·1016 | - | 6.1·1016 | |
| b | - | 1.00 | - | 1.00 | |
| FOM, % | 2.9 | 4.6 | 2.9 | 3.3 | |
Disclaimer/Publisher’s Note: The statements, opinions and data contained in all publications are solely those of the individual author(s) and contributor(s) and not of MDPI and/or the editor(s). MDPI and/or the editor(s) disclaim responsibility for any injury to people or property resulting from any ideas, methods, instructions or products referred to in the content. |
© 2024 by the authors. Licensee MDPI, Basel, Switzerland. This article is an open access article distributed under the terms and conditions of the Creative Commons Attribution (CC BY) license (https://creativecommons.org/licenses/by/4.0/).
Share and Cite
Dauletbekova, A.; Zvonarev, S.; Nikiforov, S.; Akilbekov, A.; Shtang, T.; Karavannova, N.; Akylbekova, A.; Ishchenko, A.; Akhmetova-Abdik, G.; Baymukhanov, Z.; et al. Luminescence Properties of ZrO2: Ti Ceramics Irradiated with Electrons and High-Energy Xe Ions. Materials 2024, 17, 1307. https://doi.org/10.3390/ma17061307
Dauletbekova A, Zvonarev S, Nikiforov S, Akilbekov A, Shtang T, Karavannova N, Akylbekova A, Ishchenko A, Akhmetova-Abdik G, Baymukhanov Z, et al. Luminescence Properties of ZrO2: Ti Ceramics Irradiated with Electrons and High-Energy Xe Ions. Materials. 2024; 17(6):1307. https://doi.org/10.3390/ma17061307
Chicago/Turabian StyleDauletbekova, Alma, Sergey Zvonarev, Sergey Nikiforov, Abdirash Akilbekov, Tatiana Shtang, Natalia Karavannova, Aiman Akylbekova, Alexey Ishchenko, Gulzhanat Akhmetova-Abdik, Zein Baymukhanov, and et al. 2024. "Luminescence Properties of ZrO2: Ti Ceramics Irradiated with Electrons and High-Energy Xe Ions" Materials 17, no. 6: 1307. https://doi.org/10.3390/ma17061307