
MgO/KH2PO4 and Curing Moisture Content in MKPC Matrices to Optimize the Immobilization of Pure Al and Al-Mg Alloys
 , and
, and
Abstract
:1. Introduction
2. Materials and Methodology
2.1. Raw Materials
2.2. MKPC Mortar and Cement Paste Preparation
2.3. Characterization Methodology
2.3.1. MKPC Matrix Characterization
2.3.2. Aluminium Corrosion Characterization
- -
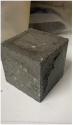
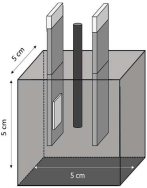
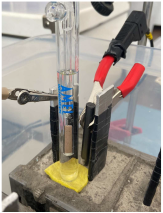
- A three-electrode cell was used for prismatic MKPC 5 × 5 × 5 cm mortars with different M/P ratios (1, 2, and 3 molar) at 100%RH (see Table 4, point a), which includes two embedded coupons of A1050 and AA5754 alloy as working electrodes, and a bar of graphite of 5 mm ∅ as counter electrode. A distance of 1 cm between working electrode and counter electrode was used. An external reference electrode of Ag/AgCl was employed.
- -
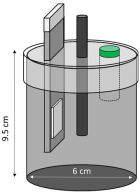
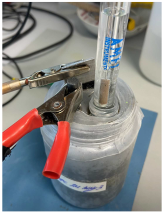
- A three-electrode cell configuration for 9.5 × 6 cm cylinder MKPC 1M mortars under isolated curing were applied. Hermetic plastic containers covered with parafilm were employed to isolate the samples from the atmosphere and prevent evaporation (see Table 4, point b). Pure A1050 or AA5754 alloy as working electrodes and graphite as a counter electrode were used, spaced at 1.5 cm. An external Ag/AgCl electrode was employed for corrosion potential measurements (Ecorr).
3. Results
3.1. Characterization of MKPC Matrix Performance
3.2. Characterization of Al Alloy Corrosion in MKPC Matrices
4. Discussion
4.1. Effect of MKPC Matrix Changes and Microstructural Stability
4.2. Effect of MKPC Matrix Changes on Al Alloy Corrosion Kinetics and Risk of H2 Evolution
5. Conclusions
- -
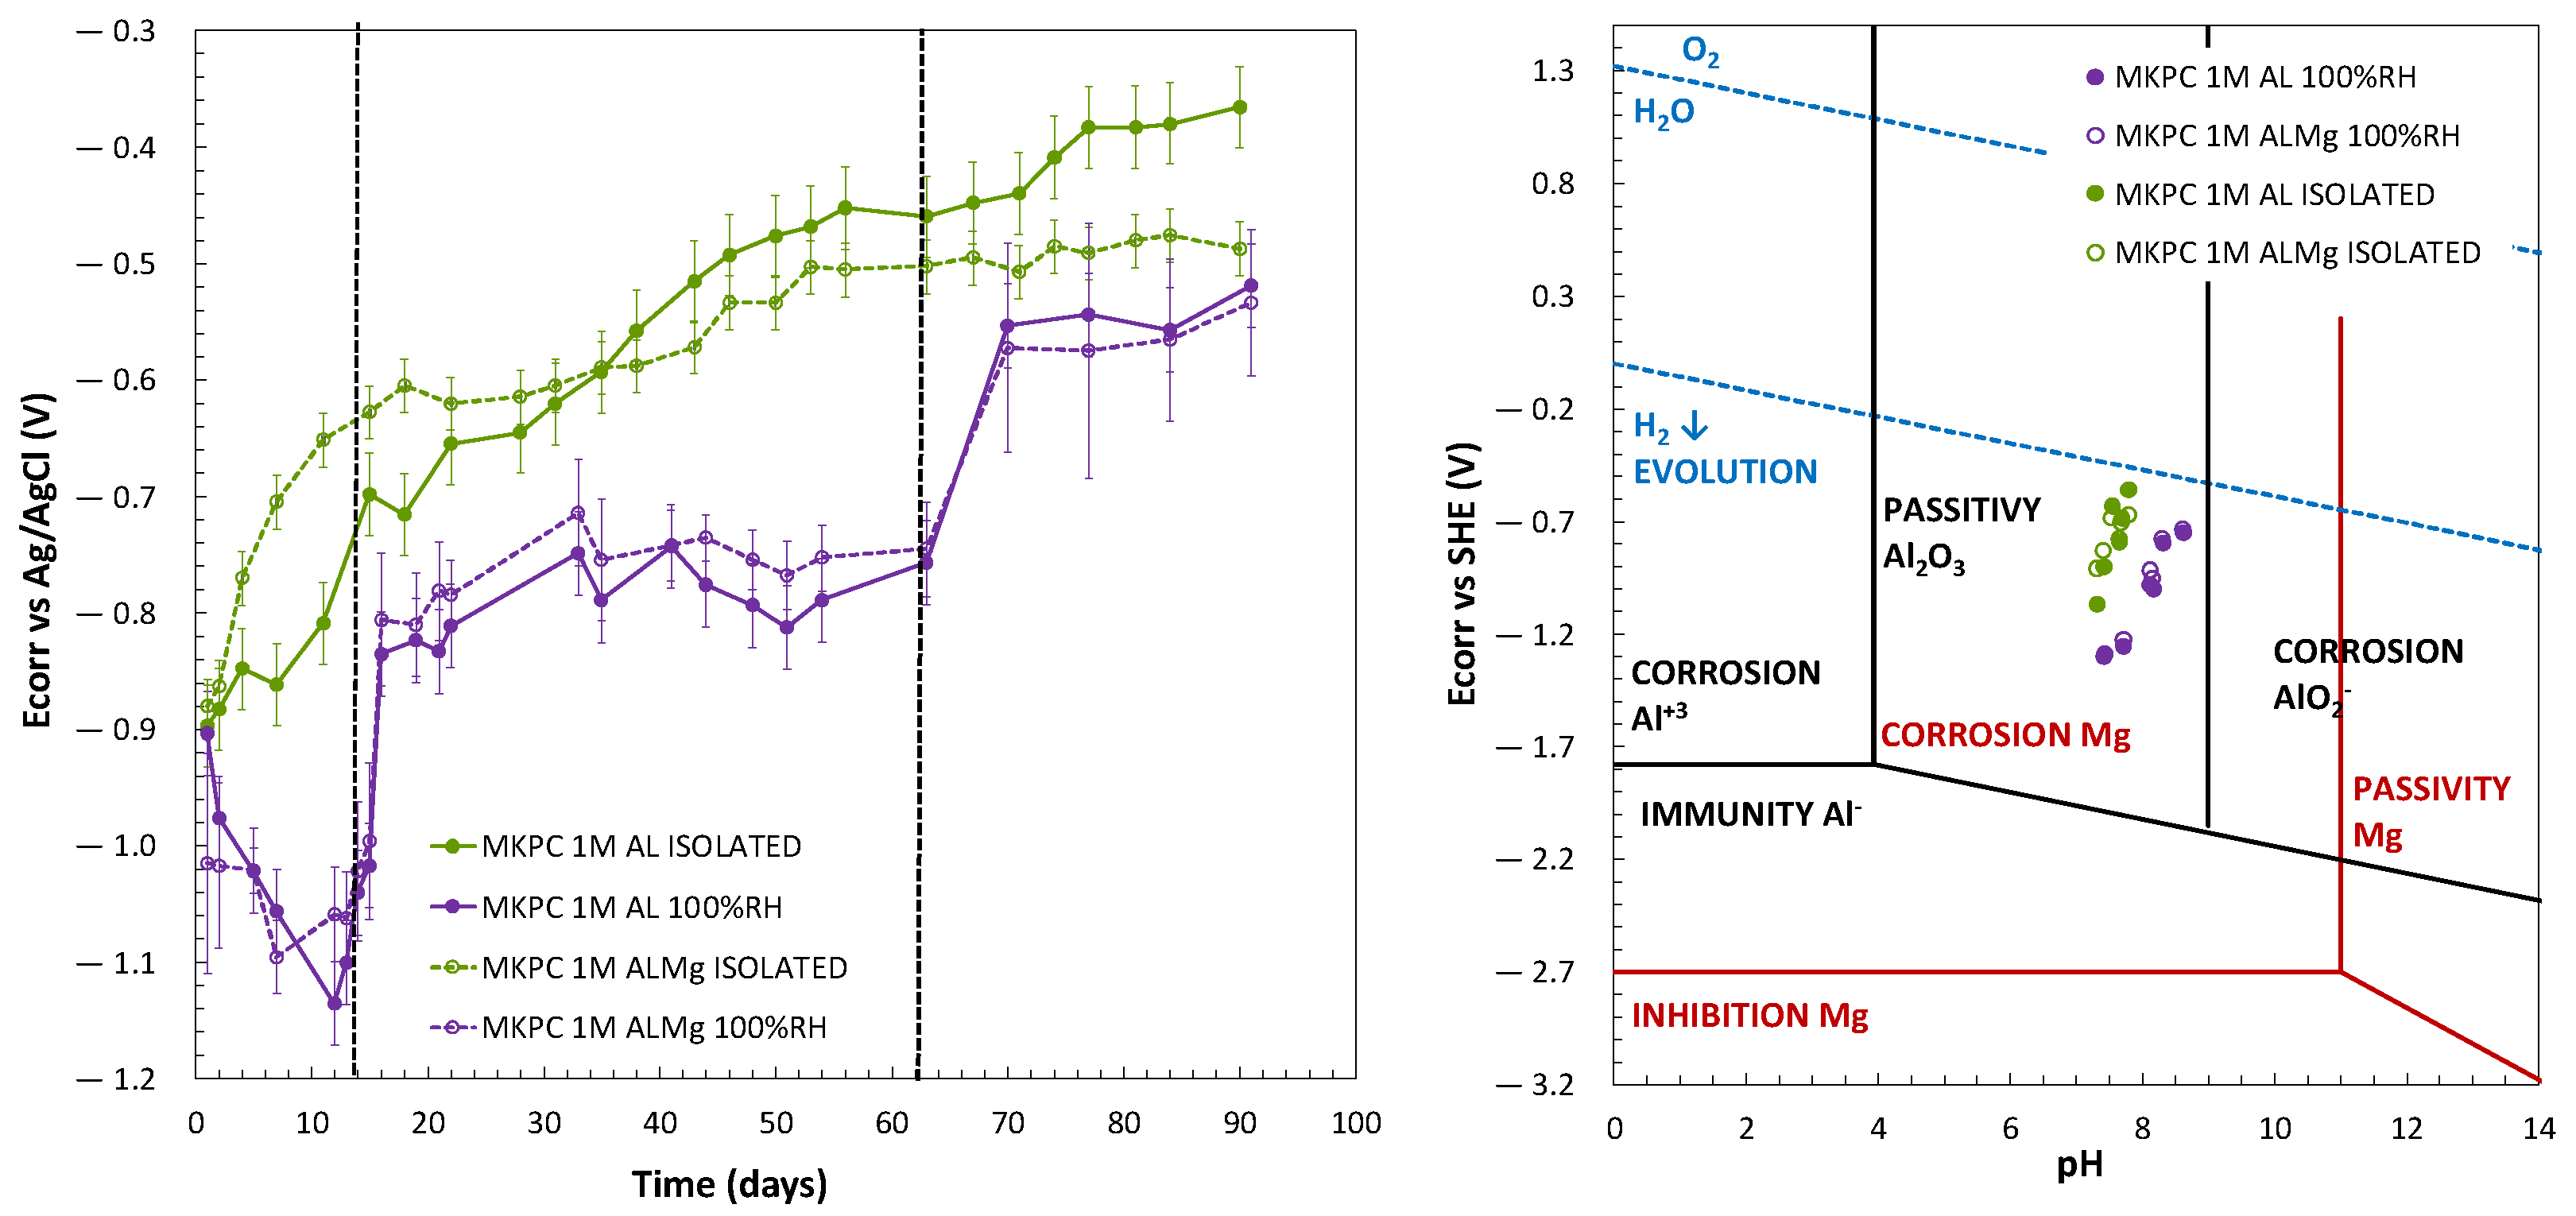
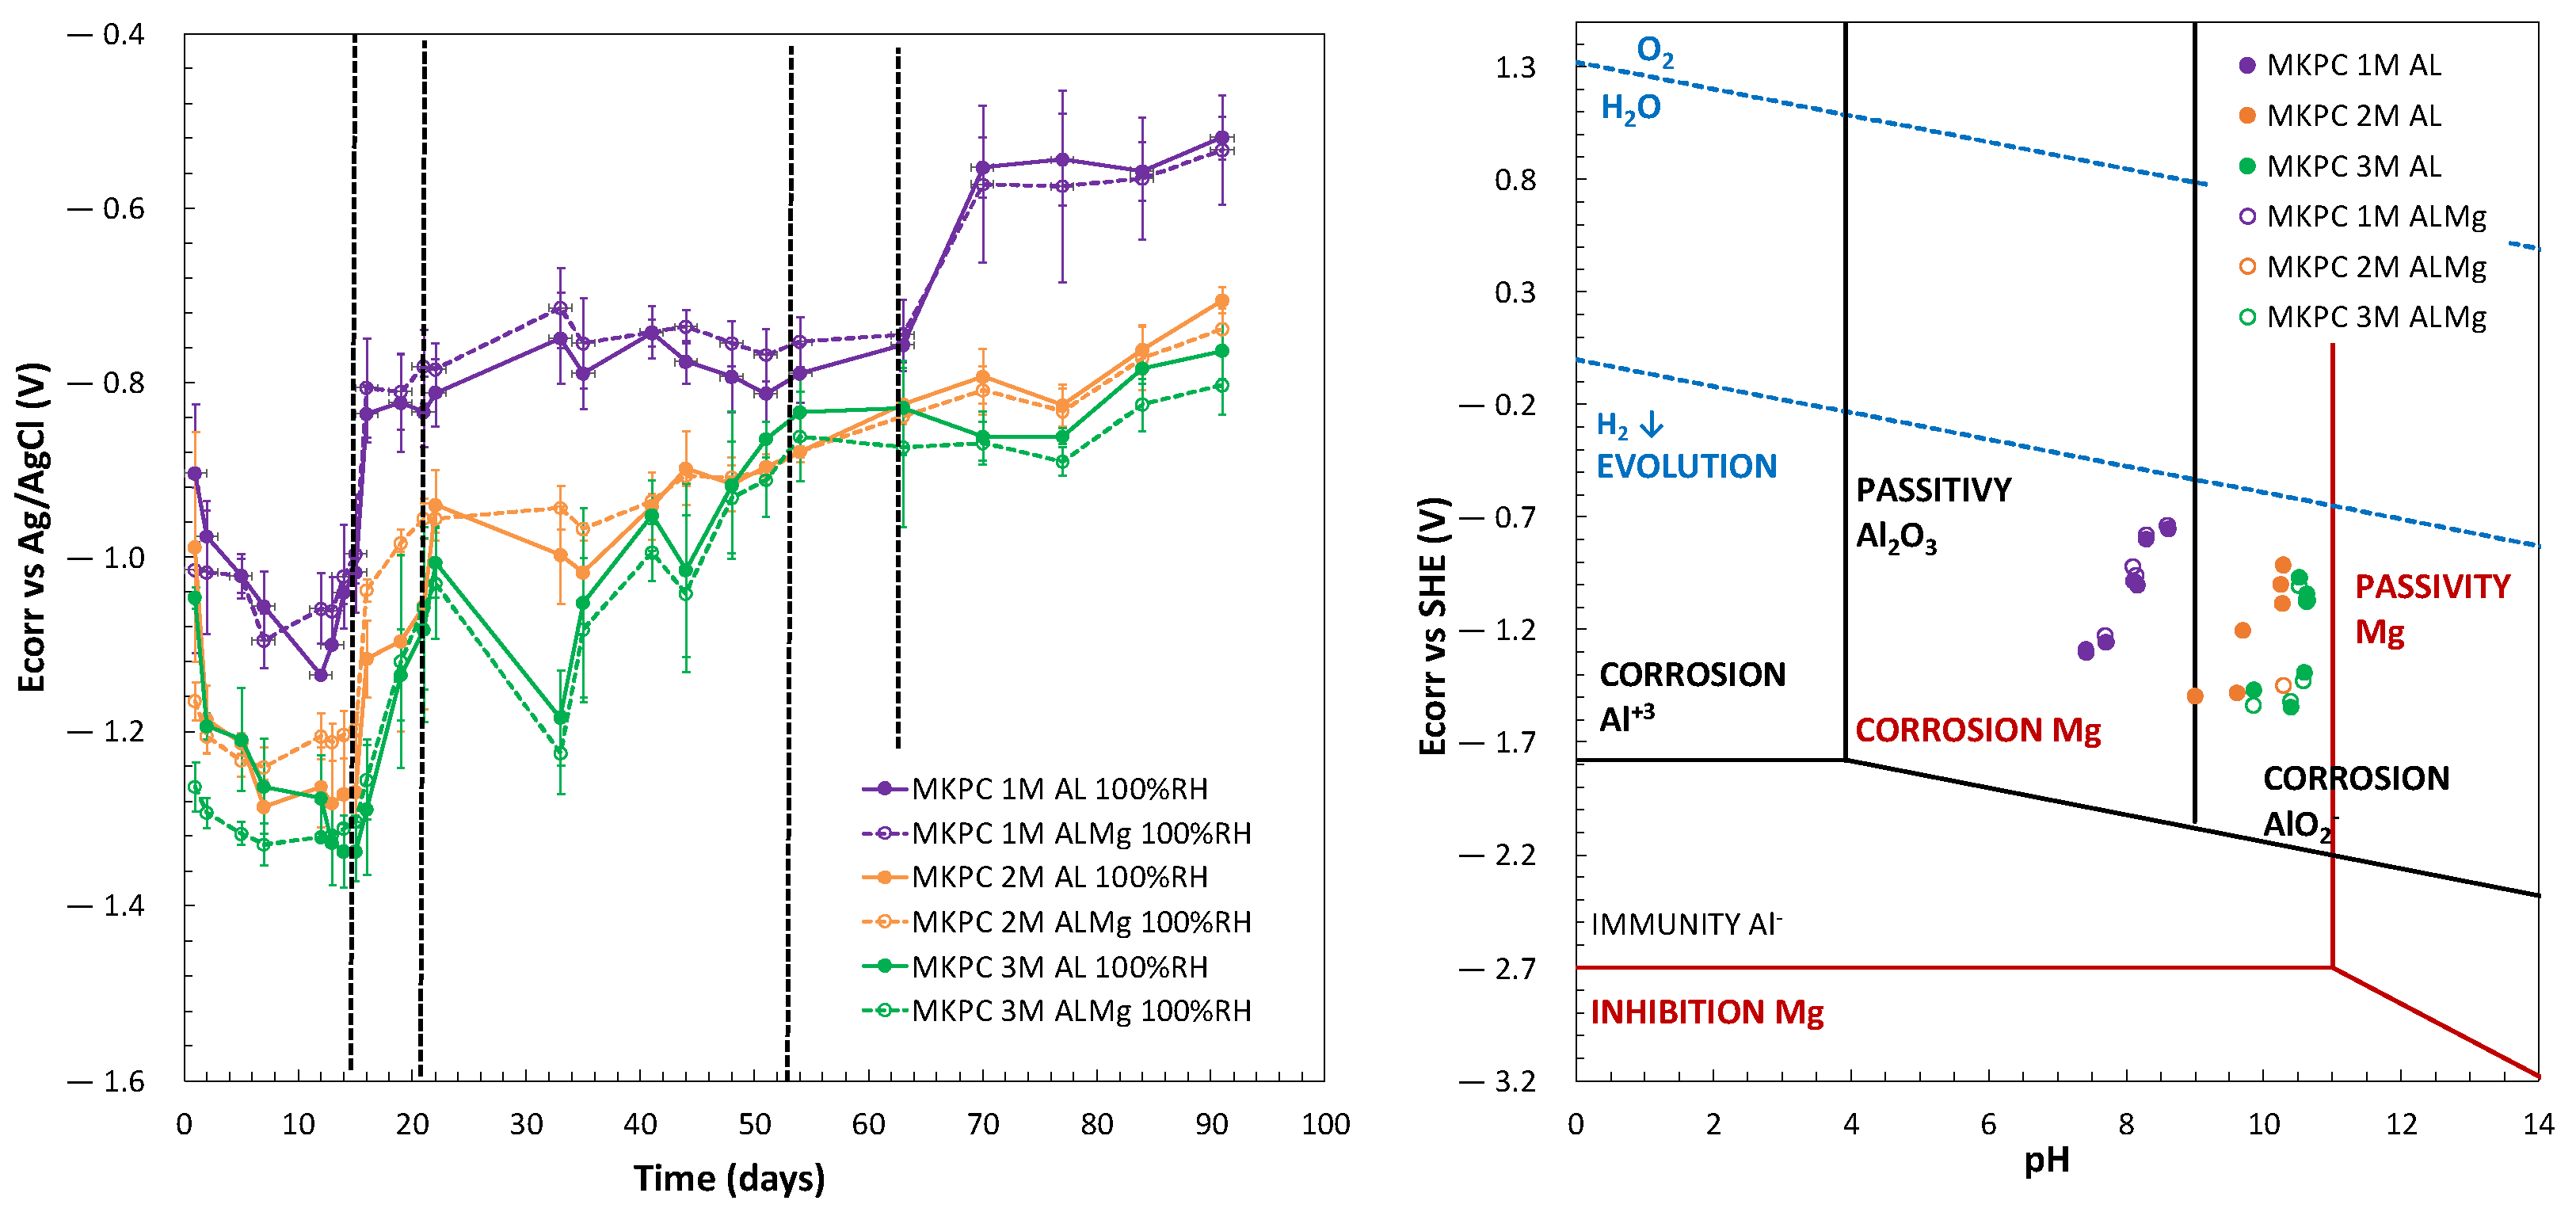
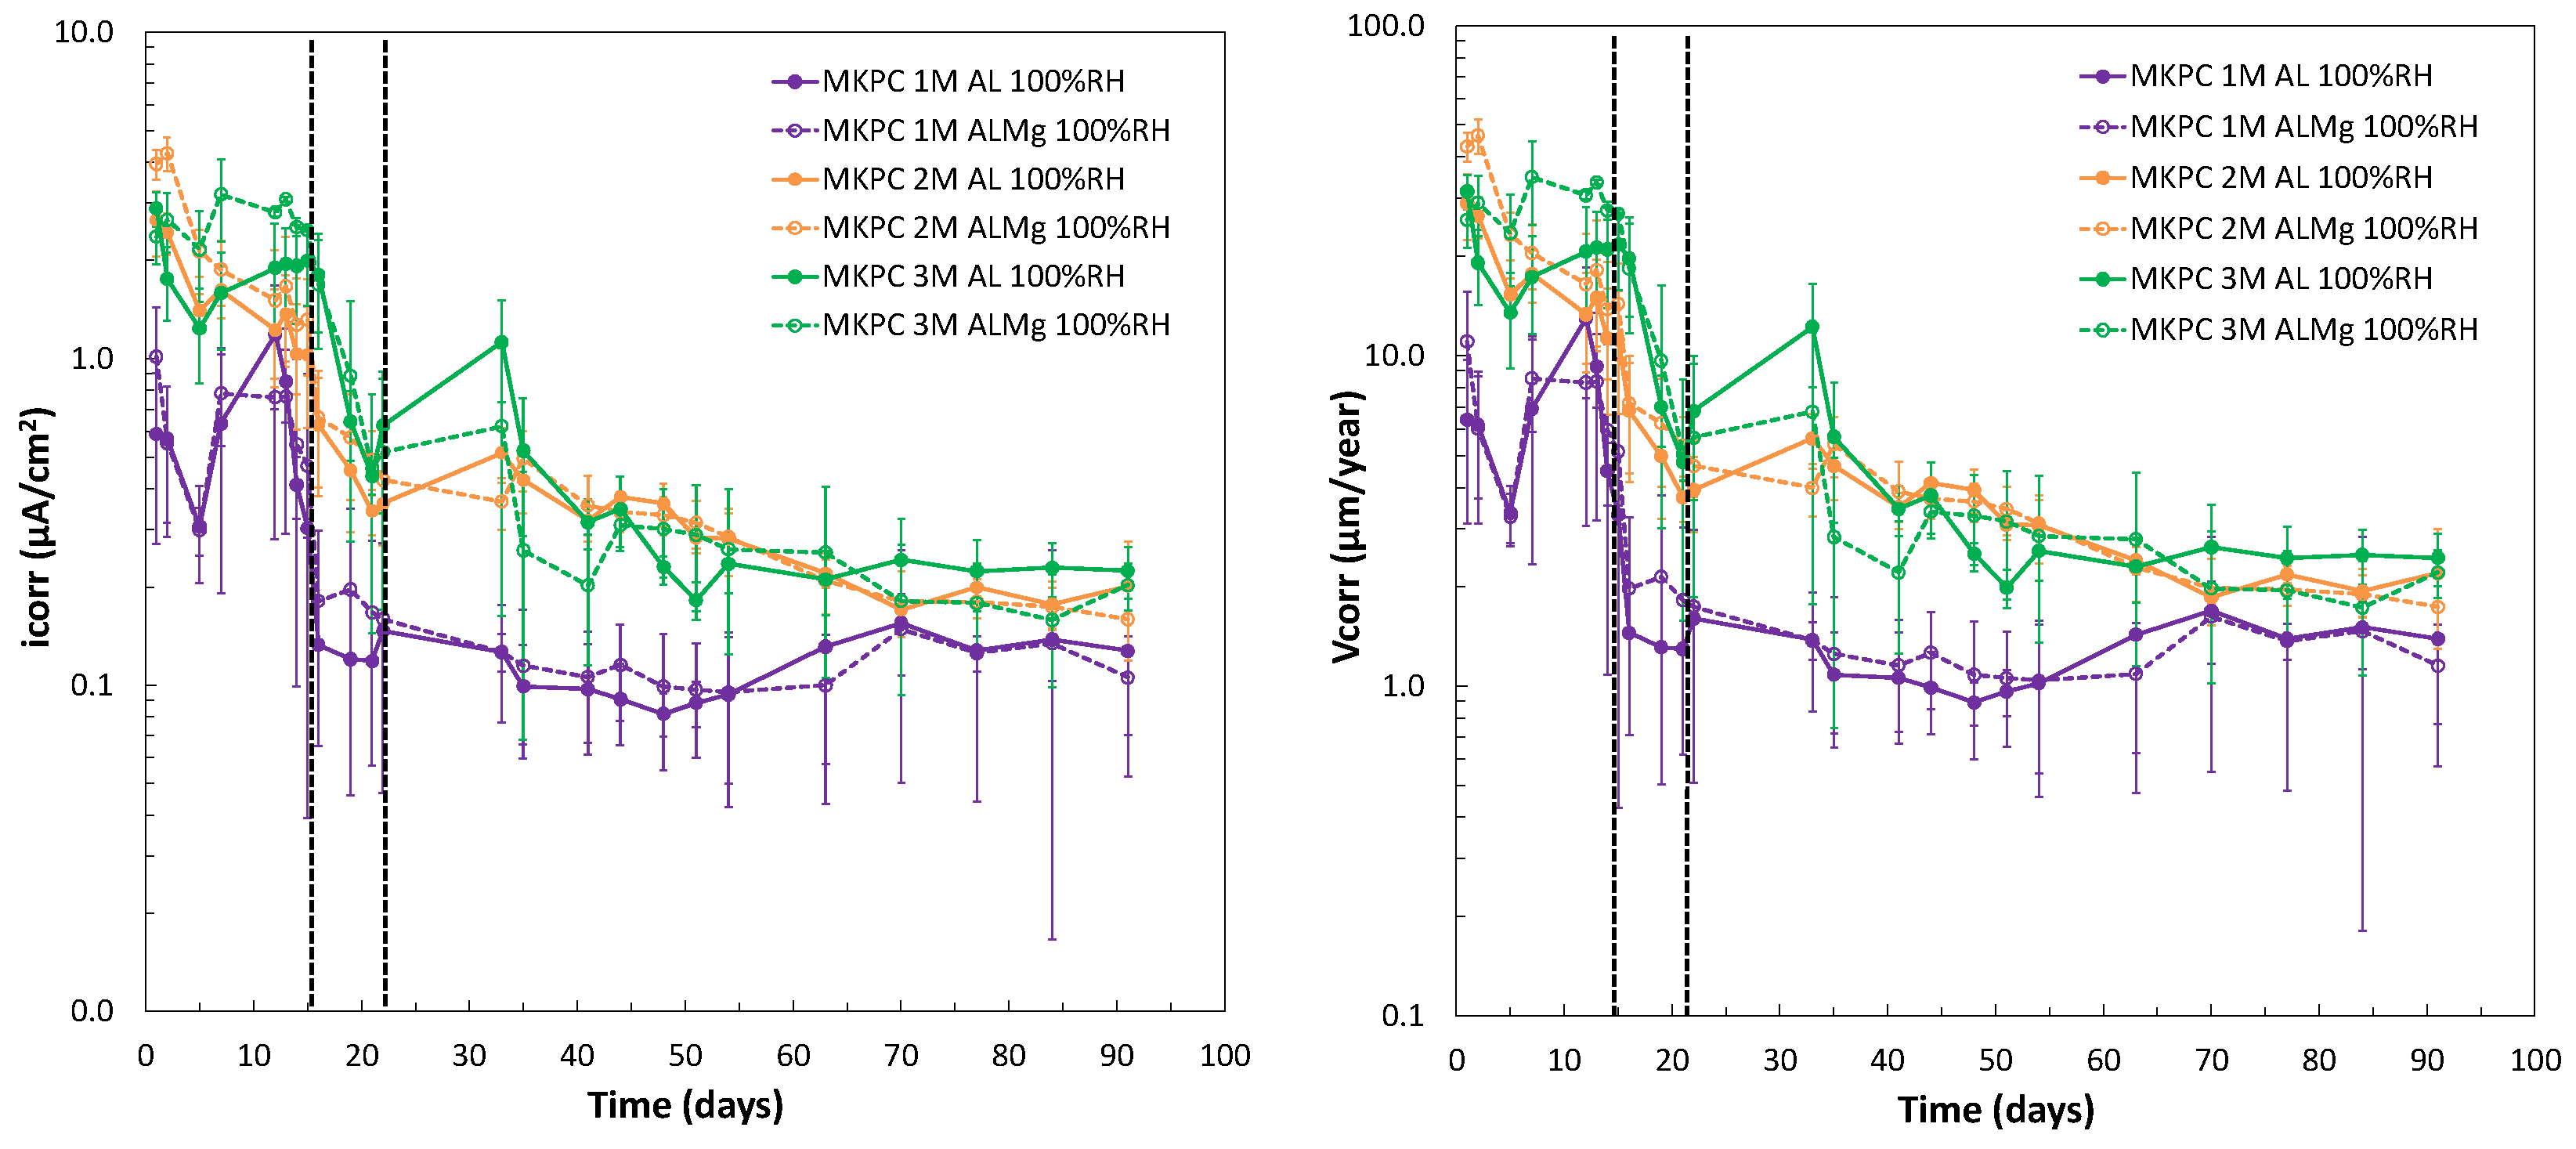
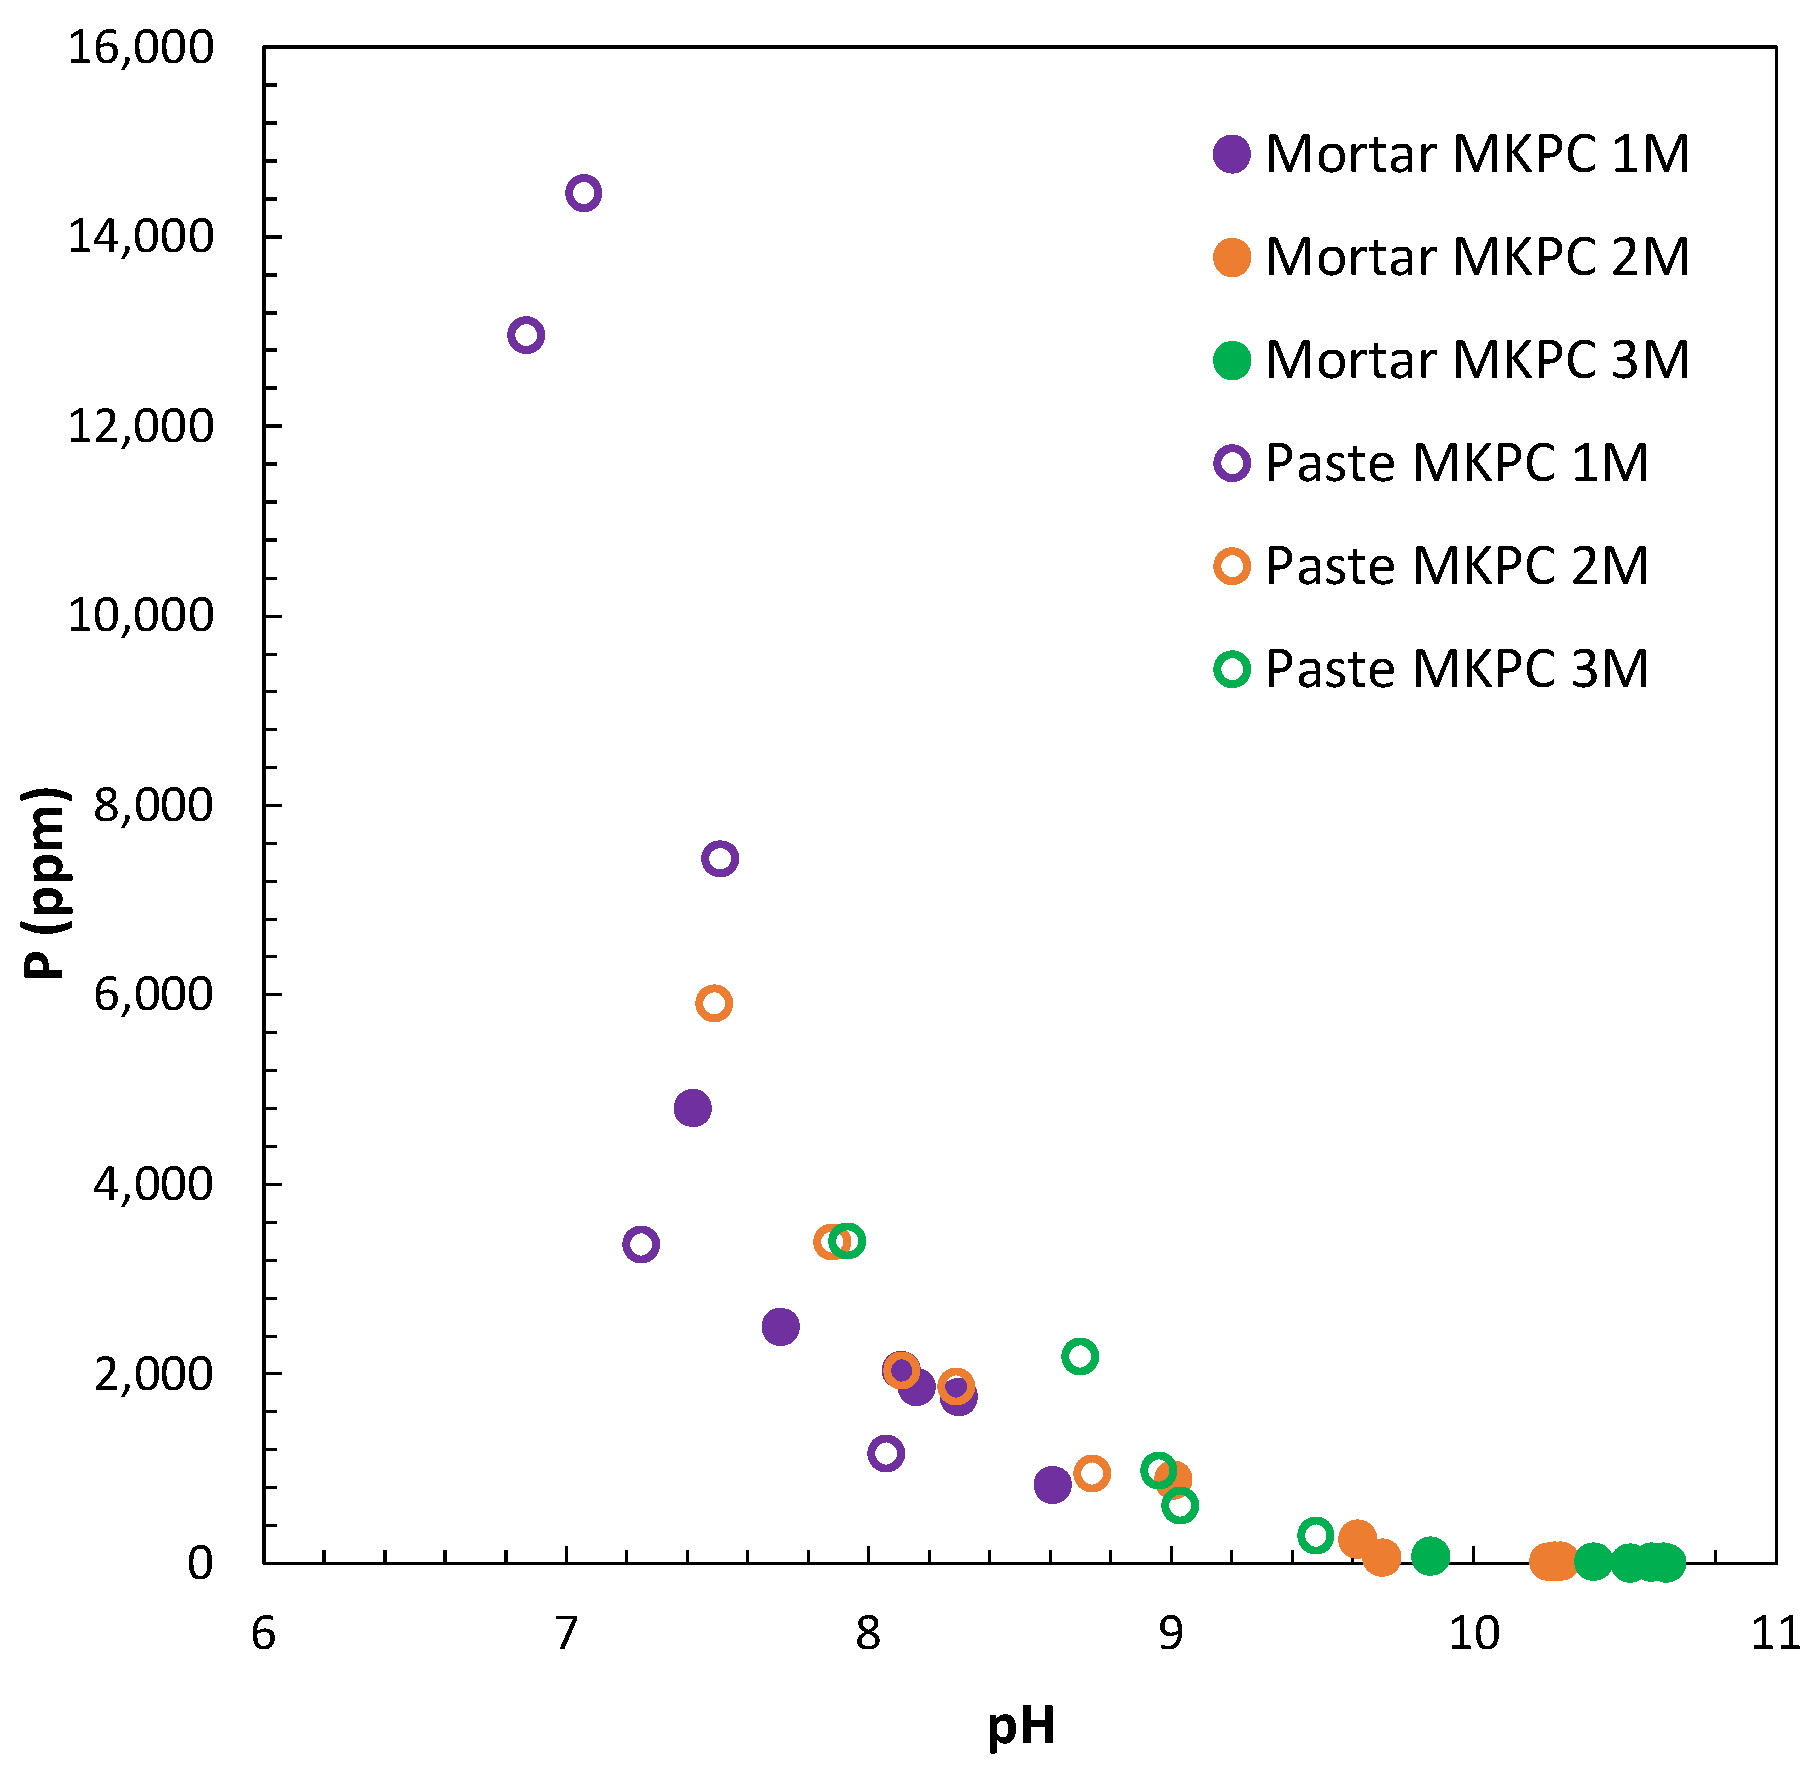
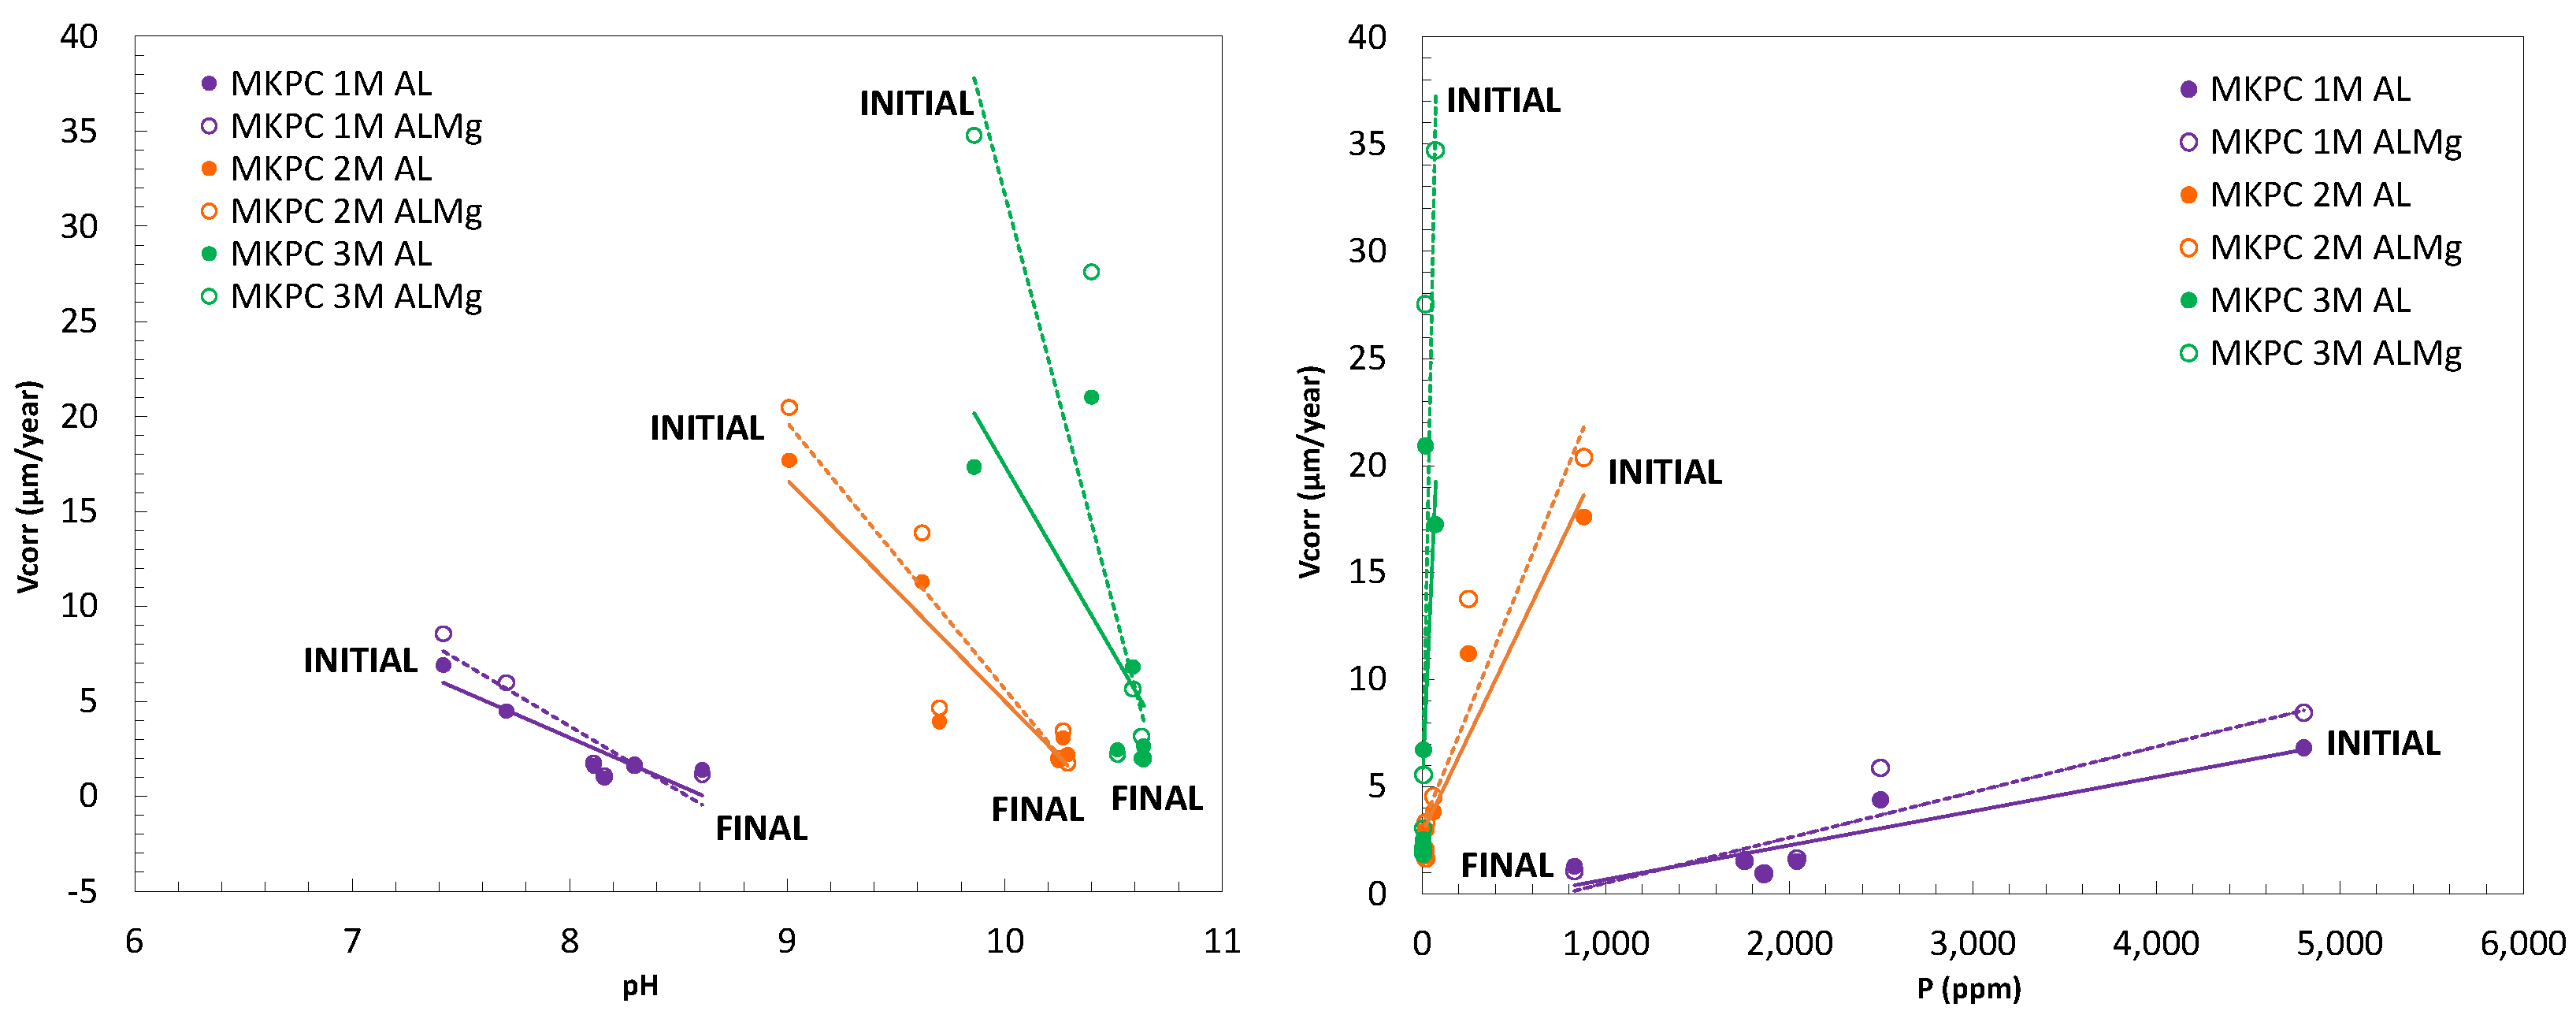
- The corrosion process of Al alloy is affected by the pH and ion content in the pore solution. The increase in pH from 7–8 in 1M M/P to 9 and 10 in 2 and 3M M/P is duplicate and triplicate the initial corrosion rate of Al alloys that equalizes at long-term interaction.
- -
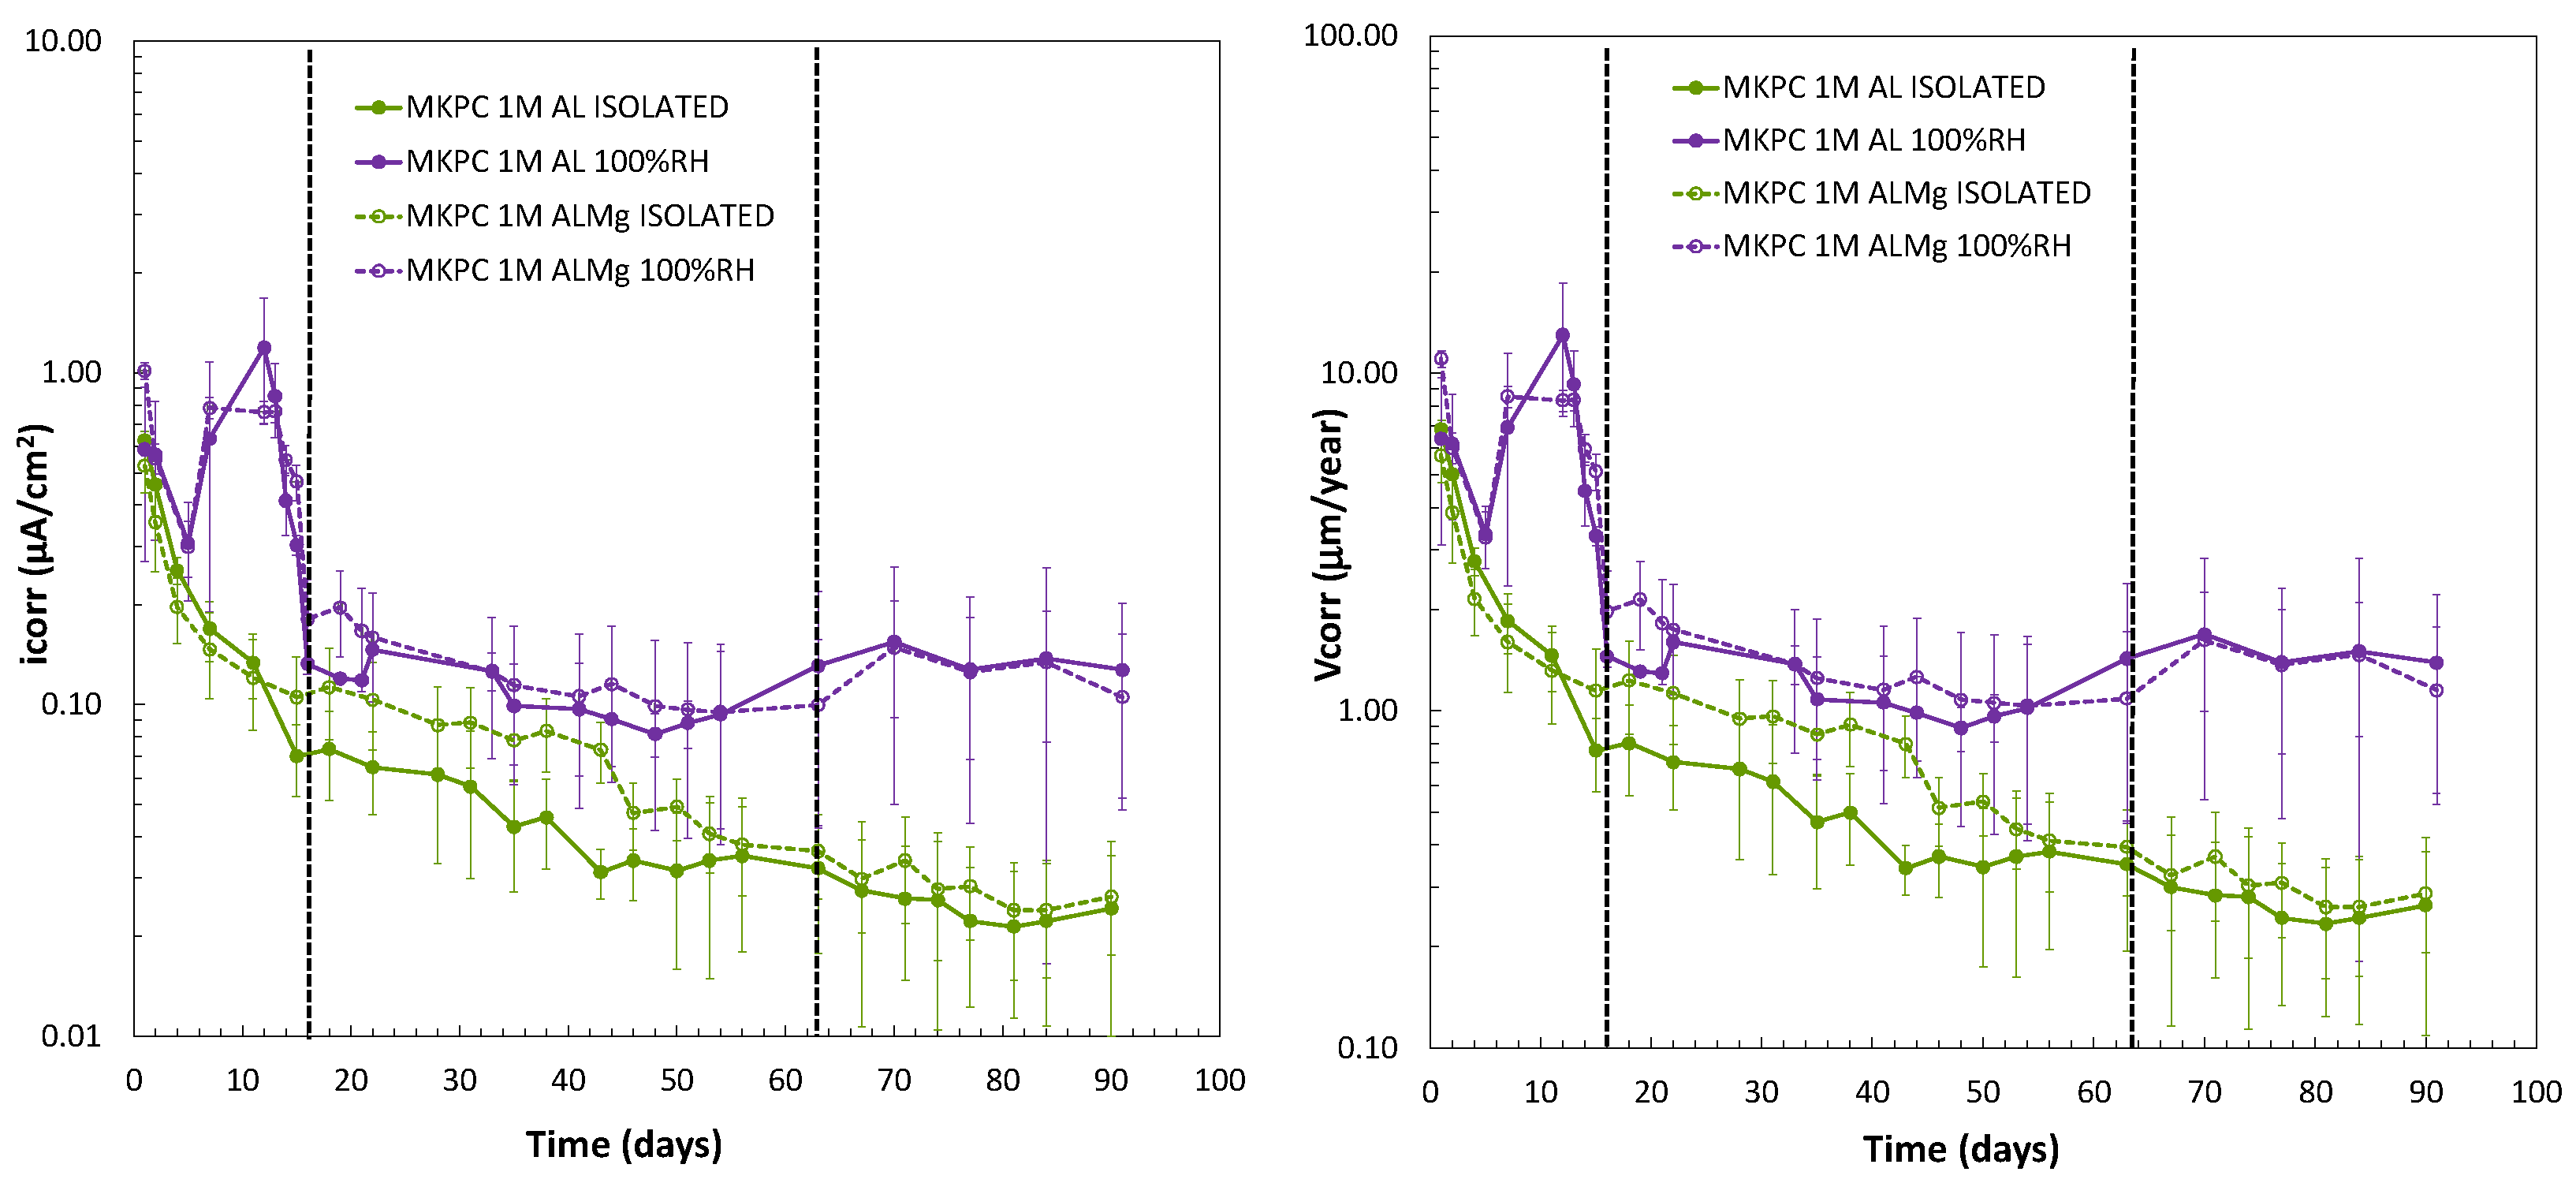
- The presence of phosphate ions in the pore solution inhibits the corrosion process in both Al alloys. The presence of borates also has an influence on decreasing the corrosion rates. The effect of Mg in the alloy is more relevant with the increase in the M/P ratio.
- -
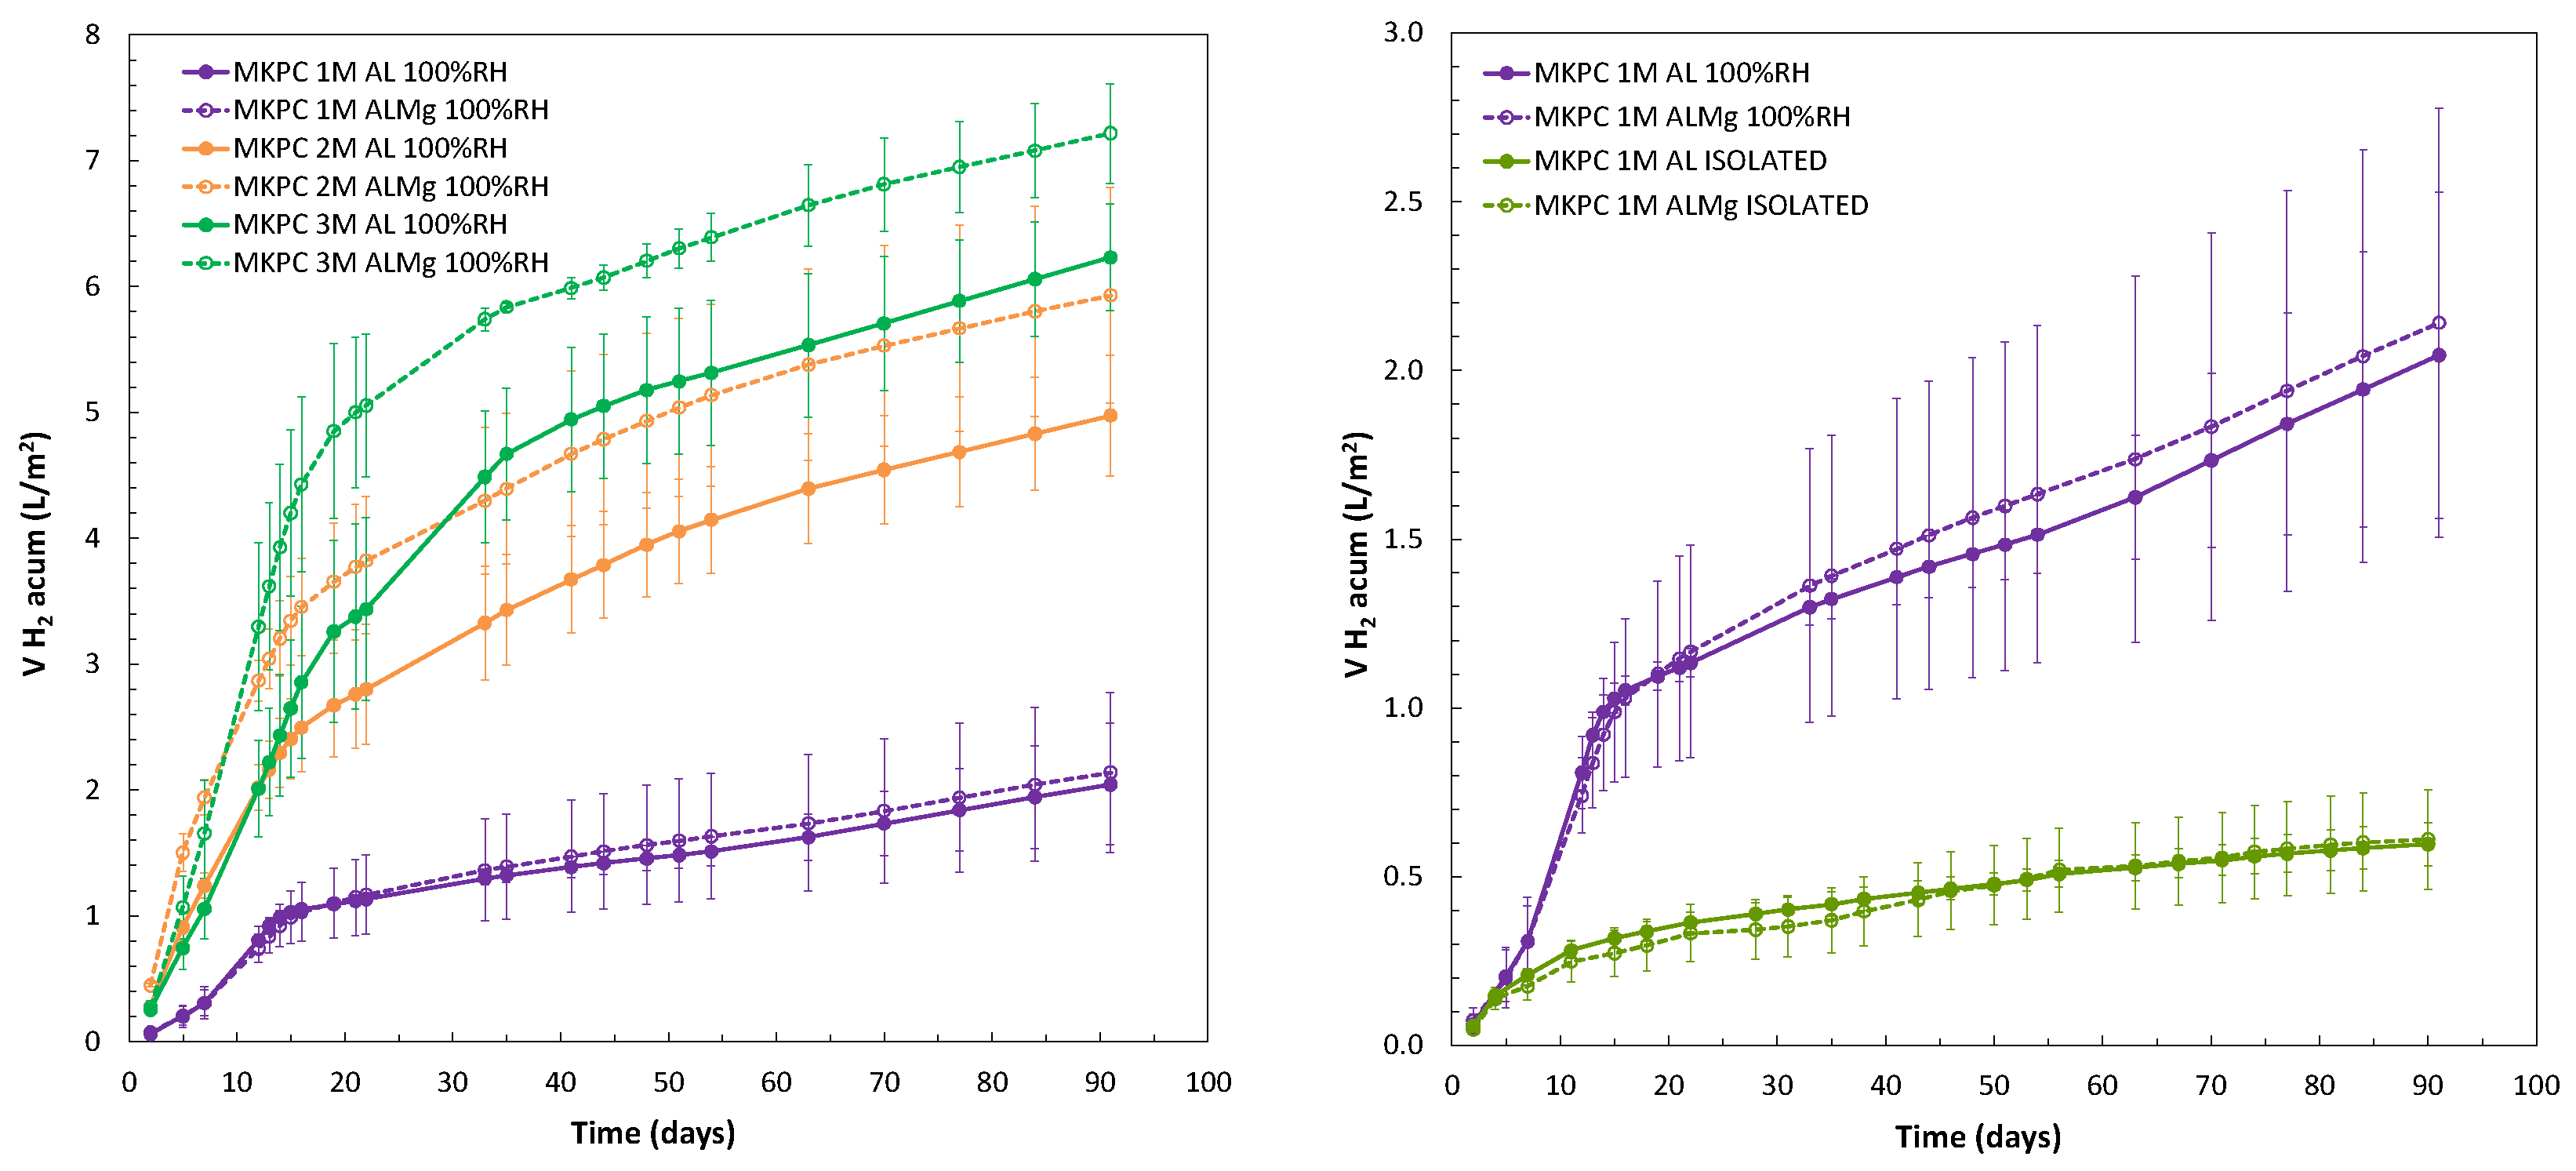
- Accumulated average H2 release over 90 days in 1, 2, and 3M M/P ratios under 100%RH conditions were 2.04 L/m2 and 2.14 L/m2 in 1M, 4.97 L/m2 and 5.93 L/m2 in 2M, and 6.23 L/m2 and 7.22 L/m2 in 3M, for pure Al (A1050) and AlMg alloys (AA5754), respectively. With the lower moisture content in pores in the endogenous (isolated) curing, the corrosion kinetic is significantly reduced. Calculated values of H2 are 0.59 L/m2 and 0.61 L/m2 for pure Al (A1050) and AlMg alloys (AA5754).
- -
- More of the hydrogen release occurs during the first 15 days of the interaction of the Al alloy with the MKPC matrix; values between 50–60% of the total H2 release at 90 days have been measured to attenuate at longer exposures and during the ageing of the matrix. This aspect has to be considered in experimental campaigns and for long-term predictions of H evolution.
- -
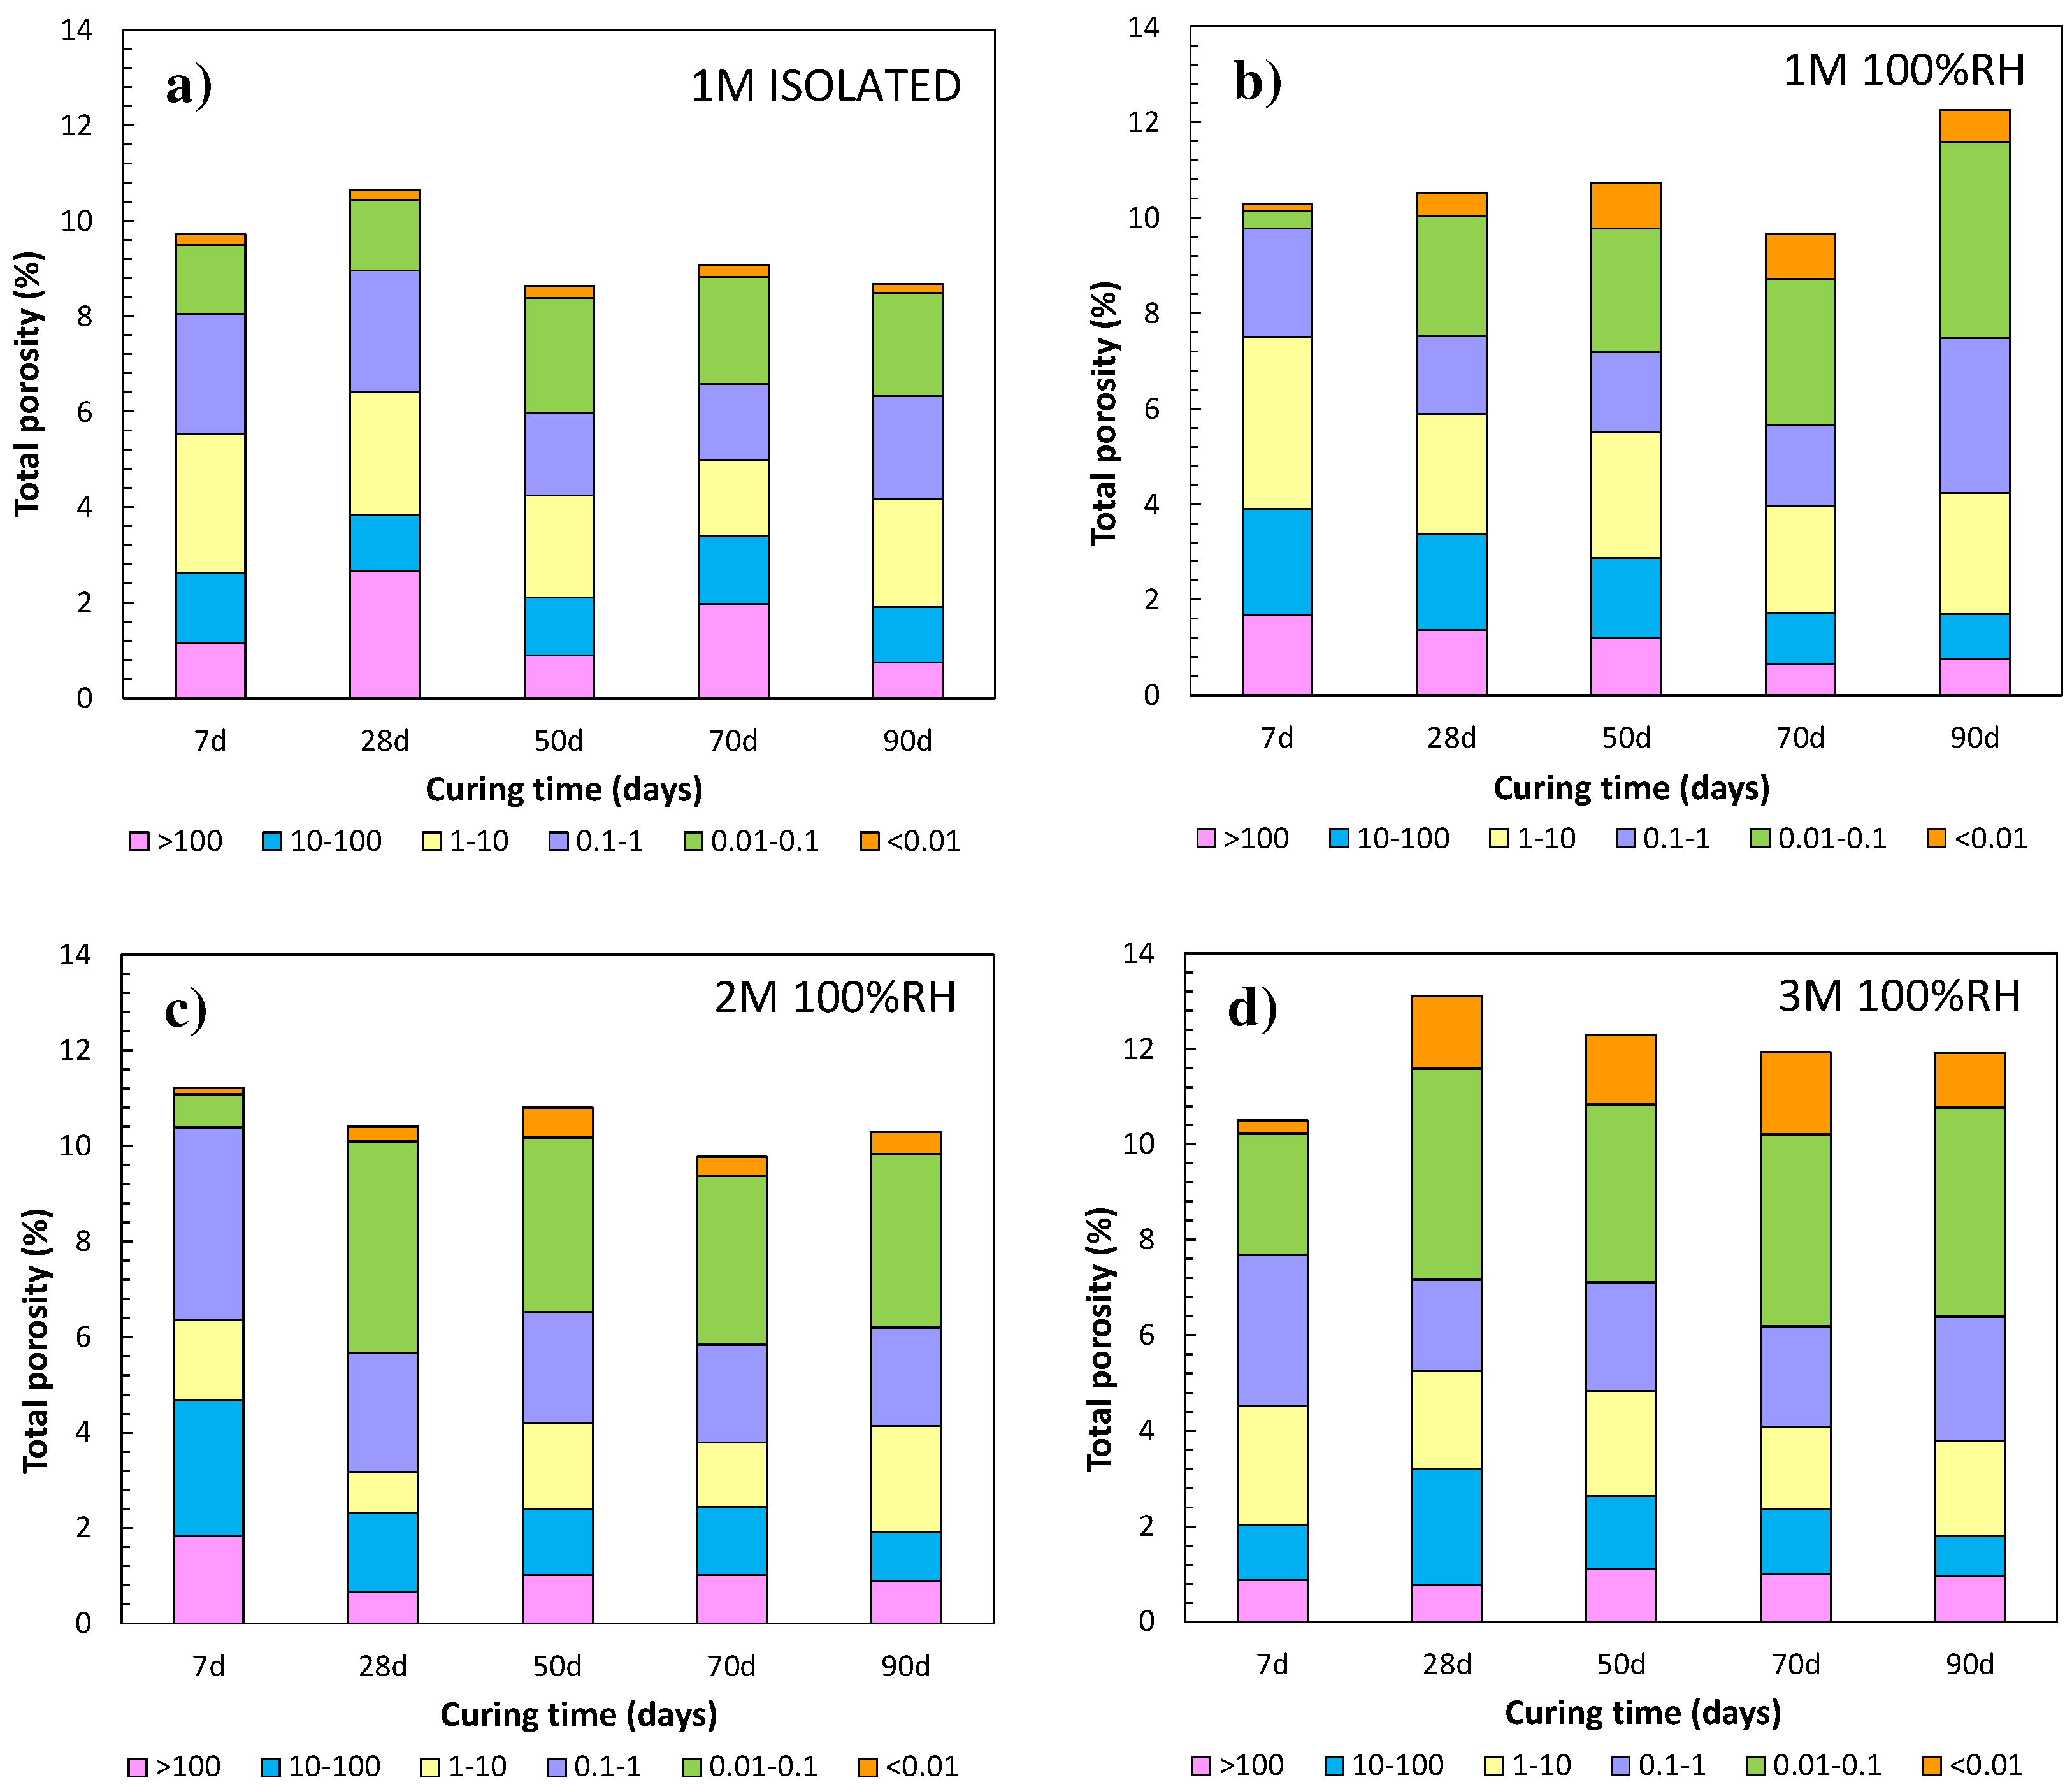
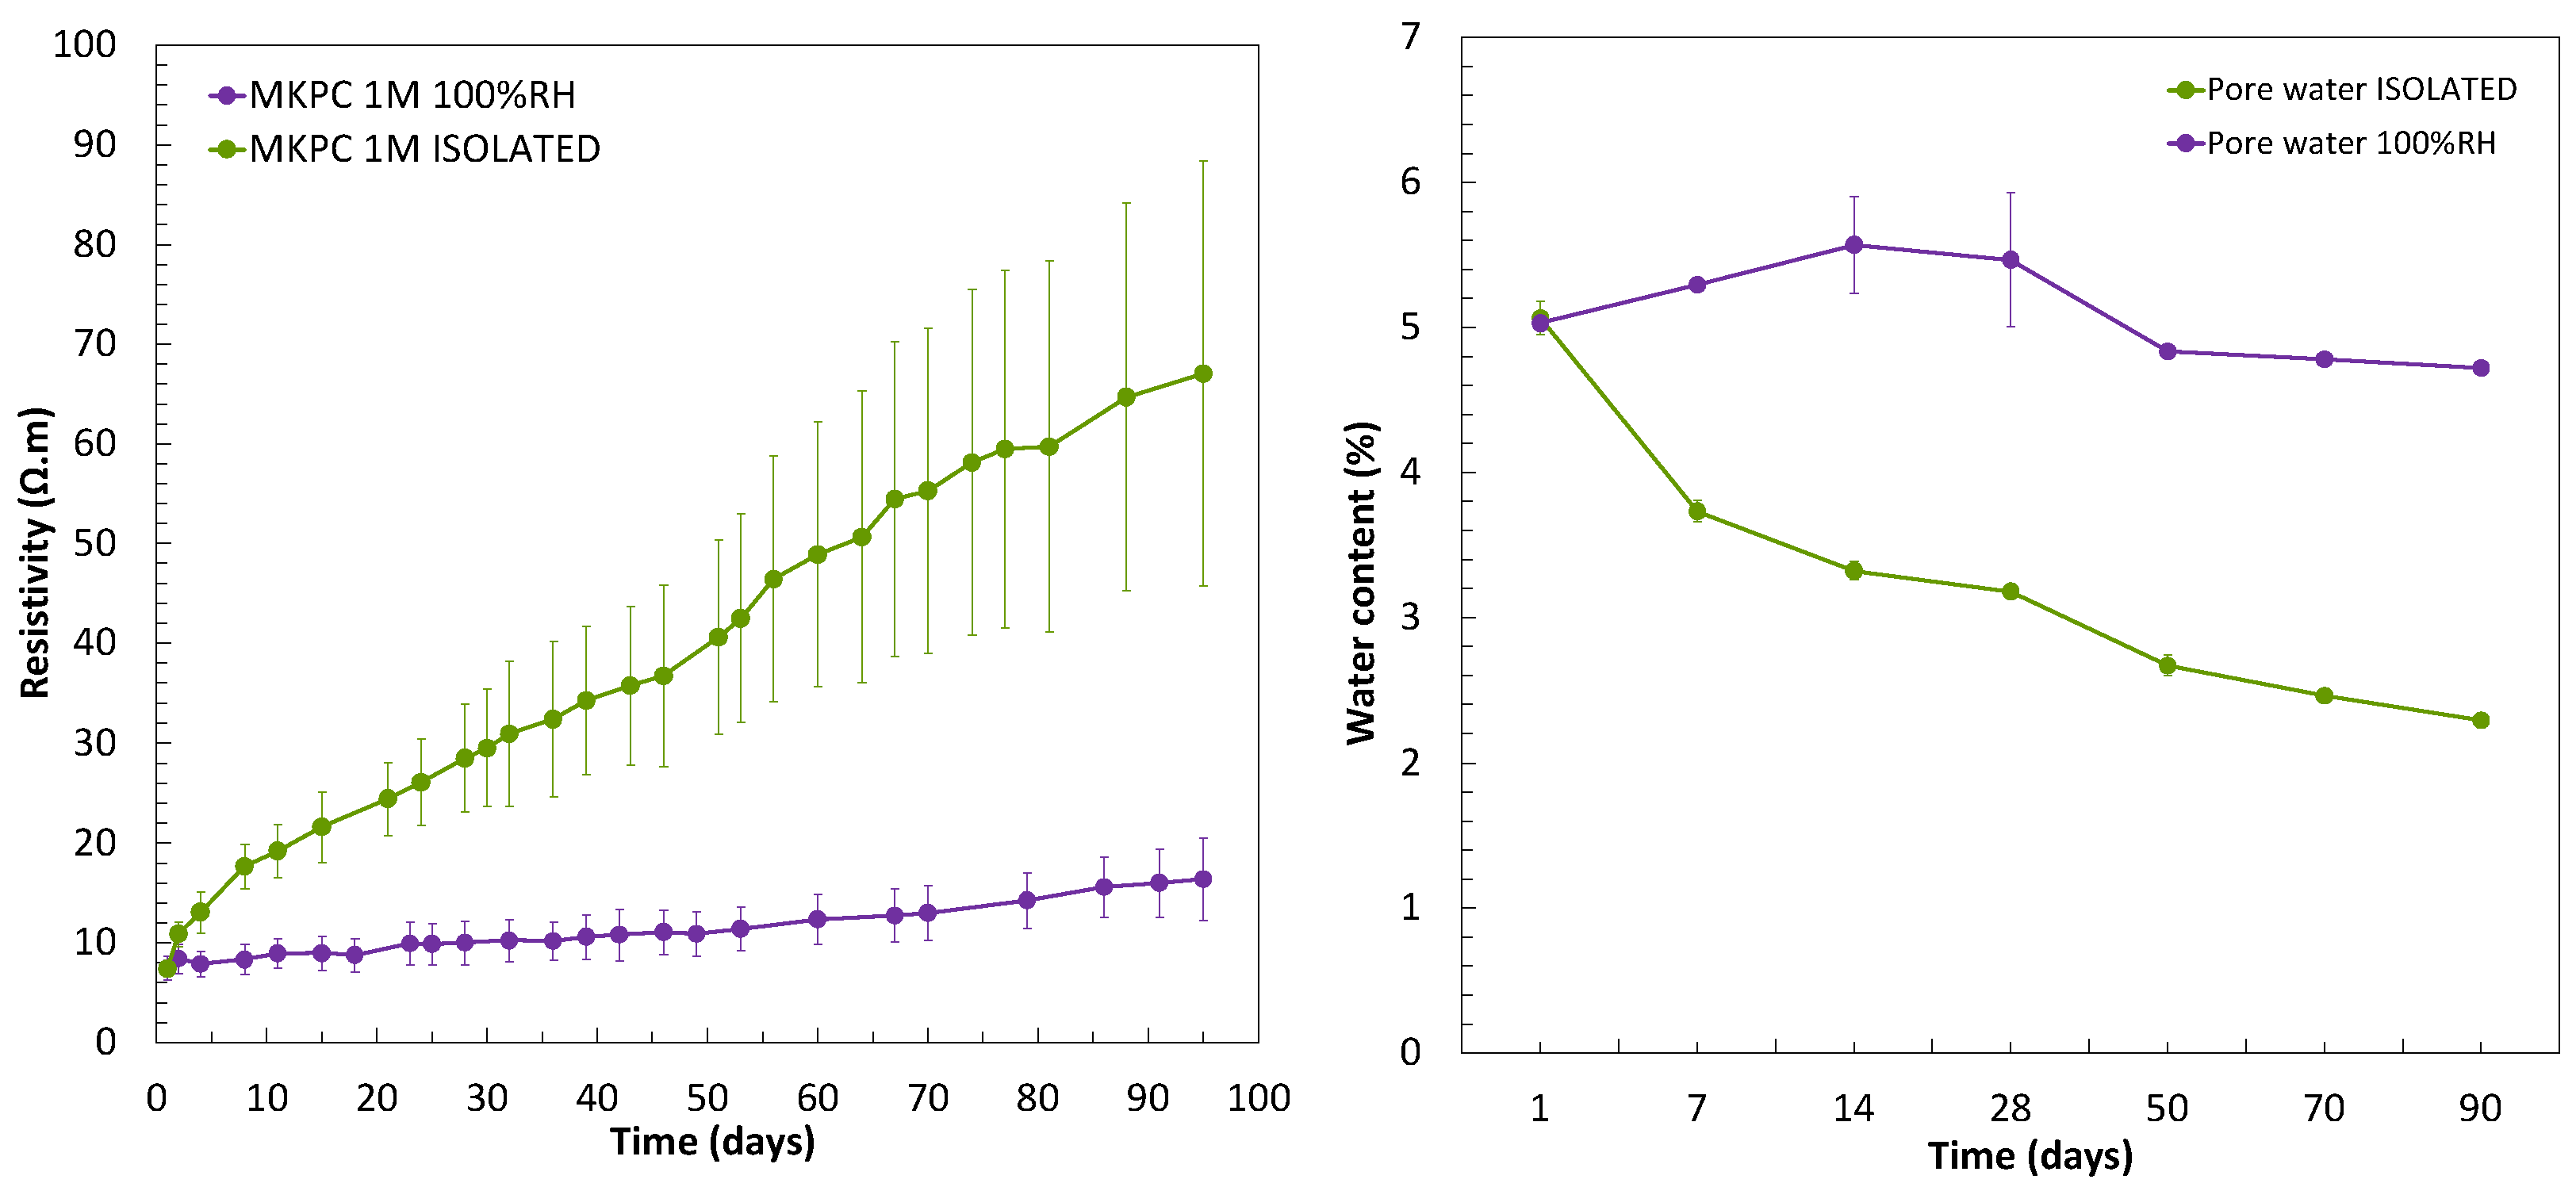
- The physical–chemical stability of the MKPC matrices in terms of microstructural properties shows a high dependence on the pore moisture content and M/P molar ratio used in the formulation.
- -
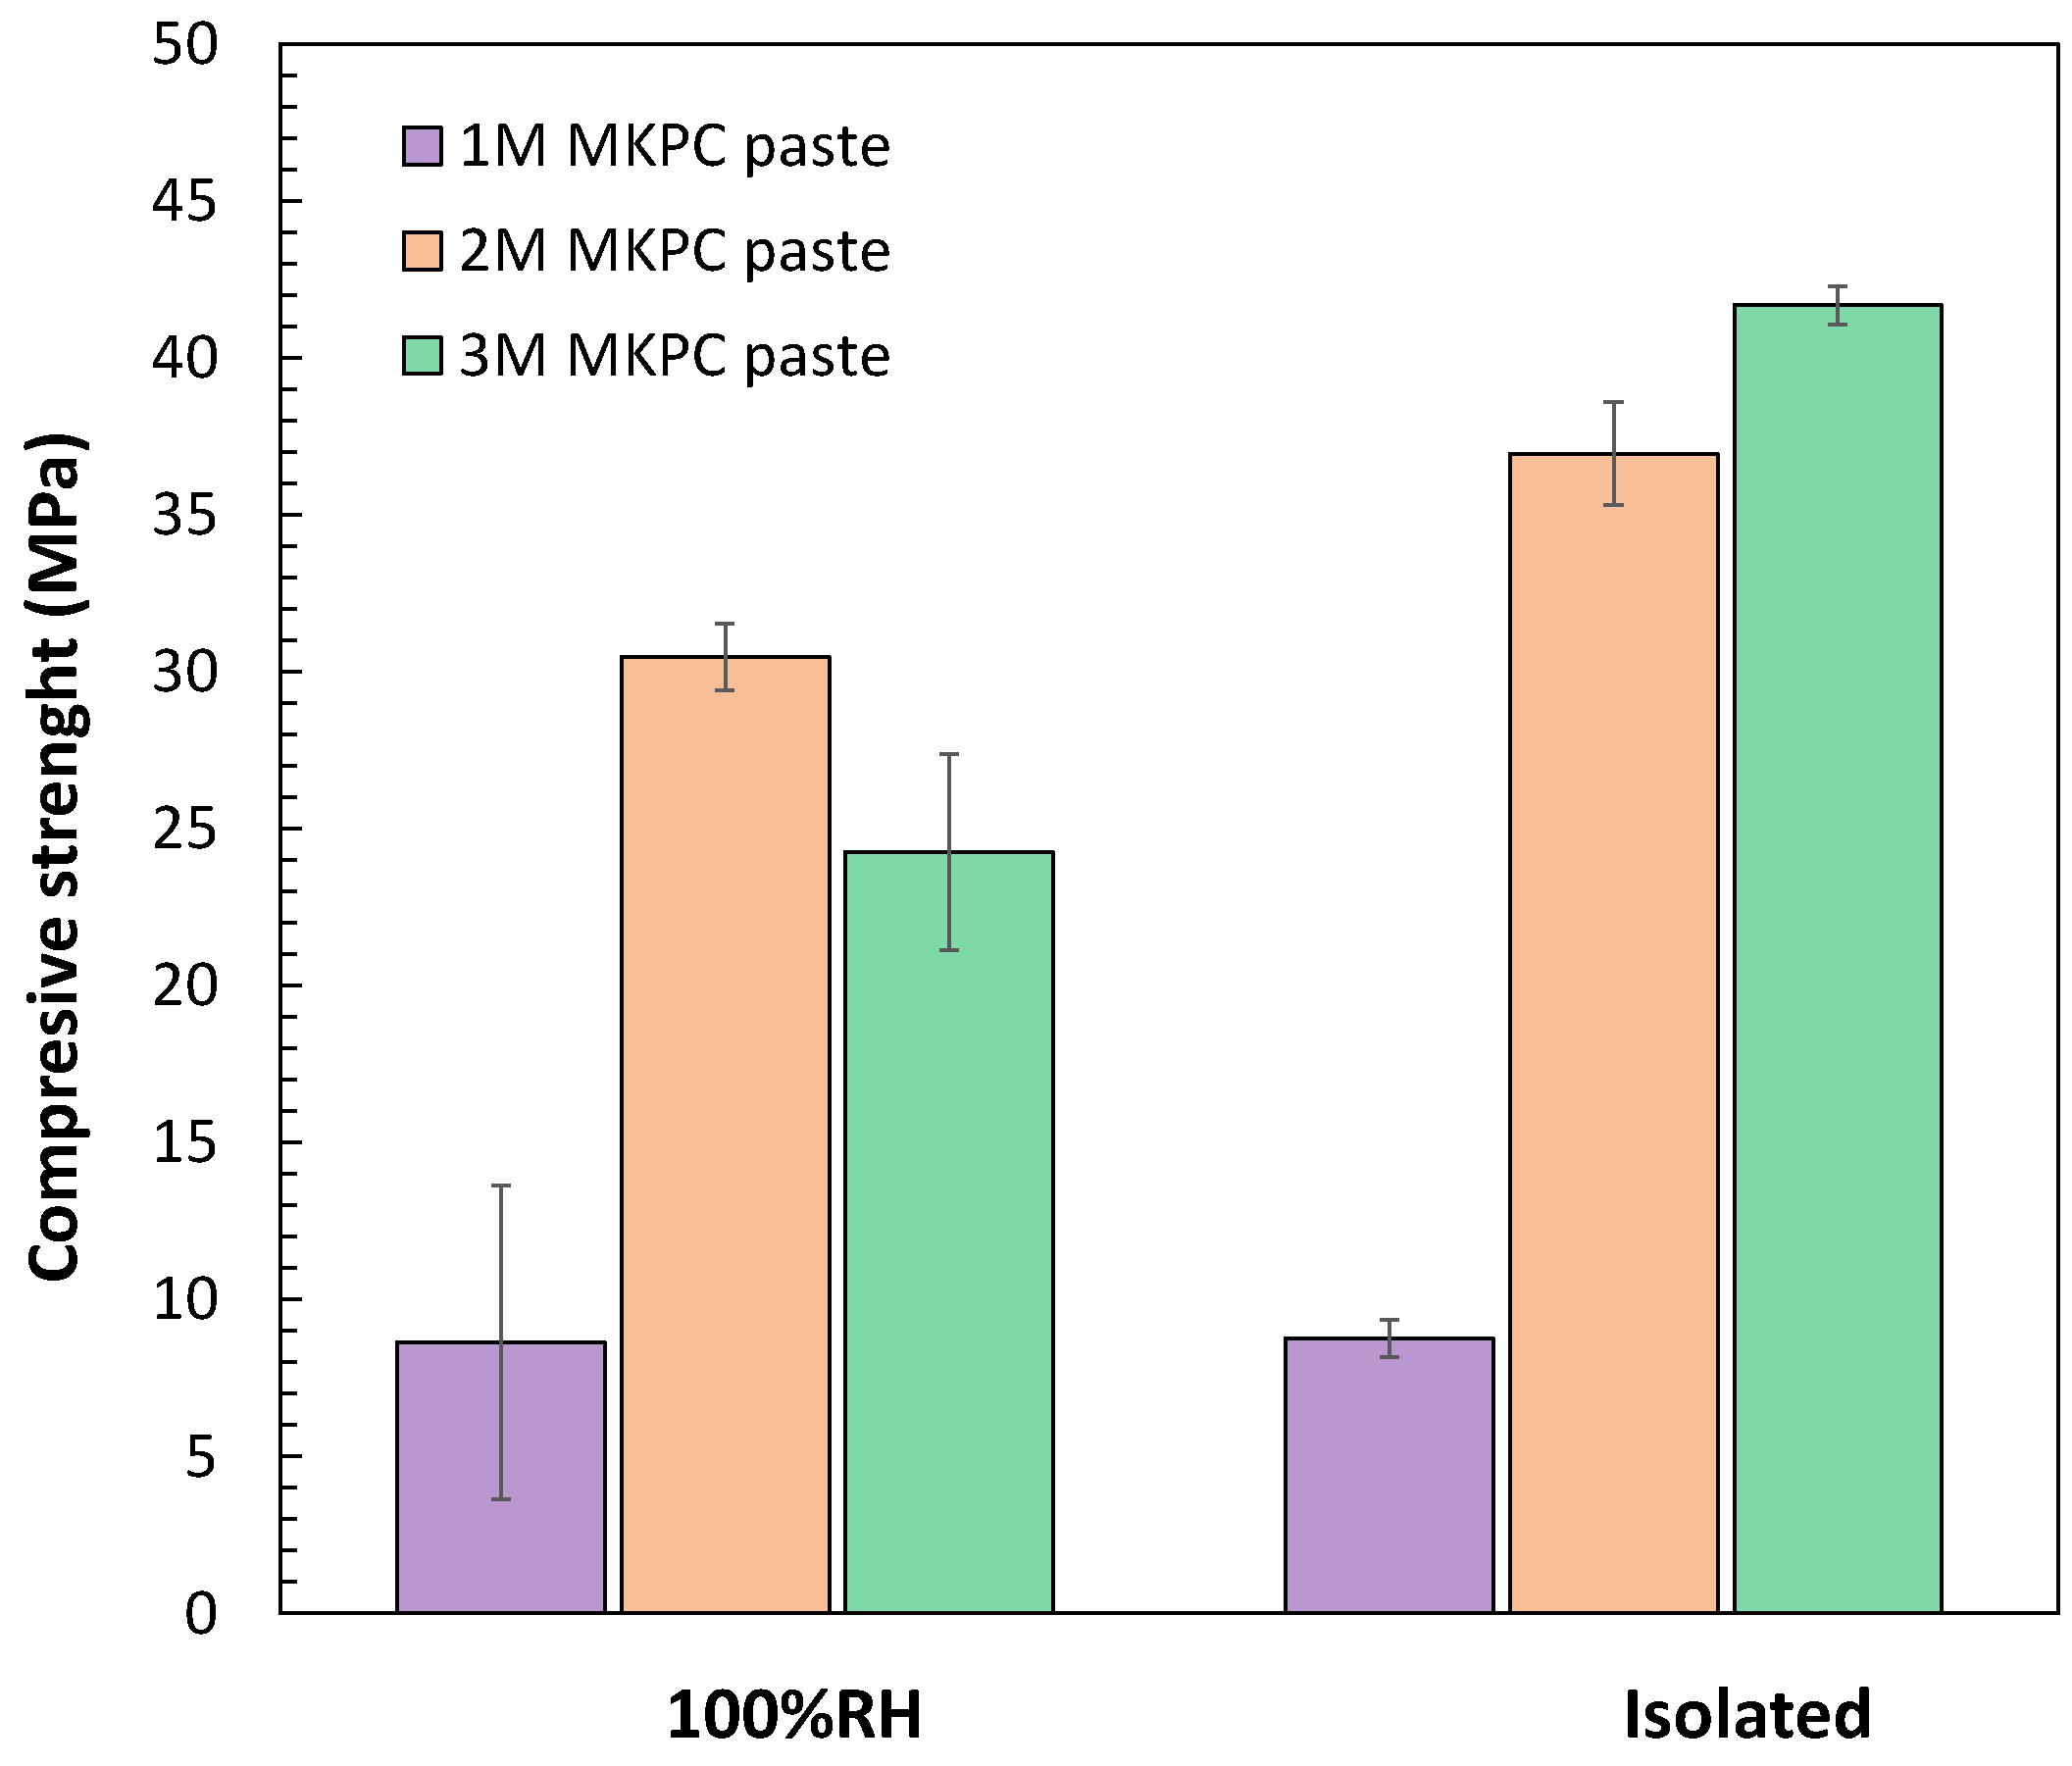
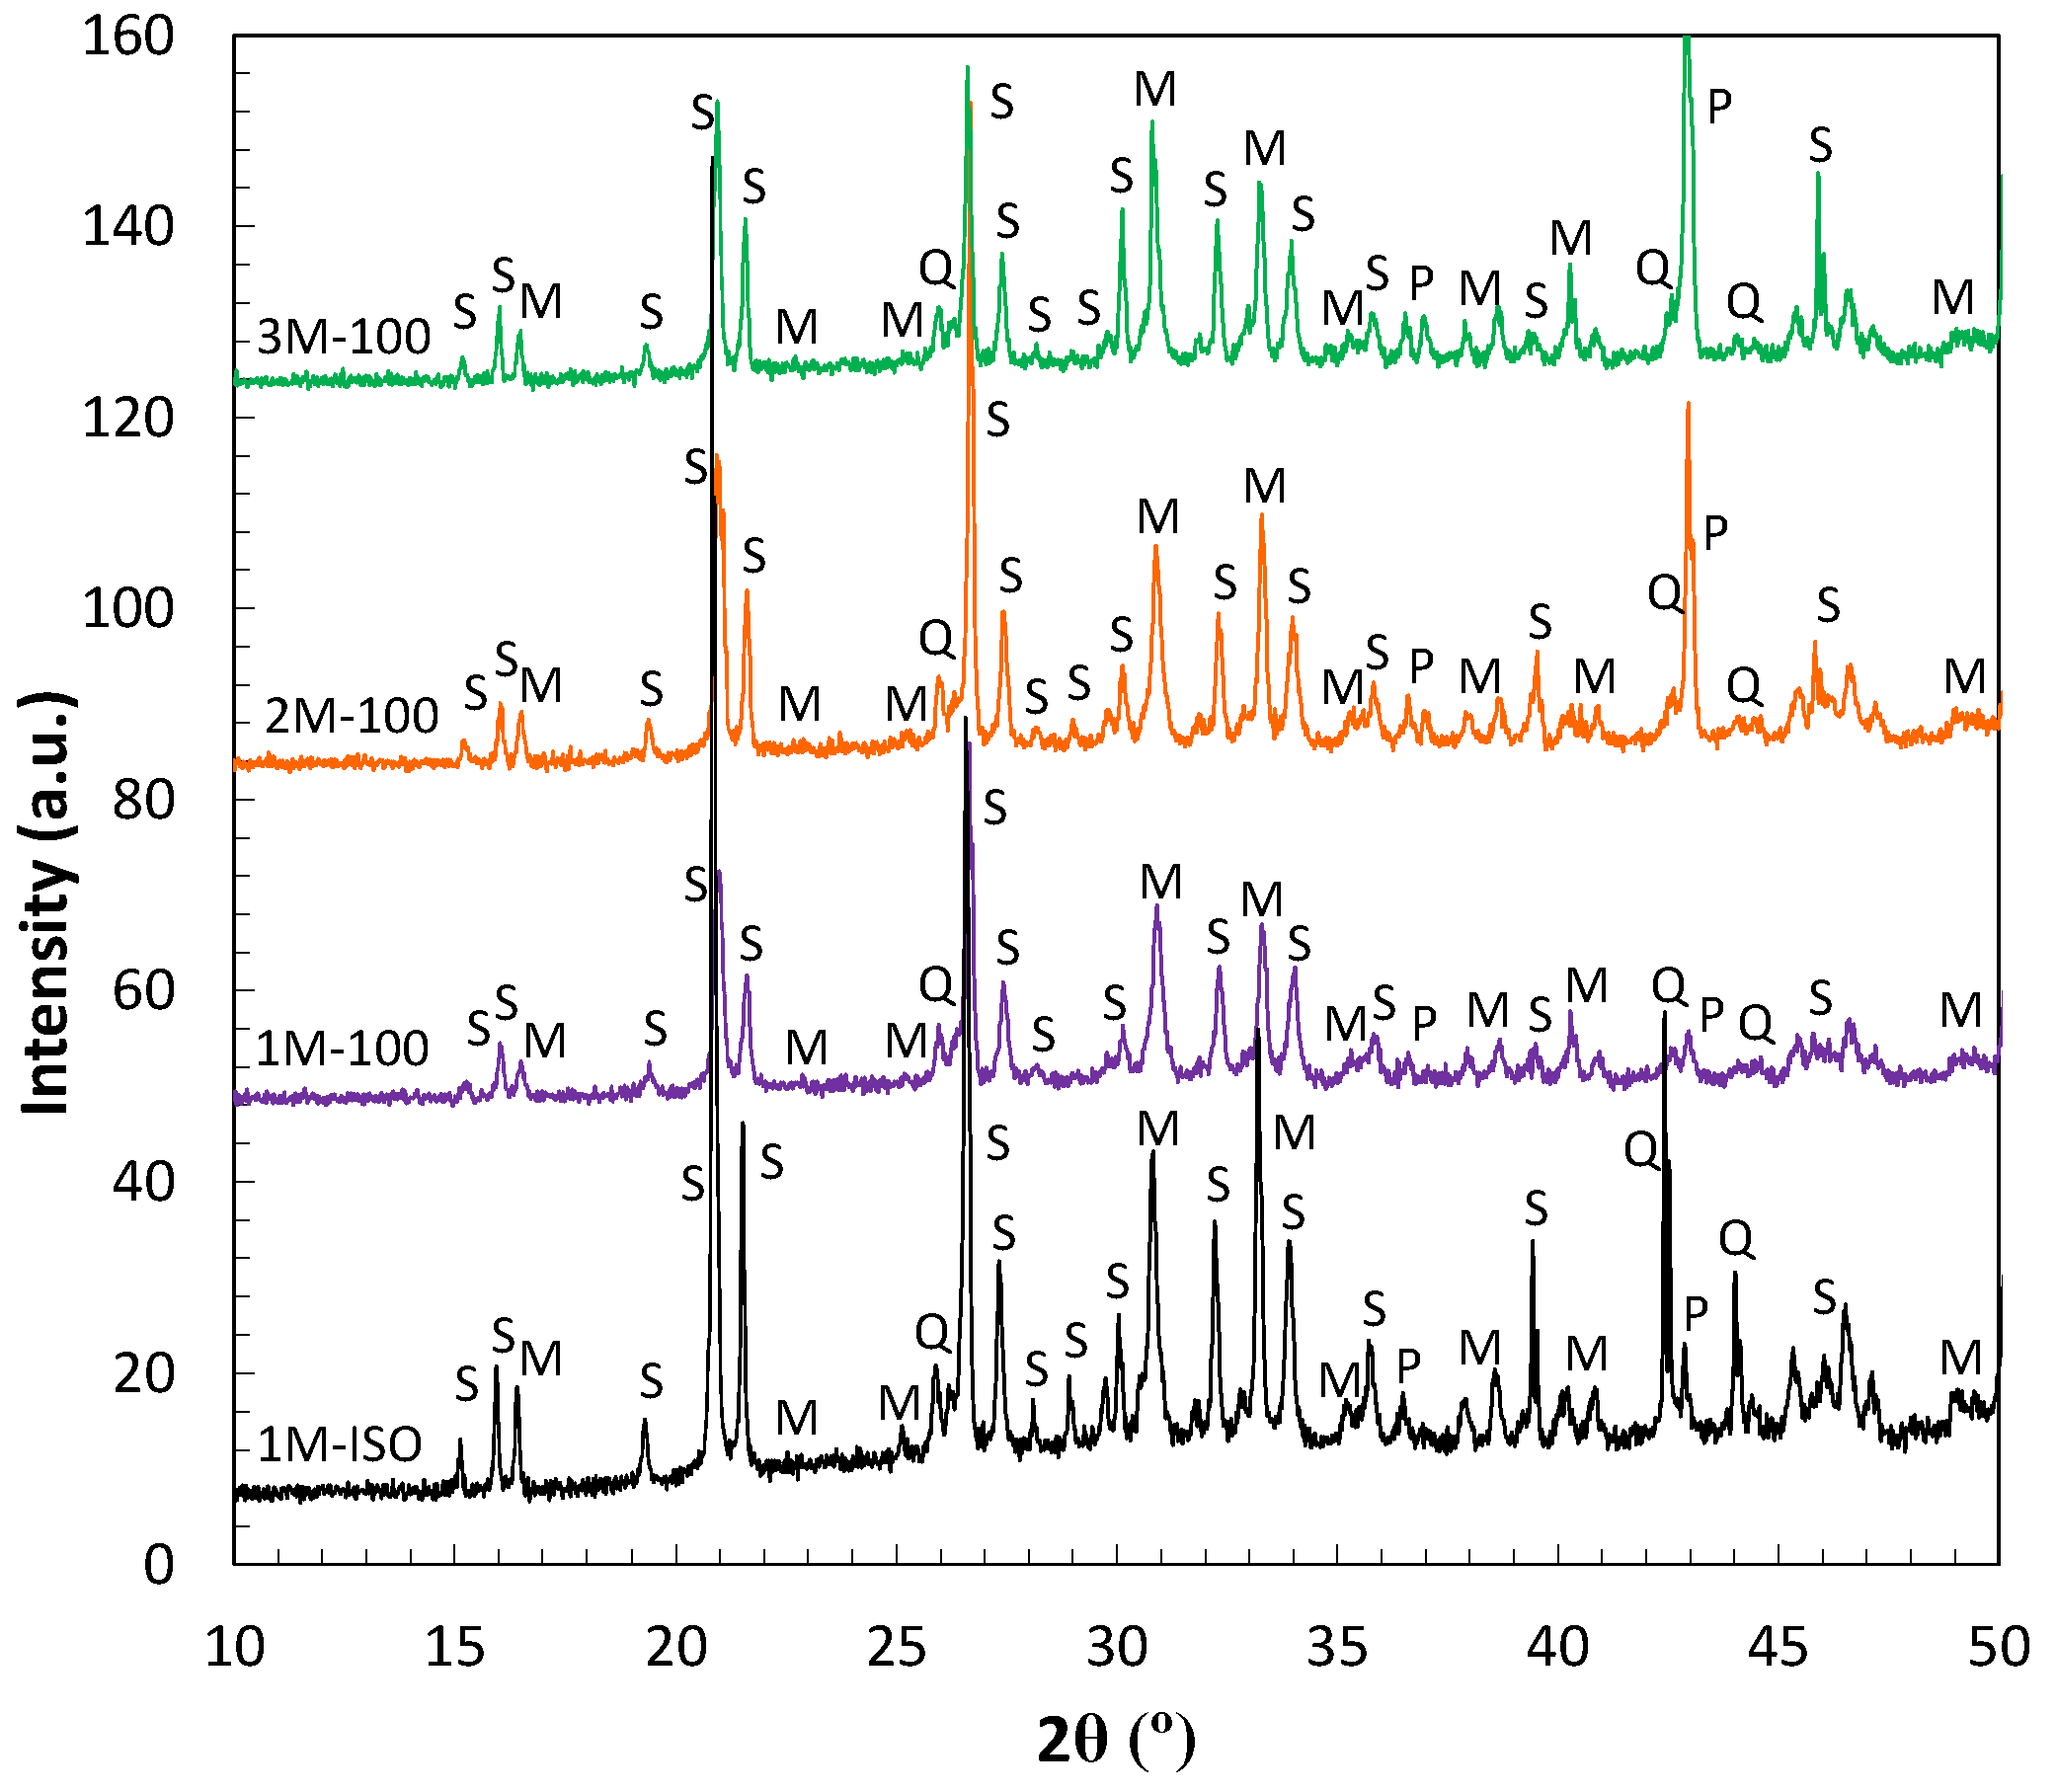
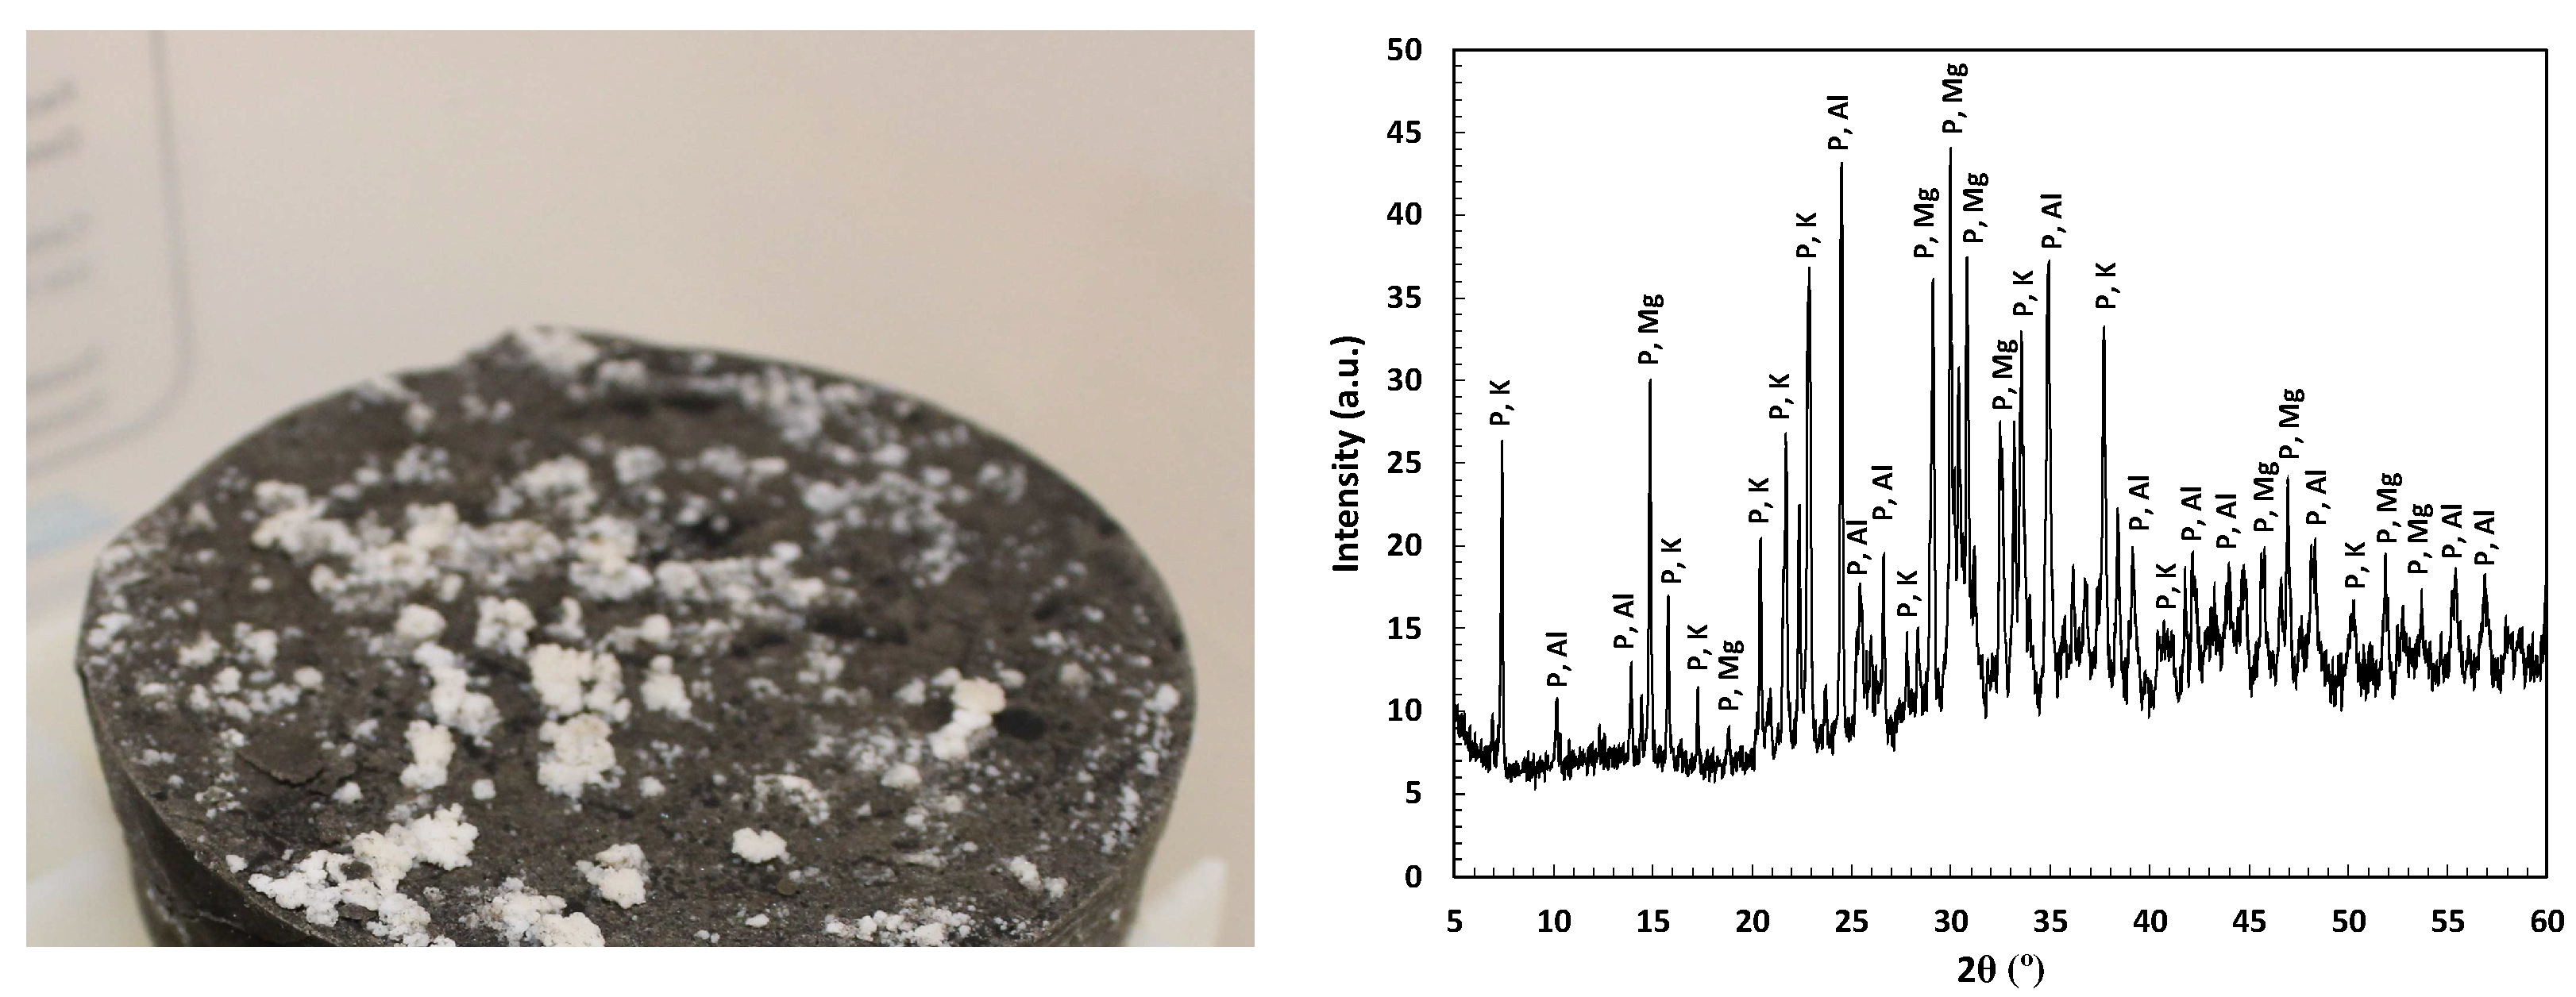
- The 1M M/P ratio exhibits lower strengths in both curing conditions, yielding matrix instabilities and phosphate efflorescences. The increase in M/P ratios allows higher capillary pores and higher mechanical strength of the matrices.
- -
- The pore solution is mainly dominated by phosphates, borates, and K but a low Mg content. The pore ion content decreases with the M/P ratio and curing advance.
Author Contributions
Funding
Institutional Review Board Statement
Informed Consent Statement
Data Availability Statement
Acknowledgments
Conflicts of Interest
References
- Kónya, J.; Nagy, N.M. Chapter 7—Nuclear Energy Production. In Nuclear and Radiochemistry, 2nd ed.; Elsevier: Amsterdam, The Netherlands, 2018; pp. 159–185. ISBN 978-0-12-813643-0. [Google Scholar]
- IAEA-TECDOC-568; Evaluation of Low and Intermediate Level Radioactive Solidified Waste Forms and Packages. The International Atomic Energy Agency: Vienna, Austria, 1985.
- Basic Principles Objectives IAEA Nuclear Energy Series Disposal Approaches for Long Lived Low and Intermediate Level Radioactive Waste No. NW-T-1.20 Guides. 2009. Available online: http://www.iaea.org/Publications/index.html (accessed on 17 December 2023).
- IAEA-TECDOC-1325; Management of Low and Intermediate Level Radioactive Wastes with Regard to Their Chemical Toxicity. International Atomic Energy Agency: Vienna, Austria, 2002.
- Pourbaix, M. Atlas d’Equilibres Electrochimiques. J. Electrochem. Soc. 1964, 111, 1. [Google Scholar] [CrossRef]
- Bouhier, P.; Cannes, C.; Lambertin, D.; Grisolia, C.; Rodrigues, D.; Delpech, D. Evaluation of several conditioning matrices for the management of radioactive metal beryllium wastes. J. Nucl. Mater. 2022, 559, 153464. [Google Scholar] [CrossRef]
- Ionascu, L.; Nicu, M.; Turcanu, C.; Dragolici, F.; Rotarescu, G.H. Study of the conditioning matrices for aluminium radioactive wastes. Rom. J. Phys. 2014, 59, 360–368. [Google Scholar]
- Cau Dit Coumes, C.; Lambertin, D.; Lahalle, H.; Antonucci, P.; Cannes, C.; Delpech, S. Selection of a mineral binder with potentialities for the stabilization/solidification of aluminium metal. J. Nucl. Mater. 2014, 453, 31–40. [Google Scholar] [CrossRef]
- Collier, N.C.; Milestone, N.B. The encapsulation of Mg(OH)2 sludge in composite cement. Cem. Concr. Res. 2010, 40, 452–459. [Google Scholar] [CrossRef]
- Vargel, C. Chapter B.1—The Corrosion of Aluminium. In Corrosion of Aluminium, 2nd ed.; Vargel, C., Ed.; Elsevier: Amsterdam, The Netherlands, 2020; pp. 41–61. ISBN 978-0-08-099925-8. [Google Scholar]
- Gardner, L.J.; Corkhill, C.L.; Walling, S.A.; Vigor, J.E.; Murray, C.A.; Tang, C.C.; Provis, J.L.; Hyatt, N.C. Early Age Hydration and Application of Blended Magnesium Potassium Phosphate Cements for Reduced Corrosion of Reactive Metals. Cem. Concr. Res. 2021, 143, 106375. [Google Scholar] [CrossRef]
- Covill, A.; Hyatt, N.; Hill, J.; Collier, N.C. Development of magnesium phosphate cements for encapsulation of radioactive waste. Adv. Appl. Ceram. 2011, 110, 151–156. [Google Scholar] [CrossRef]
- Shen, W.; Ren, Y.; Zhang, X.; Shi, Y. Solid-liquid phase equilibrium for the ternary system (potassium chloride + potassium dihydrogen phosphate + water) at (298.15 and 313.15) K. J. Chem. Eng. Data 2015, 60, 2070–2078. [Google Scholar] [CrossRef]
- Dieguez, M.; Ruiz, A.I.; Cuevas, J.; Alonso, M.C.; García-Lodeiro, I.; Fernández, R. Evaluation of Fillers for Magnesium Potassium Phosphate Cement (MKPC) for the Encapsulation of Low and Intermediate Level Metallic Radioactive Wastes. Materials 2023, 16, 679. [Google Scholar] [CrossRef]
- Luo, Z.; Wang, Y.; Liu, X.; Tian, C.; Wang, Y.; Mu, Y.; Zhang, M.; Hao, Y. Comparative Investigation of Effect of Borax and Sodium Gluconate Retarders on Properties of Magnesium Phosphate Cement. Arab. J. Sci. Eng. 2022, 47, 13187–13198. [Google Scholar] [CrossRef]
- Fang, B.; Hu, Z.; Shi, T.; Liu, Y.; Wang, X.; Yang, D.; Zhu, K.; Zhao, X.; Zhao, Z. Research progress on the properties and applications of magnesium phosphate cement. Ceram. Intern. 2023, 49, 4001–4016. [Google Scholar] [CrossRef]
- Delpech, S.; Cannes, C.; Barré, N.; Tran, Q.T.; Sanchez, C.; Lahalle, H.; Lambertin, D.; Gauffinet, S.; Cau-dit-Coumes, C. Kinetic model of aluminium behaviour in cement-based matrices analysed by impedance spectroscopy. J. Electrochem. Soc. 2017, 164, C717–C727. [Google Scholar] [CrossRef]
- Perona, R.; Fernández, C.; García-Lodeiro, I.; Criado, M.; Bastidas, J.M.; Alonso, M.C. Corrosion behaviour A1050 aluminium and AA5754 aluminium alloy in magnesium potassium phosphate cement at early stages of curing. J. Nucl. Mater. 2023, 582, 154501. [Google Scholar] [CrossRef]
- Wang, A.J.; Yuan, Z.L.; Zhang, J.; Liu, L.T.; Li, J.M.; Liu, Z. Effect of raw material ratios on the compressive strength of magnesium potassium phosphate chemically bonded ceramics. Mater. Sci. Eng. C 2013, 33, 5058–5063. [Google Scholar] [CrossRef] [PubMed]
- Wang, D.; Pei, S.; Wang, Y.; Ma, K.; Dai, C.; Wang, J.; Wang, J.; Pan, F. Effect of magnesium-to-phosphate ratio on the corrosion resistance of magnesium alloy embedded in magnesium potassium phosphate cement. Cem. Concr. Comp. 2023, 135, 104826. [Google Scholar] [CrossRef]
- Chong, L.; Yang, J.; Shi, C. Effect of curing regime on water resistance of magnesium–potassium phosphate cement. Const. Build. Mater. 2017, 151, 43–51. [Google Scholar] [CrossRef]
- Chartier, D.; Muzeau, B.; Stefan, L.; Sanchez-Canet, J.; Monguillon, C. Magnesium alloys and graphite wastes encapsulated in cementitious materials: Reduction of galvanic corrosion using alkali hydroxide activated blast furnace slag. J. Hazard. Mater. 2017, 326, 197–210. [Google Scholar] [CrossRef]
- UNE-EN 196-1:2008; Methods of Testing Cement—Part 1: Determination of Strength. AENOR: Madrid, Spain, 2008.
- Alonso, M.C.; Garcia-Calvo, J.L.; Petterson, S.; Cuñado, M.A.; Vuorio, M.; Weber, H.; Ueda, H.; Naito, M. Development of an accurate methodology for measure the pore fluid pH of low-pH cementitious materials. In Cement-Based Materials for Nuclear Waste Storage; Bart, F., Cau-dit-Coumes, C., Frizon, F., Lorente, S., Eds.; Springer: Berlin/Heidelberg, Germany, 2013; pp. 251–259. [Google Scholar]
- Xu, B.; Winnefeld, F.; Lothenbach, B. Effect of temperature curing on properties and hydration of wollastonite blended magnesium potassium phosphate cements. Cem. Concr. Res. 2021, 142, 106370. [Google Scholar] [CrossRef]
- Andrade, C.; Alonso, C. Corrosion rate monitoring in the laboratory and on-site. Constr. Build. Mater. 1996, 10, 315–328. [Google Scholar] [CrossRef]
- UNE-EN 112072:2011; Laboratory Measurement of Corrosion Speed Using the Polarization Resistance Technique. AENOR: Madrid, Spain, 2011.
- Andrade, C.; Alonso, M.C.; Gulikers, J.; Polder, R.; Cigna, R.; Venesland, O.; Salta, M.; Raharinaivo, A.; Elsener, B. Tests methods for on-site corrosion rate measurement of steel reinforcement in concrete by means of the polarisation resistance method. Mater. Struct. 2004, 37, 632–643. [Google Scholar] [CrossRef]
- Nygaard, P.; Geiker, M.R.; Elsener, B. Corrosion rate of steel in concrete: Evaluation of confinement techniques for on-site corrosion rate measurements. Mater. Struct. 2009, 42, 1059–1076. [Google Scholar] [CrossRef]
- Stern, M.; Geary, A.L. Electrochemical polarization: I. A theoretical analysis of the shape of polarization curves. J. Electrochem. Soc. 1957, 104, 56–63. [Google Scholar] [CrossRef]
- Gomma, G.K.; Wahdan, M.H. Schiff bases as corrosion inhibitors for aluminium in hydrochloric acid solution. Mater. Chem. Phys. 1995, 39, 203–215. [Google Scholar] [CrossRef]
- Abdel-Gaber, A.M.; Khamis, E.; Abo-Eldahab, H.; Adeel, S.K. Novel package for inhibition of aluminium corrosion in alkaline solutions. Mater. Chem. Phys. 2010, 124, 773–779. [Google Scholar] [CrossRef]
- Caes, S.; Gurning, A.C.; Li, X.; de Souza, V.; Kursten, B. Corrosion of aluminium in ordinary Portland cement paste: Influence of matrix porosity and the presence of LiNO3 corrosion inhibitor. Mater. Corros. 2023, 74, 125–137. [Google Scholar] [CrossRef]
- Andrade, C.; González, J.A. Quantitative measurements of corrosion rate of reinforcing steels embedded in concrete using polarization resistance measurements. Werkst. Korros. 1978, 29, 515–519. [Google Scholar] [CrossRef]
- ASTM STP 1065; Quantitative Measurement of the Corrosion Rate Using a Small Counter Electrode in the Boundary of Passive and Corroded Zones of a Long Concrete Beam. ASTM: Philadelphia, PA, USA, 1990.
- Bastidas, J.M. Corrosion mechanisms of steel and copper in engineering applications. Corrosion 2021, 77, 1248–1257. [Google Scholar] [CrossRef]
- ASTM-G102-89; Calculation of Corrosion Rates and Related Information from Electrochemical Measurements. American Society for Testing and Materials: Philadelphia, PA, USA, 1999.
- Wu, J.; Lay, Z.; Deng, Q.; Liu, M. Effects of Various Curing Conditions on Volume Stability of Magnesium Phosphate Cement. Hindawi Limited. Adv. Mater. Sci. Eng. 2021, 2021, 6652363. [Google Scholar] [CrossRef]
- Wang, D.; Zhu, J.; Wang, R. Assessment of magnesium potassium phosphate cement for waste sludge solidification: Macro- and micro-analysis. J. Clean. Prod. 2021, 294, 126365. [Google Scholar] [CrossRef]
- Ding, Z.; Dong, B.; Xing, F.; Han, N.; Li, Z. Cementing mechanism of potassium phosphate-based magnesium phosphate cement. Ceram. Int. 2012, 38, 6281–6288. [Google Scholar] [CrossRef]
- Park, J.W.; Kim, K.H.; Ann, K.Y. Fundamental Properties of Magnesium Phosphate Cement Mortar for Rapid Repair of Concrete. Adv. Mater. Sci. Eng. 2016, 2016, 7179403. [Google Scholar] [CrossRef]
- Peng, Y.; Tang, S.; Huang, J.; Tang, C.; Wang, L.; Liu, Y. Fractal Analysis on Pore Structure and Modelling of Hydration of Magnesium Phosphate Cement Paste. Fractal Fract. 2022, 6, 337. [Google Scholar] [CrossRef]
- Ma, C.; Chen, G.; Jiang, Z.; Zhou, H.; Yao, H.; Zhou, R.; Ren, W. Rheological properties of magnesium phosphate cement with different M/P ratios. Constr. Build. Mater. 2021, 282, 122657. [Google Scholar] [CrossRef]
- Ma, H.; Xu, B.; Liu, J.; Pei, H.; Li, Z. Effects of water content, magnesia-to-phosphate molar ratio and age on pore structure, strength, and permeability of magnesium potassium phosphate cement paste. Mater. Des. 2014, 64, 497–502. [Google Scholar] [CrossRef]
- Andrade, C.; Blanco, V.M.; Collazo, A.; Keddam, M.; Noâ Voa, X.R.; Takenouti, H. Cement pastes hardening process studied by impedance spectroscopy. Electrochem. Acta 1999, 44, 4313–4318. [Google Scholar] [CrossRef]
- Díaz, B.; Freire, L.; Merino, P.; Nóvoa, X.R.; Pérez, M.C. Impedance spectroscopy study of saturated mortar samples. Electrochem. Acta 2008, 53, 7549–7555. [Google Scholar] [CrossRef]
- Koleva, D.A.; van Breugel, K. The Integration of EIS parameters and bulk matrix characterization in studying reinforced cement-based materials. Bulg. Chem. Commun. 2012, 44, 324–332. [Google Scholar]
- Cabeza, M.; Merino, P.; Miranda, A.; Nóvoa, X.R.; Sánchez, I. Impedance spectroscopy study of hardened Portland cement paste. Cem. Concr. Res. 2002, 32, 881–891. [Google Scholar] [CrossRef]
- Cabeza, M.; Keddam, M.; Nóvoa, X.R.; Sánchez, I.; Takenouti, H. Impedance spectroscopy to characterize the pore structure during the hardening process of Portland cement paste. Electrochem. Acta 2006, 51, 1831–1841. [Google Scholar] [CrossRef]
- Poras, G.; Cau Dit Coumes, C.; Antonucci, P.; Cannes, C.; Delpech, S.; Perrin, S. Electrochemical Behavior of Al/Mg Alloys Immobilized in a Magnesium Potassium Phosphate Cement-Based Mortar. Materials 2023, 16, 5415. [Google Scholar] [CrossRef]
- Liu, Z.; Zhang, Y.; Jiang, Q. Continuous tracking of the relationship between resistivity and pore structure of cement pastes. Constr. Build. Mater. 2014, 53, 26–31. [Google Scholar] [CrossRef]
- Hong, S.; Zhang, J.; Liang, H.; Xiao, J.; Huang, C.; Wang, G.; Hu, H.; Liu, Y.; Xu, Y.; Xing, F. Investigation on early hydration features of magnesium potassium phosphate cementitious material with the electrodeless resistivity method. Cem. Concr. Comp. 2018, 90, 235–240. [Google Scholar] [CrossRef]
- Peng, L.; Chen, B. Study on the basic properties and mechanism of waste sludge solidified by magnesium phosphate cement containing different active magnesium oxide. Constr. Build. Mater. 2021, 281, 122609. [Google Scholar] [CrossRef]
- Peng, L.; Chen, B. Mechanical behavior, durability, thermal performances, and microstructure of GGBFS—Modified MPC solidified dredged sludge. Constr. Build. Mater. 2021, 303, 124557. [Google Scholar] [CrossRef]
- Li, J.; Zhang, W.; Monteiro, P.J.M. Mechanical properties of struvite K: A high-pressure X-ray diffraction study. Cem. Concr. Res. 2020, 136, 106171. [Google Scholar] [CrossRef]
- Zhang, T.; Chen, H.; Li, X.; Zhu, Z. Hydration behavior of magnesium potassium phosphate cement and stability analysis of its hydration products through thermodynamic modelling. Cem. Concr. Res. 2017, 98, 101–110. [Google Scholar] [CrossRef]
- He, Y.; Ai, Z.; Yan, T.; He, X.; Lu, Z.; Lv, S.; Li, F.; Fan, X.; Zhang, H. Effect of Cd2+ on early hydration process of magnesium phosphate cement and its leaching toxicity properties. Constr. Build. Mater. 2019, 209, 32–40. [Google Scholar] [CrossRef]
- Criado, M.; Bastidas, D.M.; La Iglesia, V.M.; La Iglesia, A.; Bastidas, J.M. Precipitation mechanism of soluble phosphates in mortar. Eur. J. Environ. Civ. Eng. 2019, 23, 1265–1274. [Google Scholar] [CrossRef]
- Lahalle, H.; Cau-dit-Coumes, C.; Lambertin, D.; Cannes, C.; Delpech, S.; Gauffinet, S. Influence of Boric Acid on the Hydration of Magnesium Phosphate Cement at an Early Age. HAL Open Science. 2020. Available online: https://cea.hal.science/cea-02509270 (accessed on 17 December 2023).
- Zheng, Y.; Zhou, Y.; Huang, X.; Luo, H. Effect of raw materials and proportion on mechanical properties of magnesium phosphate cement. J. Road Eng. 2022, 2, 243–251. [Google Scholar] [CrossRef]
- Lahalle, H.; Cau Dit Coumes, C.; Mercier, C.; Lambertin, D.; Cannes, C.; Delpech, S.; Gauffinet, S. Influence of the w/c ratio on the hydration process of a magnesium phosphate cement and on its retardation by boric acid. Cem. Concr. Res. 2018, 109, 159–174. [Google Scholar] [CrossRef]
- Medeiros, M.H.F.; Rocha, F.C.; Medeiros-Junior, R.A.; Helene, P. Corrosion potential: Influence of moisture, water-cement ratio, chloride content and concrete cover. Rev. IBRACON Estrut. Mater. 2017, 10, 864–885. [Google Scholar] [CrossRef]
- Andrade, C.; Alonso, C.; Sarría, J.; Galvache, S. Corrosion rate evolution in concrete structures exposed to the atmosphere. Cem. Concr. Comp. 2002, 24, 55–64. [Google Scholar] [CrossRef]
- Pokhmurskii, V.I.; Zin, I.M.; Vynar, V.A.; Khlopyk, O.P.; Bily, L.M. Corrosive wear of aluminium alloy in presence of phosphate. Corros. Eng. Sci. Technol. 2012, 47, 182–187. [Google Scholar] [CrossRef]
- Mance, A.; Cerović, D.; Mihajlović, A. The effect of gallium and phosphorus on the corrosion behaviour of aluminium in sodium chloride solution. J. Appl. Electrochem. 1985, 15, 415–420. [Google Scholar] [CrossRef]
- Oleynik, S.V.; Rudnev, V.S.; Kuzenkov, Y.A.; Jarovaja, T.P.; Trubetskaja, L.F.; Nedozorov, P.M. Protective properties of PEO coatings modified by corrosion inhibitors on aluminum alloys. Int. J. Corros. Scale Inhib. 2017, 6, 91–111. [Google Scholar] [CrossRef]


| Material | Al | Mg | Fe | Cu | Si | Mn | Cr | Zn | Ti |
|---|---|---|---|---|---|---|---|---|---|
| A1050 | 99.50 | 0.05 | 0.15 | 0.001 | 0.14 | 0.05 | - | 0.05 | 0.05 |
| AA5754 | 94.50 | 3.50 | 0.40 | 0.30 | 0.40 | 0.30 | 0.25 | 0.20 | 0.15 |
| Material | Al2O3 | CaO | Fe2O3 | K2O | MgO | Na2O | SiO2 | SO3 |
|---|---|---|---|---|---|---|---|---|
| MgO product | 0.15 | 0.93 | 0.18 | 0.68 | 97.45 | 0.11 | 0.42 | 0.06 |
| Material | M/P Ratio = 1M | M/P Ratio = 2M | M/P Ratio = 3M | |||
|---|---|---|---|---|---|---|
| Compound (mass, g) | Mortar | Paste | Mortar | Paste | Mortar | Paste |
| MgO | 70 | 100 | 110 | 170 | 140 | 210 |
| KH2PO4 | 232 | 332 | 183 | 282 | 155 | 232 |
| Sand (≤2 mm) | 302 | - | 293 | - | 295 | - |
| Fly Ash (FA) | 302 | 432 | 293 | 452 | 295 | 442 |
| H3BO3 | 6 | 9 | 6 | 9 | 6 | 9 |
| Water | 154 | 130 | 149 | 136 | 150 | 133 |
| Type of Test | Al Alloy Corrosion | MKPC Matrix | |||||
|---|---|---|---|---|---|---|---|
| Ecorr, icorr, Vcorr, Volume of H2 | Electrical Resistivity and Mass Loss | Compression, MIP, XRD, Pore Ion Content and pH | |||||
| Cement material | Mortar | Mortar | Paste | Mortar | |||
| M/P ratio | 1, 2, 3M | 1M | 1M | 1, 2, 3M | 1M | ||
| Curing condition | 100%RH | Isolated curing | 100%RH | Isolated curing | Isolated curing, 100%RH | 100%RH | Isolated curing |
| Sample Geometry cm | 5 × 5 × 5 | 9.5 × 6 | 3 × 3 × 3 | 1 × 1 × 6 | 5 × 5 × 5 | 9 × 2.3 | |
| Prism | Cylinder | Prism | Prism | Cylinder | |||
| Metal | Al/Al-Mg | SS mesh | - | ||||
 |  |  |  |  |  | ||
| a | b | c | d | e | f | ||
| Isolated Curing | 100%RH Curing | ||
|---|---|---|---|
| Cell configuration | Connection | Cell configuration | Connection |
 |  |  |  |
| MKPC | M/P Ratio = 1M | M/P Ratio = 2M | M/P Ratio = 3M | ||||||
|---|---|---|---|---|---|---|---|---|---|
| Days | Ecorr (V) | Days | Ecorr (V) | Days | Ecorr (V) | ||||
| Metal | - | Al | AlMg | - | Al | AlMg | - | Al | AlMg |
| 1st stage | 0−16 | −0.84 ±0.03 | −0.81 ± 0.06 | 0−22 | −0.94 ±0.04 | −0.96 ±0.02 | 0−22 | −1.00 ±0.04 | −1.03 ±0.06 |
| 2nd stage | 16−62 | −0.76 ±0.02 | −0.75 ±0.04 | 22−54 | −0.88 ±0.01 | −0.88 ±0.01 | 22−48 | −0.92 ±0.08 | −0.93 ±0.06 |
| 3rd stage | 62−90 | −0.52 ±0.02 | −0.53 ±0.06 | 54−90 | −0.71 ±0.02 | −0.74 ±0.02 | 48−90 | −0.76 ±0.03 | −0.80 ±0.03 |
| MKPC | M/P Ratio = 1M | M/P Ratio = 2M | M/P Ratio = 3M | ||||||
|---|---|---|---|---|---|---|---|---|---|
| Days | icorr (µA/cm2) | Days | icorr (µA/cm2) | Days | icorr (µA/cm2) | ||||
| Metal | - | Al | AlMg | - | Al | AlMg | - | Al | AlMg |
| 1st stage | 0−16 | 0.13 ±0.01 | 0.18 ±0.11 | 0−22 | 0.36 ±0.09 | 0.43 ±0.08 | 0−22 | 0.63 ±0.28 | 0.52 ±0.34 |
| 2nd stage | 16−90 | 0.13 ±0.07 | 0.11 ±0.03 | 22−90 | 0.20 ±0.07 | 0.16 ±0.04 | 22−90 | 0.22 ±0.04 | 0.20 ±0.03 |
| MKPC | M/P Ratio = 1M | M/P Ratio = 2M | M/P Ratio = 3M | ||||||
|---|---|---|---|---|---|---|---|---|---|
| Days | Vcorr (µm/yr) | Days | Vcorr (µm/yr) | Days | Vcorr (µm/yr) | ||||
| Metal | - | Al | AlMg | - | Al | AlMg | - | Al | AlMg |
| 1st stage | 0−16 | 1.45 ±0.02 | 1.97 ±1.26 | 0−22 | 3.93 ±1.00 | 4.64 ±0.90 | 0−22 | 6.81 ±3.15 | 5.65 ±3.80 |
| 2nd stage | 16−90 | 1.39 ±0.81 | 1.15 ±0.38 | 22−90 | 2.19 ±0.80 | 1.73 ±0.43 | 22−90 | 2.44 ±0.43 | 2.21 ±0.36 |
| MKPC | M/P Ratio = 1M | M/P Ratio = 2M | M/P Ratio = 3M | |||
|---|---|---|---|---|---|---|
| Parameter | H2 (L/m2) | H2 (L/m2) | H2 (L/m2) | |||
| Metal | Al | AlMg | Al | AlMg | Al | AlMg |
| 100%RH | 2.05 ±0.48 | 2.14 ±0.63 | 4.97 ±0.48 | 5.93 ±0.86 | 6.23 ±0.42 | 7.21 ±0.39 |
| Isolated | 0.60 ±0.06 | 0.61 ±0.15 | - | - | - | - |
Disclaimer/Publisher’s Note: The statements, opinions and data contained in all publications are solely those of the individual author(s) and contributor(s) and not of MDPI and/or the editor(s). MDPI and/or the editor(s) disclaim responsibility for any injury to people or property resulting from any ideas, methods, instructions or products referred to in the content. |
© 2024 by the authors. Licensee MDPI, Basel, Switzerland. This article is an open access article distributed under the terms and conditions of the Creative Commons Attribution (CC BY) license (https://creativecommons.org/licenses/by/4.0/).
Share and Cite
Fernández-García, C.; Alonso, M.C.; Bastidas, J.M.; García-Lodeiro, I.; Fernández, R. MgO/KH2PO4 and Curing Moisture Content in MKPC Matrices to Optimize the Immobilization of Pure Al and Al-Mg Alloys. Materials 2024, 17, 1263. https://doi.org/10.3390/ma17061263
Fernández-García C, Alonso MC, Bastidas JM, García-Lodeiro I, Fernández R. MgO/KH2PO4 and Curing Moisture Content in MKPC Matrices to Optimize the Immobilization of Pure Al and Al-Mg Alloys. Materials. 2024; 17(6):1263. https://doi.org/10.3390/ma17061263
Chicago/Turabian StyleFernández-García, Carla, María Cruz Alonso, José María Bastidas, Inés García-Lodeiro, and Raúl Fernández. 2024. "MgO/KH2PO4 and Curing Moisture Content in MKPC Matrices to Optimize the Immobilization of Pure Al and Al-Mg Alloys" Materials 17, no. 6: 1263. https://doi.org/10.3390/ma17061263