

Anisotropic Hardening and Plastic Evolution Characterization on the Pressure-Coupled Drucker Yield Function of ZK61M Magnesium Alloy
Abstract
1. Introduction
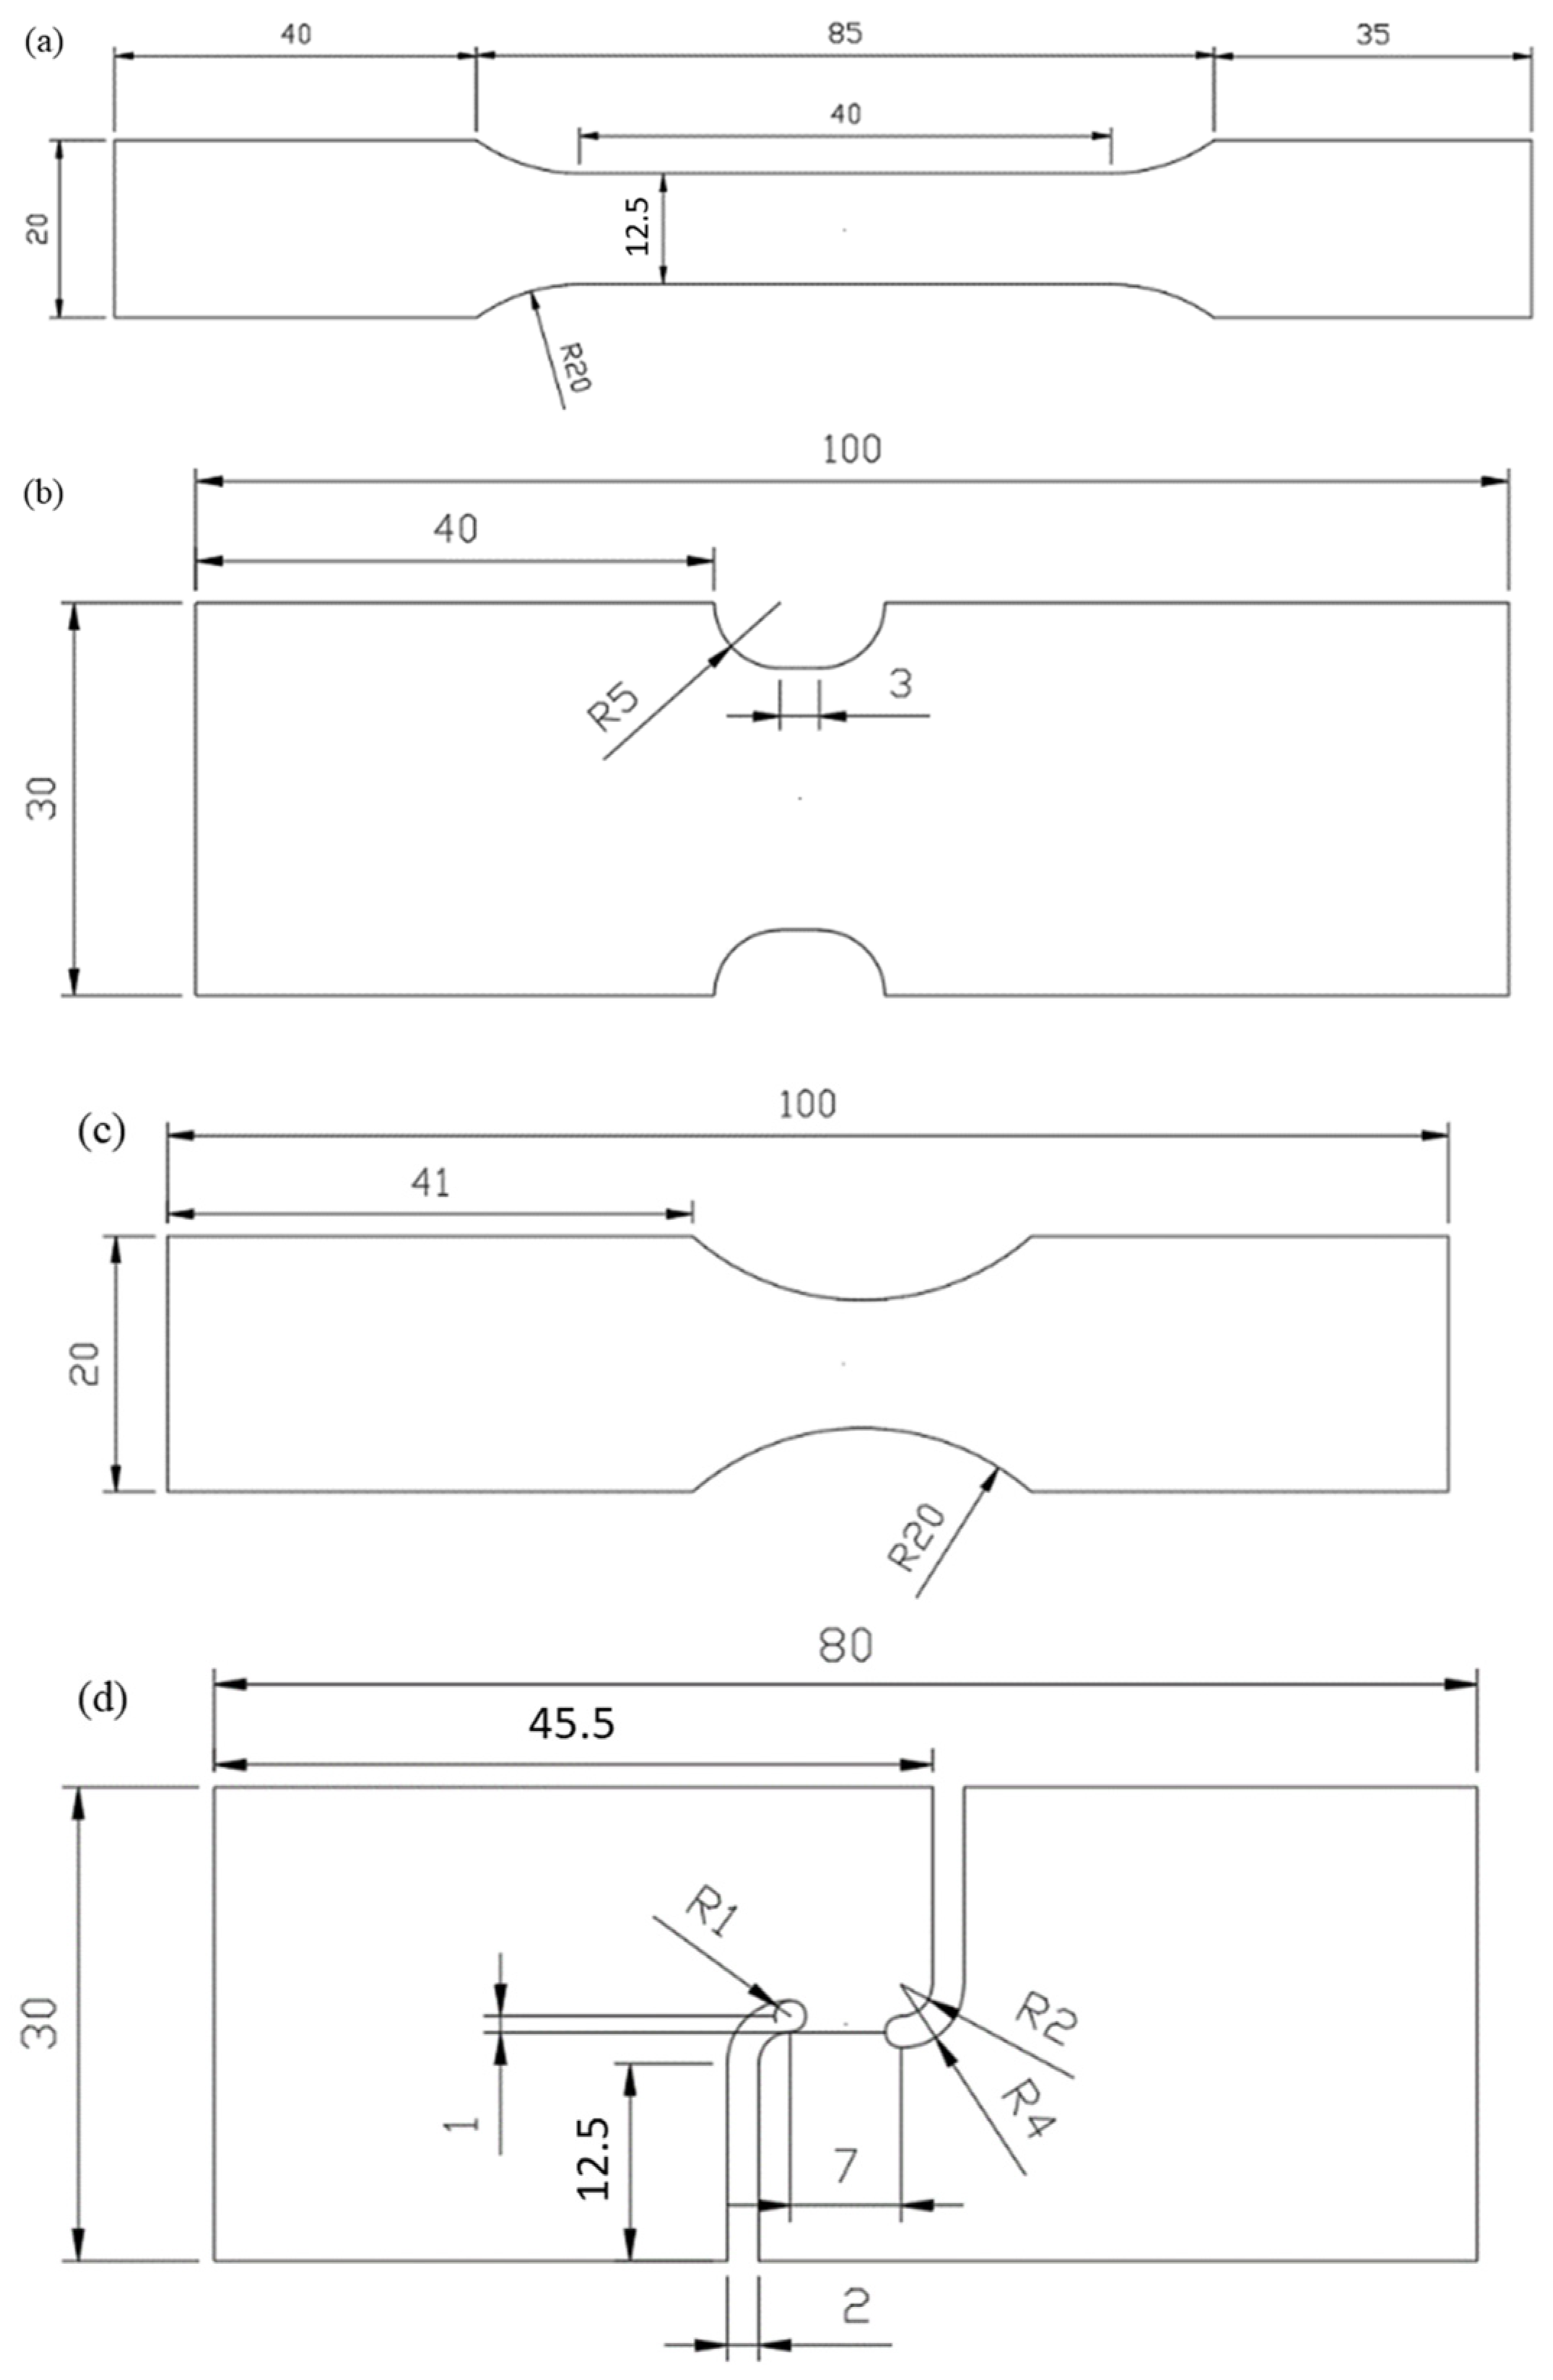
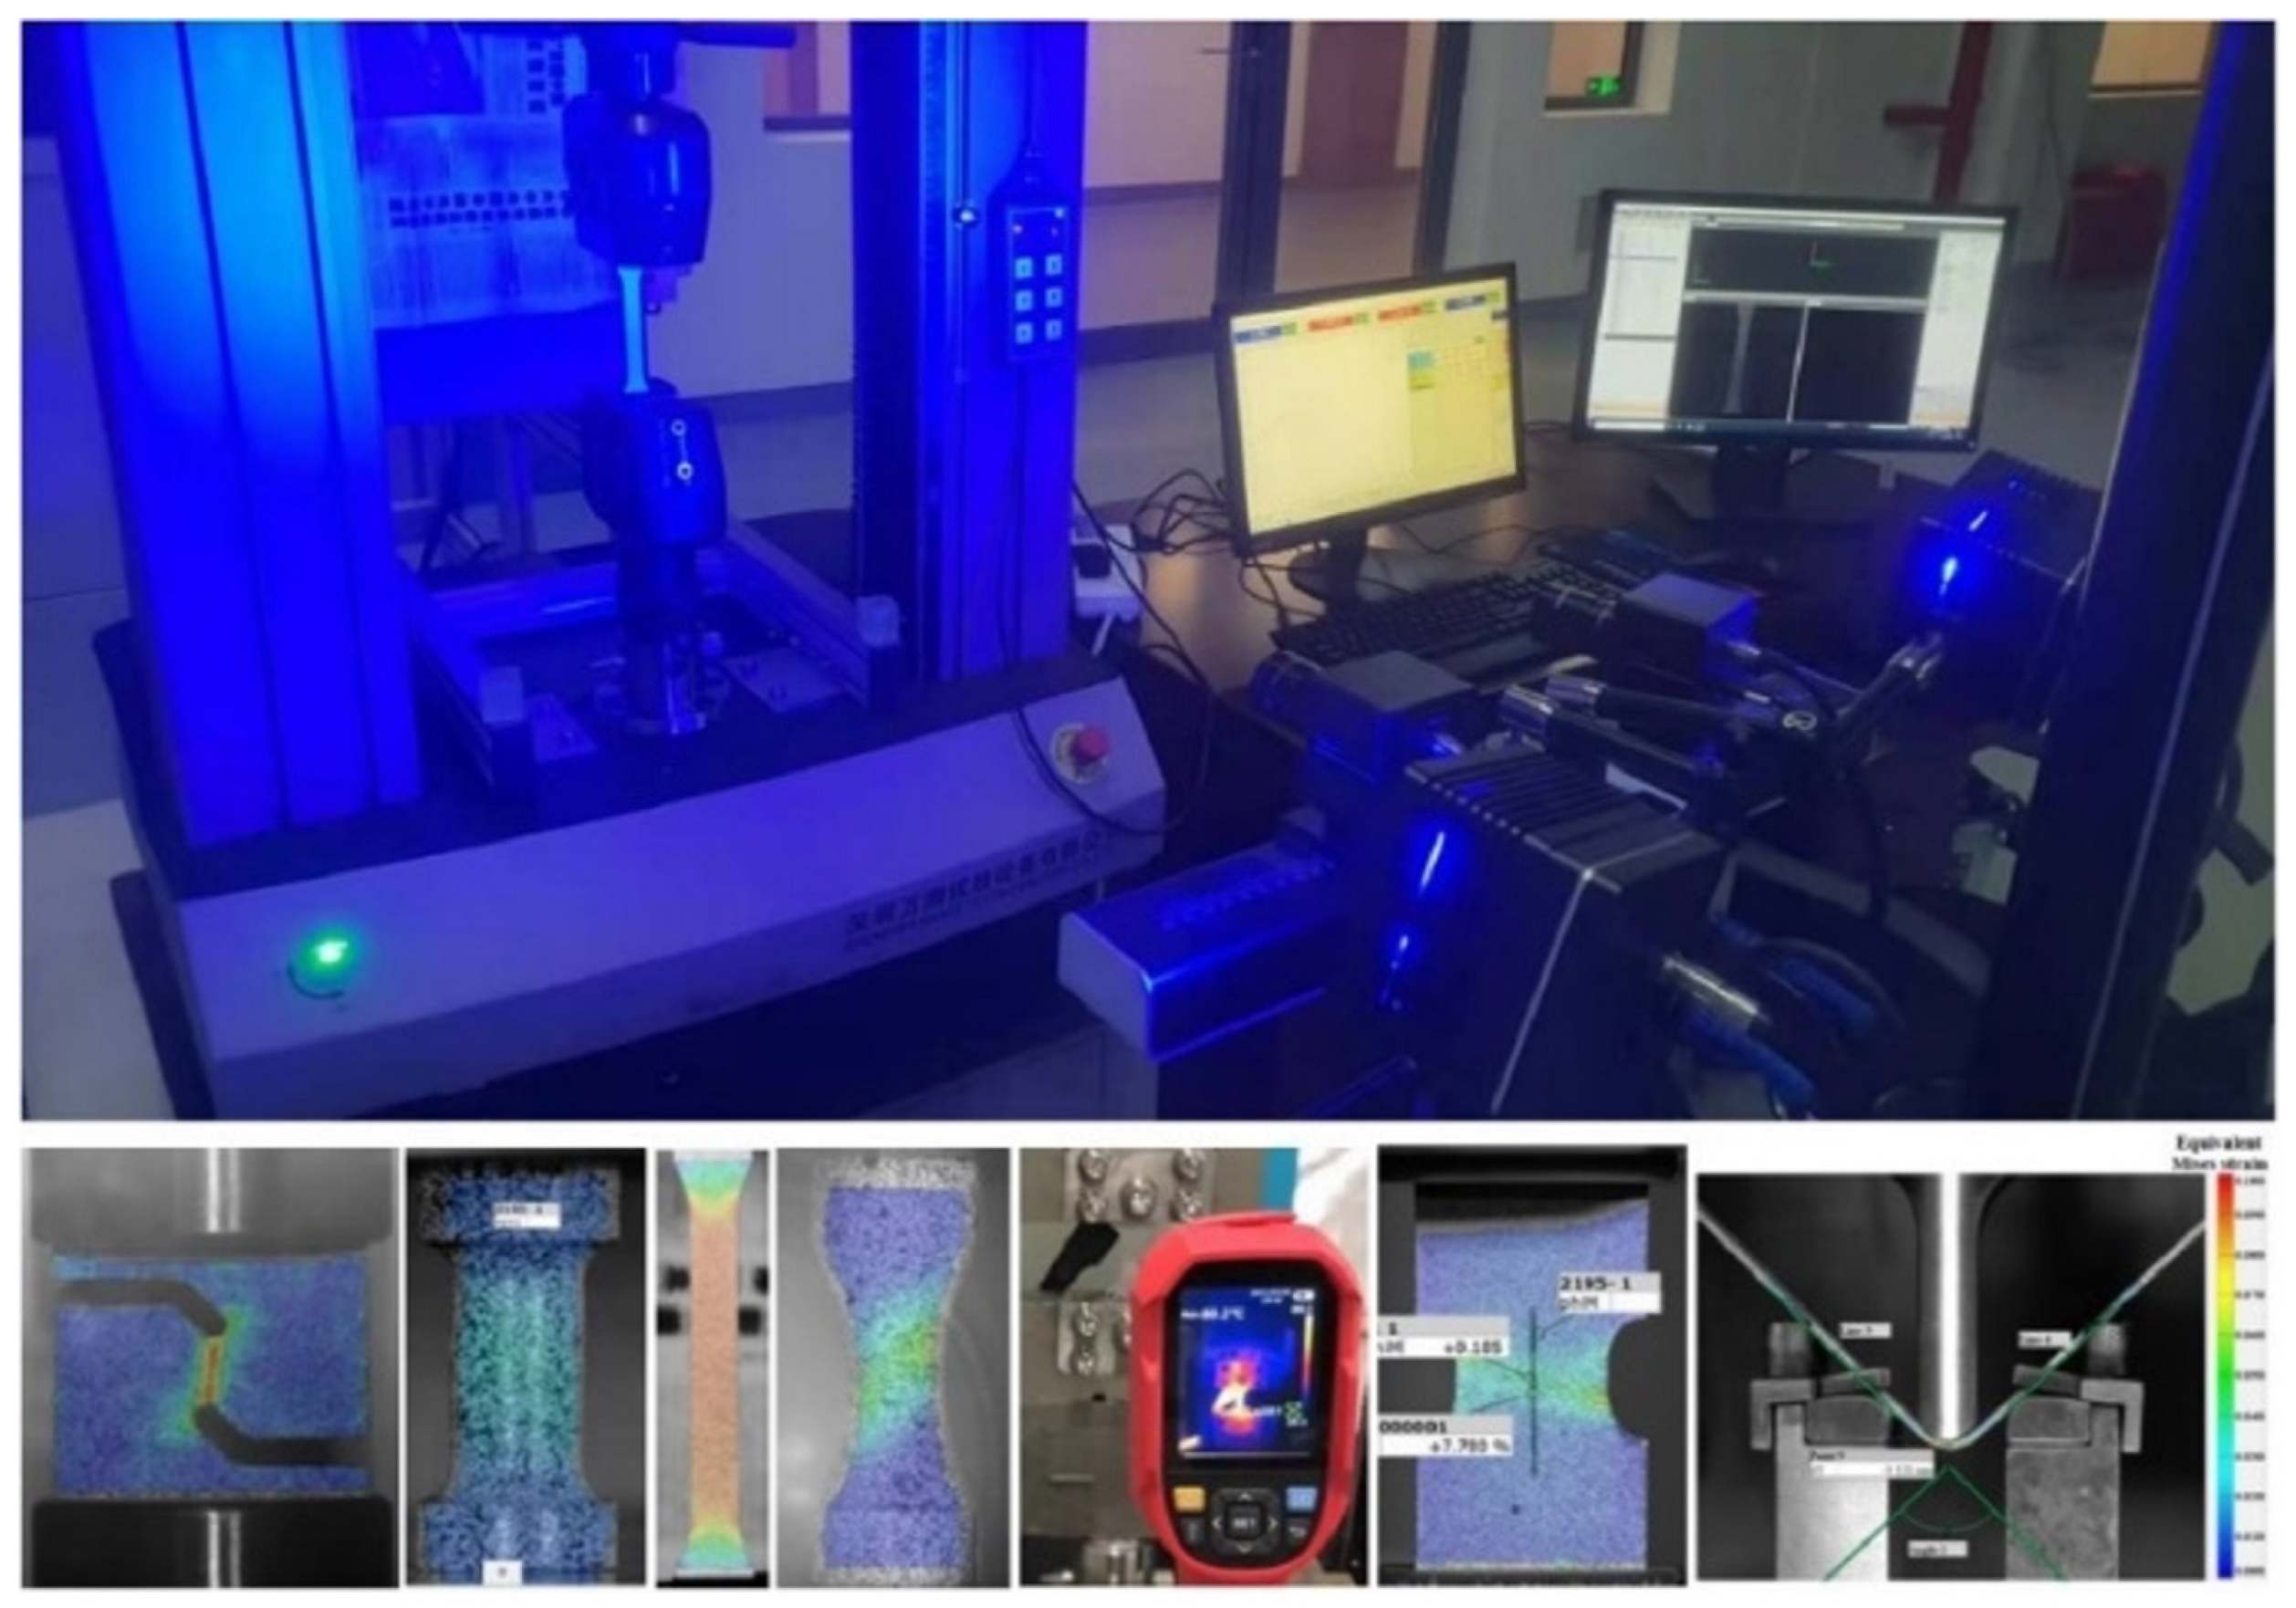
2. Experiment
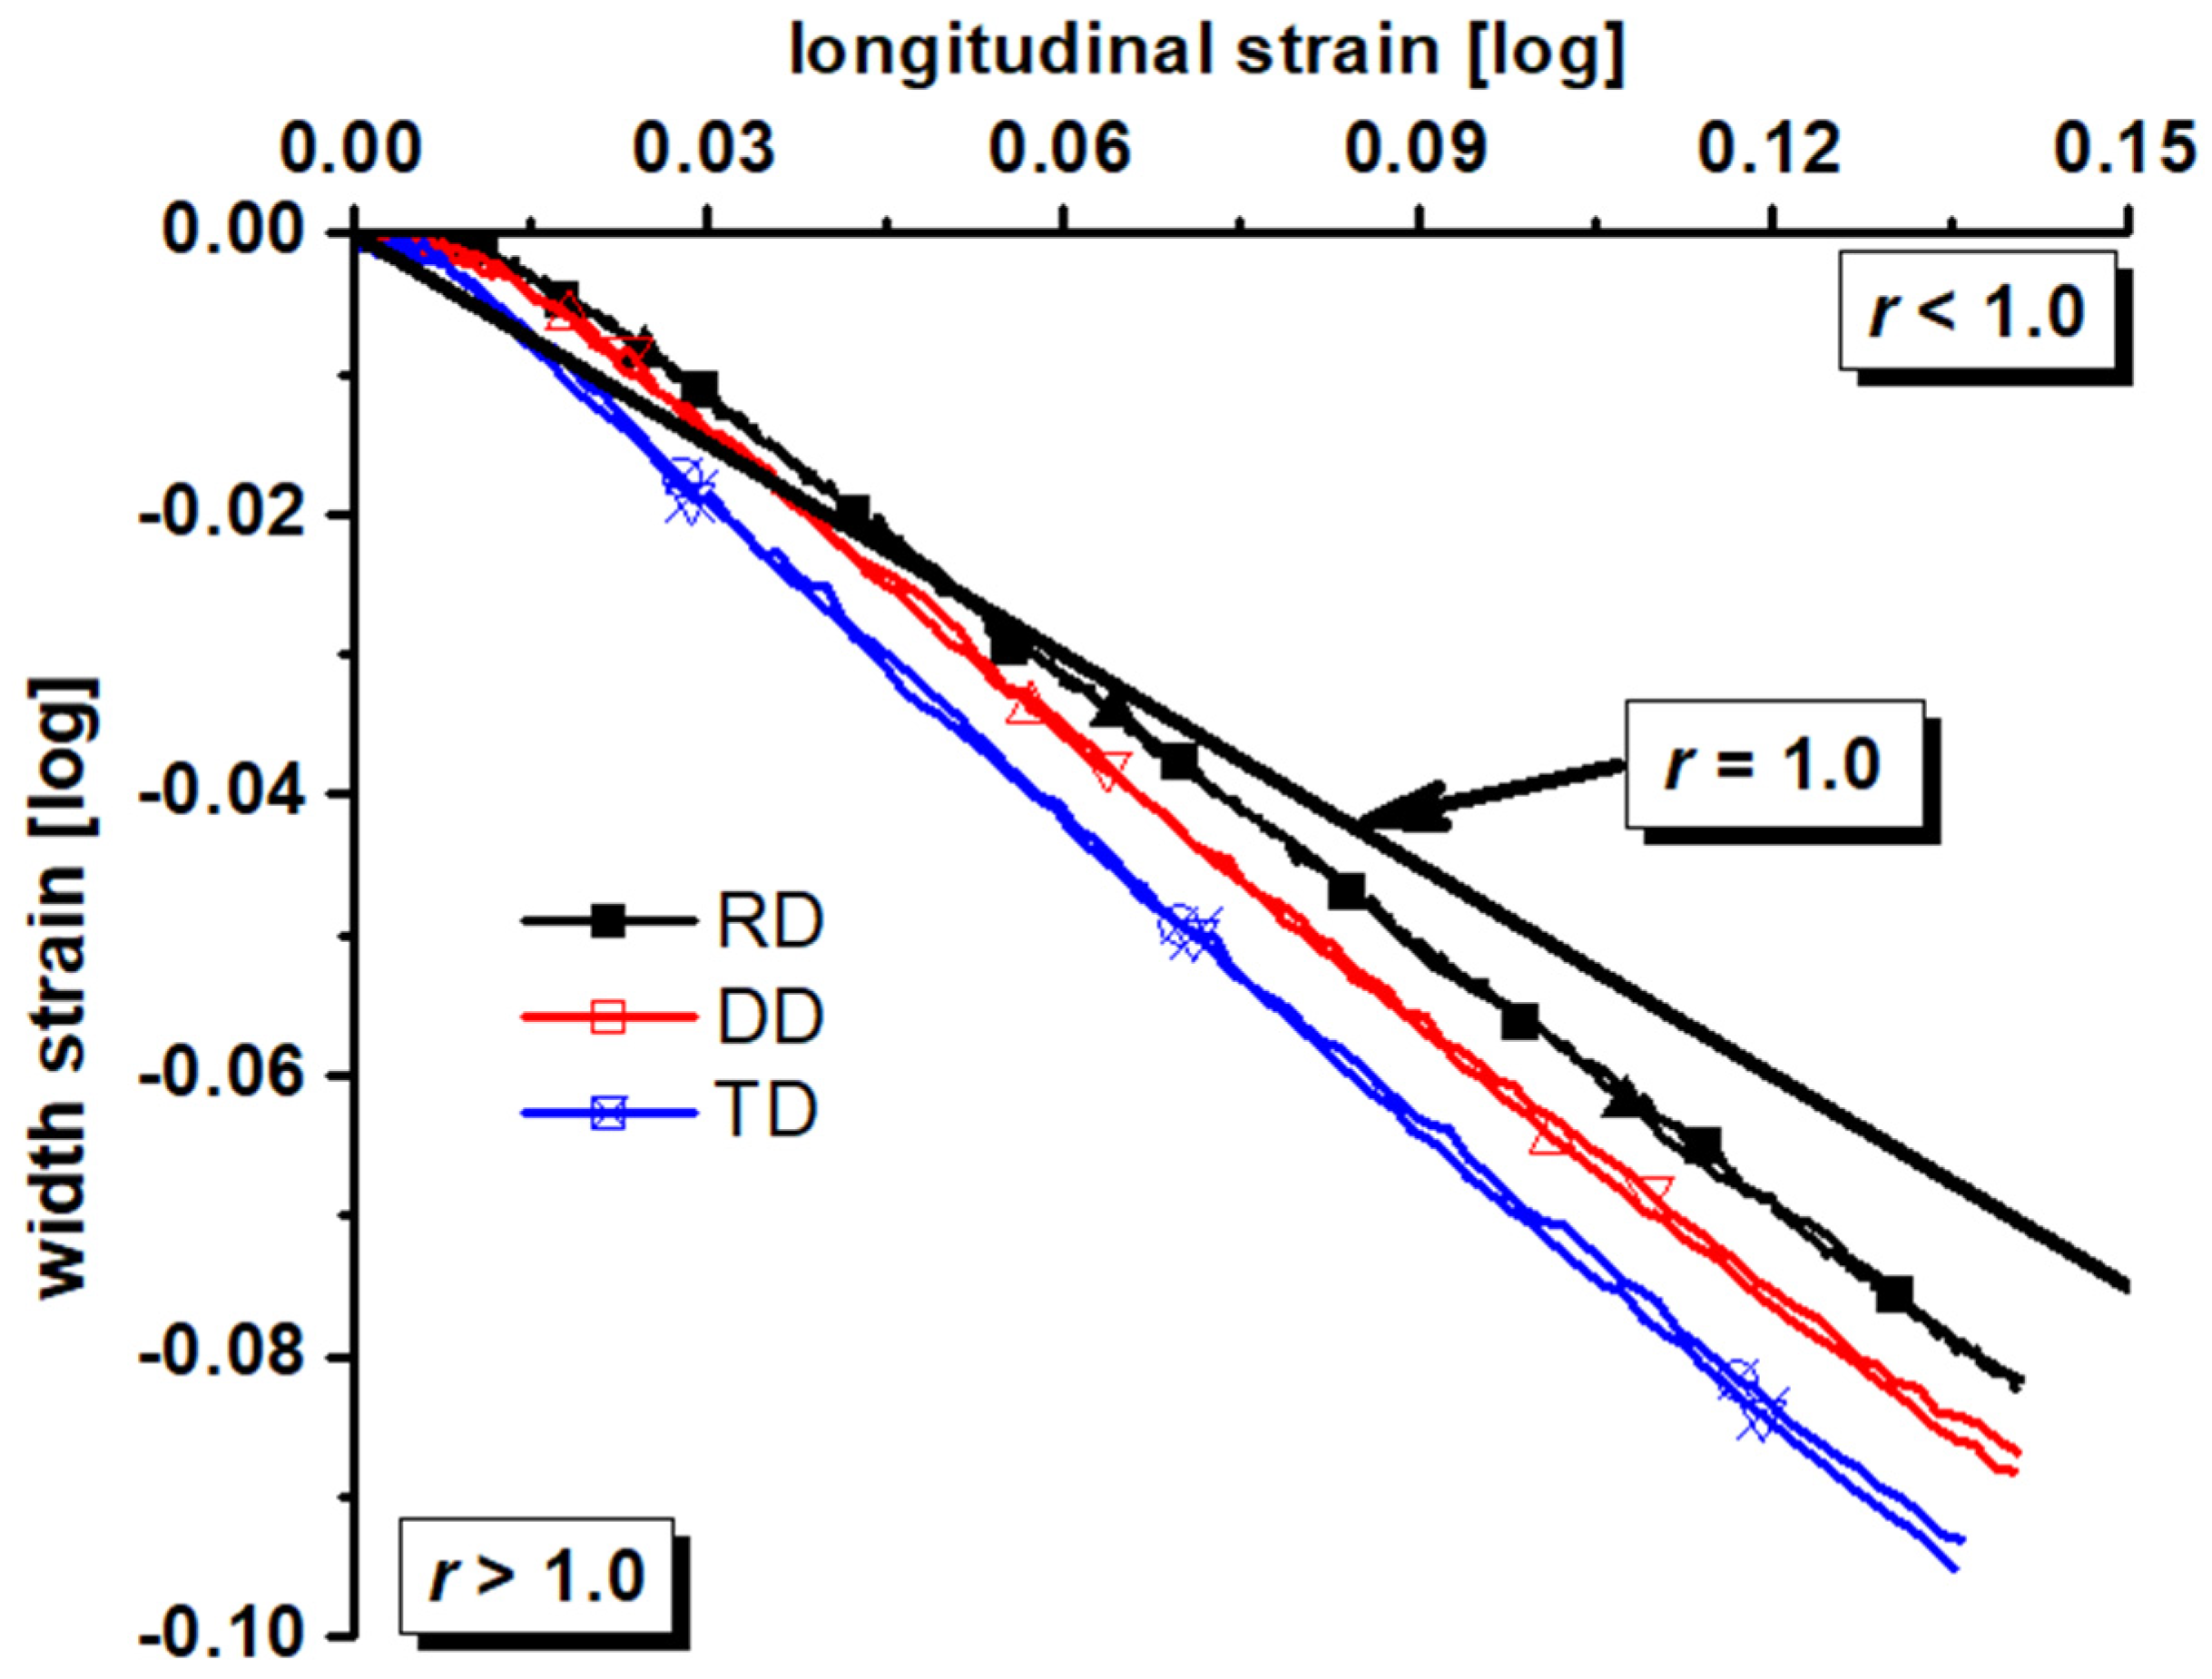
Materials and Experiments
3. Model and Method
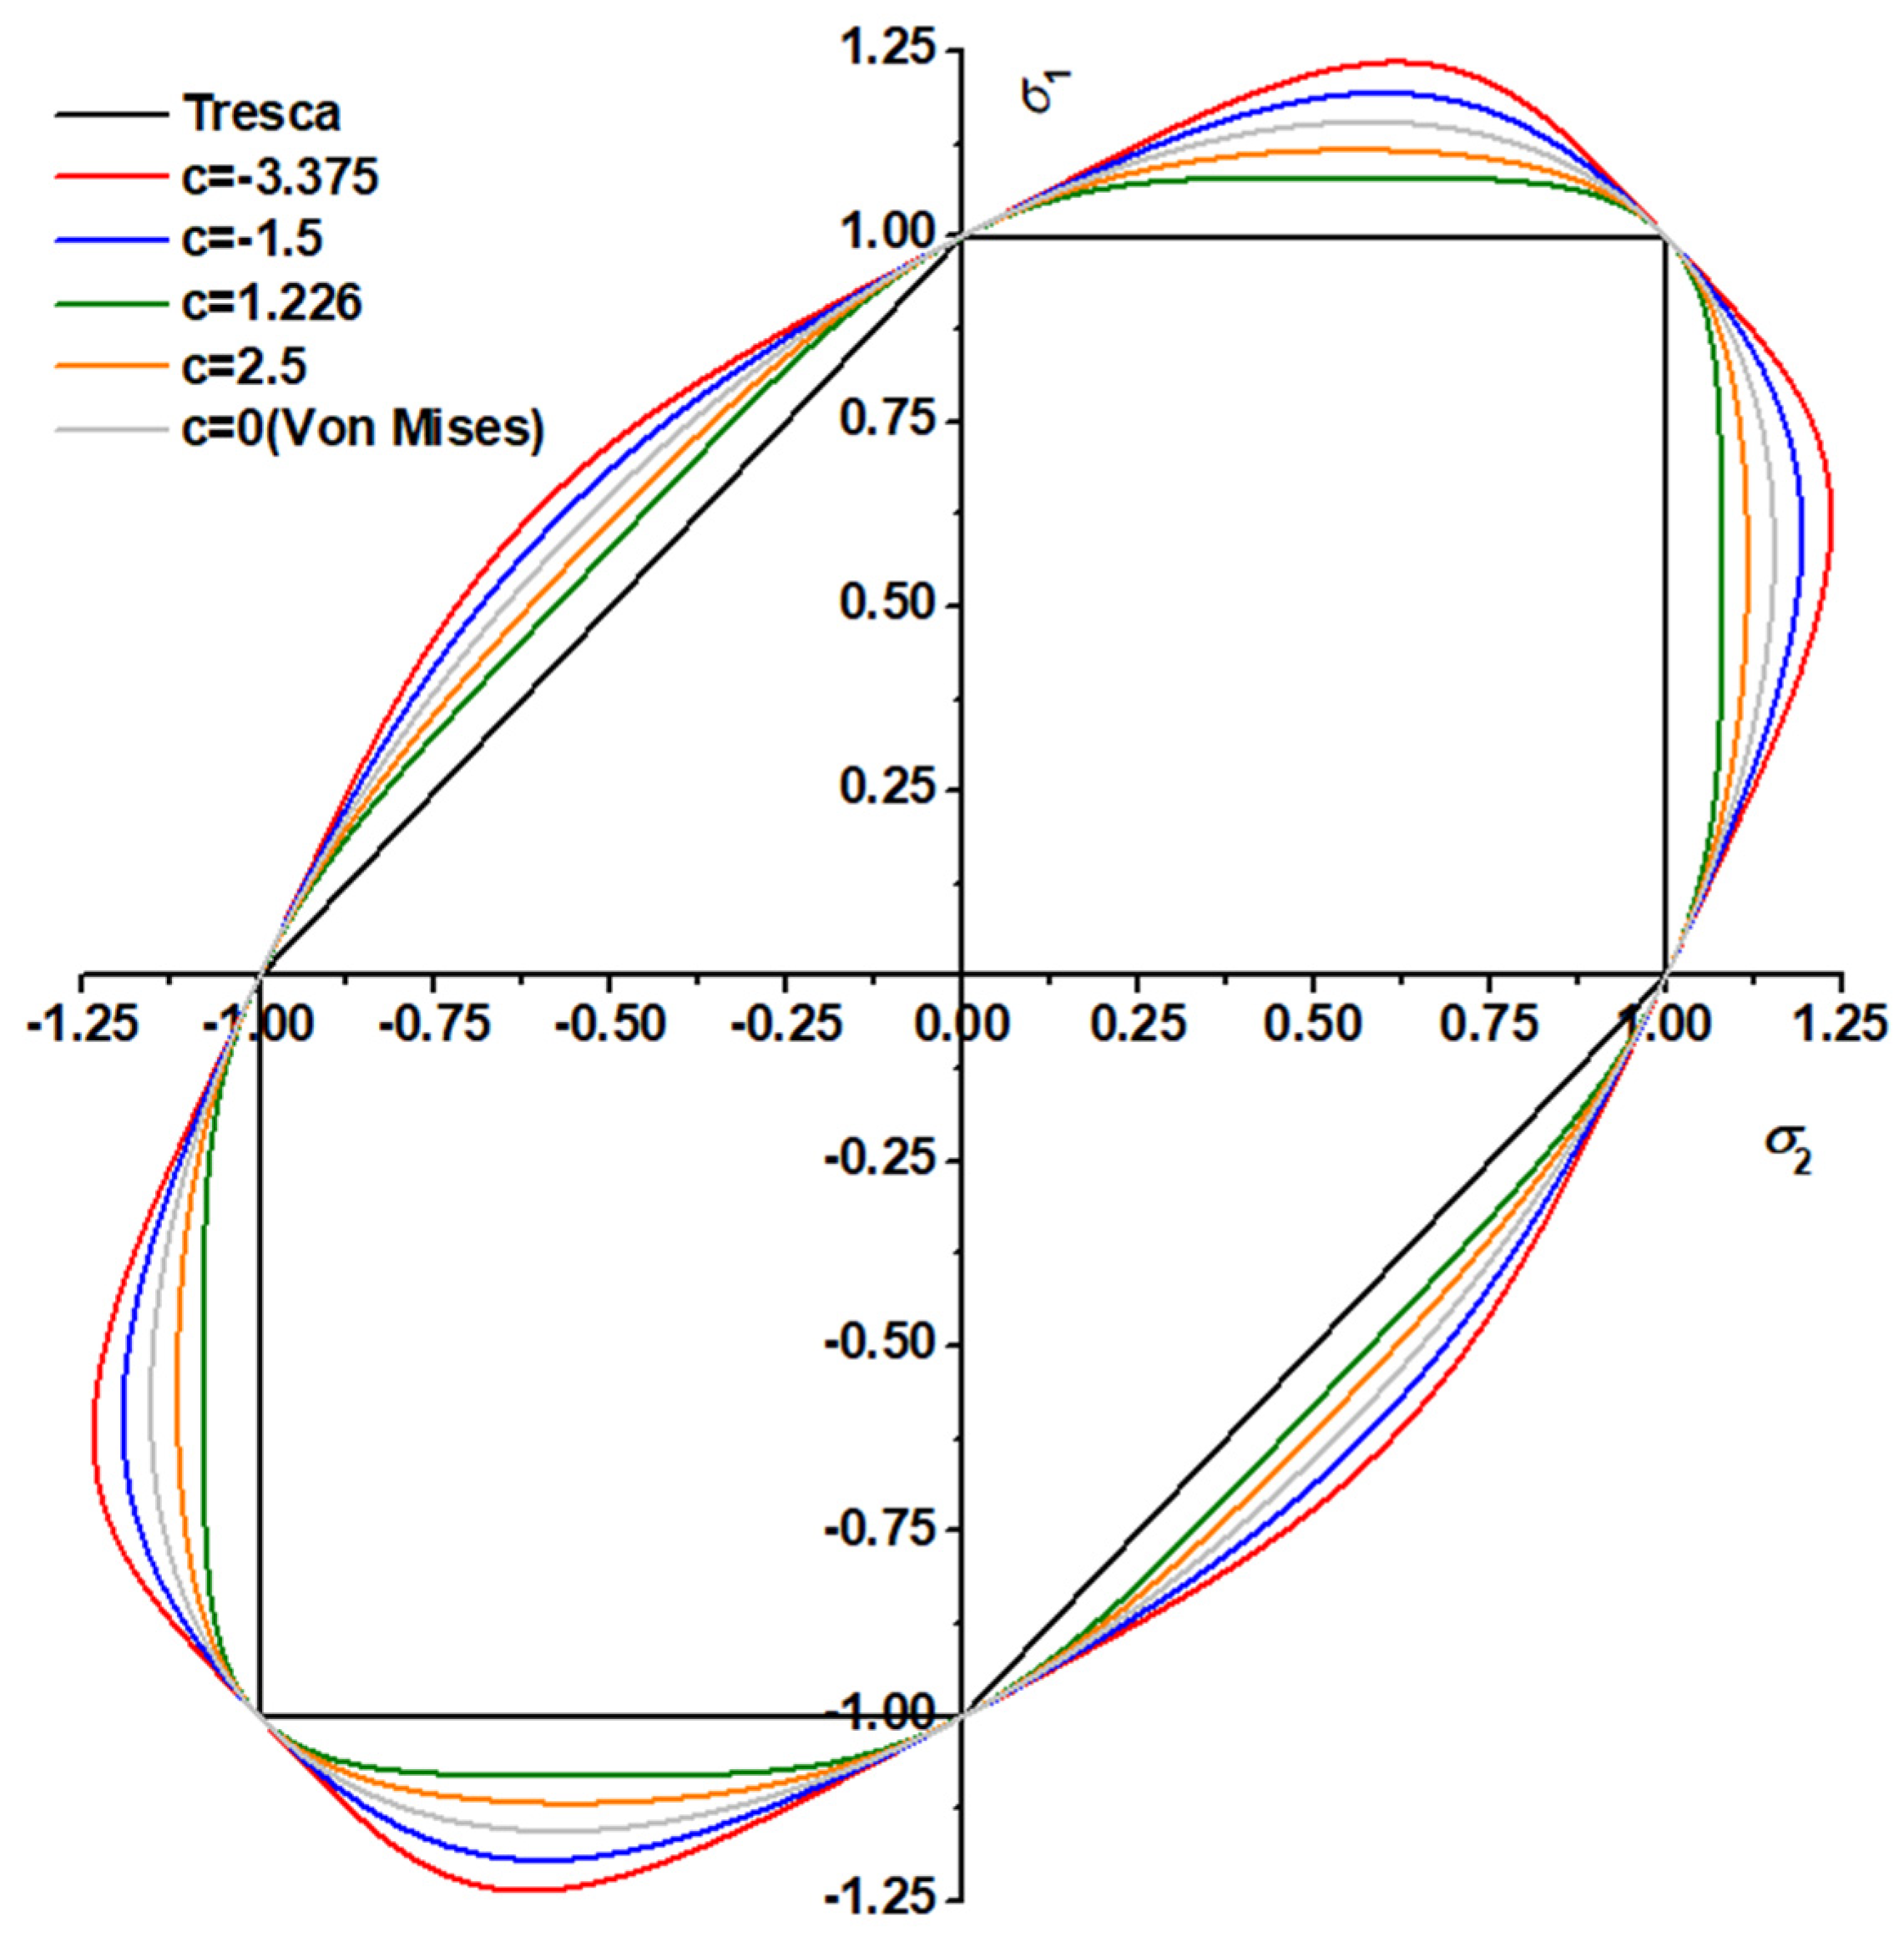
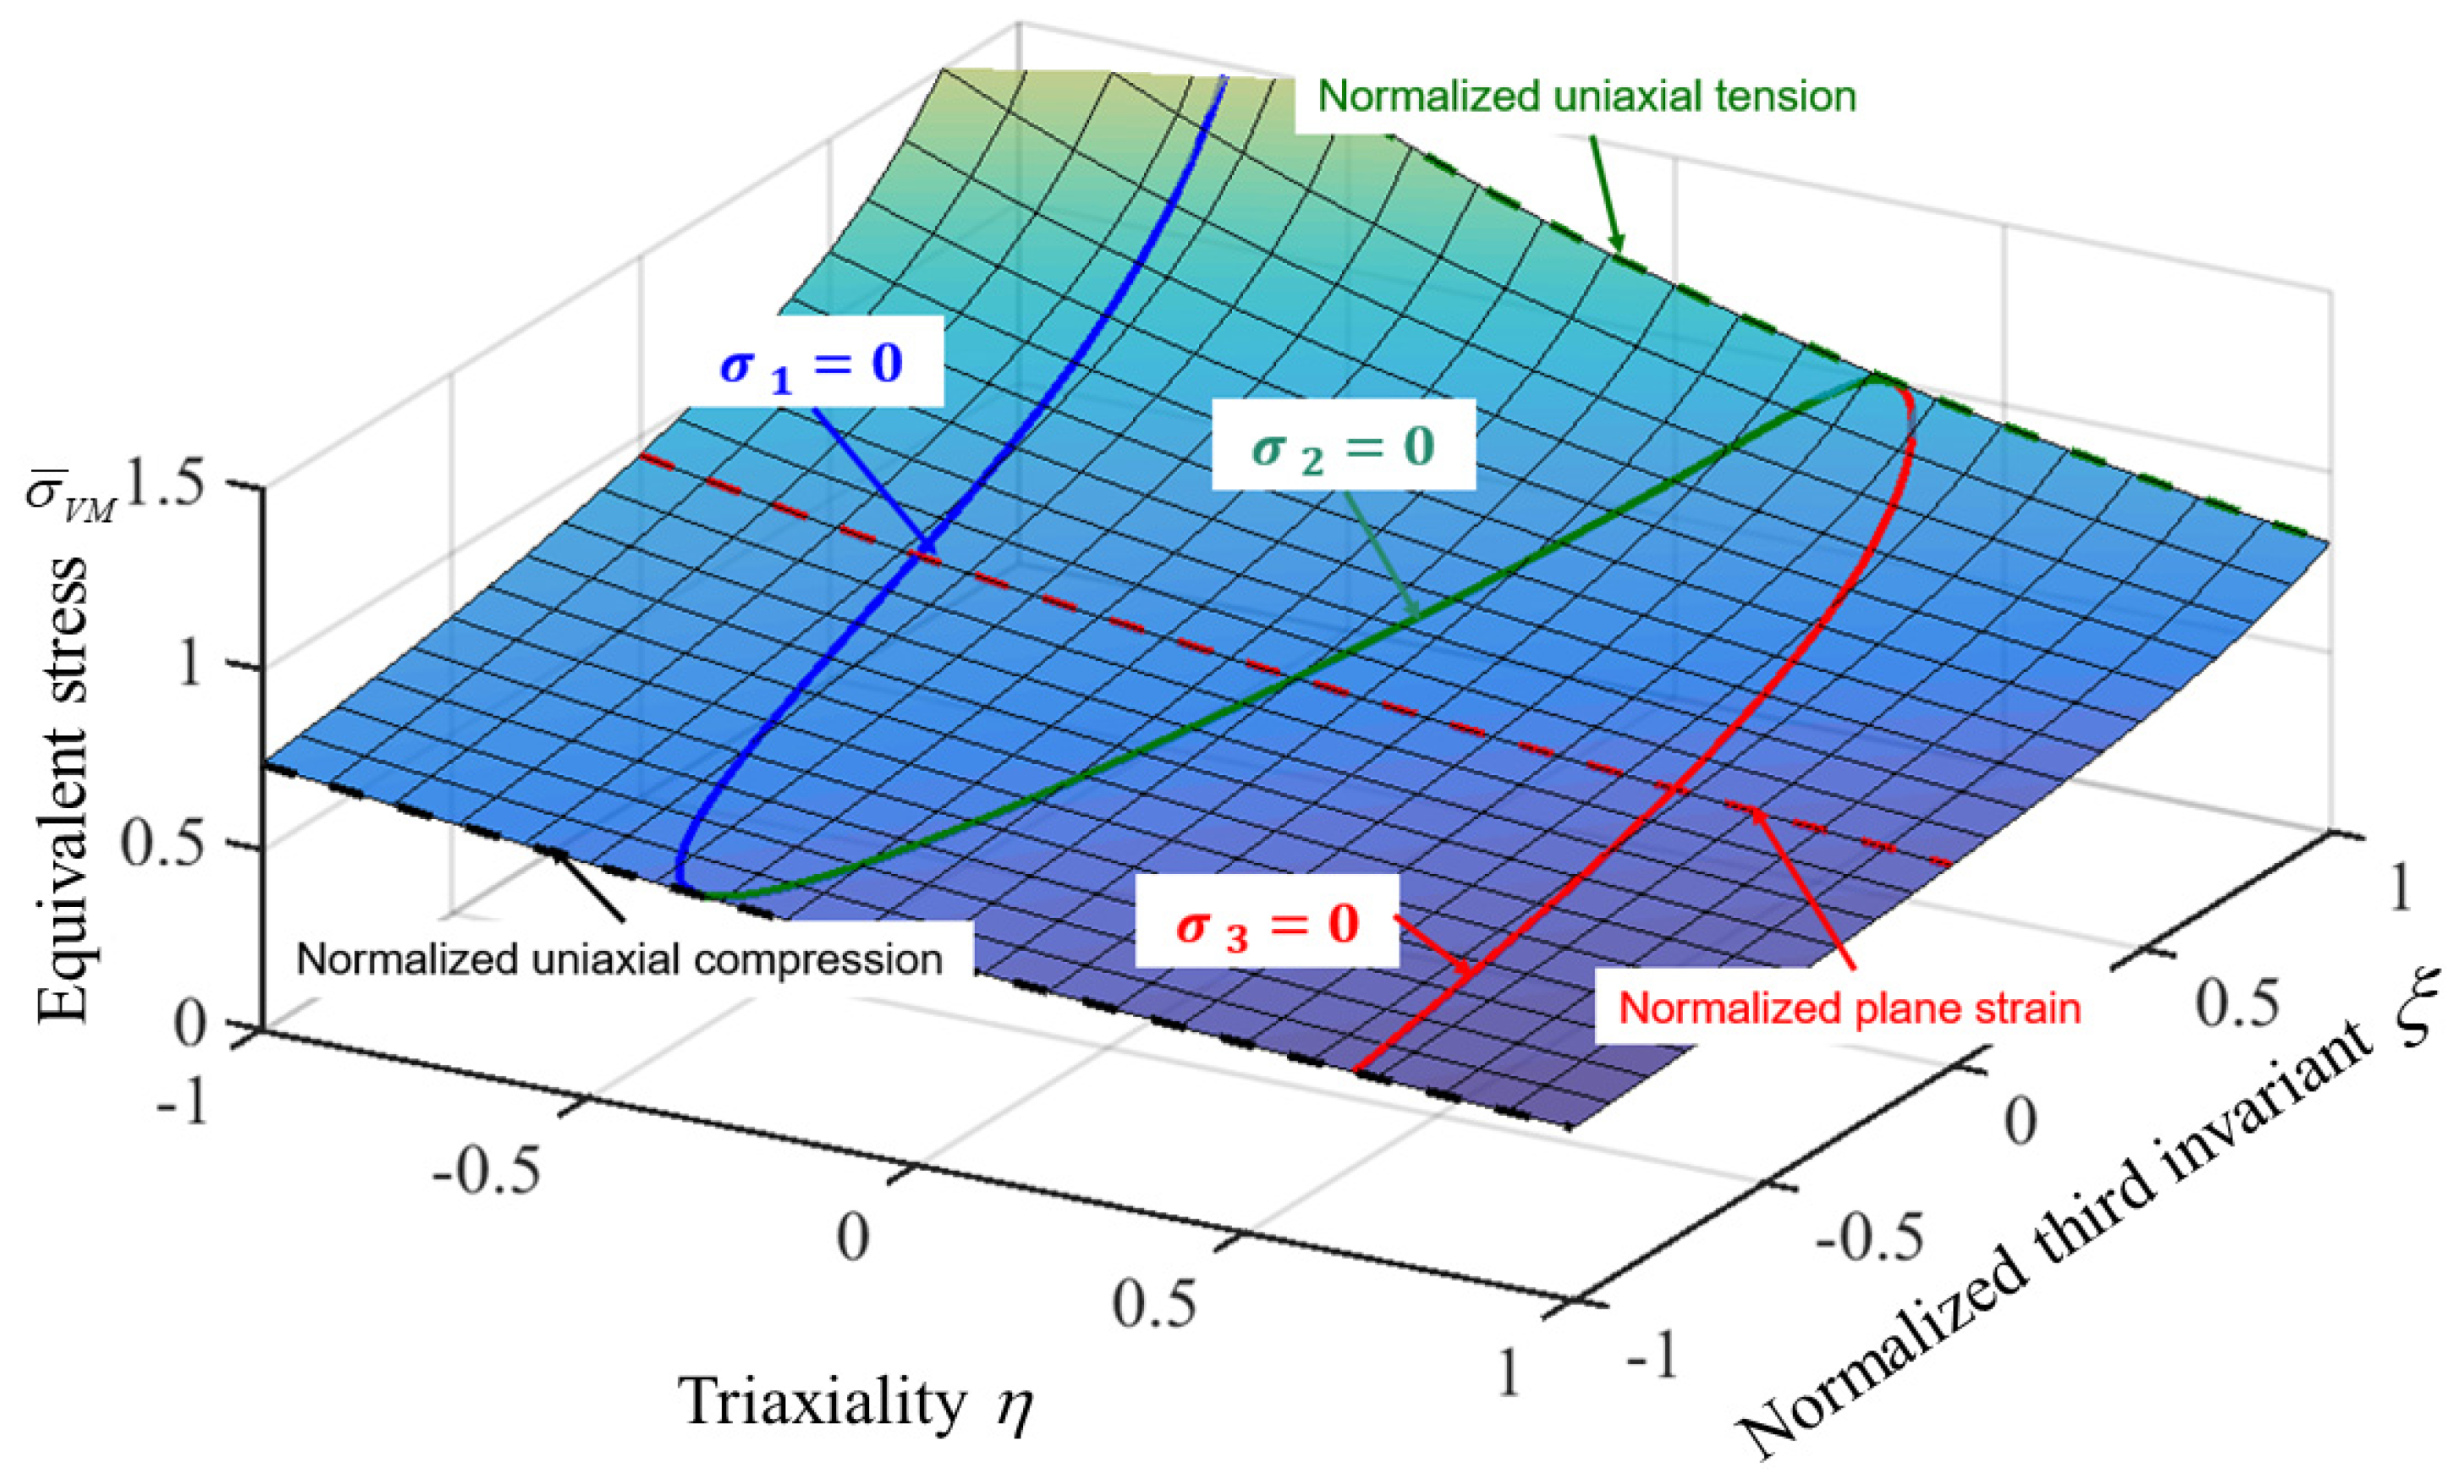
3.1. Pressure-Coupled Drucker Yield Function
3.2. Inverse Engineering
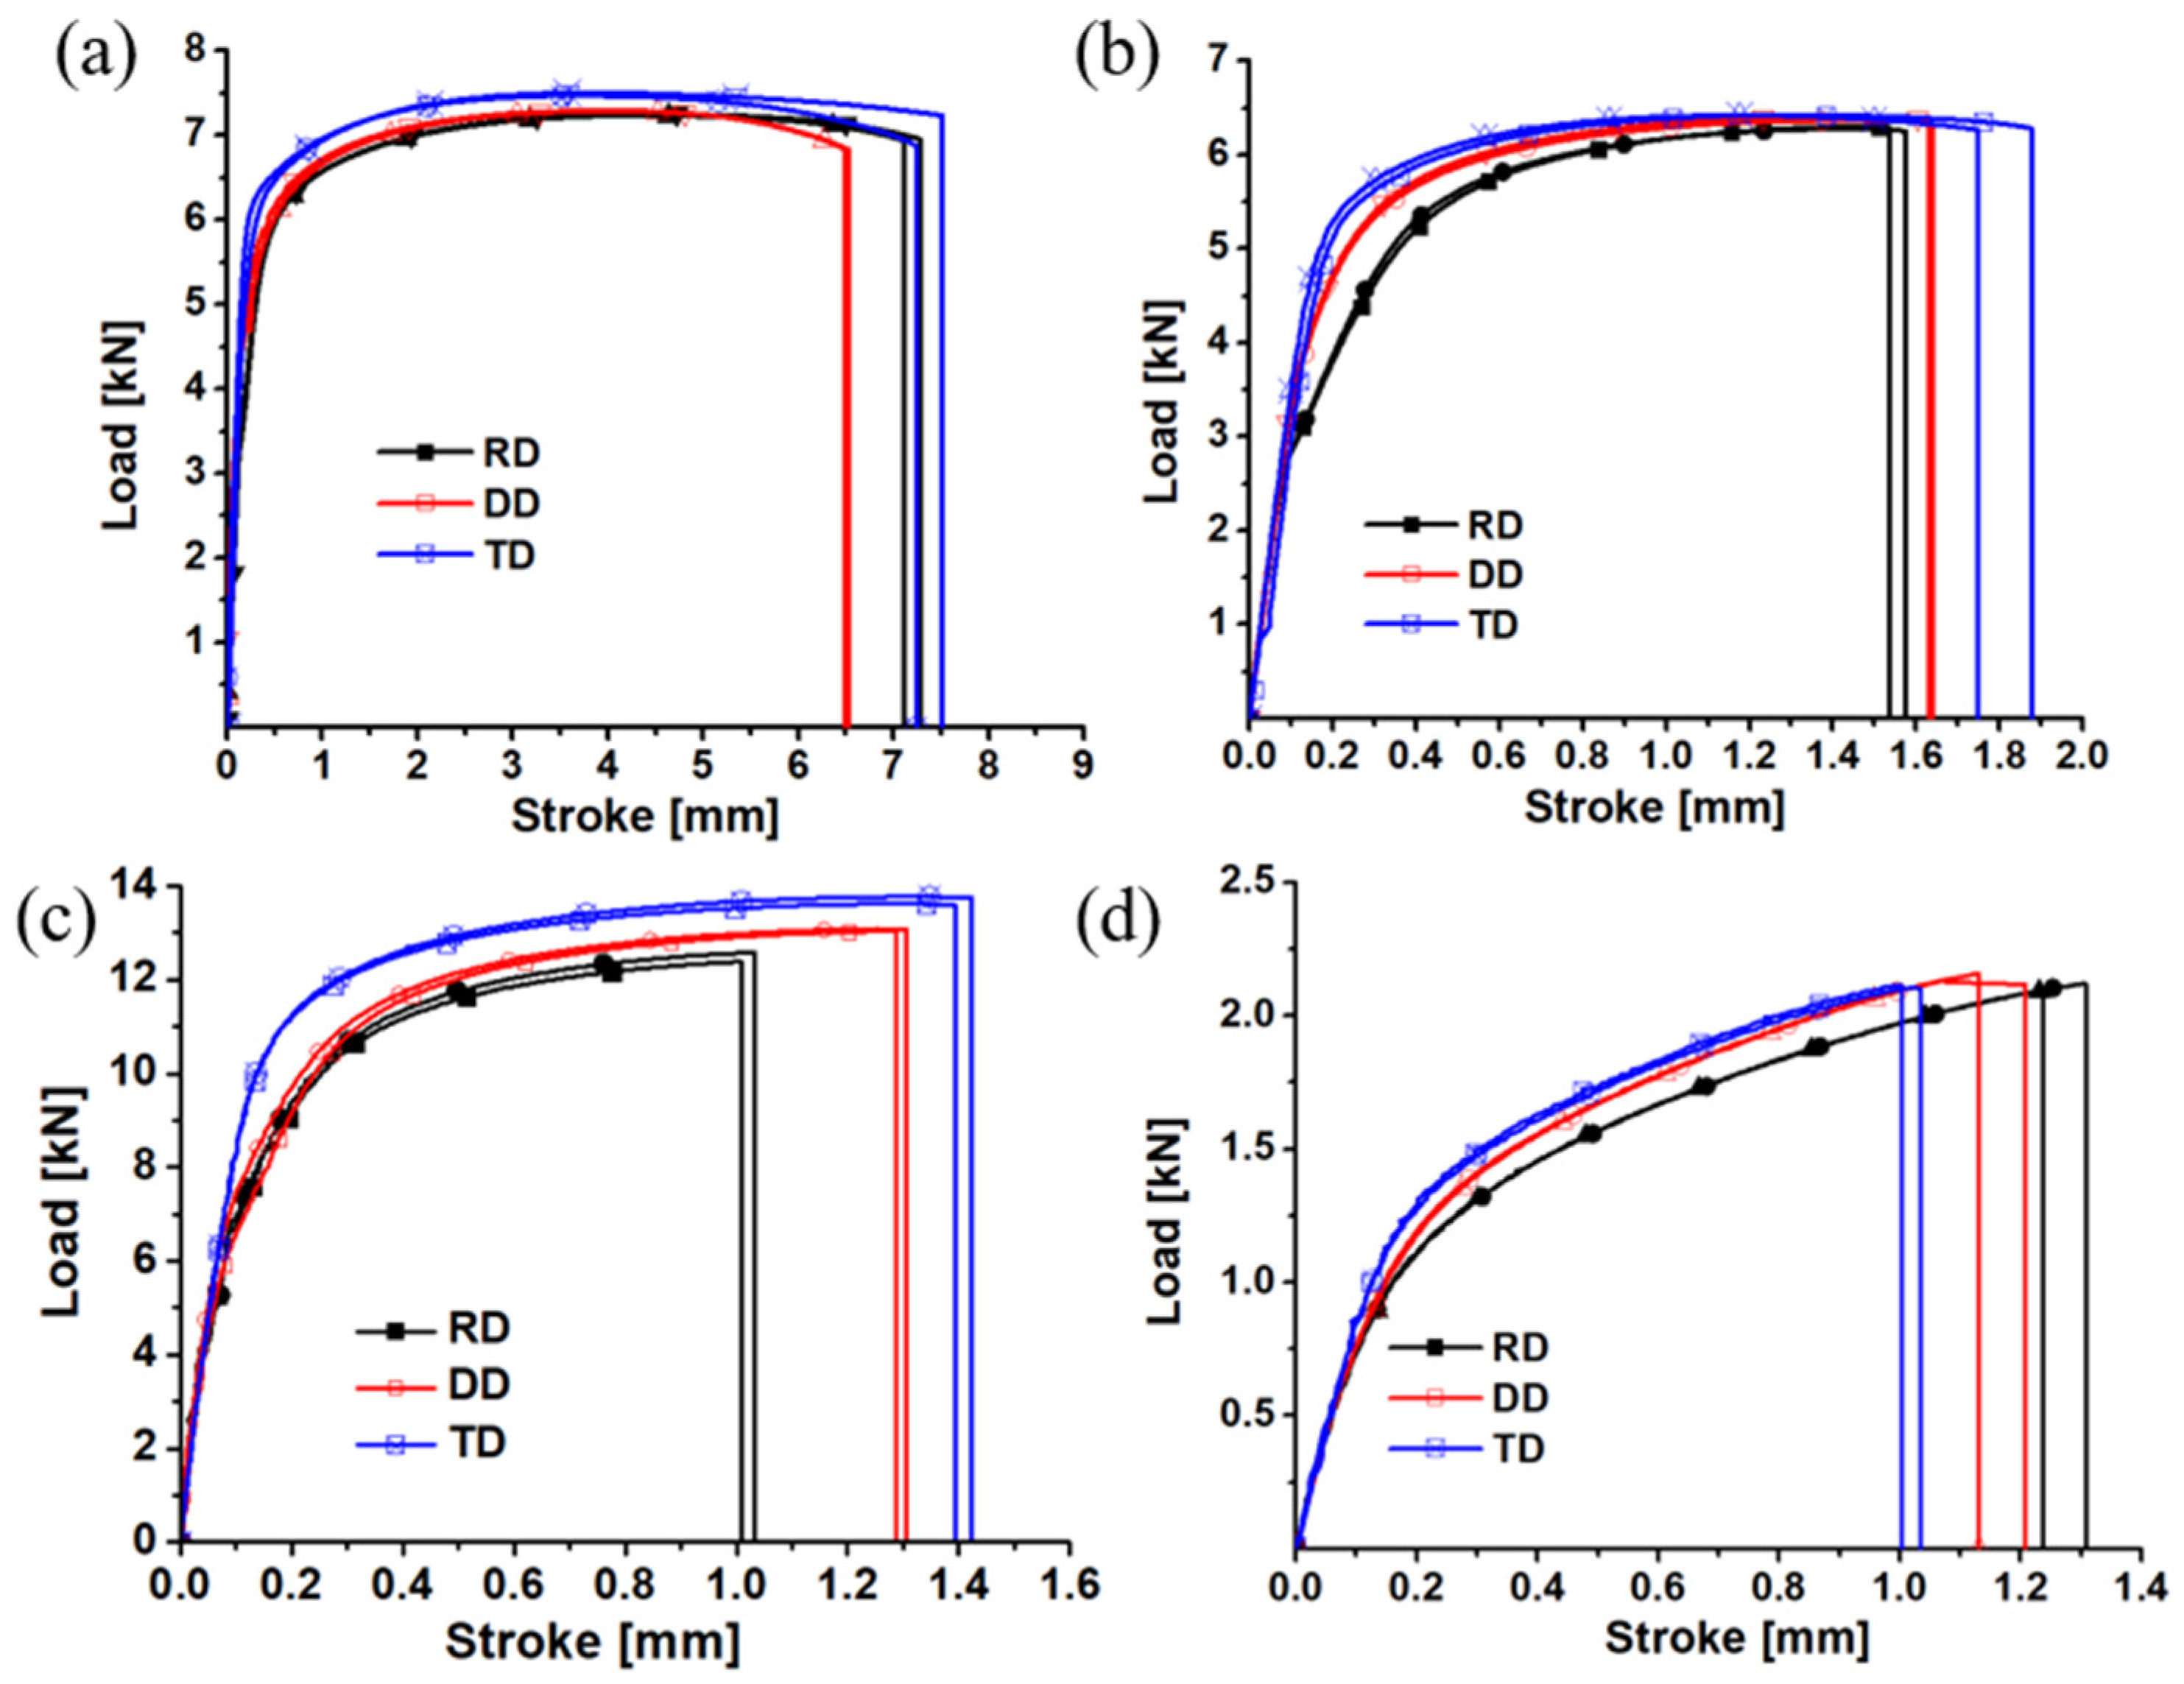
4. Comparison of the Predicted Load–Displacement Curves between Different Yield Functions
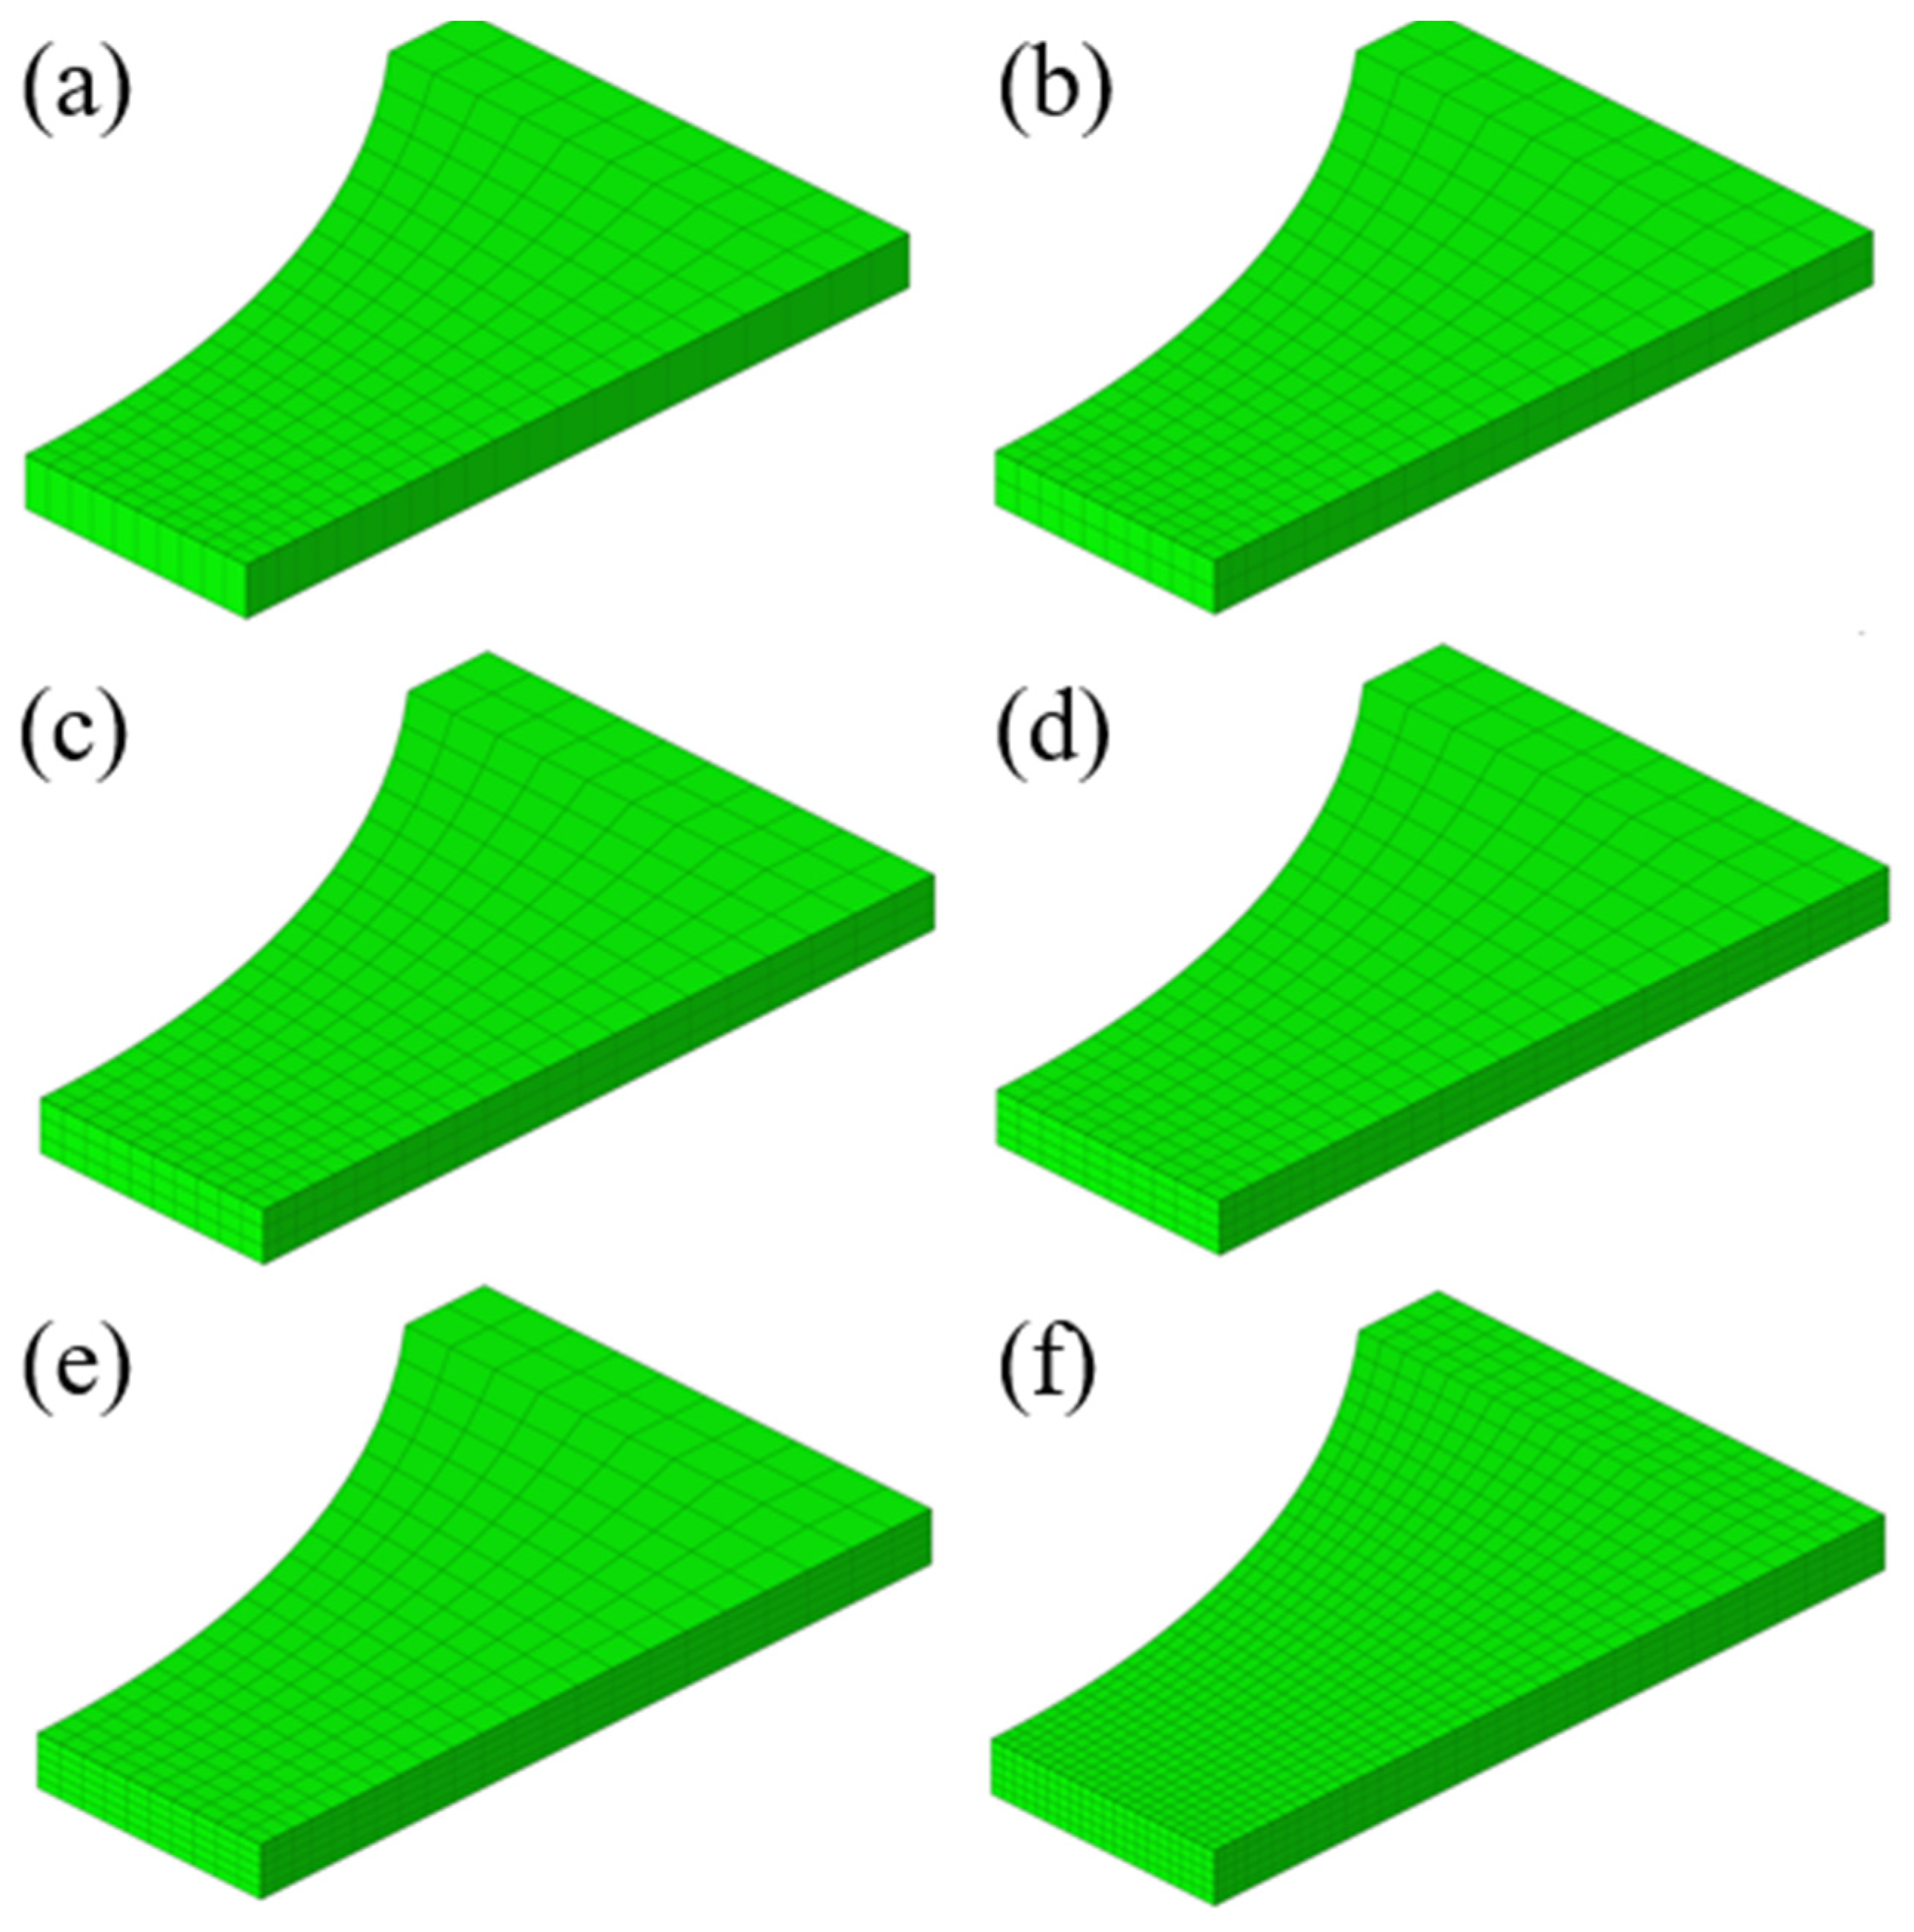
4.1. Mesh Sensitivity Analysis
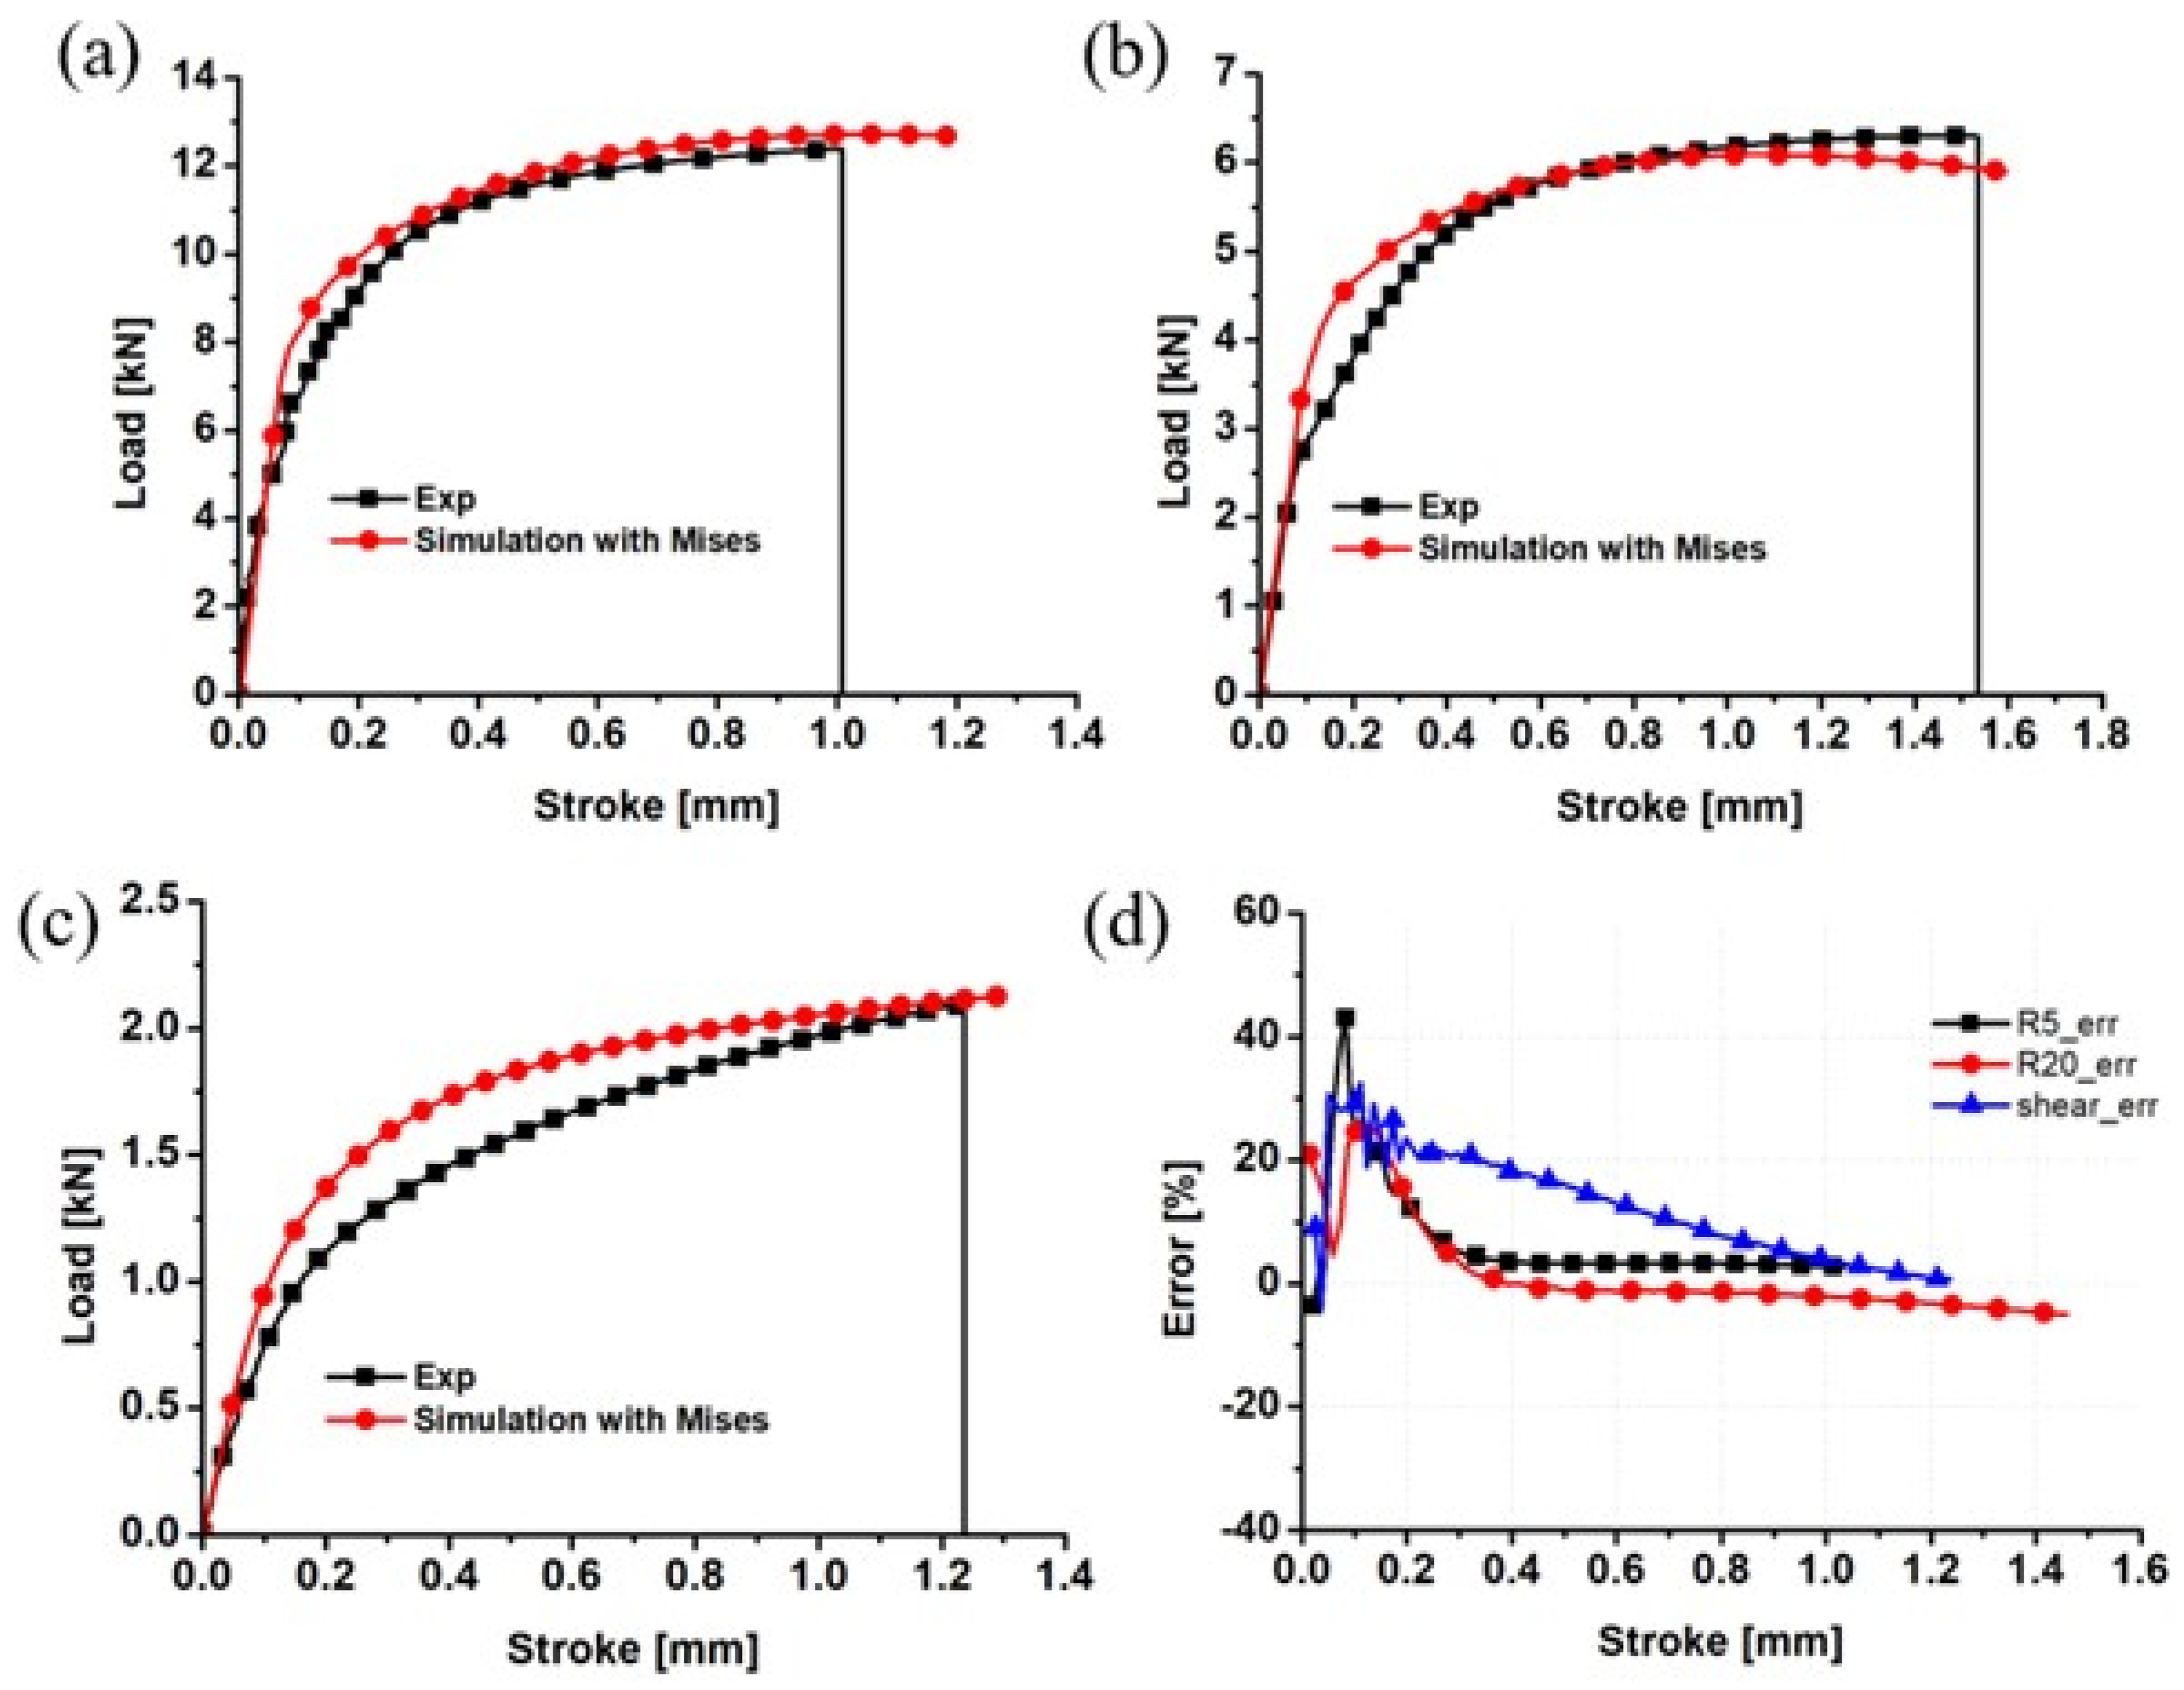
4.2. Von Mises Yield Function
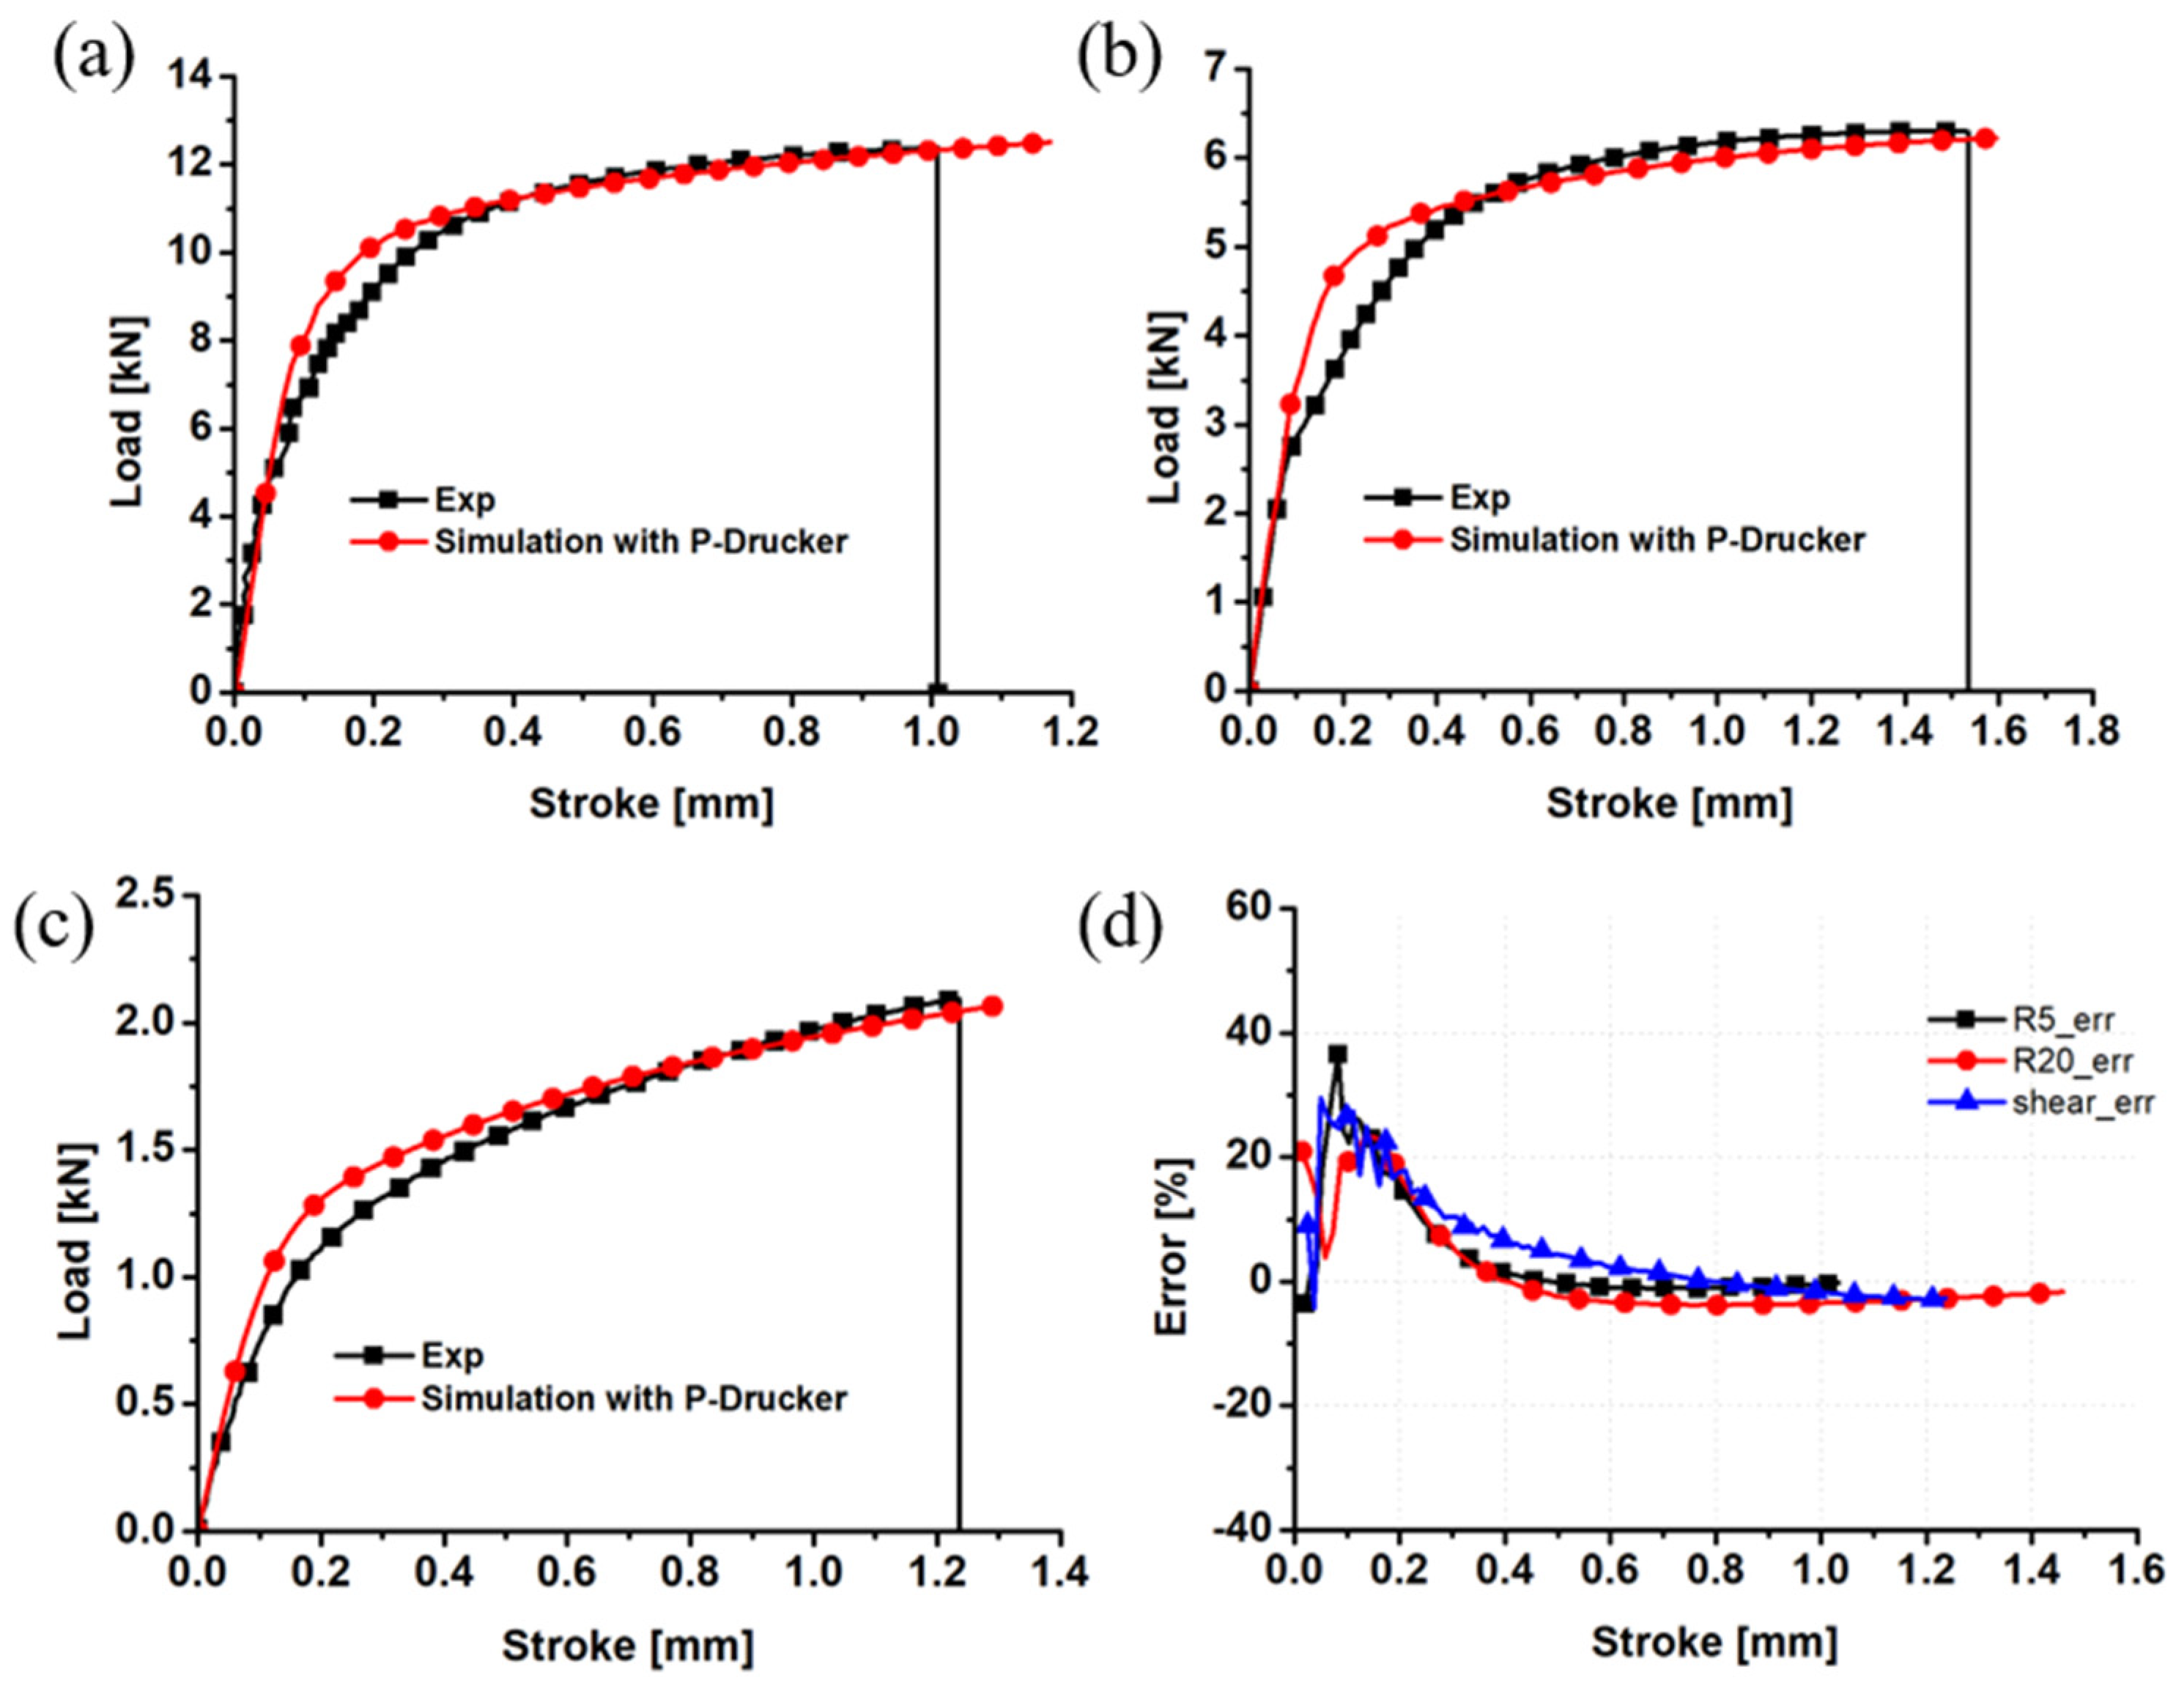
4.3. Pressure-Coupled Drucker Yield Function
5. Conclusions
Author Contributions
Funding
Institutional Review Board Statement
Informed Consent Statement
Data Availability Statement
Conflicts of Interest
References
- Hill, R. A theory of the yielding and plastic flow of anisotropic metals. Proc. R. Soc. A-Math Phys. Eng. Sci. 1948, 193, 281–297. [Google Scholar]
- Logan, R.W.; Hosford, W.F. Upper-bound anisotropic yield locus calculations assuming <111>-pencil glide. Int. J. Mech. Sci. 1980, 22, 419–430. [Google Scholar]
- Hosford, W.F. Comments on anisotropic yield criteria. Int. J. Mech. Sci. 1985, 27, 423–427. [Google Scholar] [CrossRef]
- Barlat, F.; Lege, D.J.; Brem, J.C. A six-component yield function for anisotropic materials. Int. J. Plast. 1991, 7, 693–712. [Google Scholar] [CrossRef]
- Barlat, F.; Brem, J.C.; Yoon, J.W.; Chung, K.; Dick, R.E.; Lege, D.J.; Pourboghrat, F.; Choi, S.H.; Chu, E. Plane stress yield function for aluminum alloy sheets-part 1: Theory. Int. J. Plast. 2003, 19, 1297–1319. [Google Scholar] [CrossRef]
- Barlat, F.; Aretz, H.; Yoon, J.W.; Karabin, M.E.; Brem, J.C.; Dick, R.E. Linear transfomation-based anisotropic yield functions. Int. J. Plast. 2005, 21, 1009–1039. [Google Scholar] [CrossRef]
- Cazacu, O.; Plunkett, B.; Barlat, F. Orthotropic yield criterion for hexagonal closed packed metals. Int. J. Plast. 2006, 22, 1171–1194. [Google Scholar] [CrossRef]
- Yoon, J.W.; Lou, Y.S.; Yoon, J.; Glazoff, M.V. Asymmetric yield function based on the stress invariants for pressure sensitive metals. Int. J. Plast. 2014, 56, 184–202. [Google Scholar] [CrossRef]
- Lou, Y.S.; Yoon, J.W. Anisotropic yield function based on stress invariants for BCC and FCC metals and its extension to ductile fracture criterion. Int. J. Plast. 2018, 101, 125–155. [Google Scholar] [CrossRef]
- Wang, S.C.; Shang, H.C.; Zhang, Z.; Lou, Y. Multi-scale numerical investigation of deep drawing of 6K21 aluminum alloy by crystal plasticity and a stress-invariant based anisotropic yield function under non-associated flow rule. J. Manuf. Process. 2023, 102, 736–755. [Google Scholar] [CrossRef]
- Lou, Y.S.; Zhang, S.; Yoon, J.W. Strength modeling of sheet metals from shear to plane strain tension. Int. J. Plast. 2020, 134, 102813. [Google Scholar] [CrossRef]
- Stoughton, T.B.; Yoon, J.W. Anisotropic hardening and non-associated flow in proportional loading of sheet metals. Int. J. Plast. 2009, 25, 1777–1817. [Google Scholar] [CrossRef]
- Lee, E.-H.; Stoughton, T.B.; Yoon, J.W. A yield criterion through coupling of quadratic and non-quadratic functions for anisotropic hardening with non-associated flow rule. Int. J. Plast. 2017, 99, 120–143. [Google Scholar] [CrossRef]
- Chen, Z.; Wang, Y.; Lou, Y.S. User-friendly anisotropic hardening function with non-associated flow rule under the proportional loadings for BCC and FCC metals. Mech. Mater. 2022, 165, 104190. [Google Scholar] [CrossRef]
- Gao, X.; Wang, S.; XU, Z.; Zhou, J.; Wan, X.; Rayhan, H.M.A.; Lou, Y.S. Plastic Evolution Characterization for 304 Stainless Steel by CQN ChenModel under the Proportional Loading. Materials 2023, 16, 6828. [Google Scholar] [CrossRef]
- Hou, Y.; Min, J.Y.; Lin, J.P.; Lee, M.G. Modeling stress anisotropy, strength differential, and anisotropic hardening by coupling quadratic and stress-invariant-based yield functions under non-associated flow rule. Mech. Mater. 2022, 174, 104458. [Google Scholar] [CrossRef]
- Hu, Q.; Yoon, J.W.; Manopulo, N.; Hora, P. A coupled yield criterion for anisotropic hardening with analytical description under associated flow rule: Modeling and validation. Int. J. Plast. 2021, 36, 102882. [Google Scholar] [CrossRef]
- Wu, P.; Lou, Y.S.; Chen, Q.; Ning, H. Modeling of temperature- and stress state-dependent yield and fracture behaviors for Mg-Gd-Y alloy. Int. J. Mech. Sci. 2022, 229, 107506. [Google Scholar] [CrossRef]
- Cazacu, O.; Barlat, F. A criterion for description of anisotropy and yield differential effects in pressure-insensitive metals. Int. J. Plast. 2004, 20, 2027–2045. [Google Scholar] [CrossRef]
- Lou, Y.S.; Zhang, C.; Zhang, S.; Yoon, J.W. A general yield function with differential and anisotropic hardening for strength modelling under various stress states with non-associated flow rule. Int. J. Plast. 2022, 158, 103414. [Google Scholar] [CrossRef]
- Lou, Y.S.; Zhang, C.; Wu, P.; Yoon, J.W. New geometry-inspired numerical convex analysis method for yield functions under isotropic and anisotropic hardenings. Int. J. Solids Struct. 2024, 286–287, 112582. [Google Scholar] [CrossRef]
- Hou, Y.; Du, K.; El-Aty, A.A.; Lee, M.G.; Min, J.Y. Plastic anisotropy of sheet metals under plane strain loading: A novel non-associated constitutive model based on fourth-order polynomial functions. Mater. Des. 2022, 223, 111187. [Google Scholar] [CrossRef]
- Zhang, C.; Lou, Y.S. Characterization and modelling of evolving plasticity behaviour up to fracture for FCC and BCC metals. J. Mater. Process. Technol. 2023, 317, 117997. [Google Scholar] [CrossRef]
- Hu, Q.; Yoon, J.W.; Chen, J. Analytically described polynomial yield criterion by considering both plane strain and pure shear states. Int. J. Plast. 2023, 162, 103514. [Google Scholar] [CrossRef]
- Lou, Y.S.; Yoon, J.W. Lode-dependent anisotropic-asymmetric yield function for isotropic and anisotropic hardening of pressure-insensitive materials. Part I: Quadratic function under non-associated flos invariant-based anw rule. Int. J. Plast. 2023, 166, 103647. [Google Scholar] [CrossRef]
- Bassini, E.; Marchese, G.; Sivo, A.; Martelli, P.A.; Gullino, A.; Ugues, D. Effect of Cold Rolling on Microstructural and Mechanical Properties of a Dual-Phase Steel for Automotive Field. Materials 2022, 15, 7482. [Google Scholar] [CrossRef]
- Baral, M.; Ha, J.; Korkolis, Y.P. Plasticity and ductile fracture modeling of an Al–Si–Mg die-cast alloy. Int. J. Fract. 2019, 216, 101–121. [Google Scholar] [CrossRef]
- Ha, J.; Fones, J.; Kinsey, B.L.; Korkolis, Y.P. Plasticity and Formability of Annealed, Commercially-Pure Aluminum: Experiments and Modeling. Materials 2020, 13, 4285. [Google Scholar] [CrossRef]
- Allen, R.M.; Toth, L.S.; Oppedal, A.L.; Kadiri, H.E. Crystal Plasticity Modeling of Anisotropic Hardening and Texture Due to Dislocation Transmutation in Twinning. Materials 2018, 11, 1855. [Google Scholar] [CrossRef]
- Imandoust, A.; Barrett, C.D.; Al-Samman, T.; Inal, K.A.; Kadiri, H.E. A review on the effect of rare-earth elements on texture evolution during processing of magnesium alloys. J. Mater. Sci. 2017, 52, 1–29. [Google Scholar] [CrossRef]
- Ha, J.; Baral, M.; Korkolis, Y.P. Plastic anisotropy and ductile fracture of bake-hardened AA6013 aluminum sheet. Int. J. Solids Struct. 2019, 155, 123–139. [Google Scholar] [CrossRef]
- Knysh, P.; Korkolis, Y.P. Identification of the post-necking hardening response of rate- and temperature-dependent metals. Int. J. Solids Struct. 2017, 115–116, 149–160. [Google Scholar] [CrossRef]
- Proust, G.; Tomé, C.; Kaschner, G. Modeling texture, twinning and hardening evolution during deformation of hexagonal materials. Acta Mater. 2007, 55, 2137–2148. [Google Scholar] [CrossRef]
- Dick, C.P.; Korkolis, Y.P. Anisotropy of thin-walled tubes by a new method of combined tension and shear loading. Int. J. Plast. 2015, 71, 87–112. [Google Scholar] [CrossRef]
- Lou, Y.S.; Wu, P.; Zhang, C.; Wang, J.Z.; Li, X.Y.; Chai, R.G.; Yoon, J.W. A stress-based shear fracture criterion considering the effect of stress triaxiality and Lode parameter. Int. J. Solids Struct. 2022, 256, 111993. [Google Scholar] [CrossRef]
- Wu, P.; Zhang, C.; Lou, Y.S. Two-component DF2016 criterion to characterize the fracture behavior of magnesium rare-earth alloys. Theor. Appl. Fract. Mech. 2023, 127, 103677. [Google Scholar] [CrossRef]
- Shang, H.C.; Wang, S.C.; Zhou, L.C.; Lou, Y.S. Neural network-based ductile fracture model for 5182-O aluminum alloy considering electroplastic effect in electrically-assisted processing. Eng. Fract. Mech. 2023, 290, 109476. [Google Scholar] [CrossRef]
- Wu, P.; Zhang, C.; Lou, Y.S.; Chen, Q.; Ning, H.Q. Constitutive relationship and characterization of fracture behavior for WE43 alloy under various stress states. Trans. Nonferr. Met. Soc. 2023, 33, 438–453. [Google Scholar] [CrossRef]


| 0.443 GPa | 1.406 × 10⁻⁴ | 0.136 | 0.321 GPa | 0.1777 GPa | 43.079 |
| 0.443 | 1.406 × 10⁻⁴ | 0.136 | 0.321 | 0.178 | 43.079 | 0.5 |
| 0.443 | 1.406 × 10⁻⁴ | 0.136 | 0.321 | 0.178 | 43.079 | 0.584 |
| 0.443 | 1.406 × 10⁻⁴ | 0.136 | 0.321 | 0.178 | 43.079 | 1.608 |
Disclaimer/Publisher’s Note: The statements, opinions and data contained in all publications are solely those of the individual author(s) and contributor(s) and not of MDPI and/or the editor(s). MDPI and/or the editor(s) disclaim responsibility for any injury to people or property resulting from any ideas, methods, instructions or products referred to in the content. |
© 2024 by the authors. Licensee MDPI, Basel, Switzerland. This article is an open access article distributed under the terms and conditions of the Creative Commons Attribution (CC BY) license (https://creativecommons.org/licenses/by/4.0/).
Share and Cite
You, J.; Liu, J.; Zhou, C.; Gao, W.; Yao, Y. Anisotropic Hardening and Plastic Evolution Characterization on the Pressure-Coupled Drucker Yield Function of ZK61M Magnesium Alloy. Materials 2024, 17, 1150. https://doi.org/10.3390/ma17051150
You J, Liu J, Zhou C, Gao W, Yao Y. Anisotropic Hardening and Plastic Evolution Characterization on the Pressure-Coupled Drucker Yield Function of ZK61M Magnesium Alloy. Materials. 2024; 17(5):1150. https://doi.org/10.3390/ma17051150
Chicago/Turabian StyleYou, Jianwei, Jiangnan Liu, Can Zhou, Wei Gao, and Yuhong Yao. 2024. "Anisotropic Hardening and Plastic Evolution Characterization on the Pressure-Coupled Drucker Yield Function of ZK61M Magnesium Alloy" Materials 17, no. 5: 1150. https://doi.org/10.3390/ma17051150
APA StyleYou, J., Liu, J., Zhou, C., Gao, W., & Yao, Y. (2024). Anisotropic Hardening and Plastic Evolution Characterization on the Pressure-Coupled Drucker Yield Function of ZK61M Magnesium Alloy. Materials, 17(5), 1150. https://doi.org/10.3390/ma17051150