
Corrosion of Stainless Steel in Simulated Nuclear Reactor Primary Coolant—Experiments and Modeling


Abstract
1. Introduction
2. Materials and Methods
3. Results
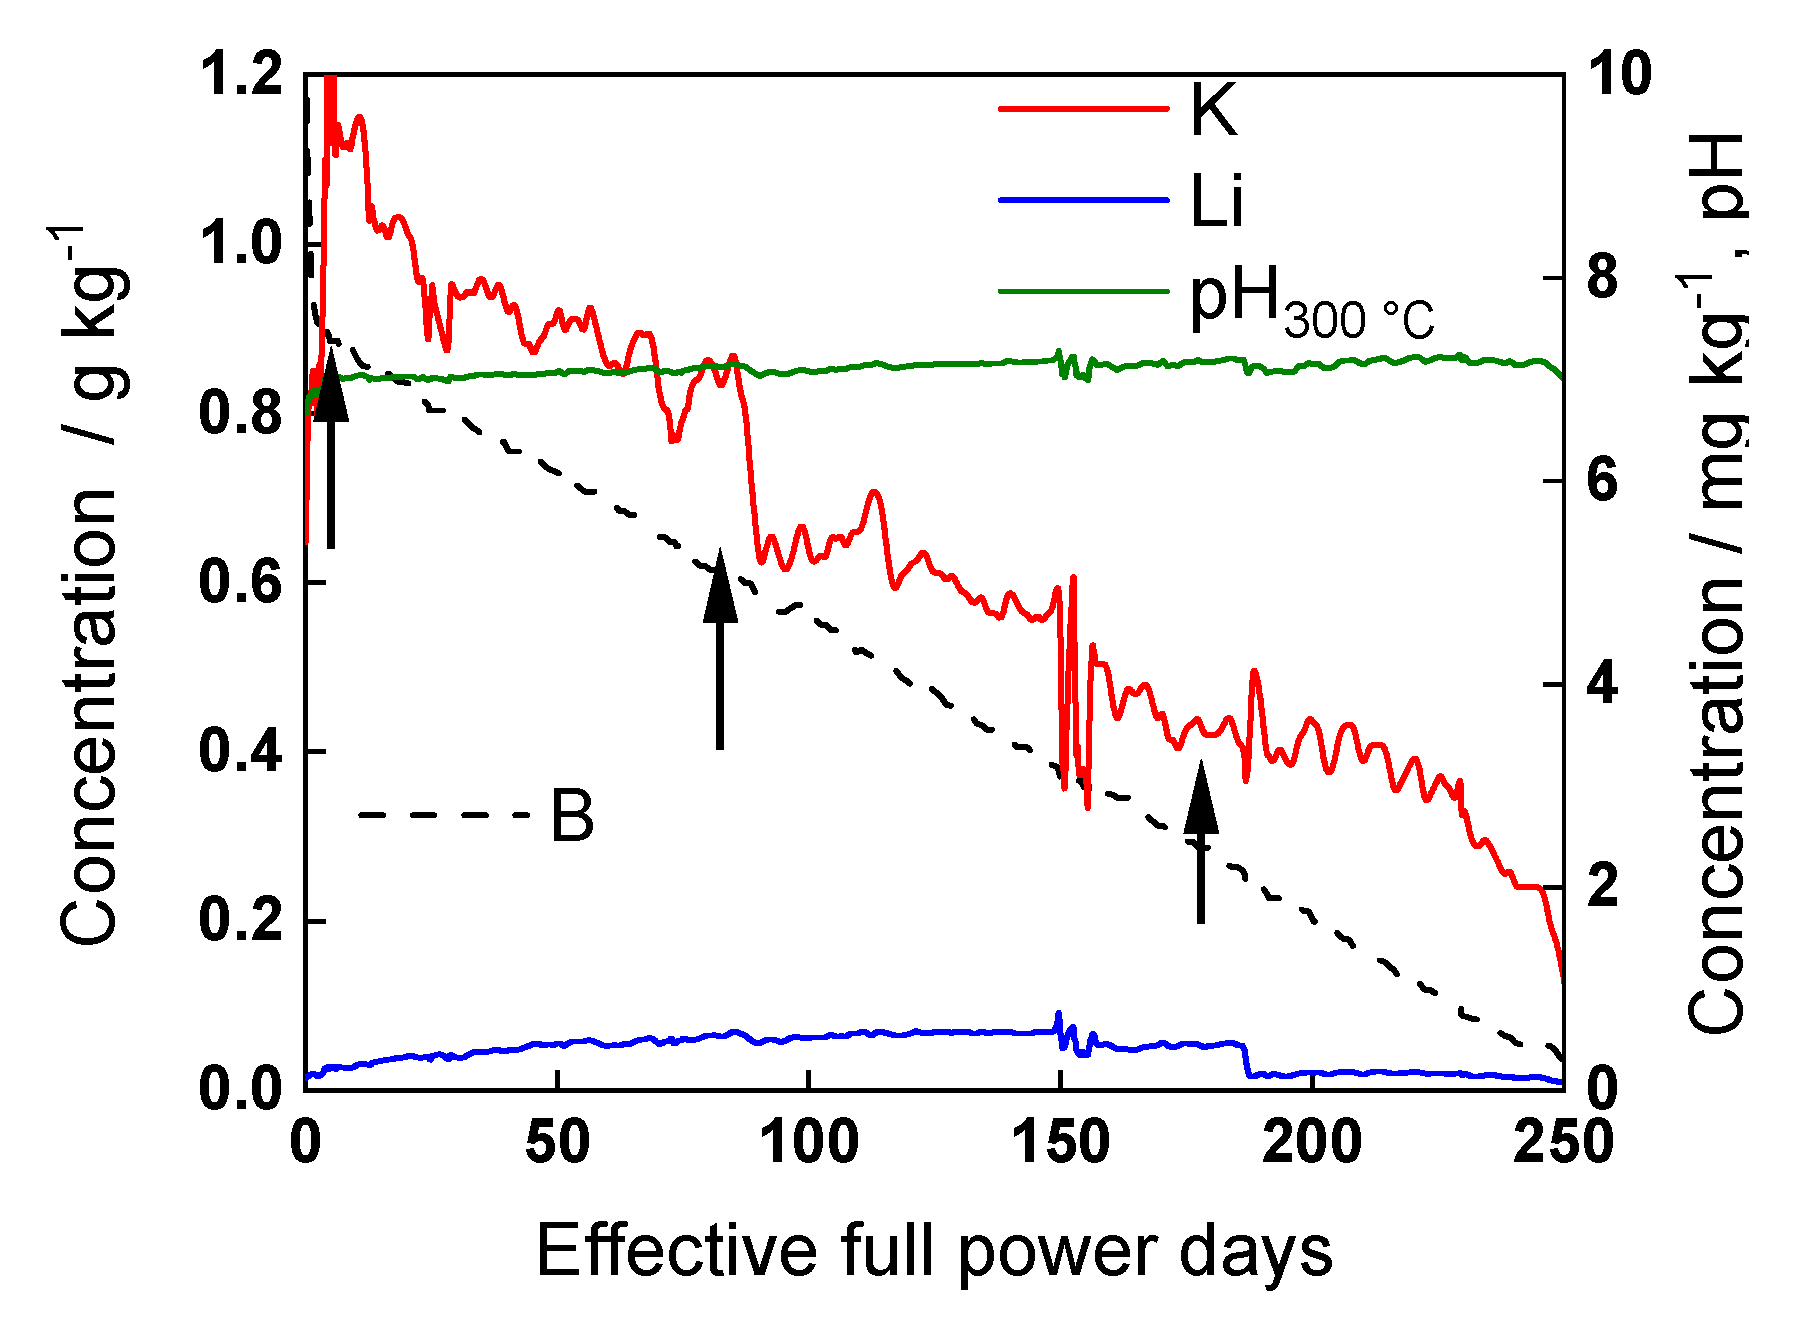
3.1. Corrosion Potential with Time
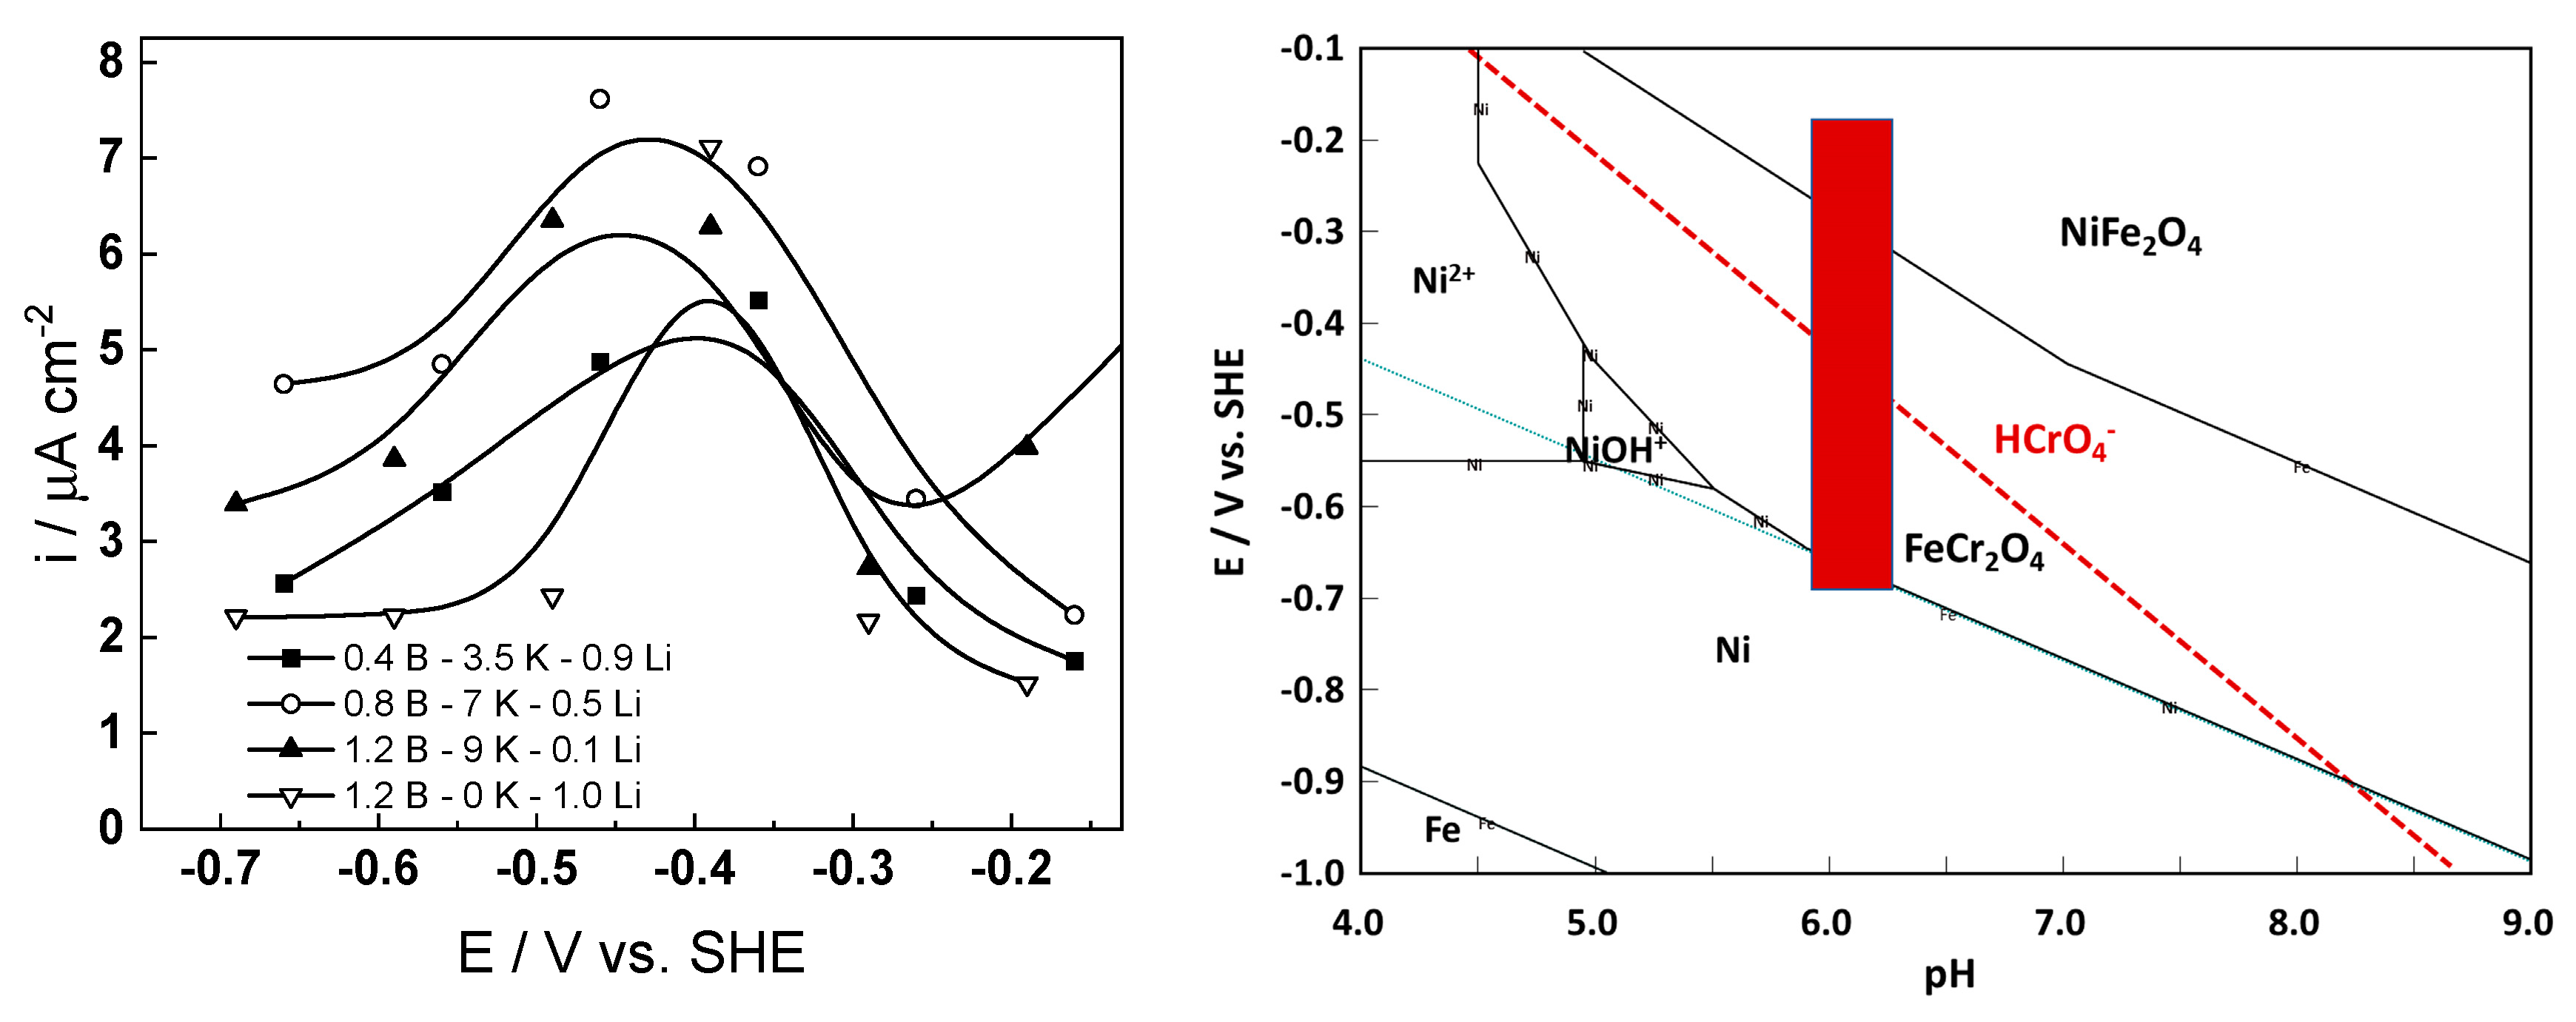
3.2. Current vs. Potential Curves
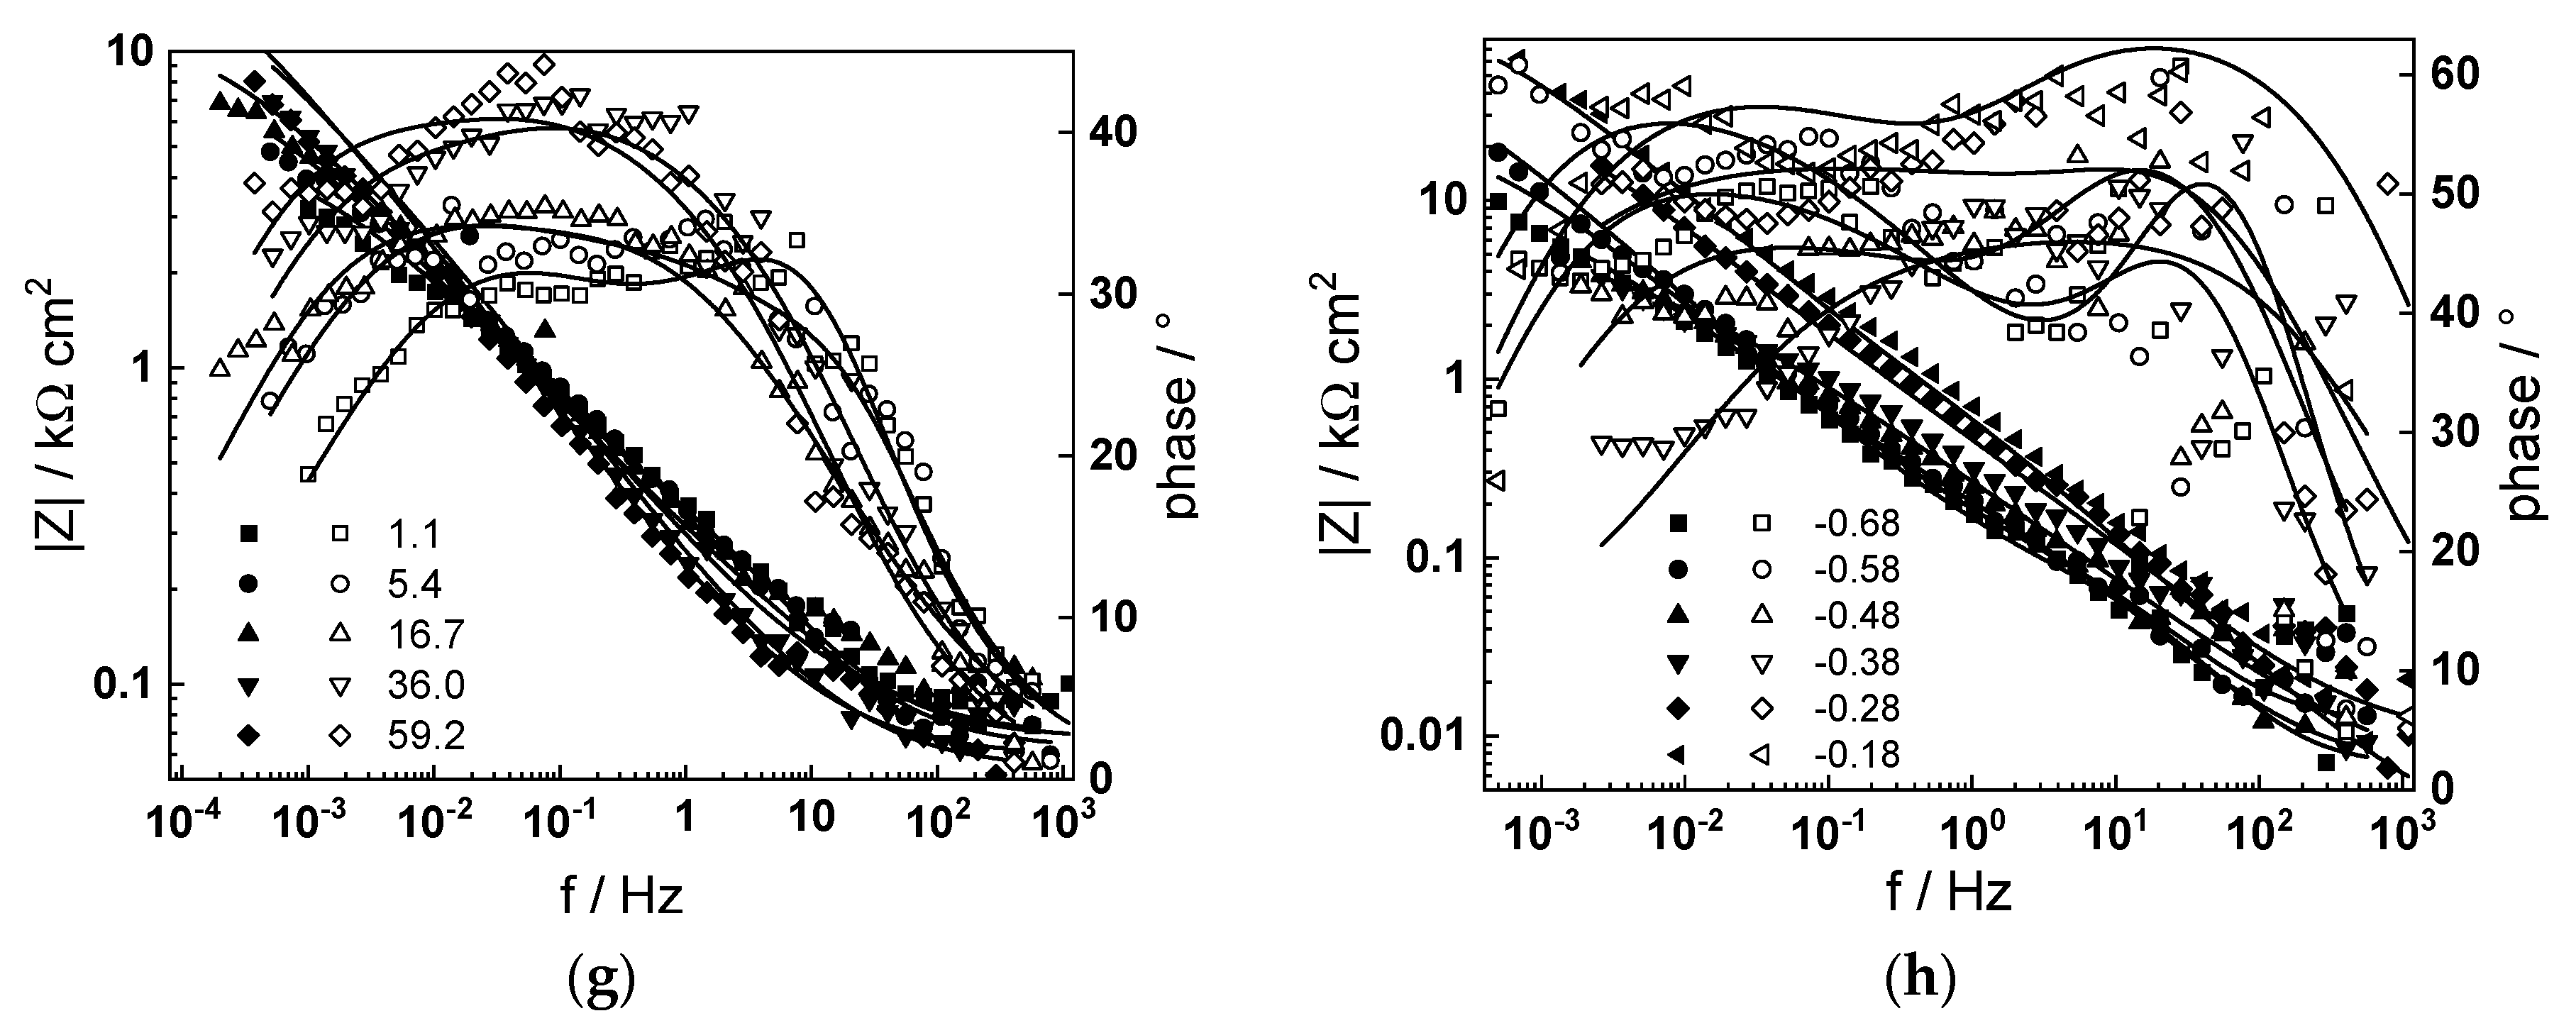
3.3. Electrochemical Impedance Spectroscopy
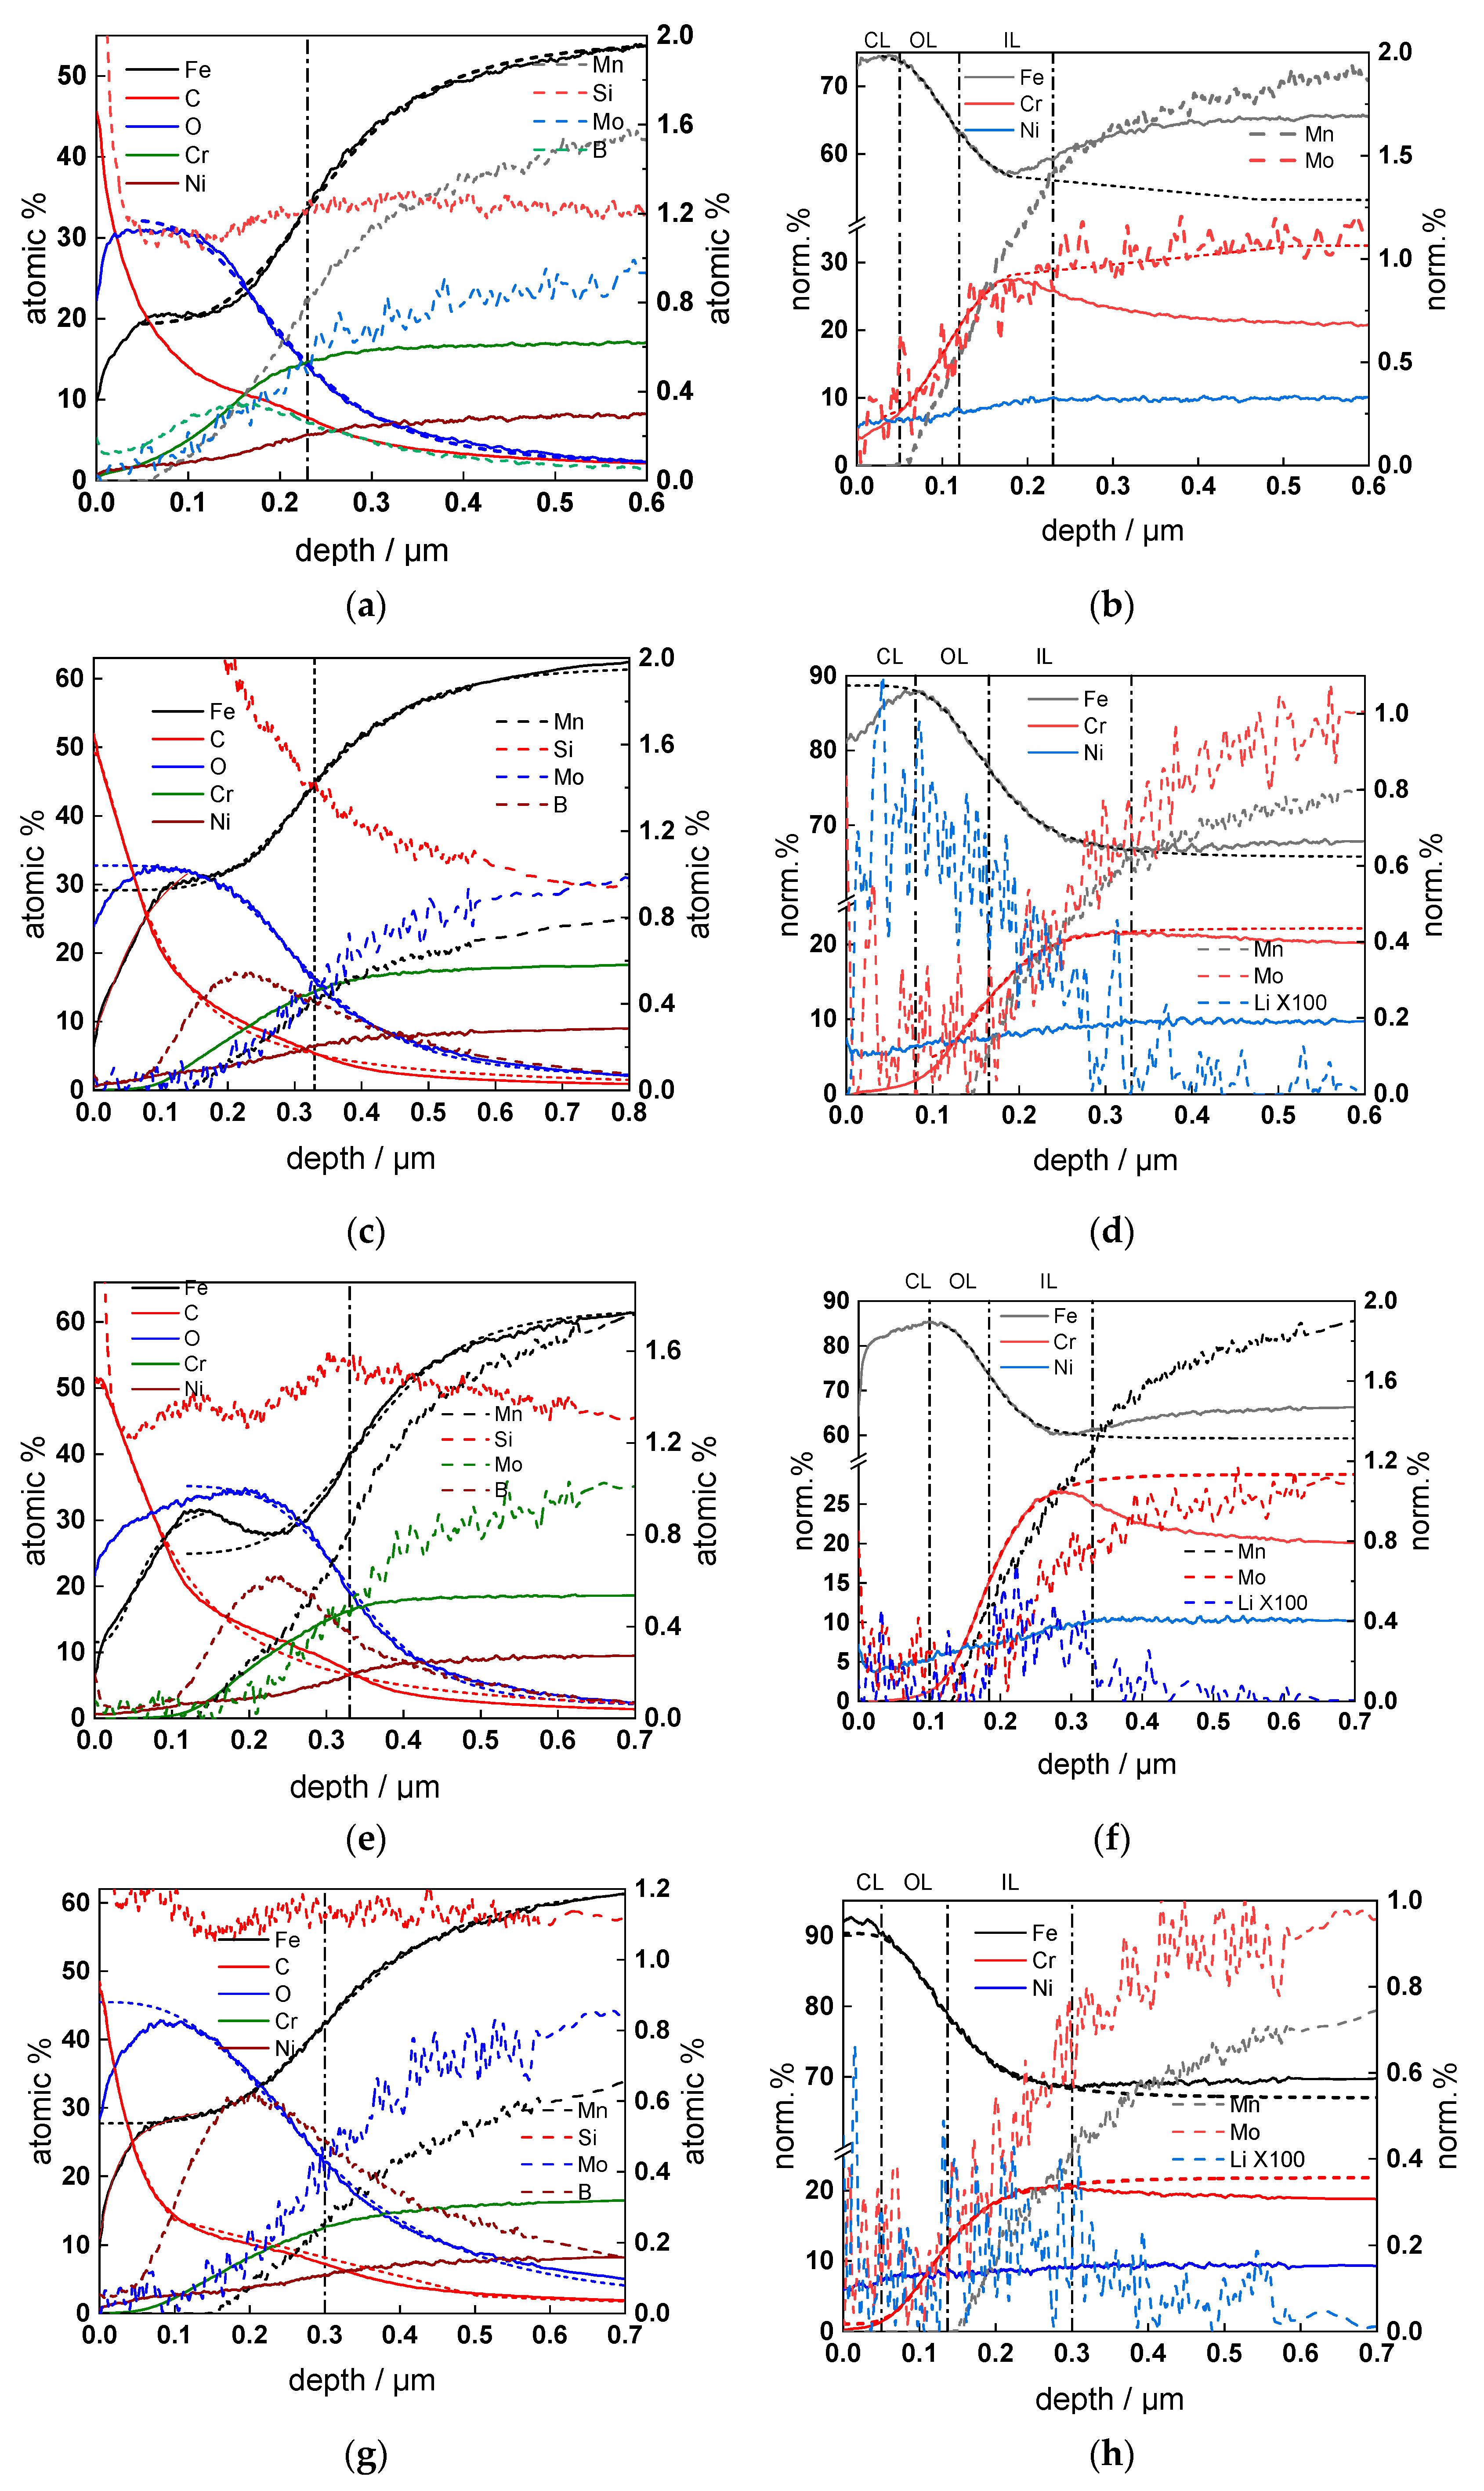
3.4. Thickness and Elemental Composition of the Oxides
3.5. Phase Composition of the Oxide Layer
4. Discussion
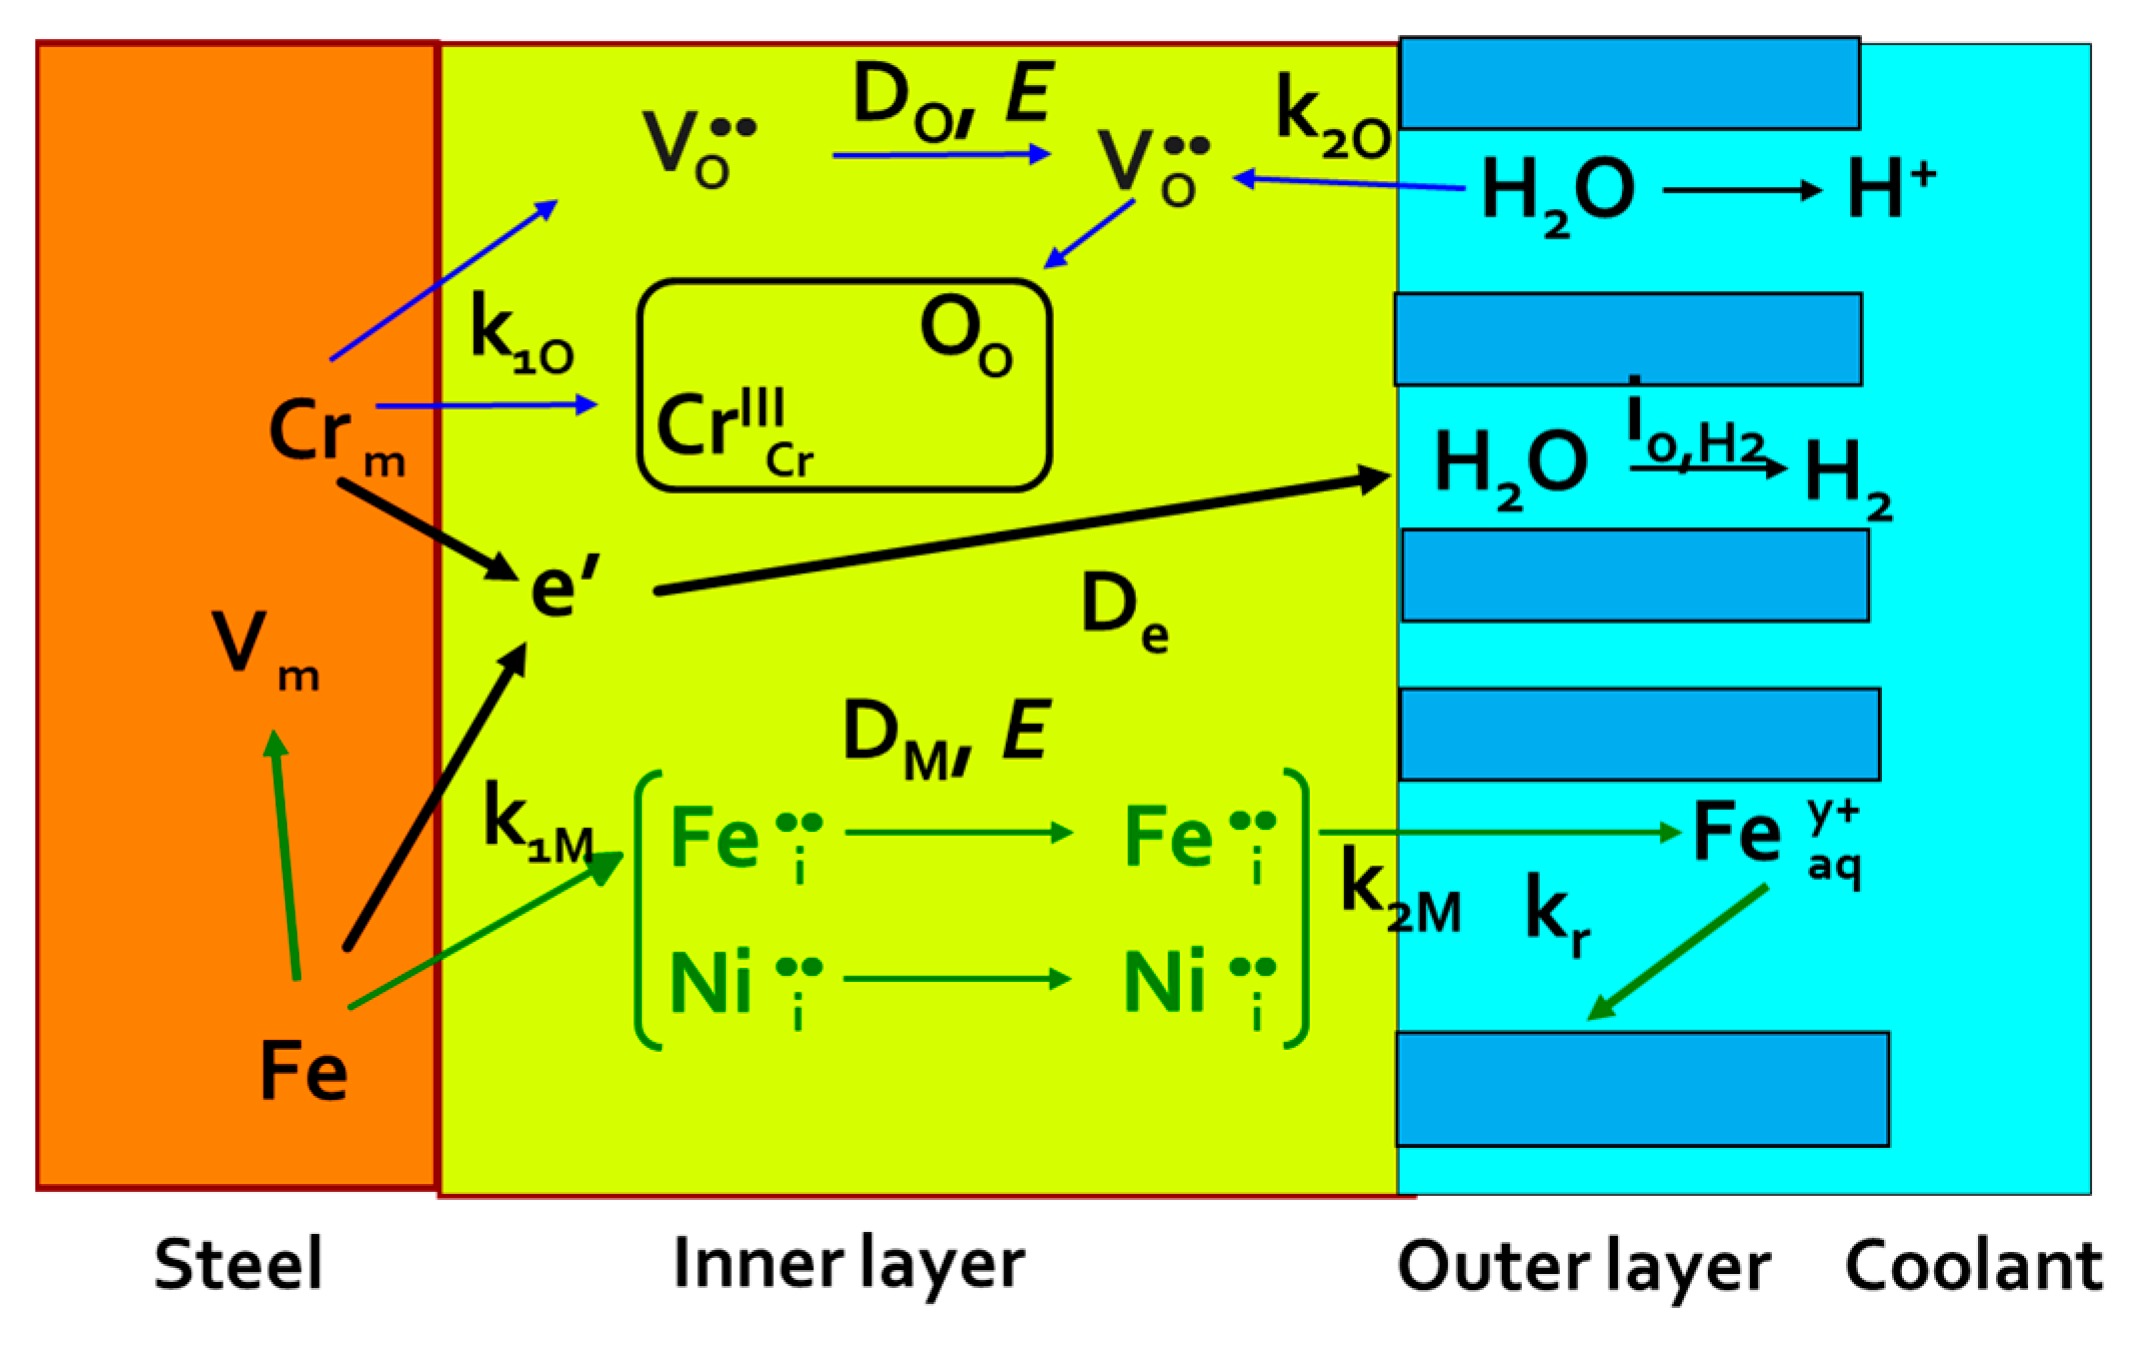
4.1. Physical Model
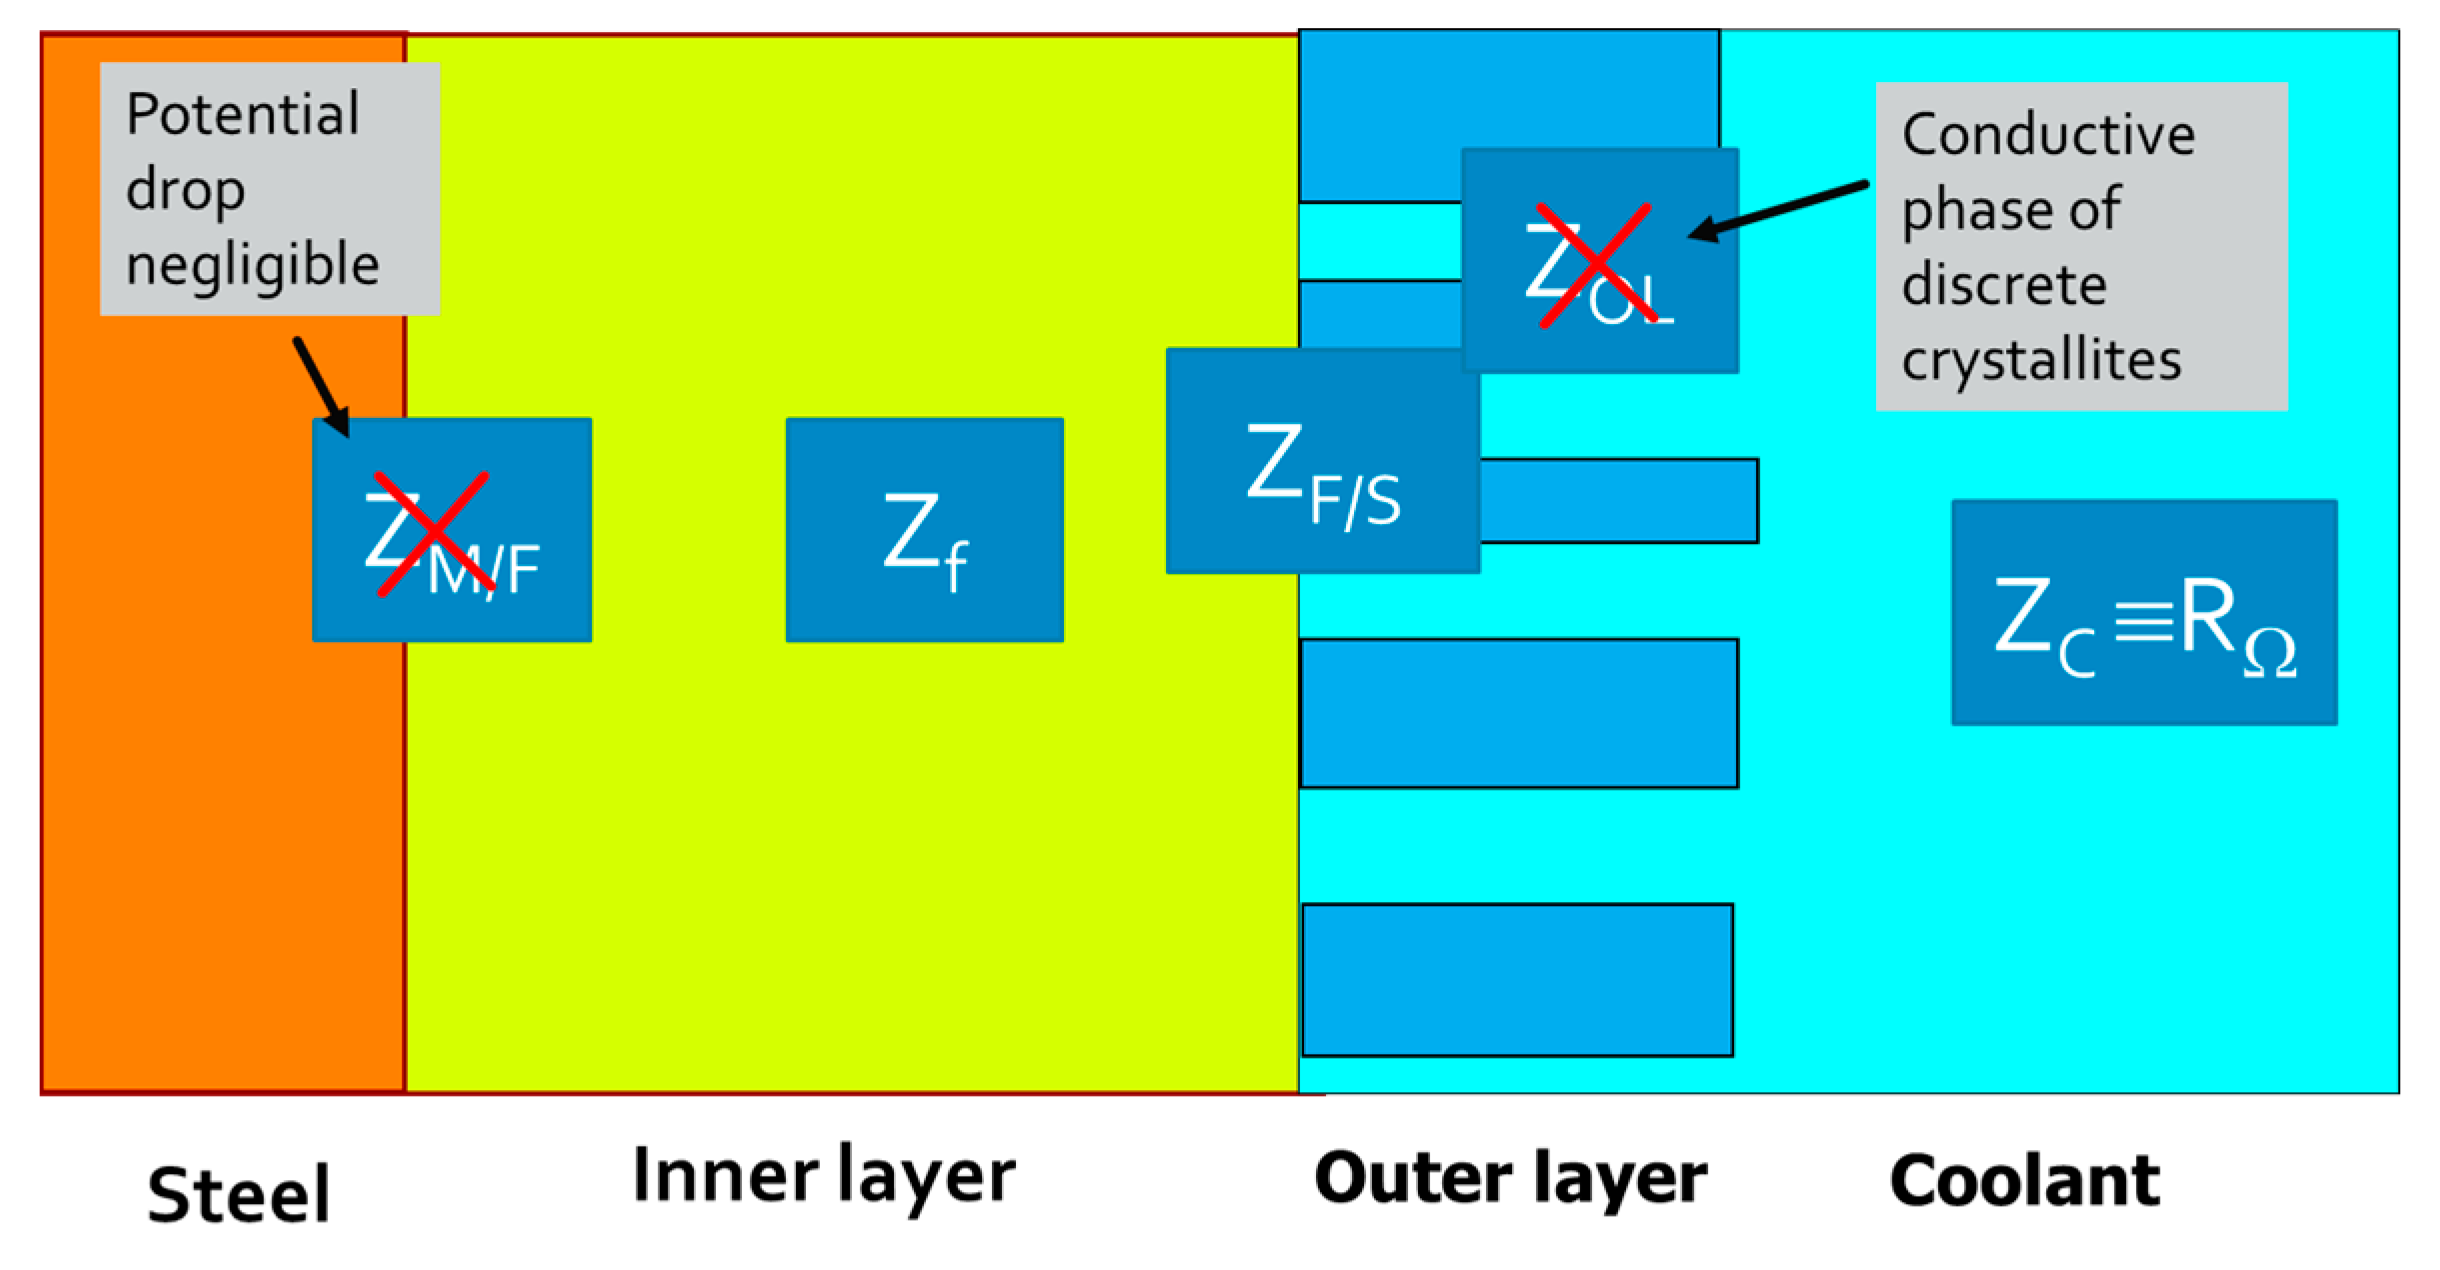
4.2. Main Equations for the Impedance Response
4.3. Parameterization of the Model
4.4. Effect of Water Chemistry on Kinetic and Transport Parameters
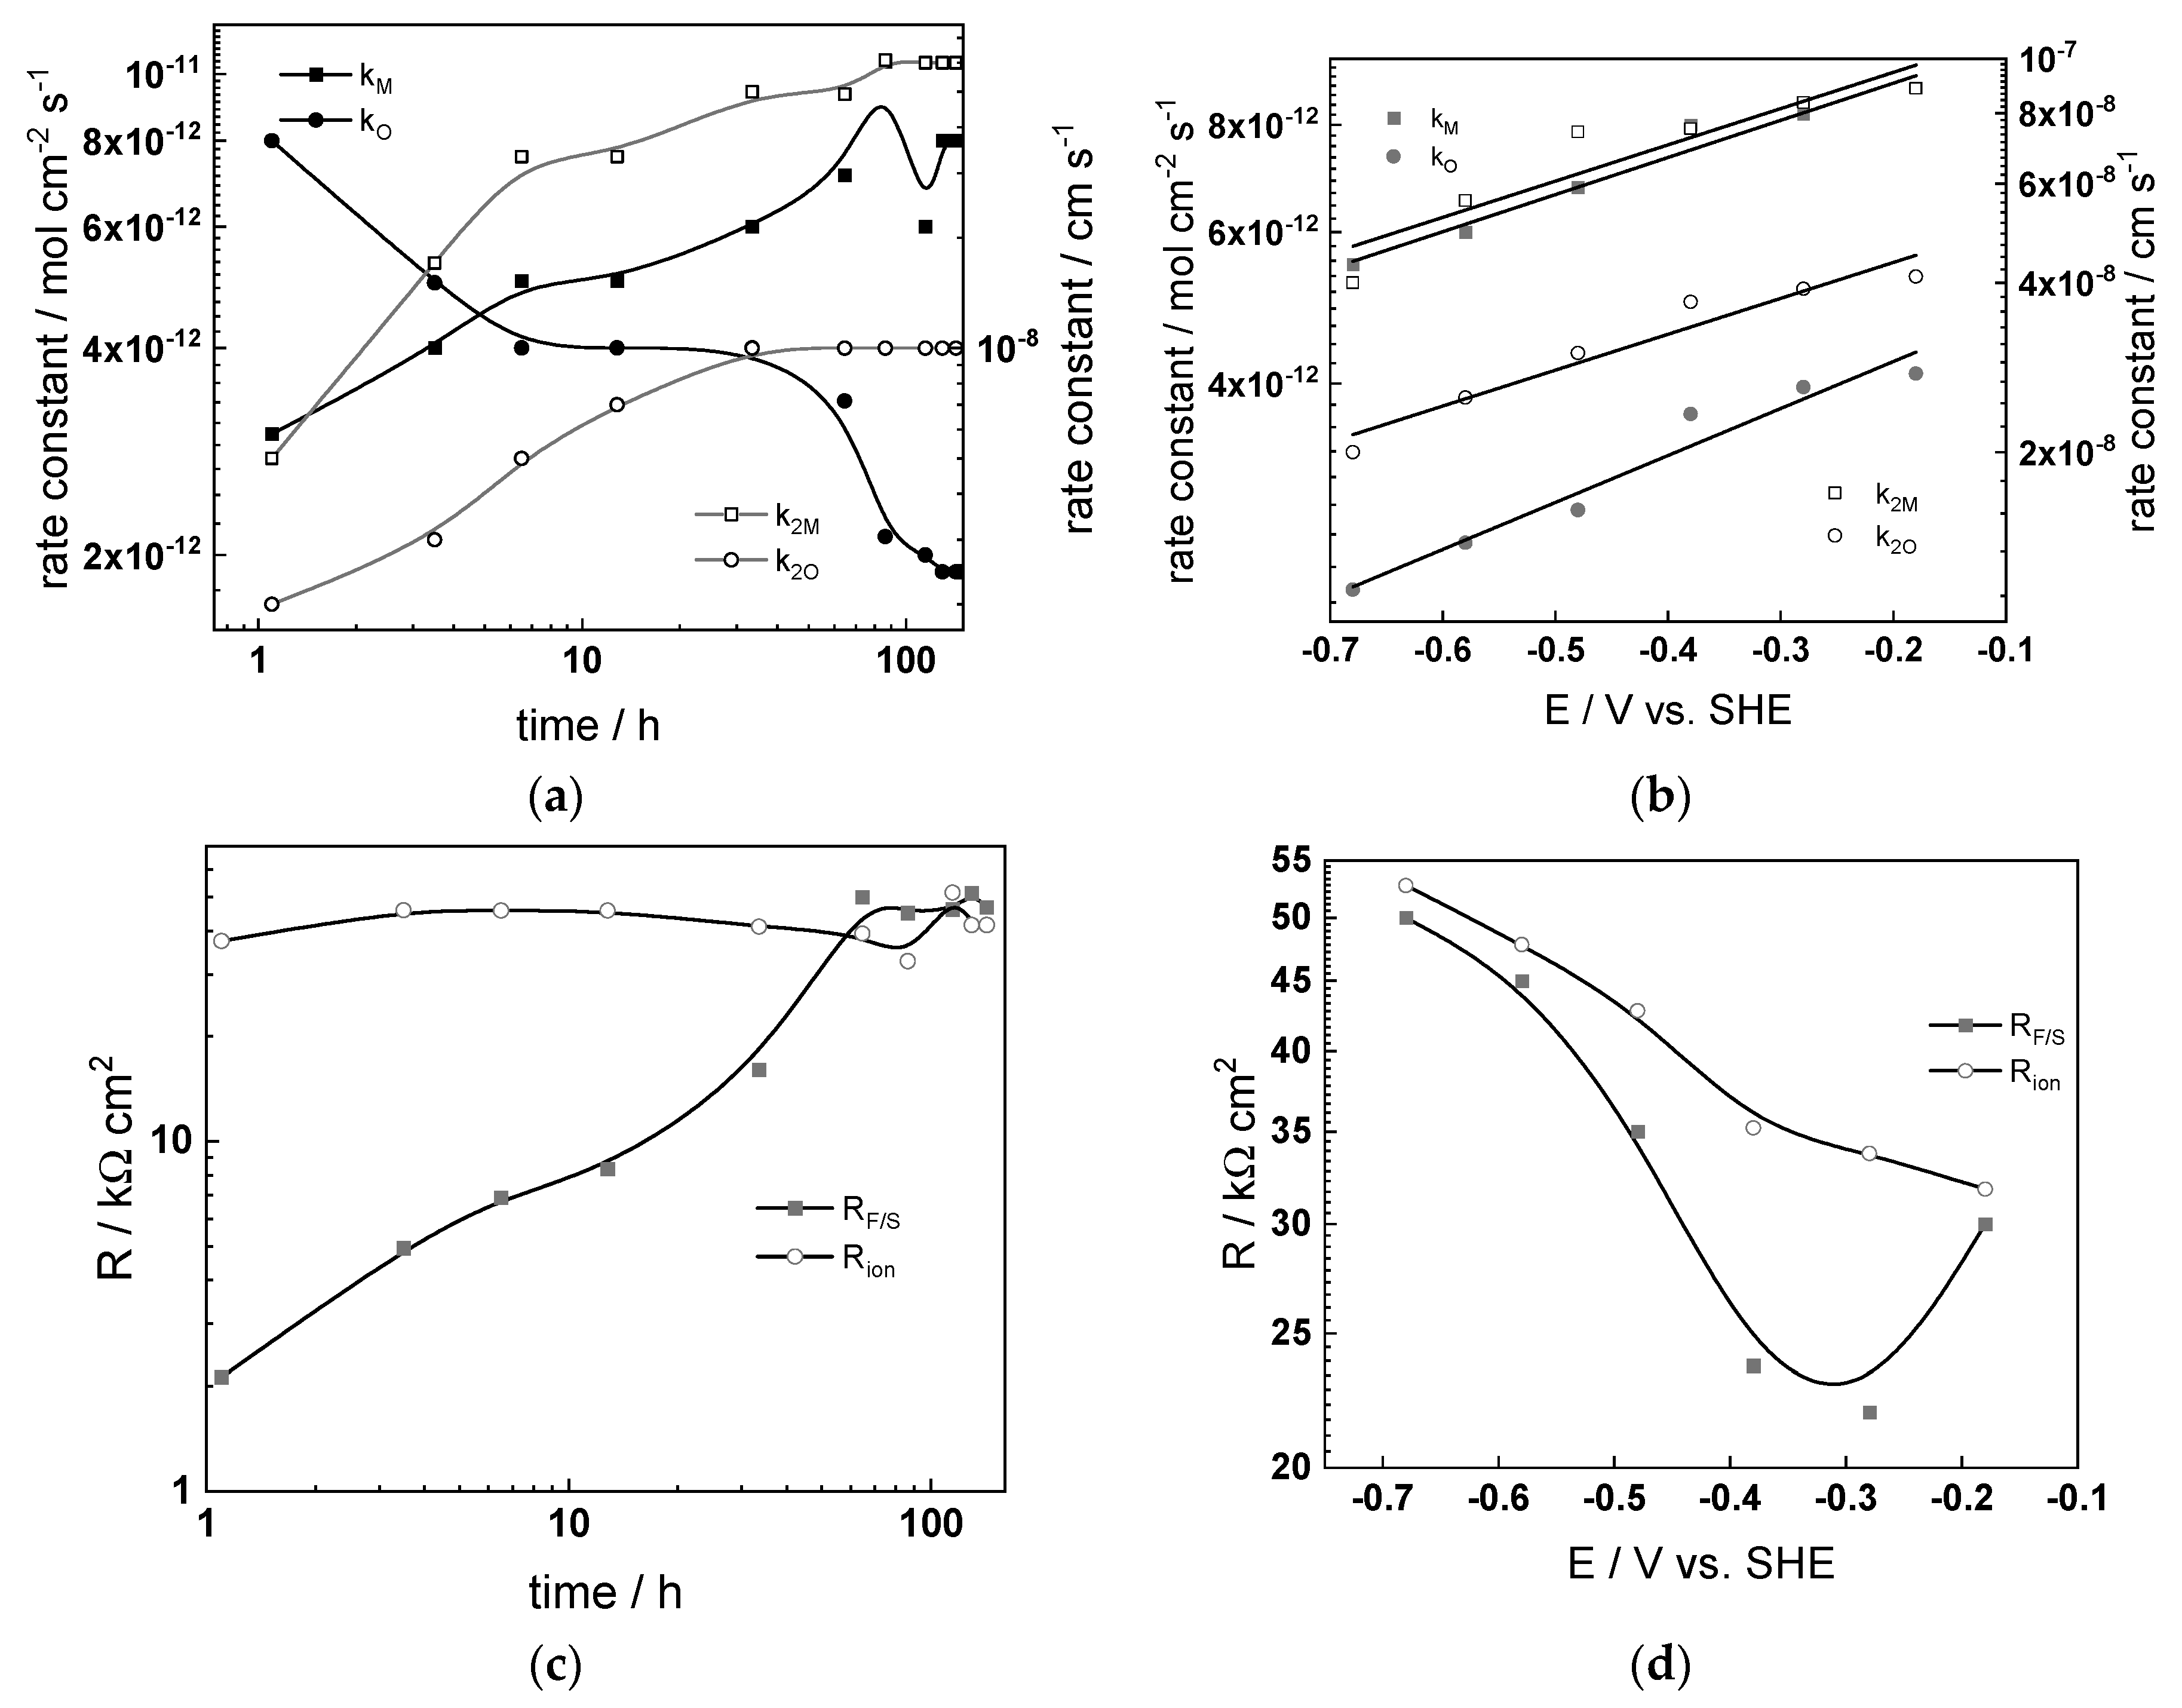
- The differences between parameters estimated after exposure to the studied water chemistries were not very large, indicating that the corrosion and oxidation rates were rather similar regardless of the stage of operation (beginning, middle, or end of cycle). Most of the kinetic parameters stabilized after 40–50 h of exposure.
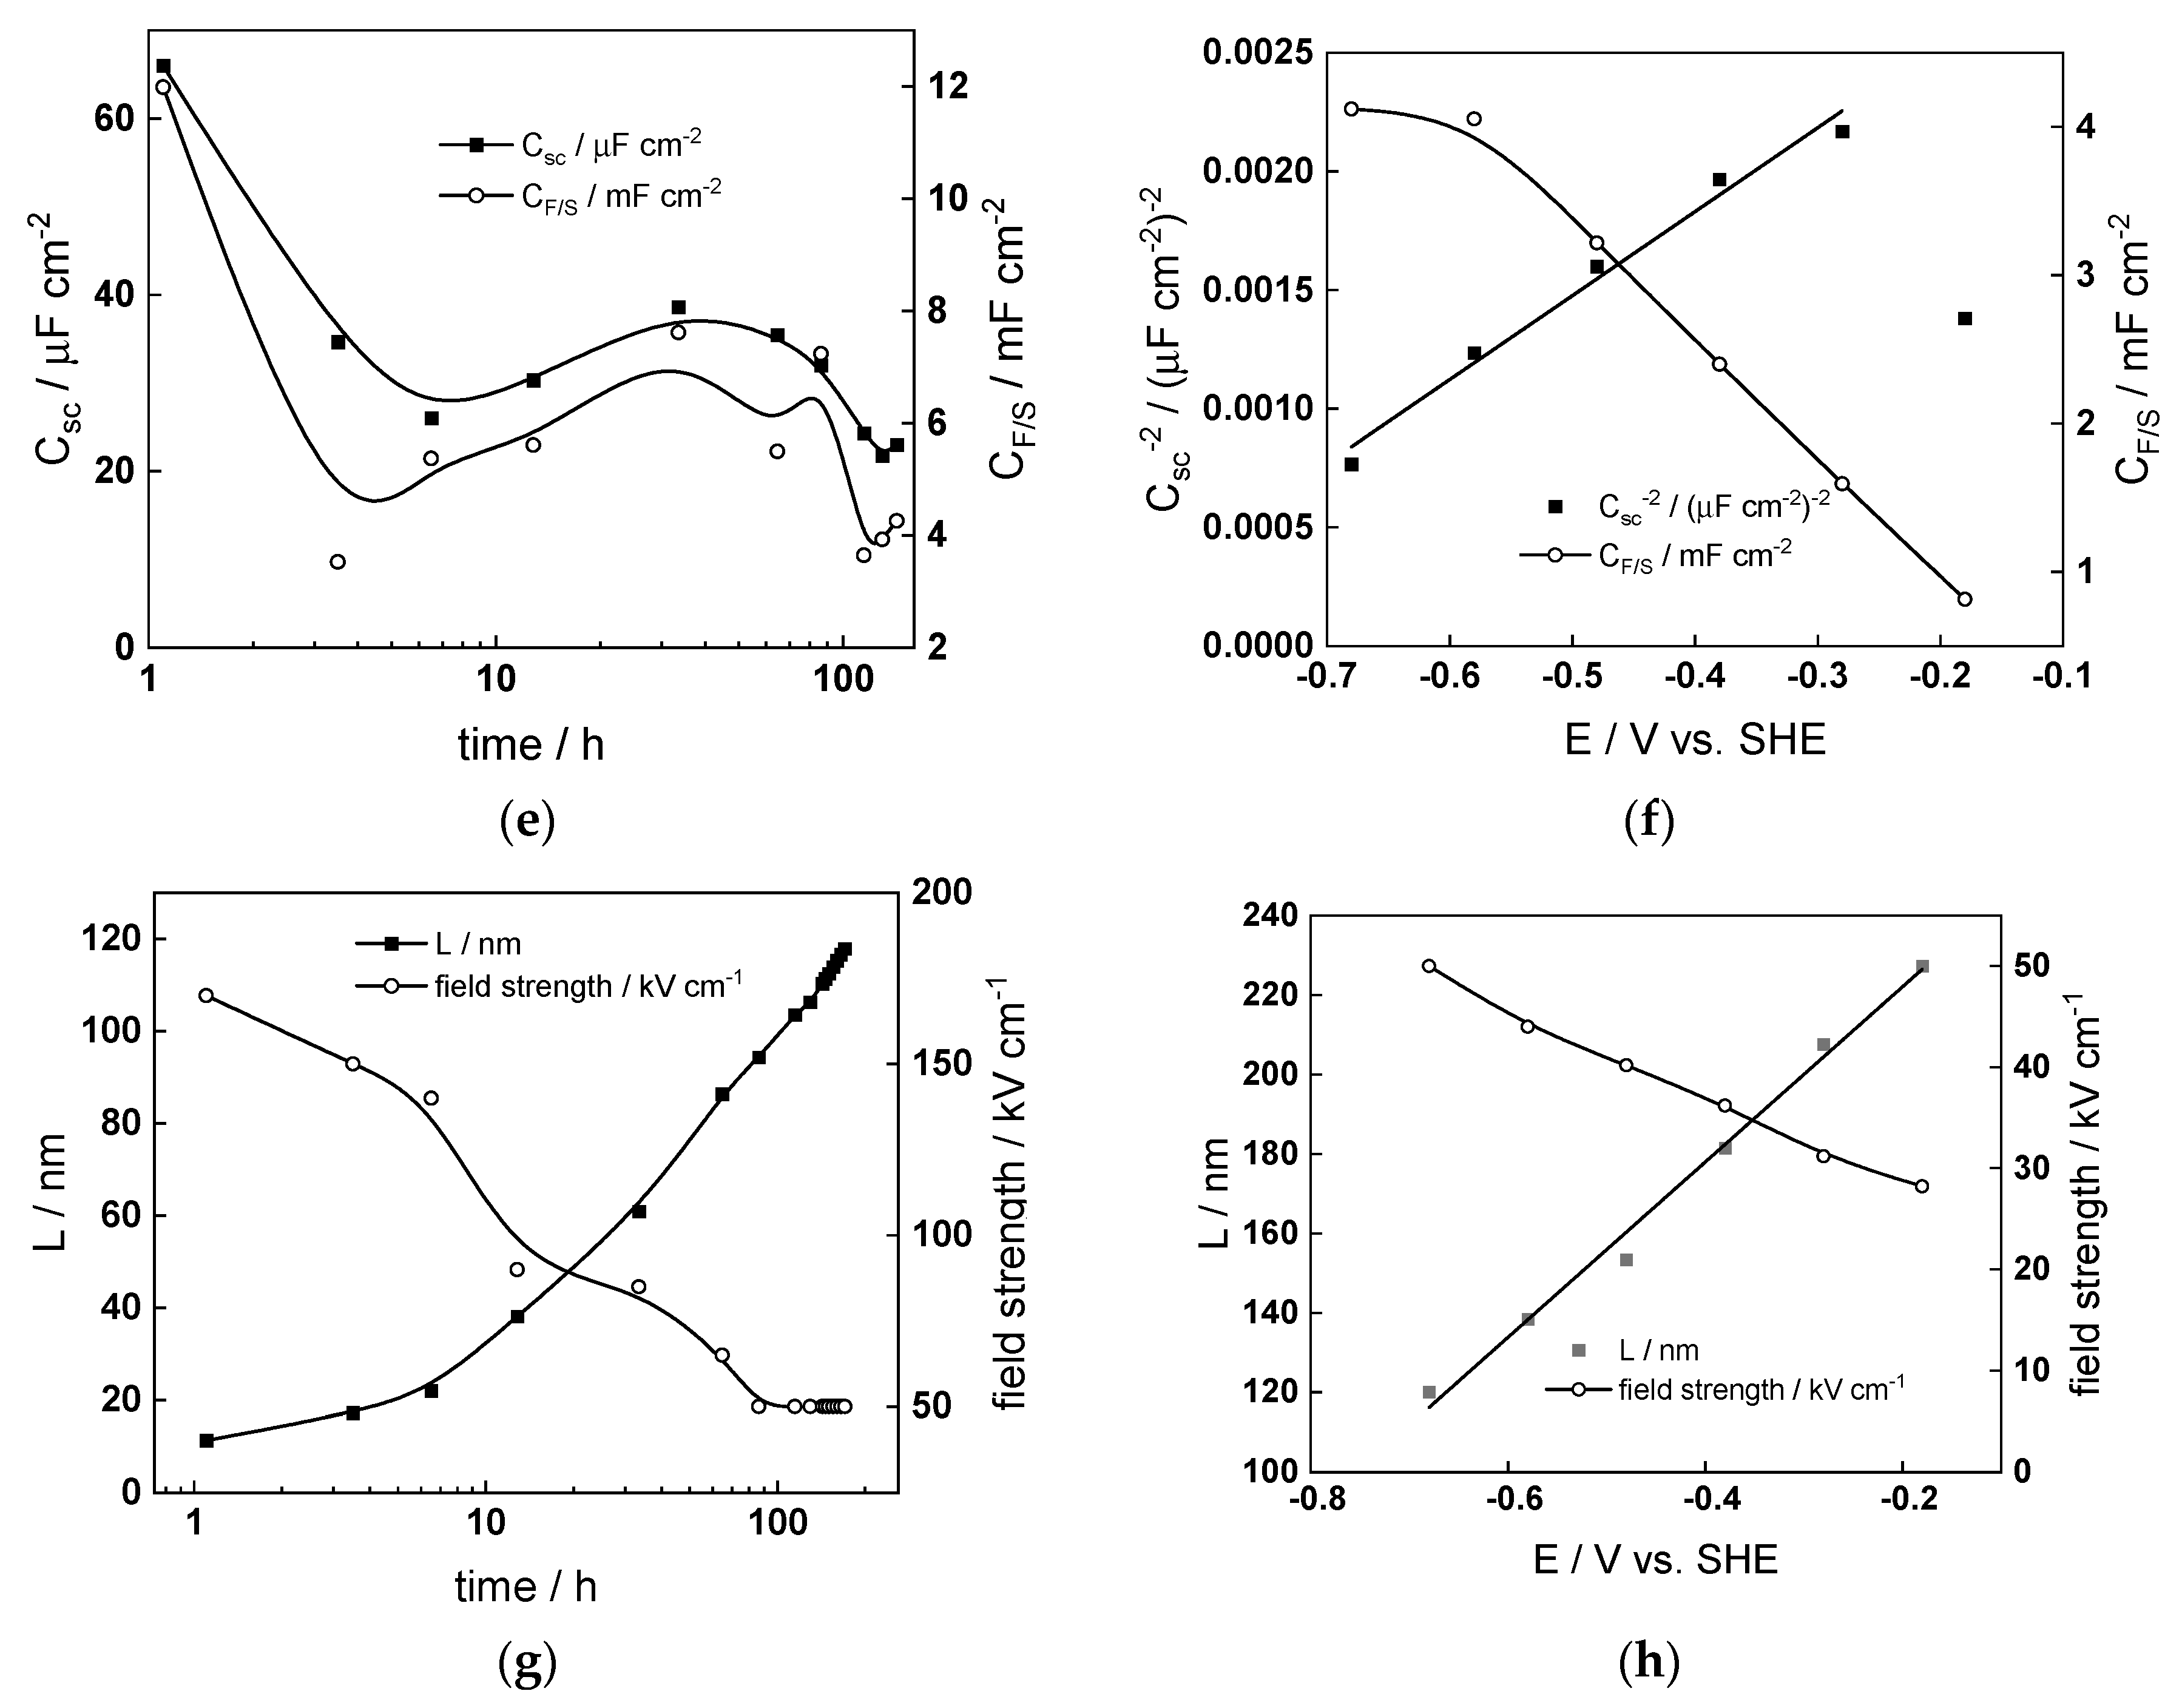
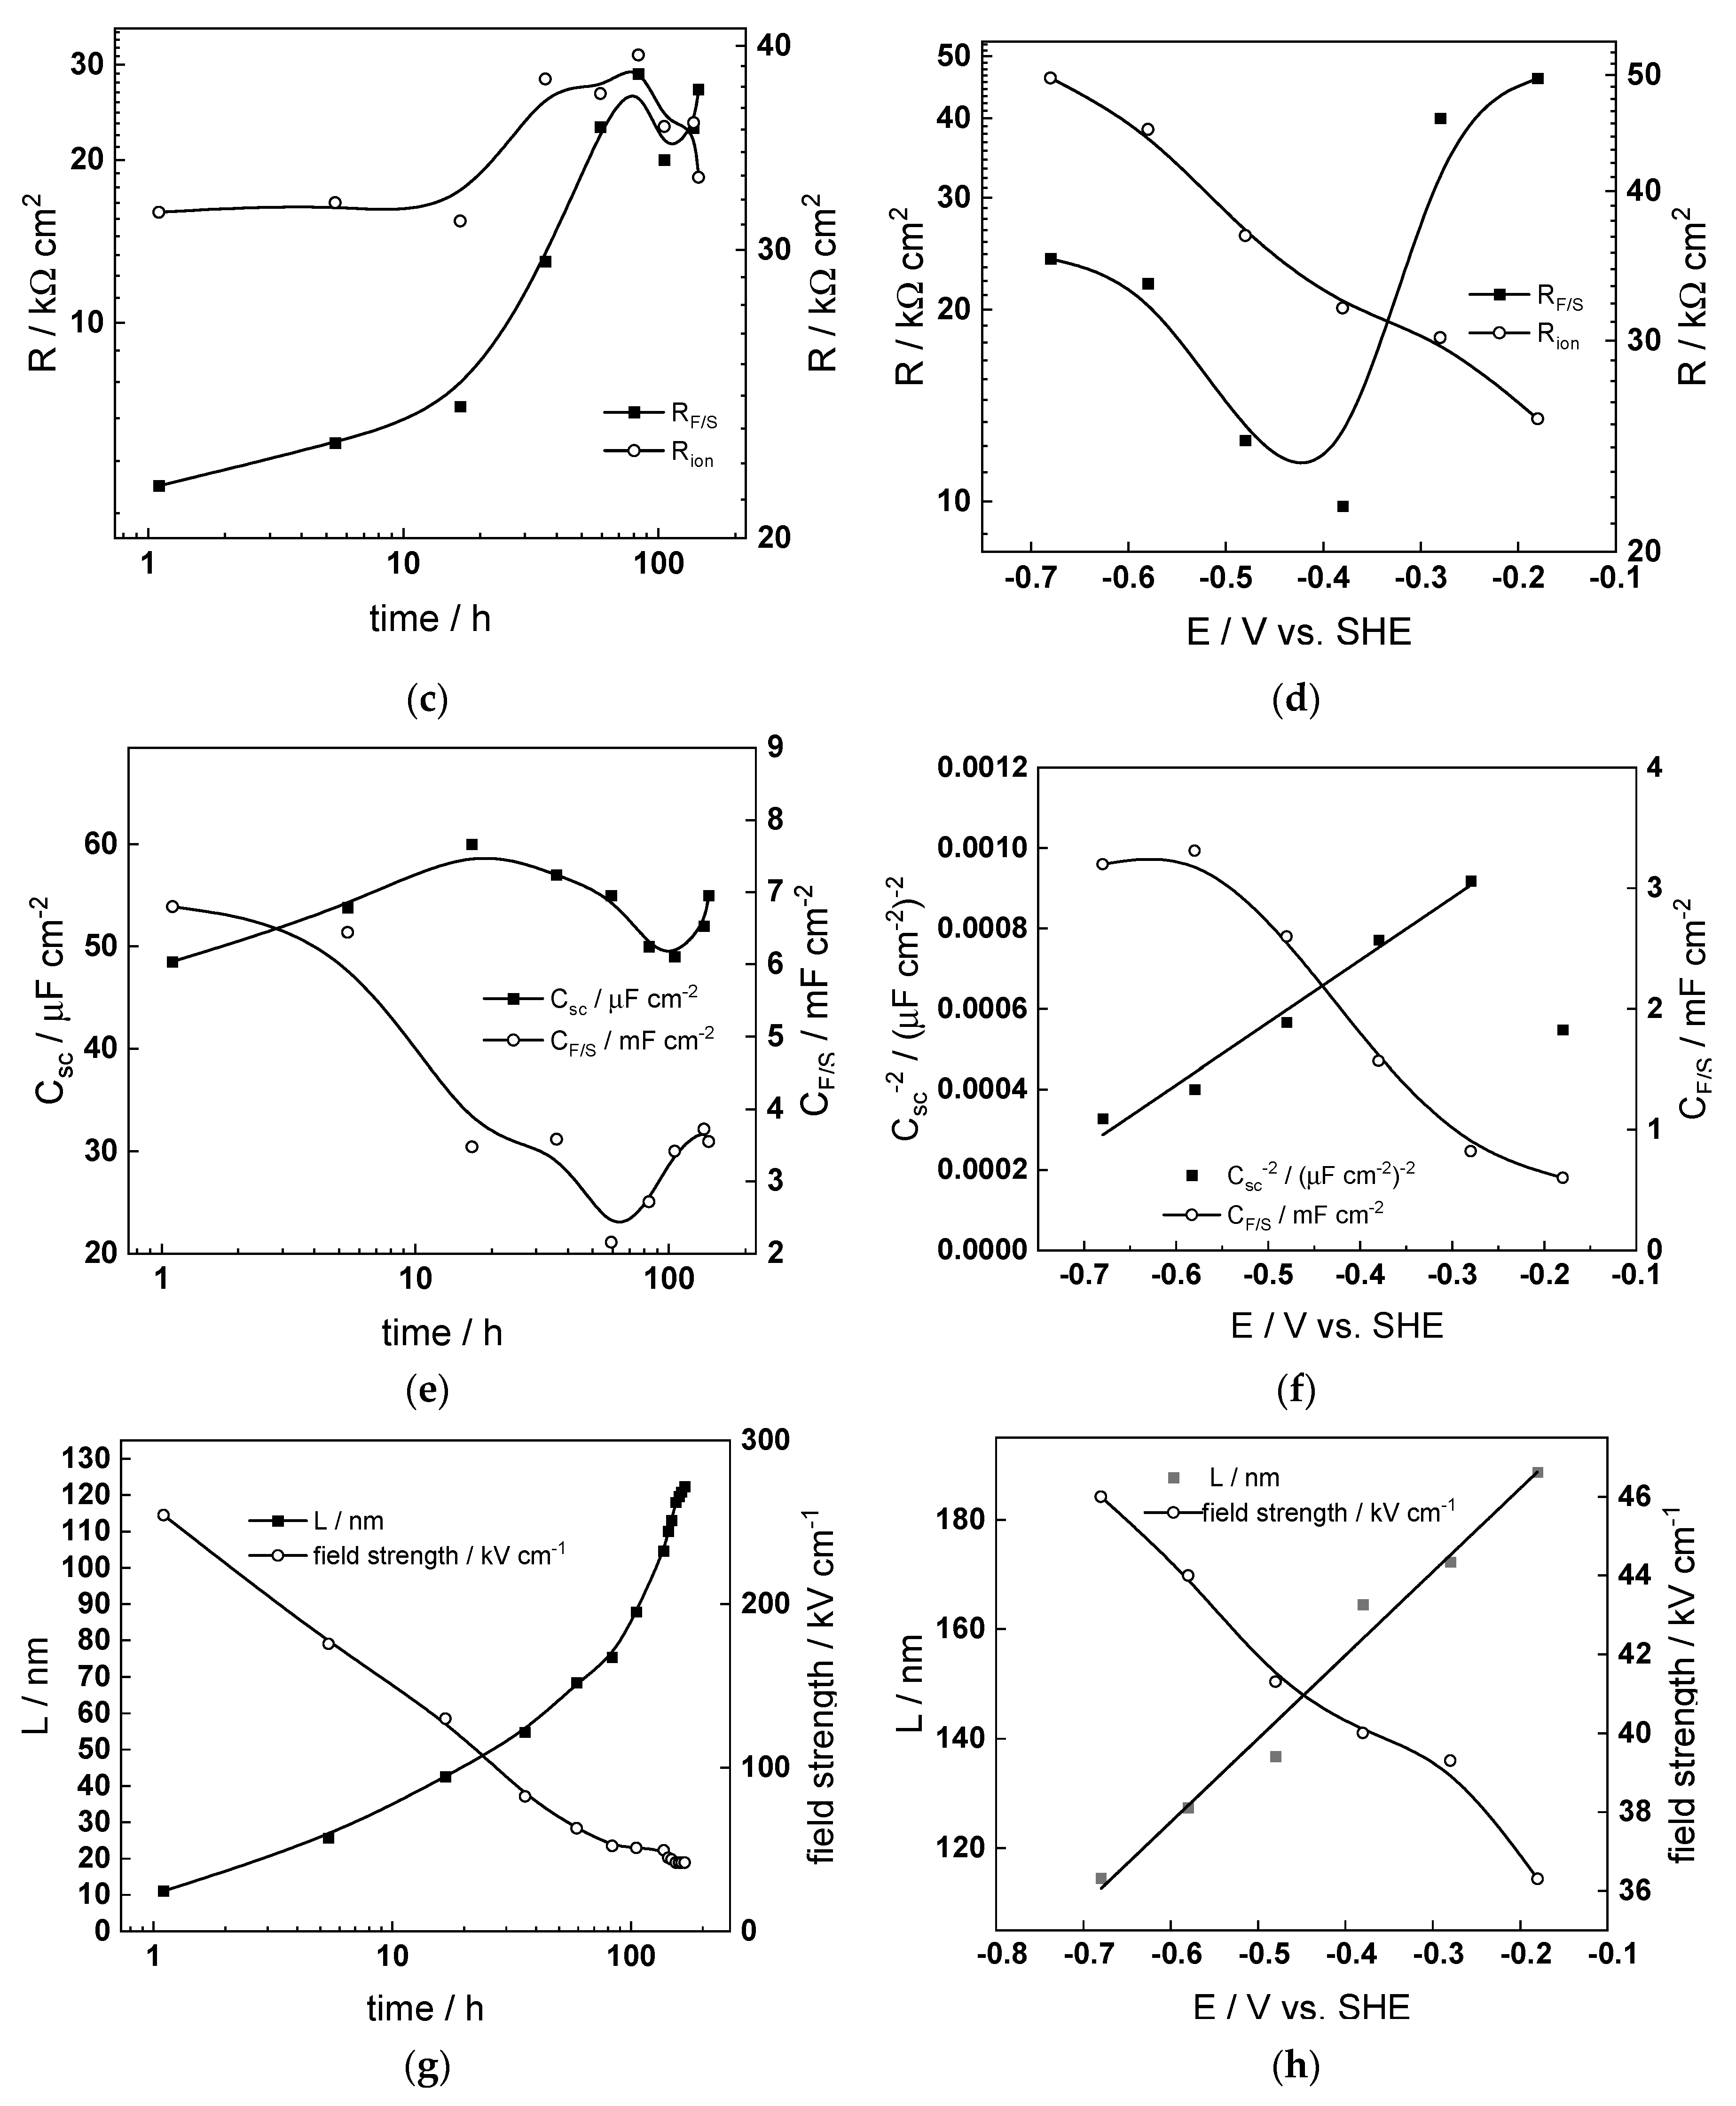
- The rate constants of oxidation at the steel/inner layer interface decreased with the duration of exposure, whereas the corresponding constants for metal oxidation with interstitial cation formation slightly increased. On the other hand, the rate constants of filling of oxygen vacancies and ejection of interstitial cations at the inner layer/coolant interface were quasi-independent on time, indicating no significant evolution of the energetics of this interface with exposure. This observation agrees with the very small evolution of both the space charge and interfacial capacitances with time after 40–50 h of exposure. It is worth noting that the values of CF/S were rather large (several mF cm−2), i.e., it could be identified with a pseudo-capacitance of an adsorbed intermediate (for example, atomic H formed during reduction of water).
- All the rate constants obeyed, to a first approximation, an exponential dependence on applied potential in accordance with the model’s assumptions. The respective transfer coefficients estimated from the plots were rather low (of the order of 0.1–0.2), which is typical for systems with passive oxide films, indicating the similar energetics of the initial and transition states [22].
- The interfacial capacitance decreased with increasing potential, indicating a change in the nature of the adsorbed intermediate from atomic H to, e.g., adsorbed Cr(VI) species formed via transpassive oxidation. The space charge capacitance plotted vs. potential in Mott–Schottky coordinates (Csc−2 vs. E) indicated a change in the semiconductor type at around −0.4–−0.3 V, which could also be related to transpassive oxidation.
5. Conclusions
- Oxidation and corrosion of AISI 316L in simulated primary WWER coolant at different stages of operation in comparison to nominal PWR coolant were successfully characterized by a combination of in situ measurements and ex situ analytical techniques.
- In the present conditions, oxide growth and corrosion were found to be limited by both interfacial reactions and solid-state transport in the inner layer.
- Thin bi-layer oxides were formed on the steel after 168 h of exposure, with the inner layer tentatively identified as FeCr2O4 and the outer layer as FeNi2O4. An intermetallic Fe-Ni phase was also detected.
- The conduction mechanism in the steel/oxide/coolant system was successfully described by the mixed-conduction model. Kinetic and transport parameters, estimated as depending on exposure time and applied potential, indicated no significant differences between boron–potassium–lithium and boron–lithium primary water chemistries. Further investigations covering the effects of pH and temperature are needed in order to evaluate the general extent of the predictive ability of the modeling procedure. Concerning the industrial implications of the present study, it falls in line with findings from both EPRI and Framatome studies in demonstrating that a transition from Li− to (K + Li) primary water chemistry will not lead to enhanced uniform corrosion or oxide formation on reactor internals such as stainless steels. A companion study on the behavior of Alloy 690 in similar conditions is in progress and will be reported in the near future.
Author Contributions
Funding
Data Availability Statement
Conflicts of Interest
References
- McElrath, J. Pressurized Water Reactor Primary Water Chemistry Guidelines; EPRI: Palo Alto, CA, USA, 2014; Volume 1. [Google Scholar]
- GAO-13-716. Managing Critical Isotopes: Stewardship of Lithium-7 Is Needed to Ensure a Stable Supply. 2013. Available online: https://www.gao.gov/products/gao-13-716 (accessed on 20 October 2023).
- Review of VVER Primary Water Chemistry and the Potential for its Use in PWRs: Potassium Hydroxide and/or Ammonia Based Water Chemistries; EPRI: Palo Alto, CA, USA, 2002.
- Feasibility of Using Potassium Hydroxide for Primary Coolant pH Control in Pressurized Water Reactors; EPRI: Palo Alto, CA, USA, 2015.
- Fruzzetti, K.; Marks, C.; Reinders, J.; McElrath, J.; Wells, D. Evaluation of Potassium Hydroxide for Reactor Coolant pHT Control in Western PWRs. In Proceedings of the 20th International 15 Conference on Water Chemistry in Nuclear Reactor Systems, Brighton, UK, 2–7 October 2016. [Google Scholar]
- Chou, P.; Smith, J.; Demma, A.; Burke, M.; Fruzzetti, K. Potassium Hydroxide for PWR Primary Coolant pH Control: Materials Qualification Testing. In Proceedings of the 21st International Conference on Water Chemistry in Nuclear Reactor Systems, San Francisco, CA, USA, 9–14 September 2018. [Google Scholar]
- Fandrich, J.; Dudka, E. Investigations of an Alternative Alkalization Strategy for Primary Coolant Conditioning of Pressurized Light Water Reactors. In Proceedings of the 2018 Nuclear Power Plant Chemistry Conference (NPC 2018), San Francisco, CA, USA, 10–13 September 2018. [Google Scholar]
- Dingee, J.; Marks, C.; Fruzzetti, K.; McElrath, J. Modeling Potassium Hydroxide for pHT Control in Western-Style PWRs. In Proceedings of the 21st NPC International Conference on Water Chemistry in Nuclear Reactor Systems, San Francisco, CA, USA, 9–14 September 2018. [Google Scholar]
- Chen, K.; Ickes, M.; Burke, M.; Was, G. The effect of potassium hydroxide primary water chemistry on the IASCC behavior of 304 stainless steel. J. Nucl. Mater. 2022, 558, 153323. [Google Scholar] [CrossRef]
- Wang, J.; Zhu, T.; Bao, Y.; Liu, X.; Shi, X.; Guo, X.; Han, Z.; Andresen, P.; Zhang, L.; Chen, K. Insights into the stress corrosion cracking propagation behavior of Alloy 690 and 316 L stainless steel in KOH versus LiOH oxygenated water. Corros. Sci. 2023, 224, 11155. [Google Scholar] [CrossRef]
- Kakitani, K.; Sugino, W.; Nakano, Y.; Sato, K.; Shimizu, Y. Effect of KOH and dissolved hydrogen on oxide film and stress corrosion cracking susceptibility of Alloy X-750. Mech. Eng. J. 2023, 23–00317. [Google Scholar] [CrossRef]
- Nigmatullina, K.; Rolph, J.; Cothran, K.; Ritchie, J.; Fruzzetti, K.; Perkins, D.; Chou, P.; Hussey, D. Potassium Hydroxide for Western-Design PWRs: Plans for a Three-Cycle Monitored Campaign at TVA Sequoyah. In Proceedings of the SFEN Conference on Nuclear Power Chemistry (NPC), Antibes, France, 25–28 September 2023. [Google Scholar]
- Fruzzetti, K.; Marks, C.; Dingee, J.; Kim-Stevens, K.; Perkins, D.; Nigmatullina, K. Potassium Hydroxide for Western-Design PWRs: Chemistry and Radiation Safety Assessments. In Proceedings of the SFEN Conference on Nuclear Power Chemistry (NPC), Antibes, France, 25–28 September 2023. [Google Scholar]
- Sinjlawi, A.; Dong, L.; Ickes, M.; Sun, K.; Was, G. Irradiation assisted stress corrosion cracking of 347 stainless steel in simulated PWR primary water containing lithium hydroxide or potassium hydroxide. J. Nucl. Mater. 2023, 586, 154676. [Google Scholar] [CrossRef]
- Ferguson, J.; Arcis, H.; Tremaine, P. Thermodynamics of Polyborates under Hydrothermal Conditions: Formation Constants and Limiting Conductivities of Triborate and Diborate. J. Chem. Eng. Data 2019, 64, 4430–4443. [Google Scholar] [CrossRef]
- Sharafutdinov, R.; Kharitonova, N. The Problem of Optimizing the Water Chemistry Used in the Primary Coolant Circuit of a Nuclear Power Station Equipped with WWER Reactors under the Conditions of Longer Fuel Cycle Campaigns and Increased Capacity of Power Units. Therm. Eng. 2011, 58, 383–389. [Google Scholar] [CrossRef]
- You, C.; Zabara, M.; Orazem, M.; Ulgut, B. Application of the Kramers–Kronig Relations to Multi-Sine Electrochemical Impedance Measurements. J. Electrochem. Soc. 2020, 167, 020515. [Google Scholar] [CrossRef]
- Wan, T.; Saccoccio, M.; Chen, C.; Ciucci, F. Influence of the Discretization Methods on the Distribution of Relaxation Times Deconvolution: Implementing Radial Basis Functions with DRTtools. Electrochim. Acta 2015, 184, 483–499. [Google Scholar] [CrossRef]
- Bojinov, M.; Kinnunen, P.; Lundgren, K.; Wikmark, G. A Mixed-Conduction Model for the Oxidation of Stainless Steel in a High-Temperature Electrolyte—Estimation of Kinetic Parameters of Oxide Layer Growth and Restructuring. J. Electrochem. Soc. 2005, 152, B250–B261. [Google Scholar] [CrossRef]
- Que, Z.; Chang, L.; Saario, T.; Bojinov, M. Localised electrochemical processes on laser powder bed fused 316L with various heat treatments in high-temperature water. Addit. Manuf. 2022, 60, 103205. [Google Scholar]
- Betova, I.; Bojinov, M.; Kinnunen, P.; Lundgren, K.; Saario, T. Influence of Zn on the oxide layer on AISI 316L(NG) stainless steel in simulated pressurised water reactor coolant. Electrochim. Acta 2009, 54, 1056–1069. [Google Scholar] [CrossRef]
- Sharifi-Asl, S.; Taylor, M.; Lu, Z.; Engelhardt, G.; Kursten, B.; Macdonald, D.D. Modeling of the electrochemical impedance spectroscopic behavior of passive iron using a genetic algorithm approach. Electrochim. Acta 2013, 102, 161–173. [Google Scholar] [CrossRef]


| Weight % | C | Fe | Cr | Cu | Mn | Ni | P | S | Si | Mo |
|---|---|---|---|---|---|---|---|---|---|---|
| nominal | ≤0.05 | Bal. | 17.0–18.0 | ≤0.30 | 1.2–2.0 | 12.0 | ≤0.035 | ≤0.02 | ≤0.8 | 2.4–2.7 |
| analyzed | 0.04 | Bal. | 17.6 | 0.30 | 1.3 | 12.0 | 0.03 | 0.02 | 0.76 | 2.6 |
| Coolant | Outer Layer/nm | Inner Layer/nm |
|---|---|---|
| WWER BOC | 80 ± 5 | 110 ± 10 |
| WWER MOC | 70 ± 5 | 150 ± 12 |
| WWER EOC | 66 ± 5 | 144 ± 14 |
| nominal PWR | 74 ± 5 | 166 ± 14 |
| X-ray Angle of Incidence | Lattice Parameter of Spinel Phase/Å | Lattice Parameter of γ Phase/Å | Phase Composition |
|---|---|---|---|
| 1° | 8.350 | 3.595 | Trevorite + γ phase |
| 3° | 8.377 | 3.601 | Chromite + γ phase |
| 8° | 8.405 | 3.610 | Chromite + γ phase |
| Parameter | WWER BOC | WWER MOC | WWER EOC | PWR |
|---|---|---|---|---|
| 108 De/cm2 s−1 | 0.50 | 2.0 | 2.0 | 7.0 |
| 1017 DM/cm2 s−1 | 0.50 | 0.60 | 0.50 | 0.50 |
| 1017 DO/cm2 s−1 | 0.30 | 0.35 | 0.30 | 0.30 |
| α | 0.85 | 0.85 | 0.85 | 0.85 |
| αM | 0.07 | 0.27 | 0.11 | 0.12 |
| αO | 0.11 | 0.27 | 0.13 | 0.18 |
| α2M | 0.11 | 0.07 | 0.08 | 0.18 |
| α2O | 0.12 | 0.08 | 0.08 | 0.22 |
Disclaimer/Publisher’s Note: The statements, opinions and data contained in all publications are solely those of the individual author(s) and contributor(s) and not of MDPI and/or the editor(s). MDPI and/or the editor(s) disclaim responsibility for any injury to people or property resulting from any ideas, methods, instructions or products referred to in the content. |
© 2024 by the authors. Licensee MDPI, Basel, Switzerland. This article is an open access article distributed under the terms and conditions of the Creative Commons Attribution (CC BY) license (https://creativecommons.org/licenses/by/4.0/).
Share and Cite
Bojinov, M.; Betova, I.; Karastoyanov, V.; Avdeev, G. Corrosion of Stainless Steel in Simulated Nuclear Reactor Primary Coolant—Experiments and Modeling. Materials 2024, 17, 1148. https://doi.org/10.3390/ma17051148
Bojinov M, Betova I, Karastoyanov V, Avdeev G. Corrosion of Stainless Steel in Simulated Nuclear Reactor Primary Coolant—Experiments and Modeling. Materials. 2024; 17(5):1148. https://doi.org/10.3390/ma17051148
Chicago/Turabian StyleBojinov, Martin, Iva Betova, Vasil Karastoyanov, and Georgi Avdeev. 2024. "Corrosion of Stainless Steel in Simulated Nuclear Reactor Primary Coolant—Experiments and Modeling" Materials 17, no. 5: 1148. https://doi.org/10.3390/ma17051148
APA StyleBojinov, M., Betova, I., Karastoyanov, V., & Avdeev, G. (2024). Corrosion of Stainless Steel in Simulated Nuclear Reactor Primary Coolant—Experiments and Modeling. Materials, 17(5), 1148. https://doi.org/10.3390/ma17051148