

Silver Nanoparticles-Chitosan Nanocomposites: A Comparative Study Regarding Different Chemical Syntheses Procedures and Their Antibacterial Effect


Abstract
1. Introduction
2. Materials and Methods
2.1. Materials
2.2. Methods: Synthesis of AgNPs-CH Nanocomposites
2.3. Characterization Techniques
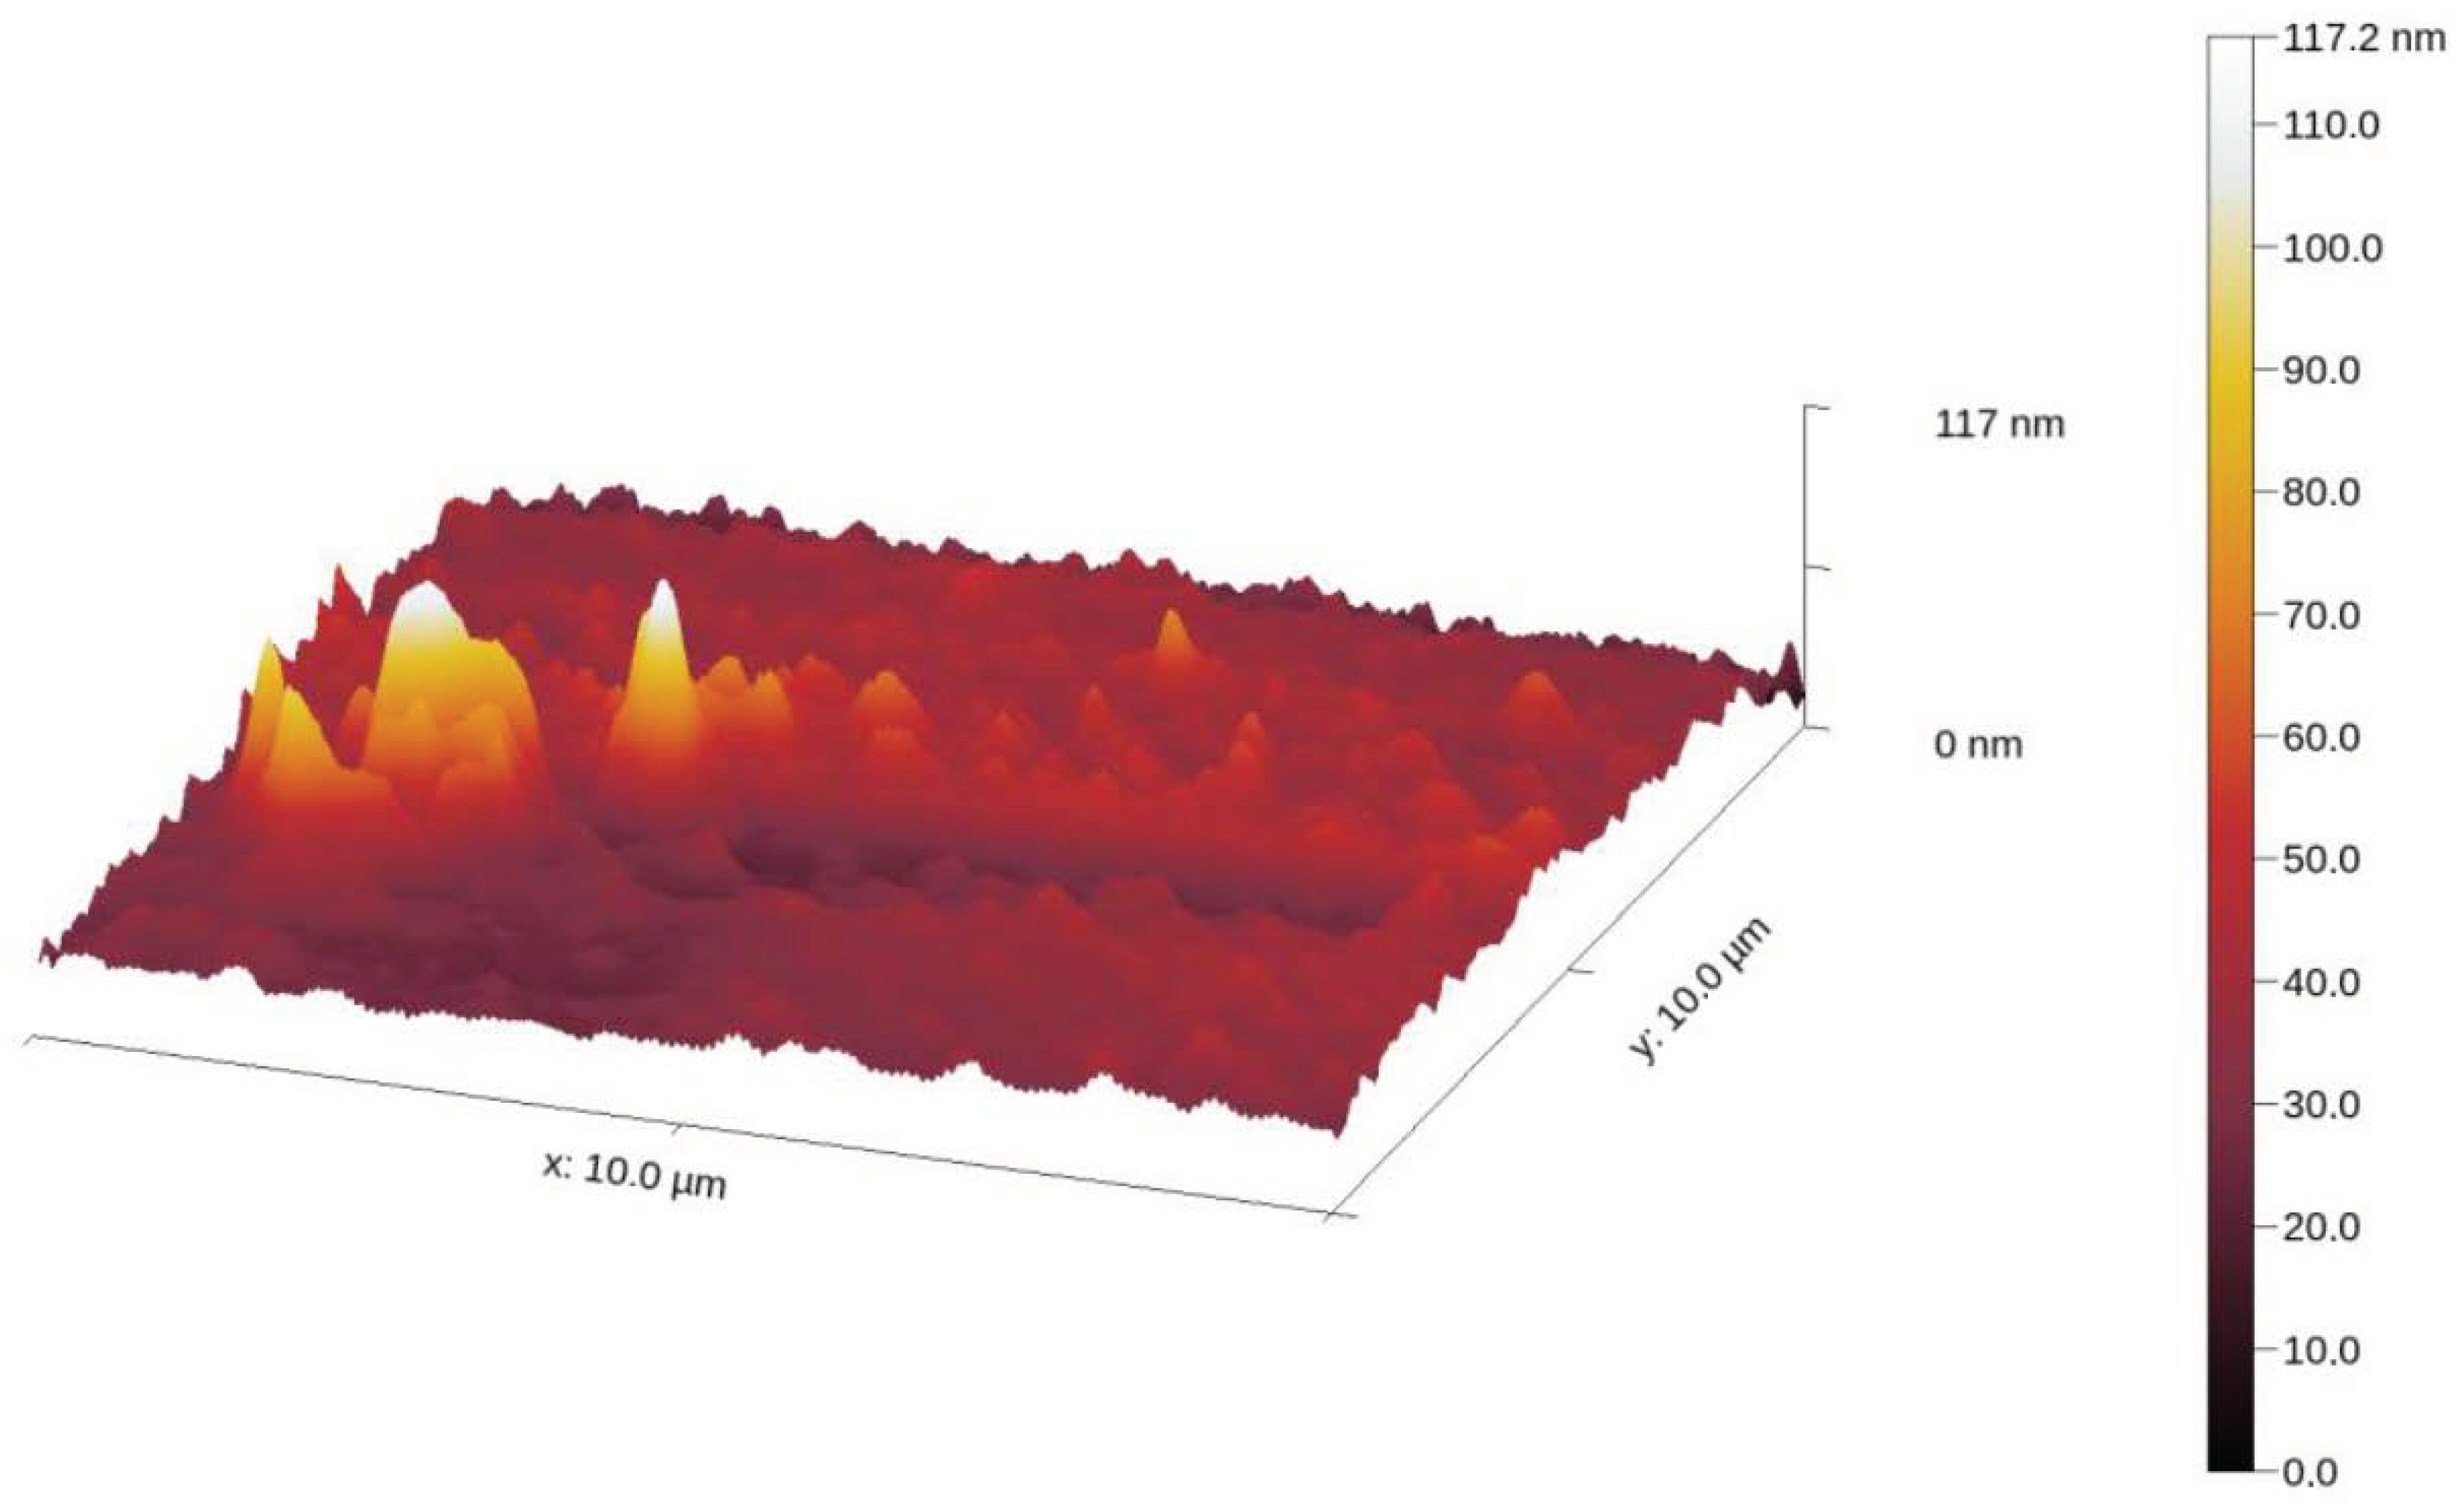
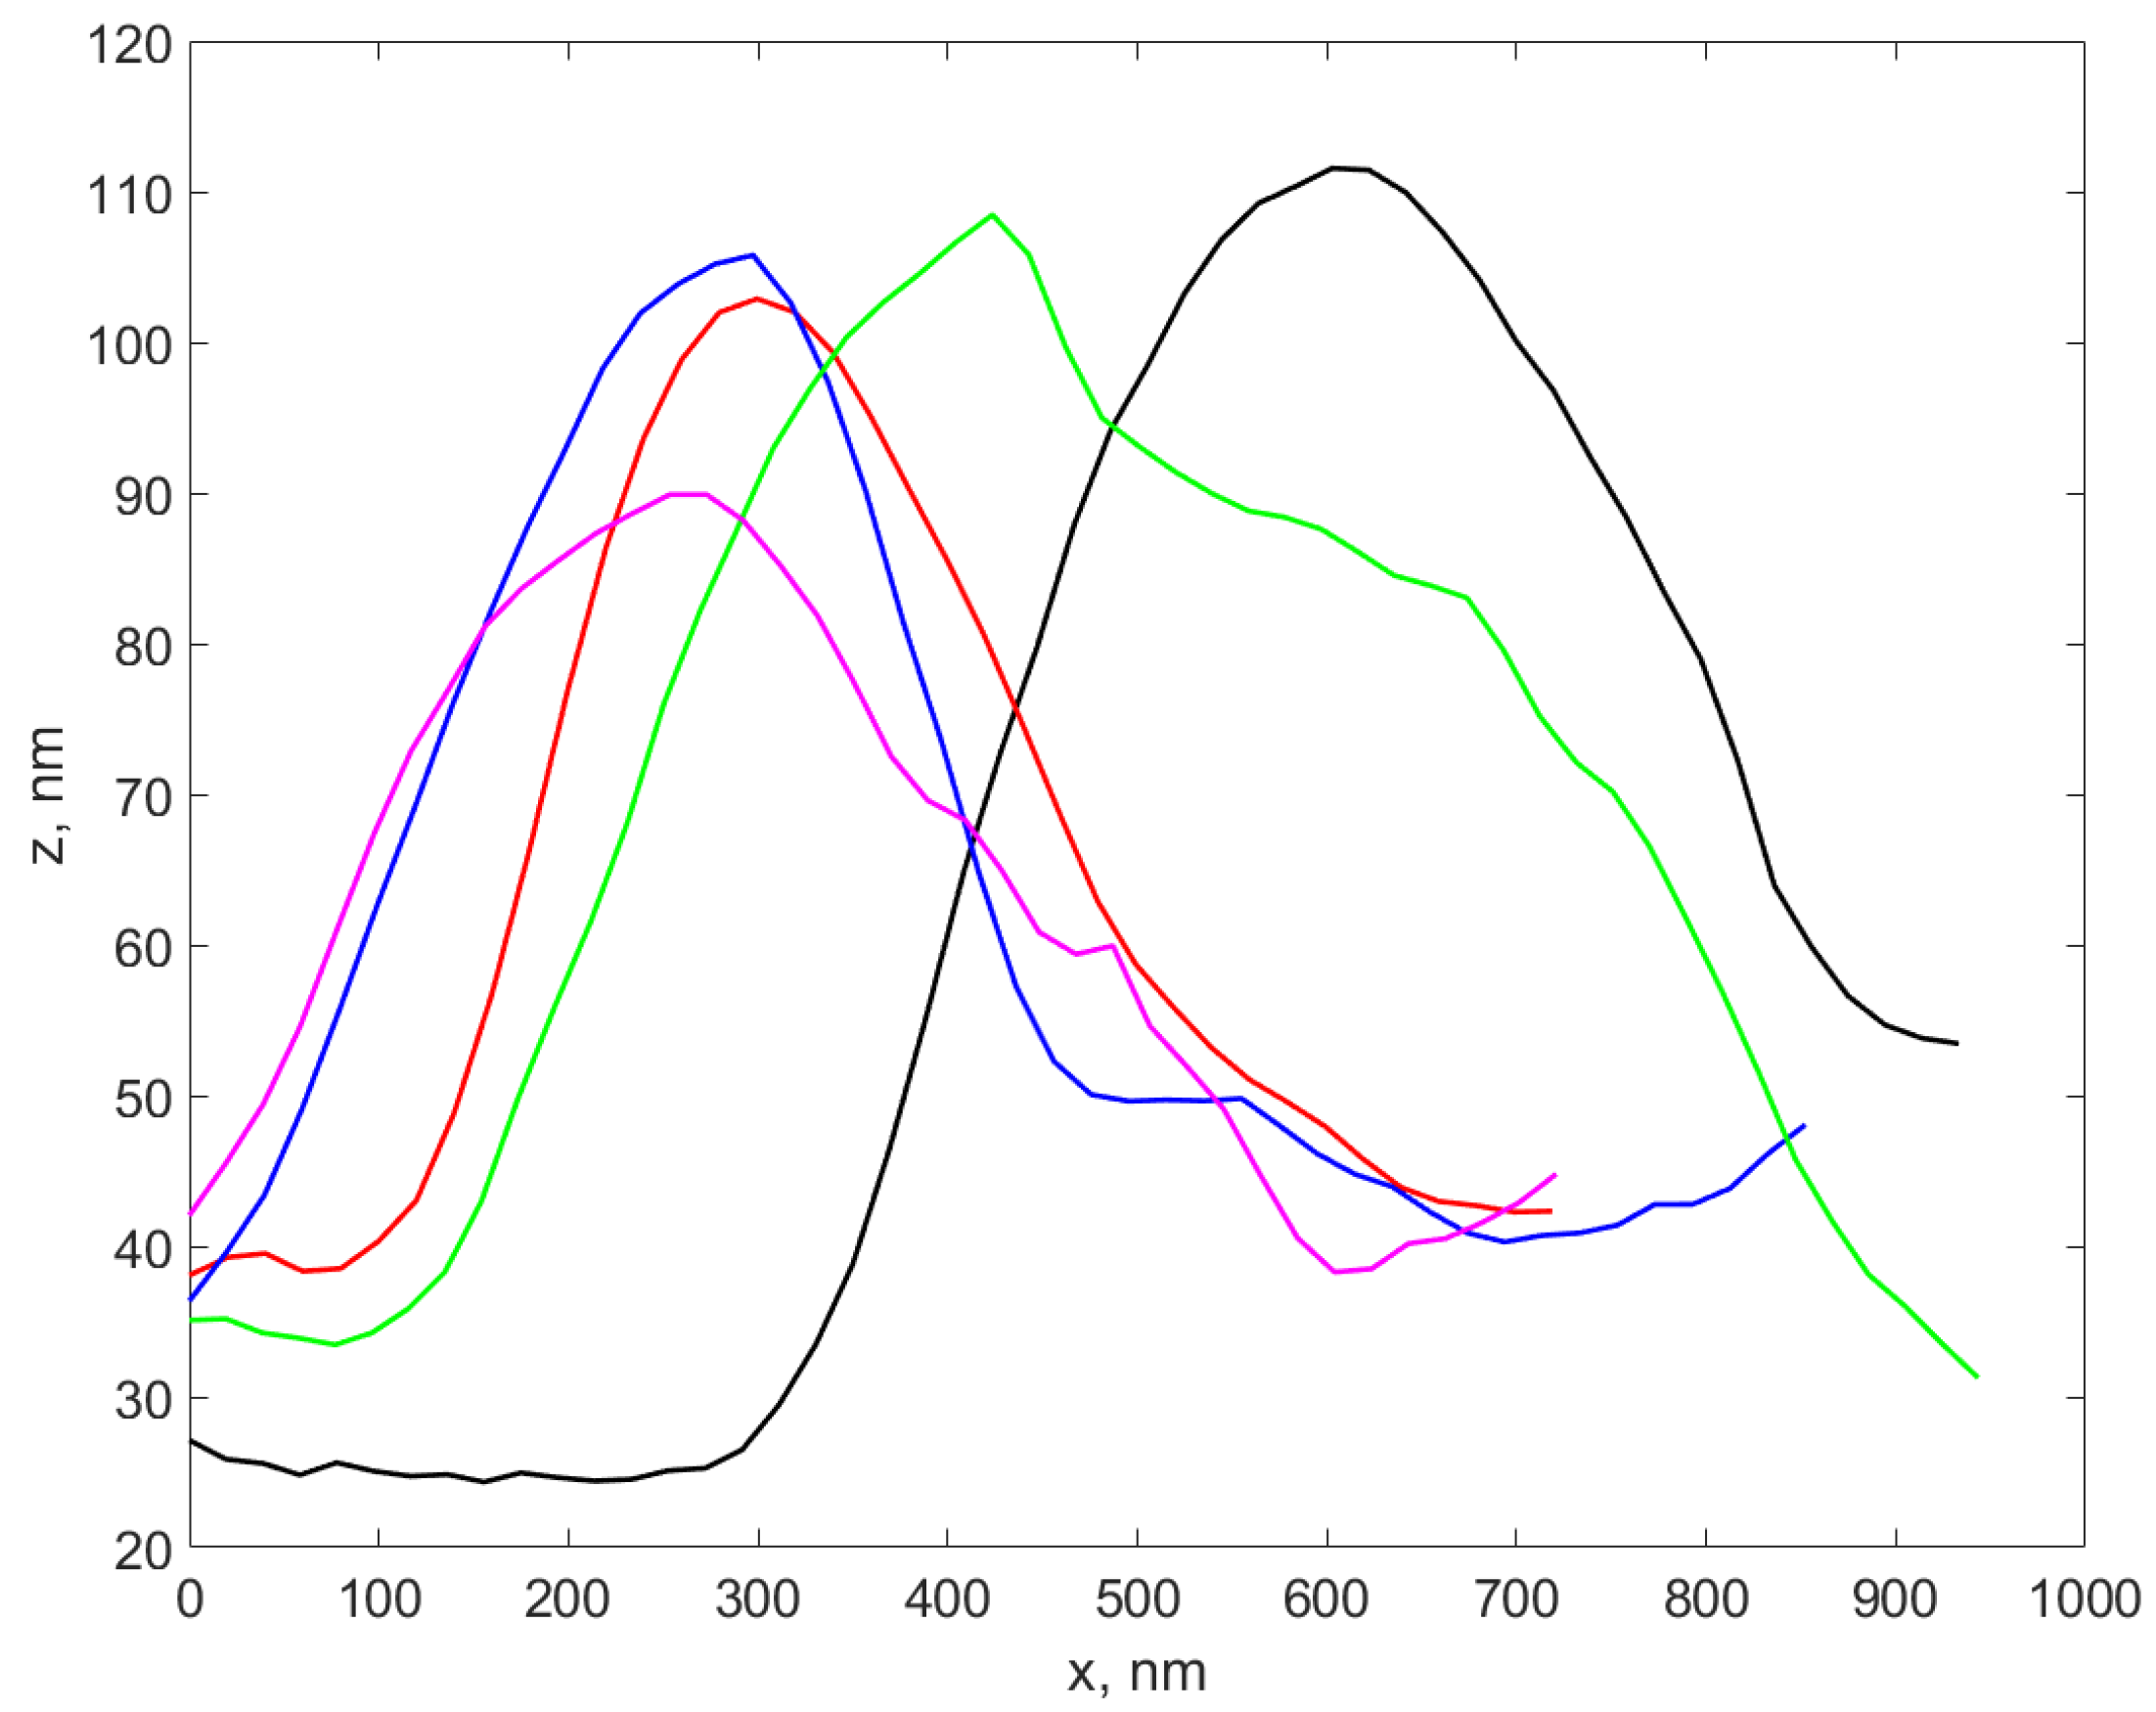
2.3.1. AFM Procedure
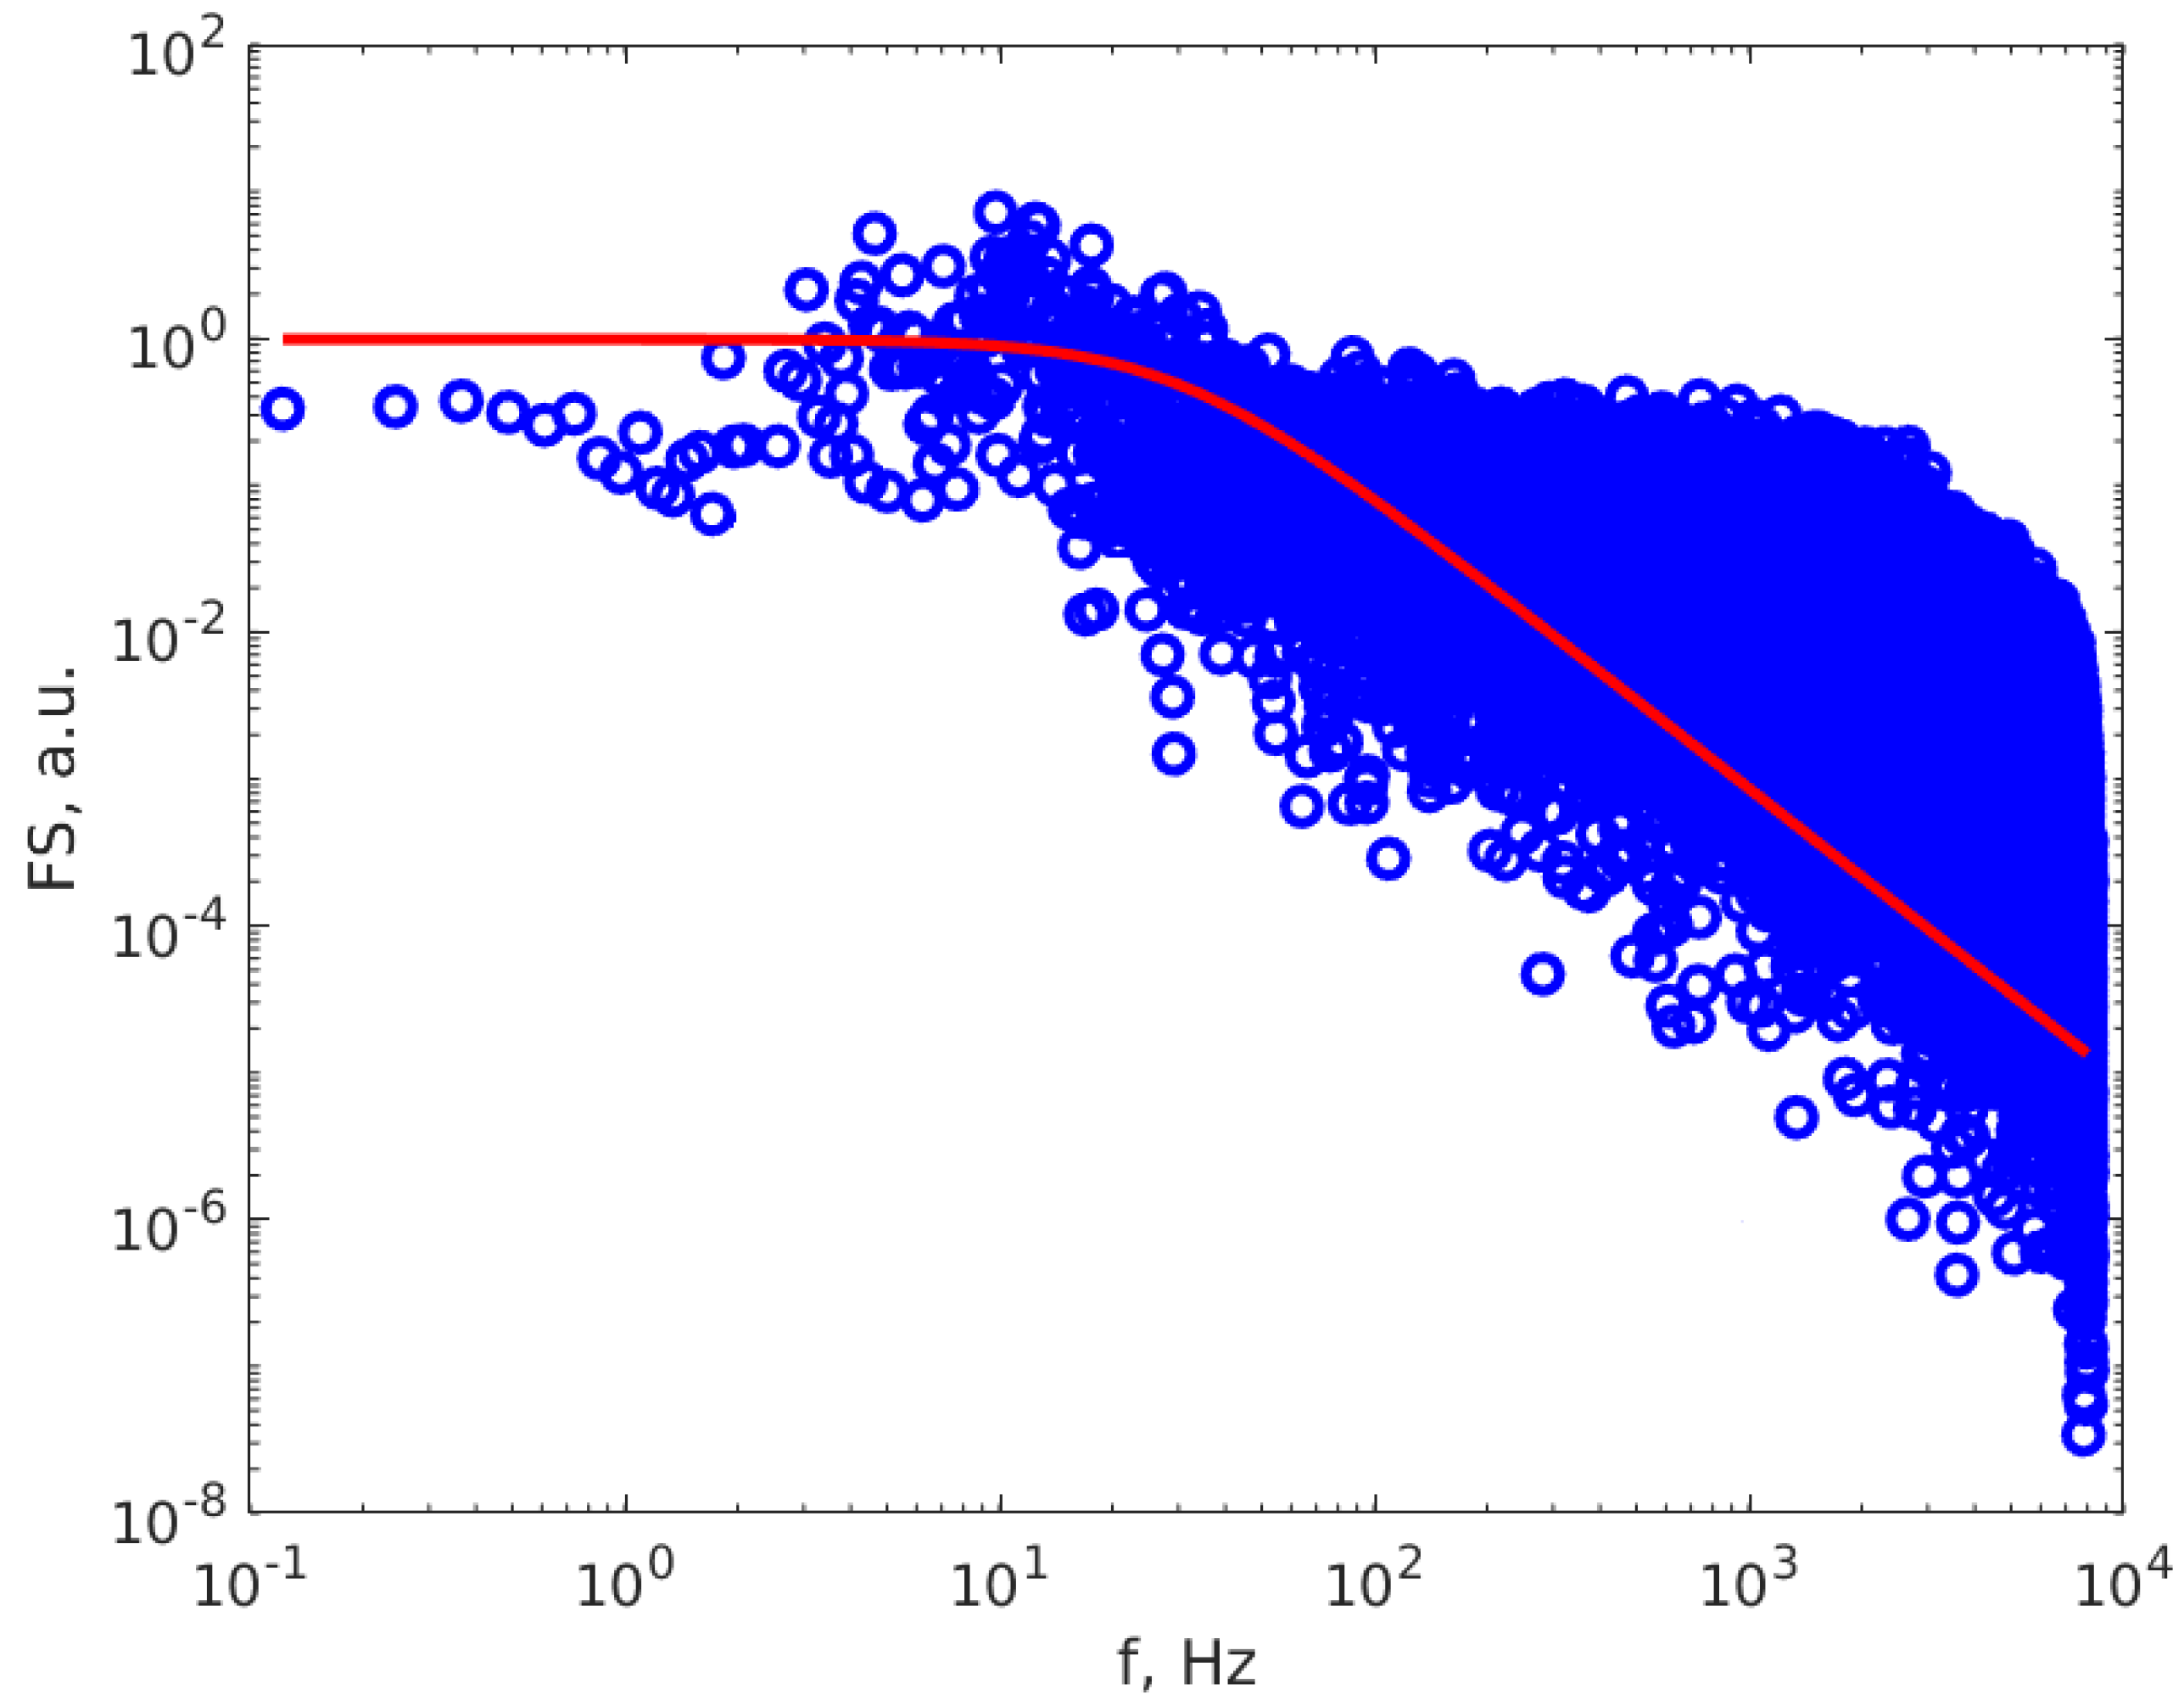
2.3.2. DLS Data Processing Procedure
2.3.3. Viscosity Measurements
2.3.4. UV–VIS Spectroscopy
2.3.5. ATR-FTIR Spectroscopy
2.3.6. Antibacterial Test
3. Results and Discussion
3.1. AFM Results
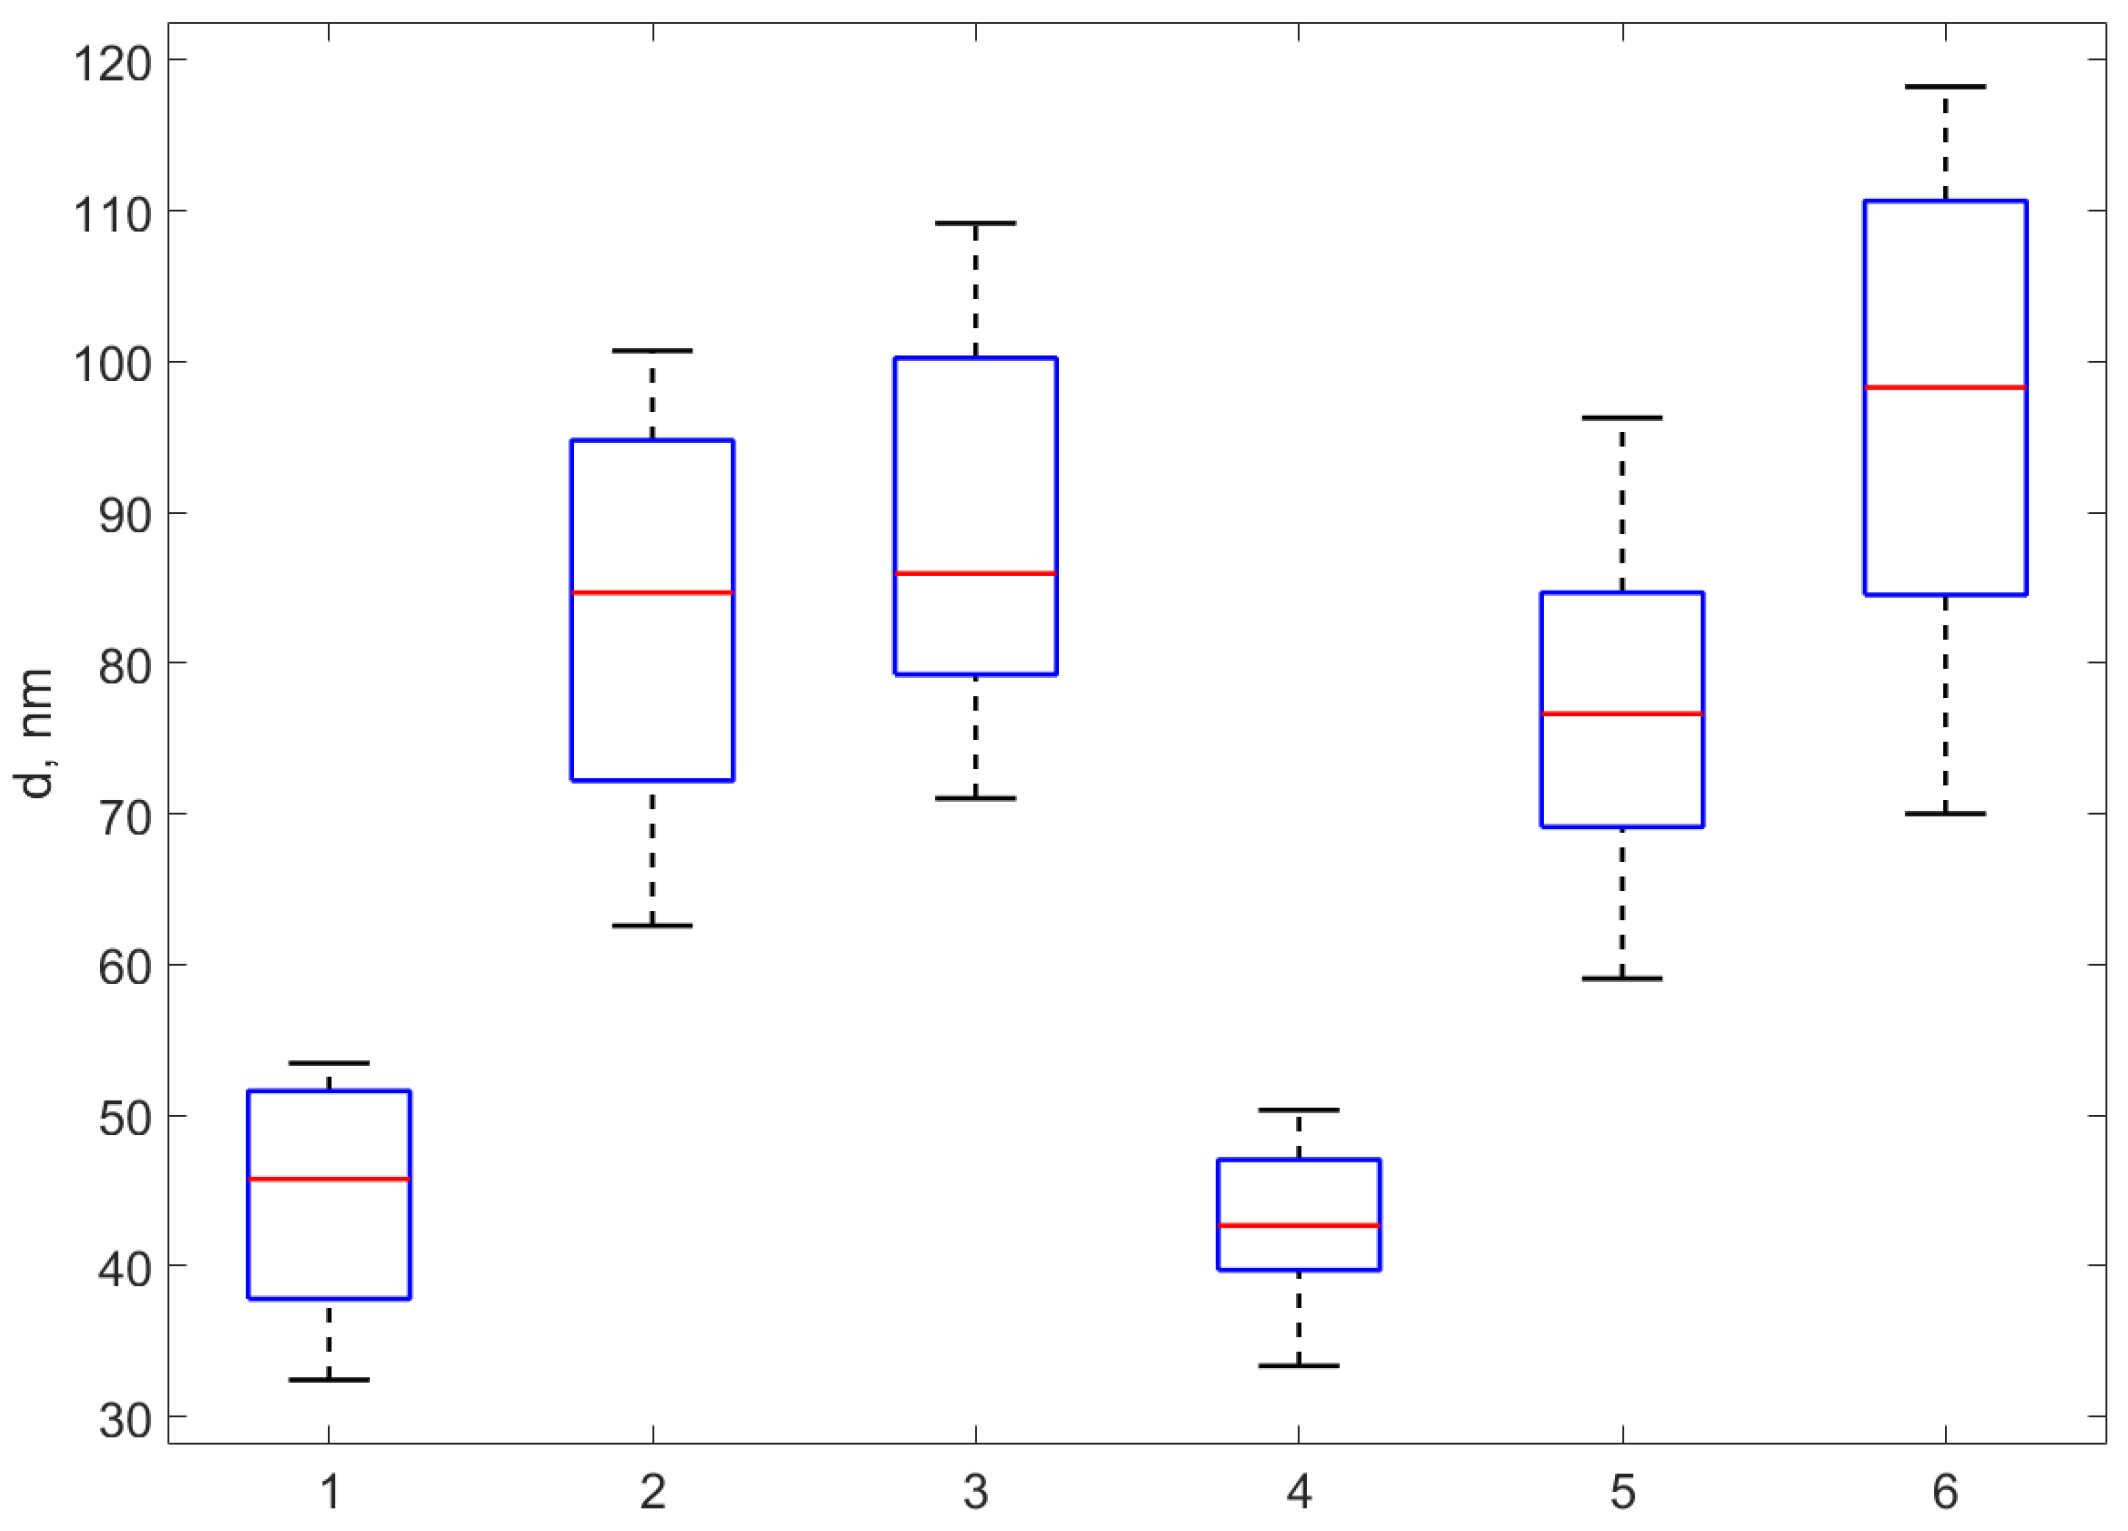
3.2. DLS Particle Sizing Results
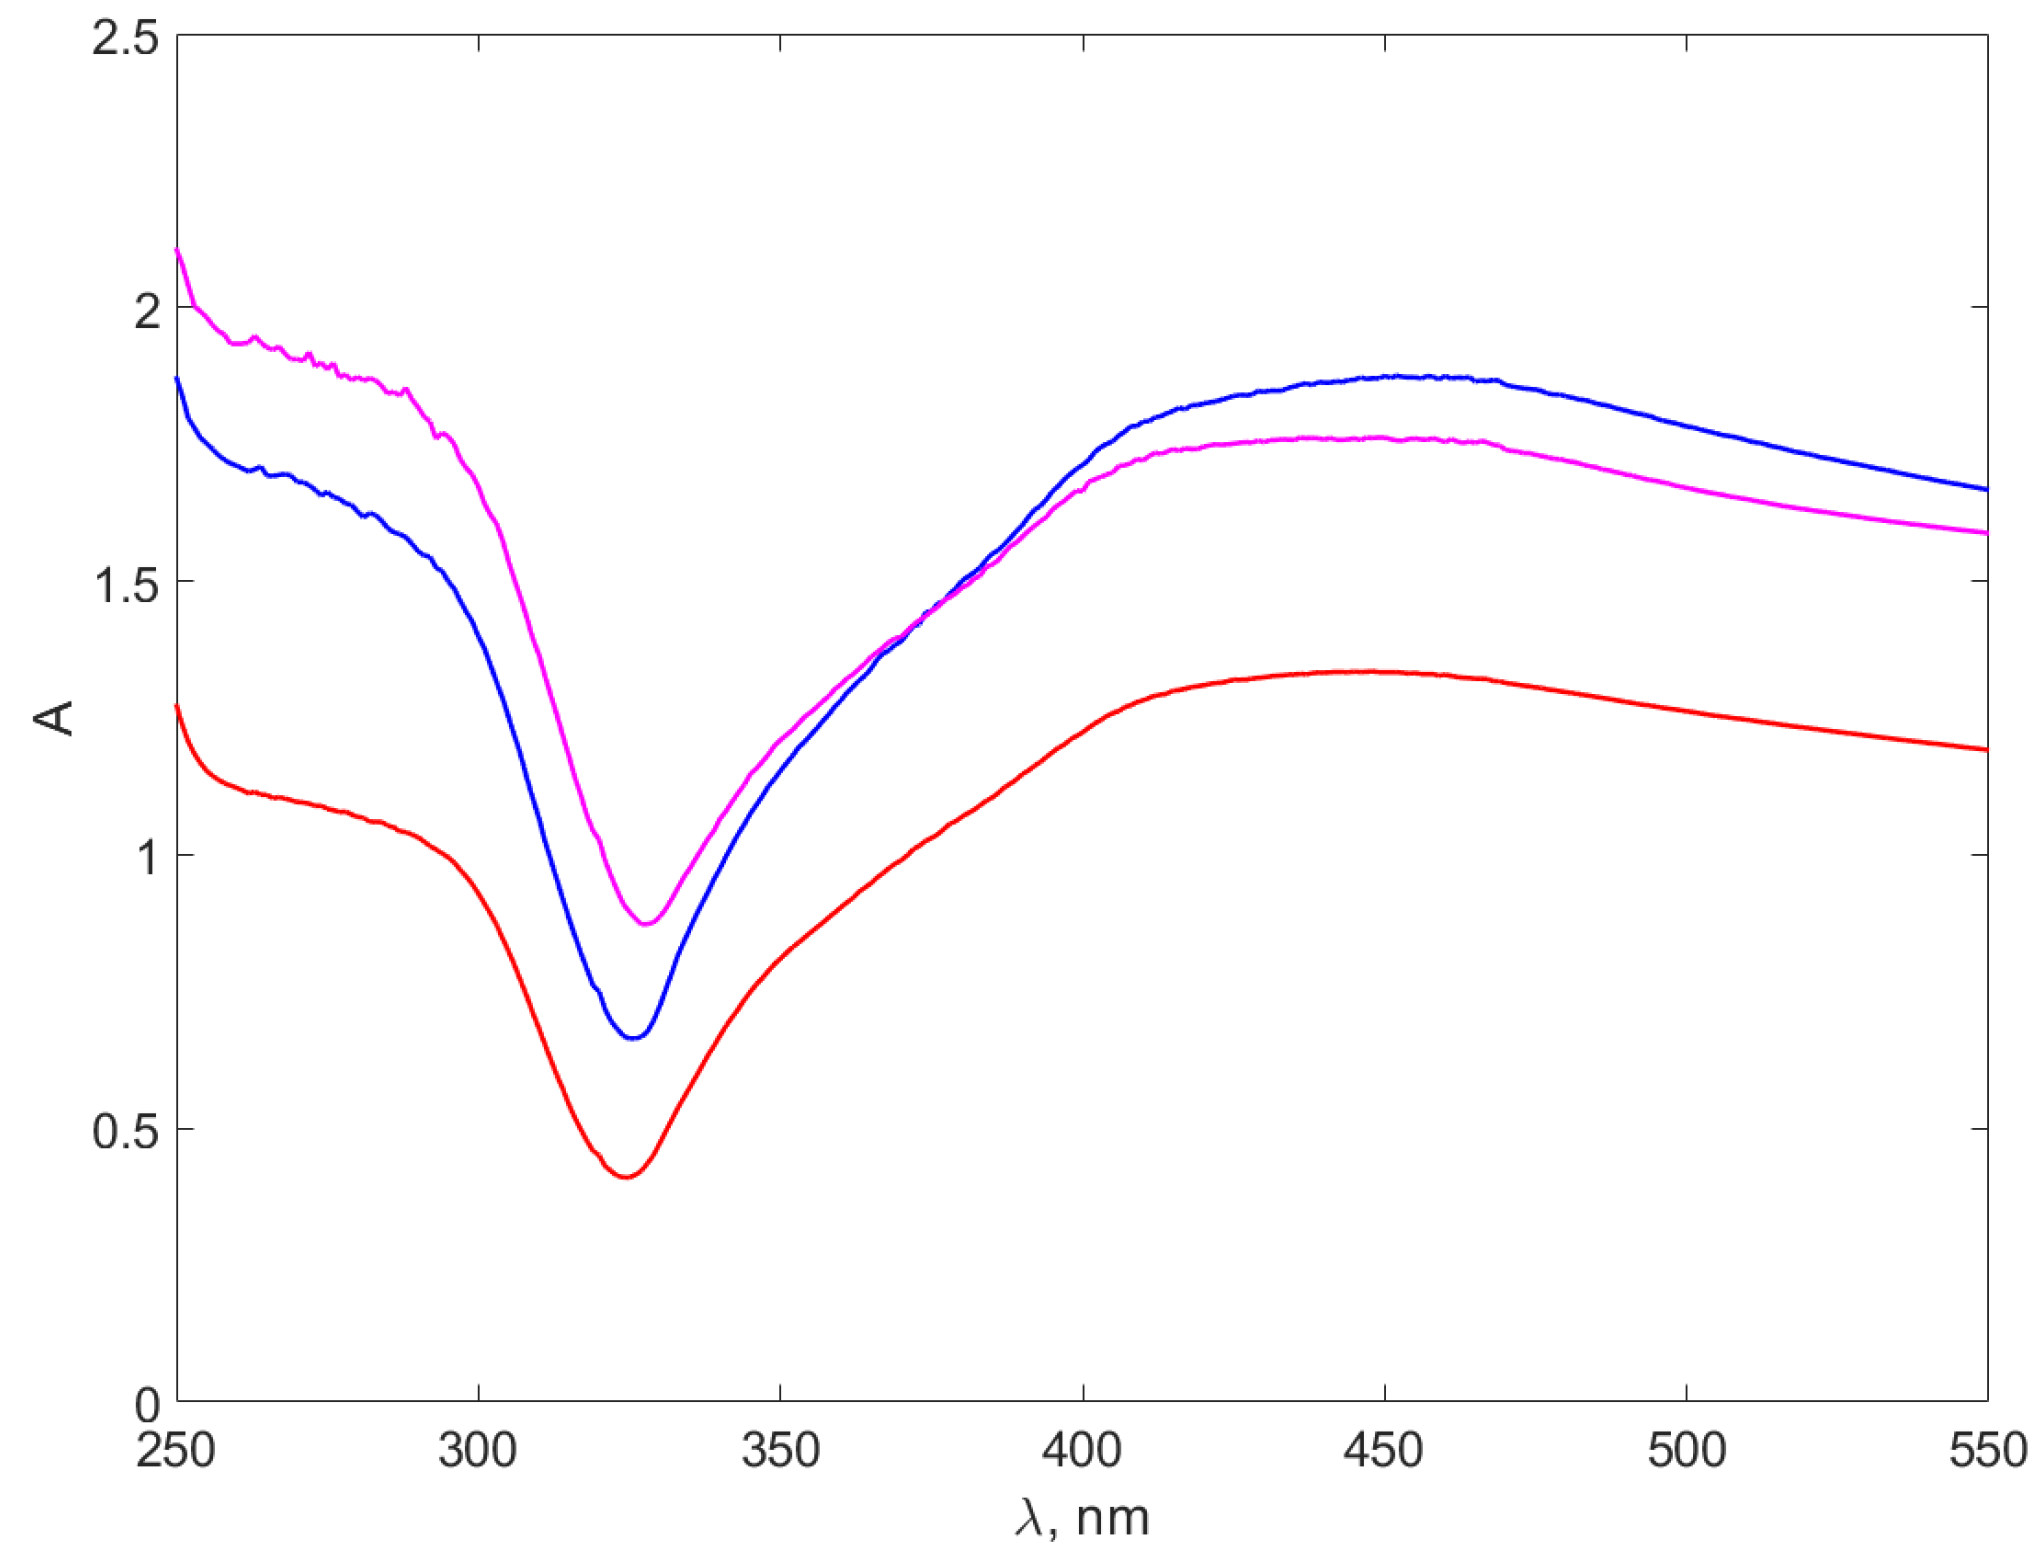
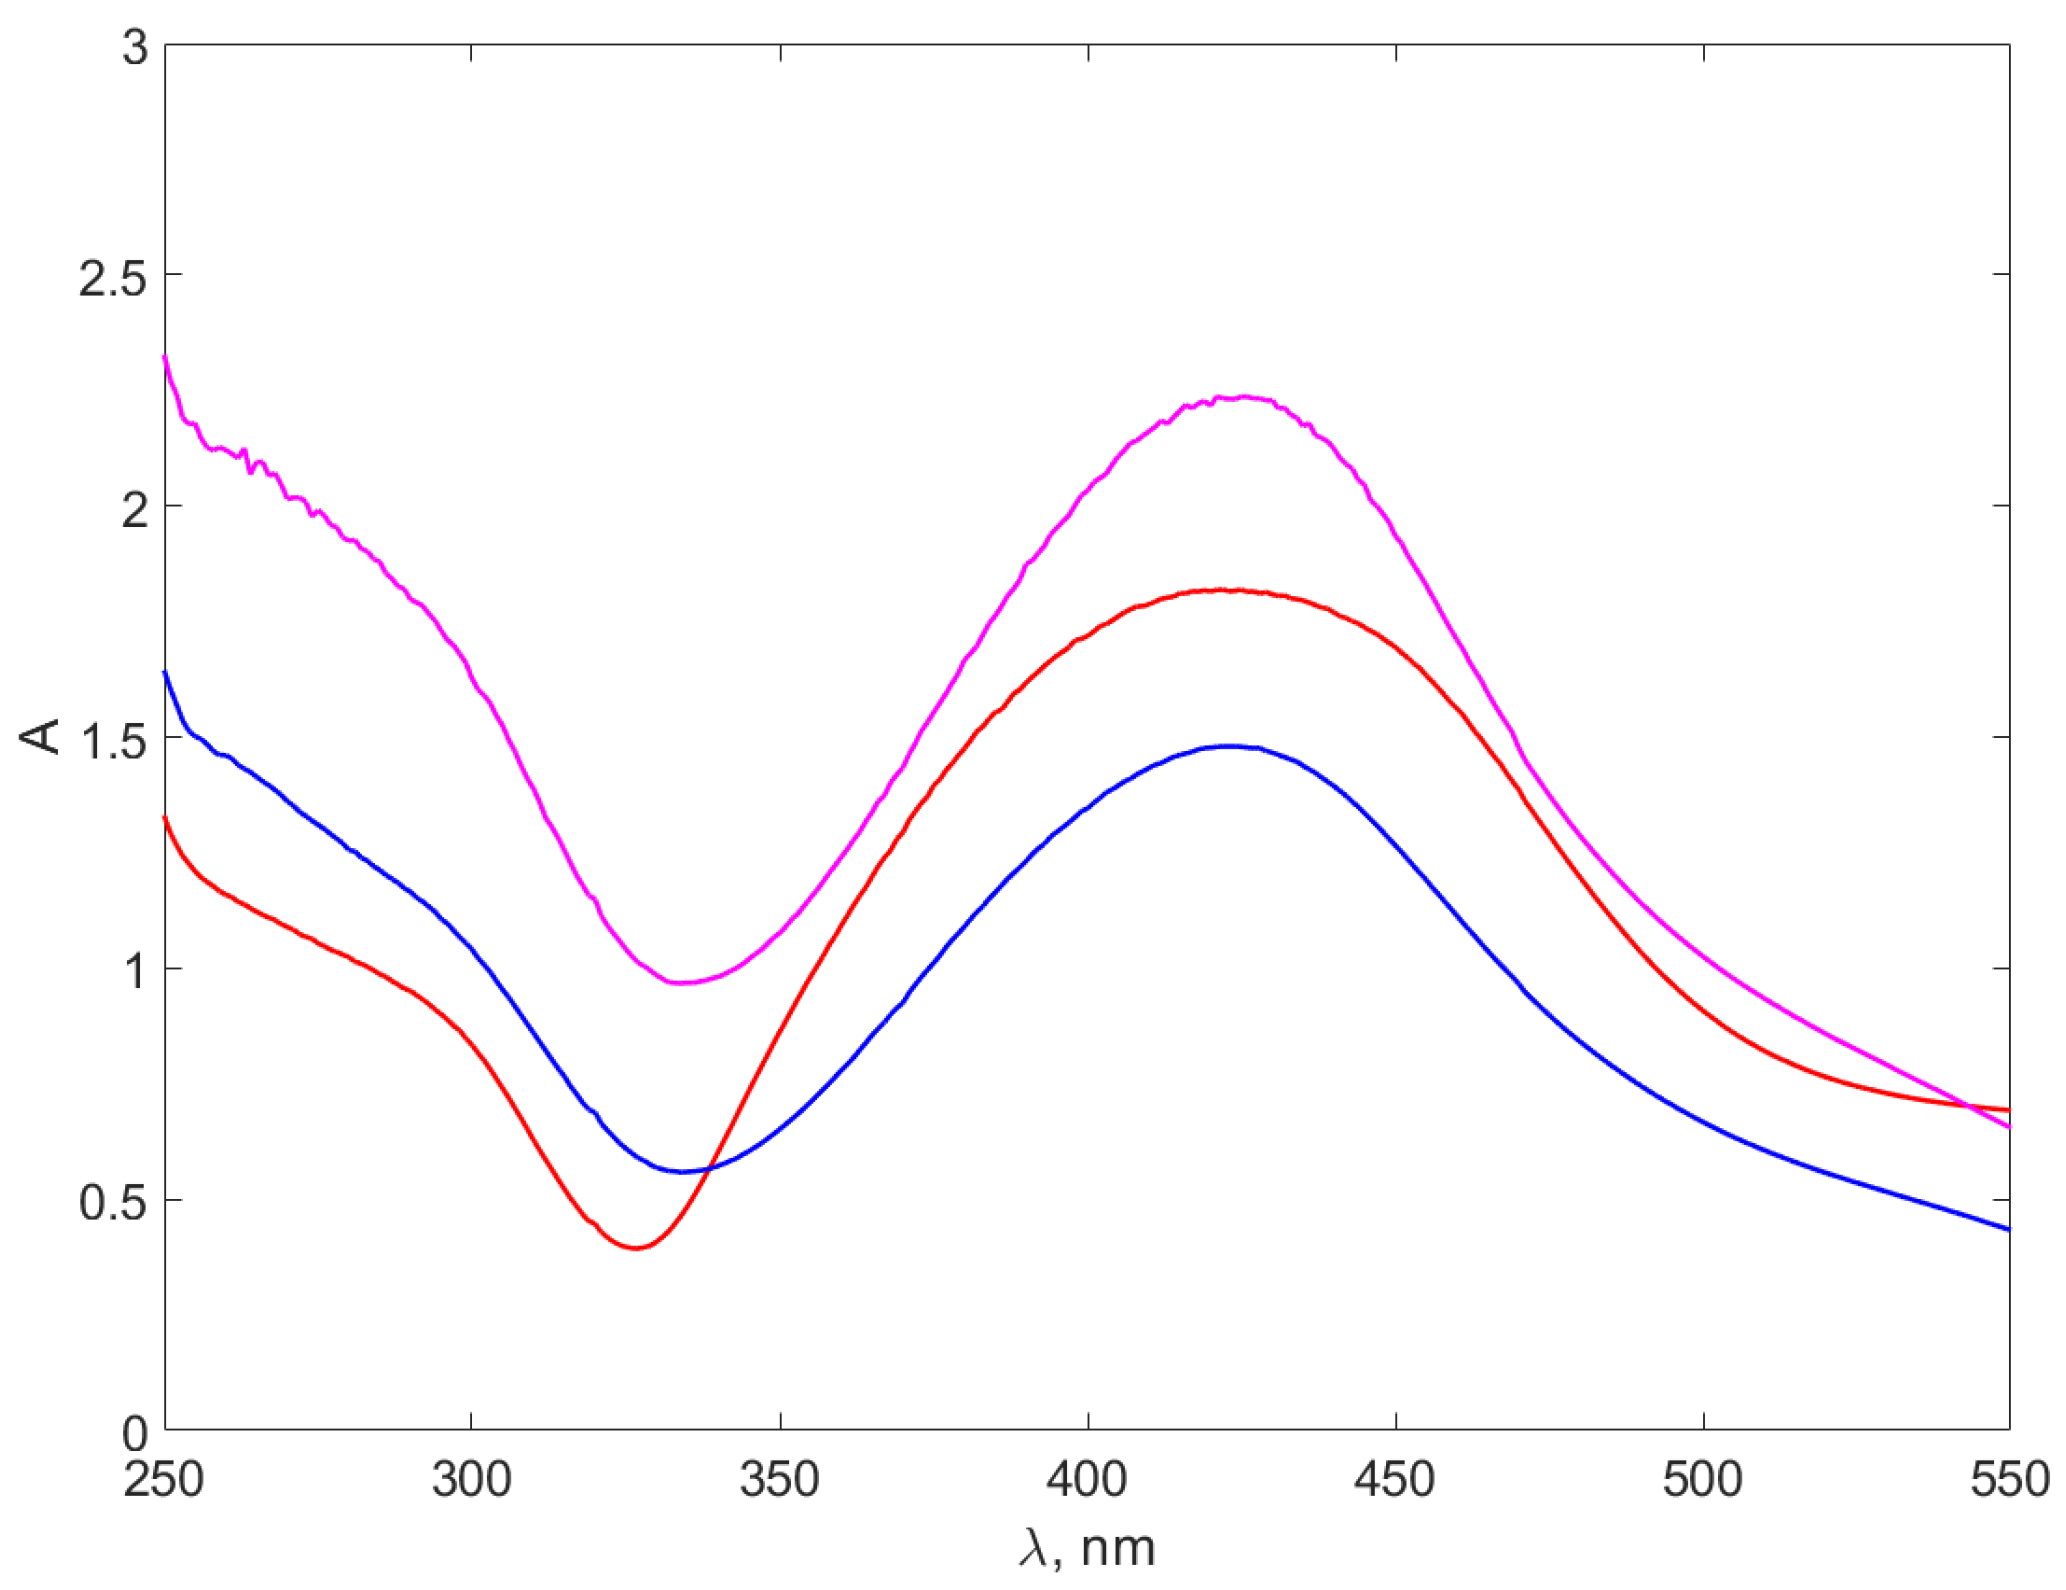
3.3. UV–VIS Results
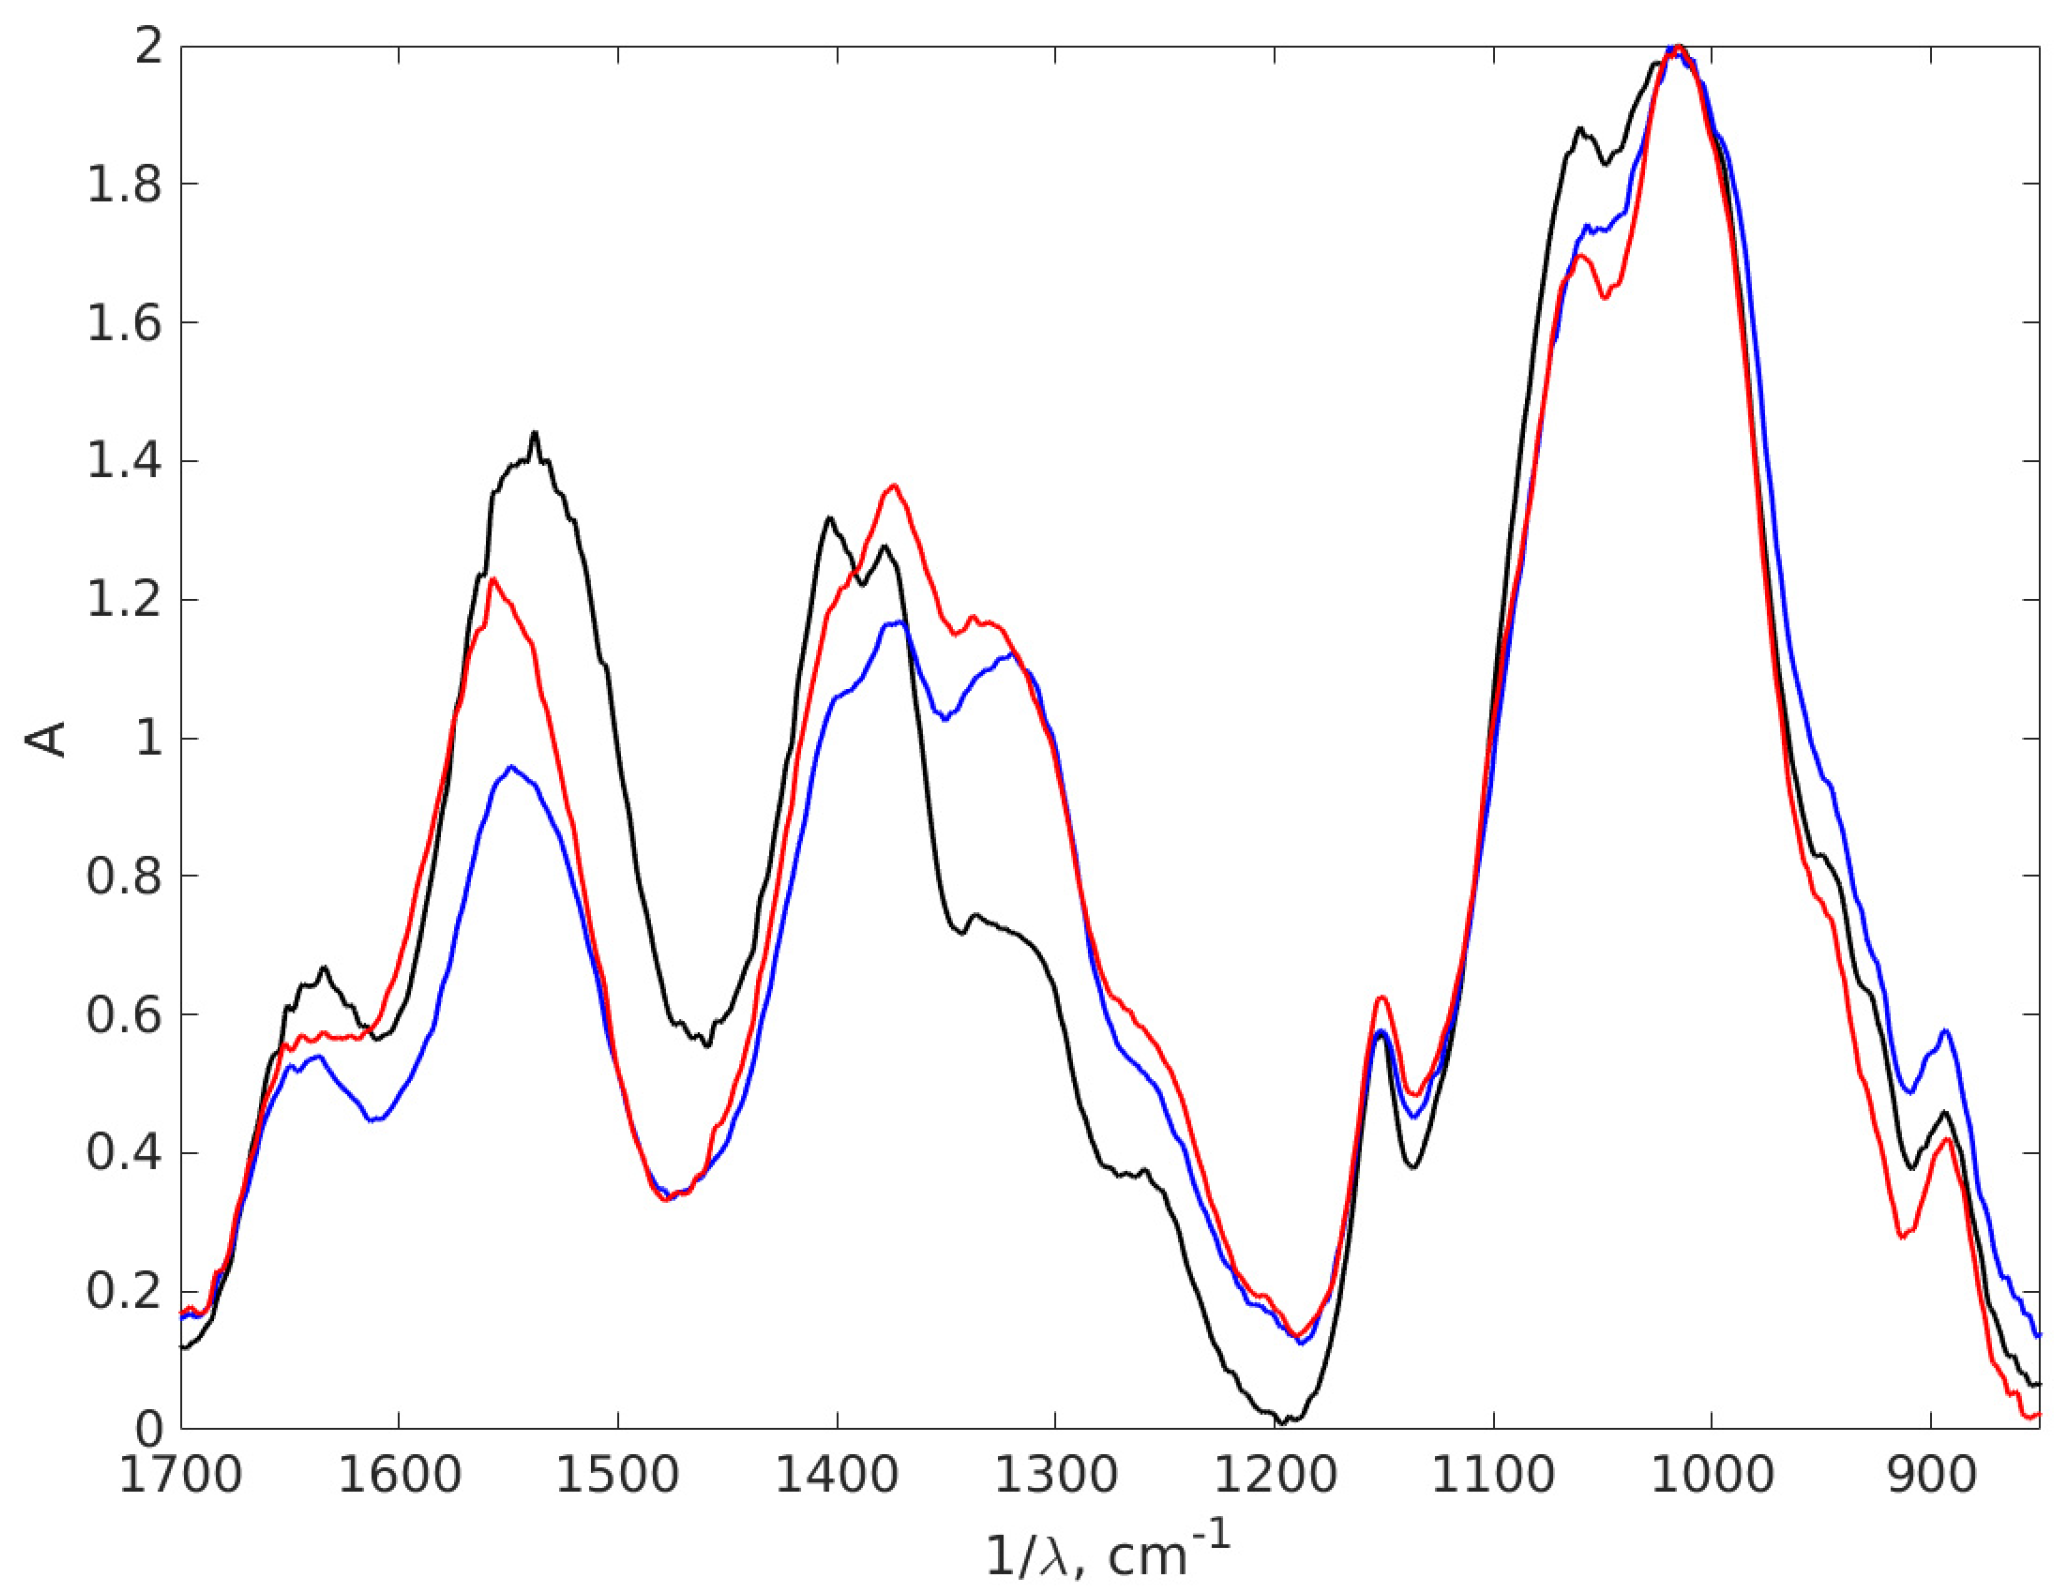
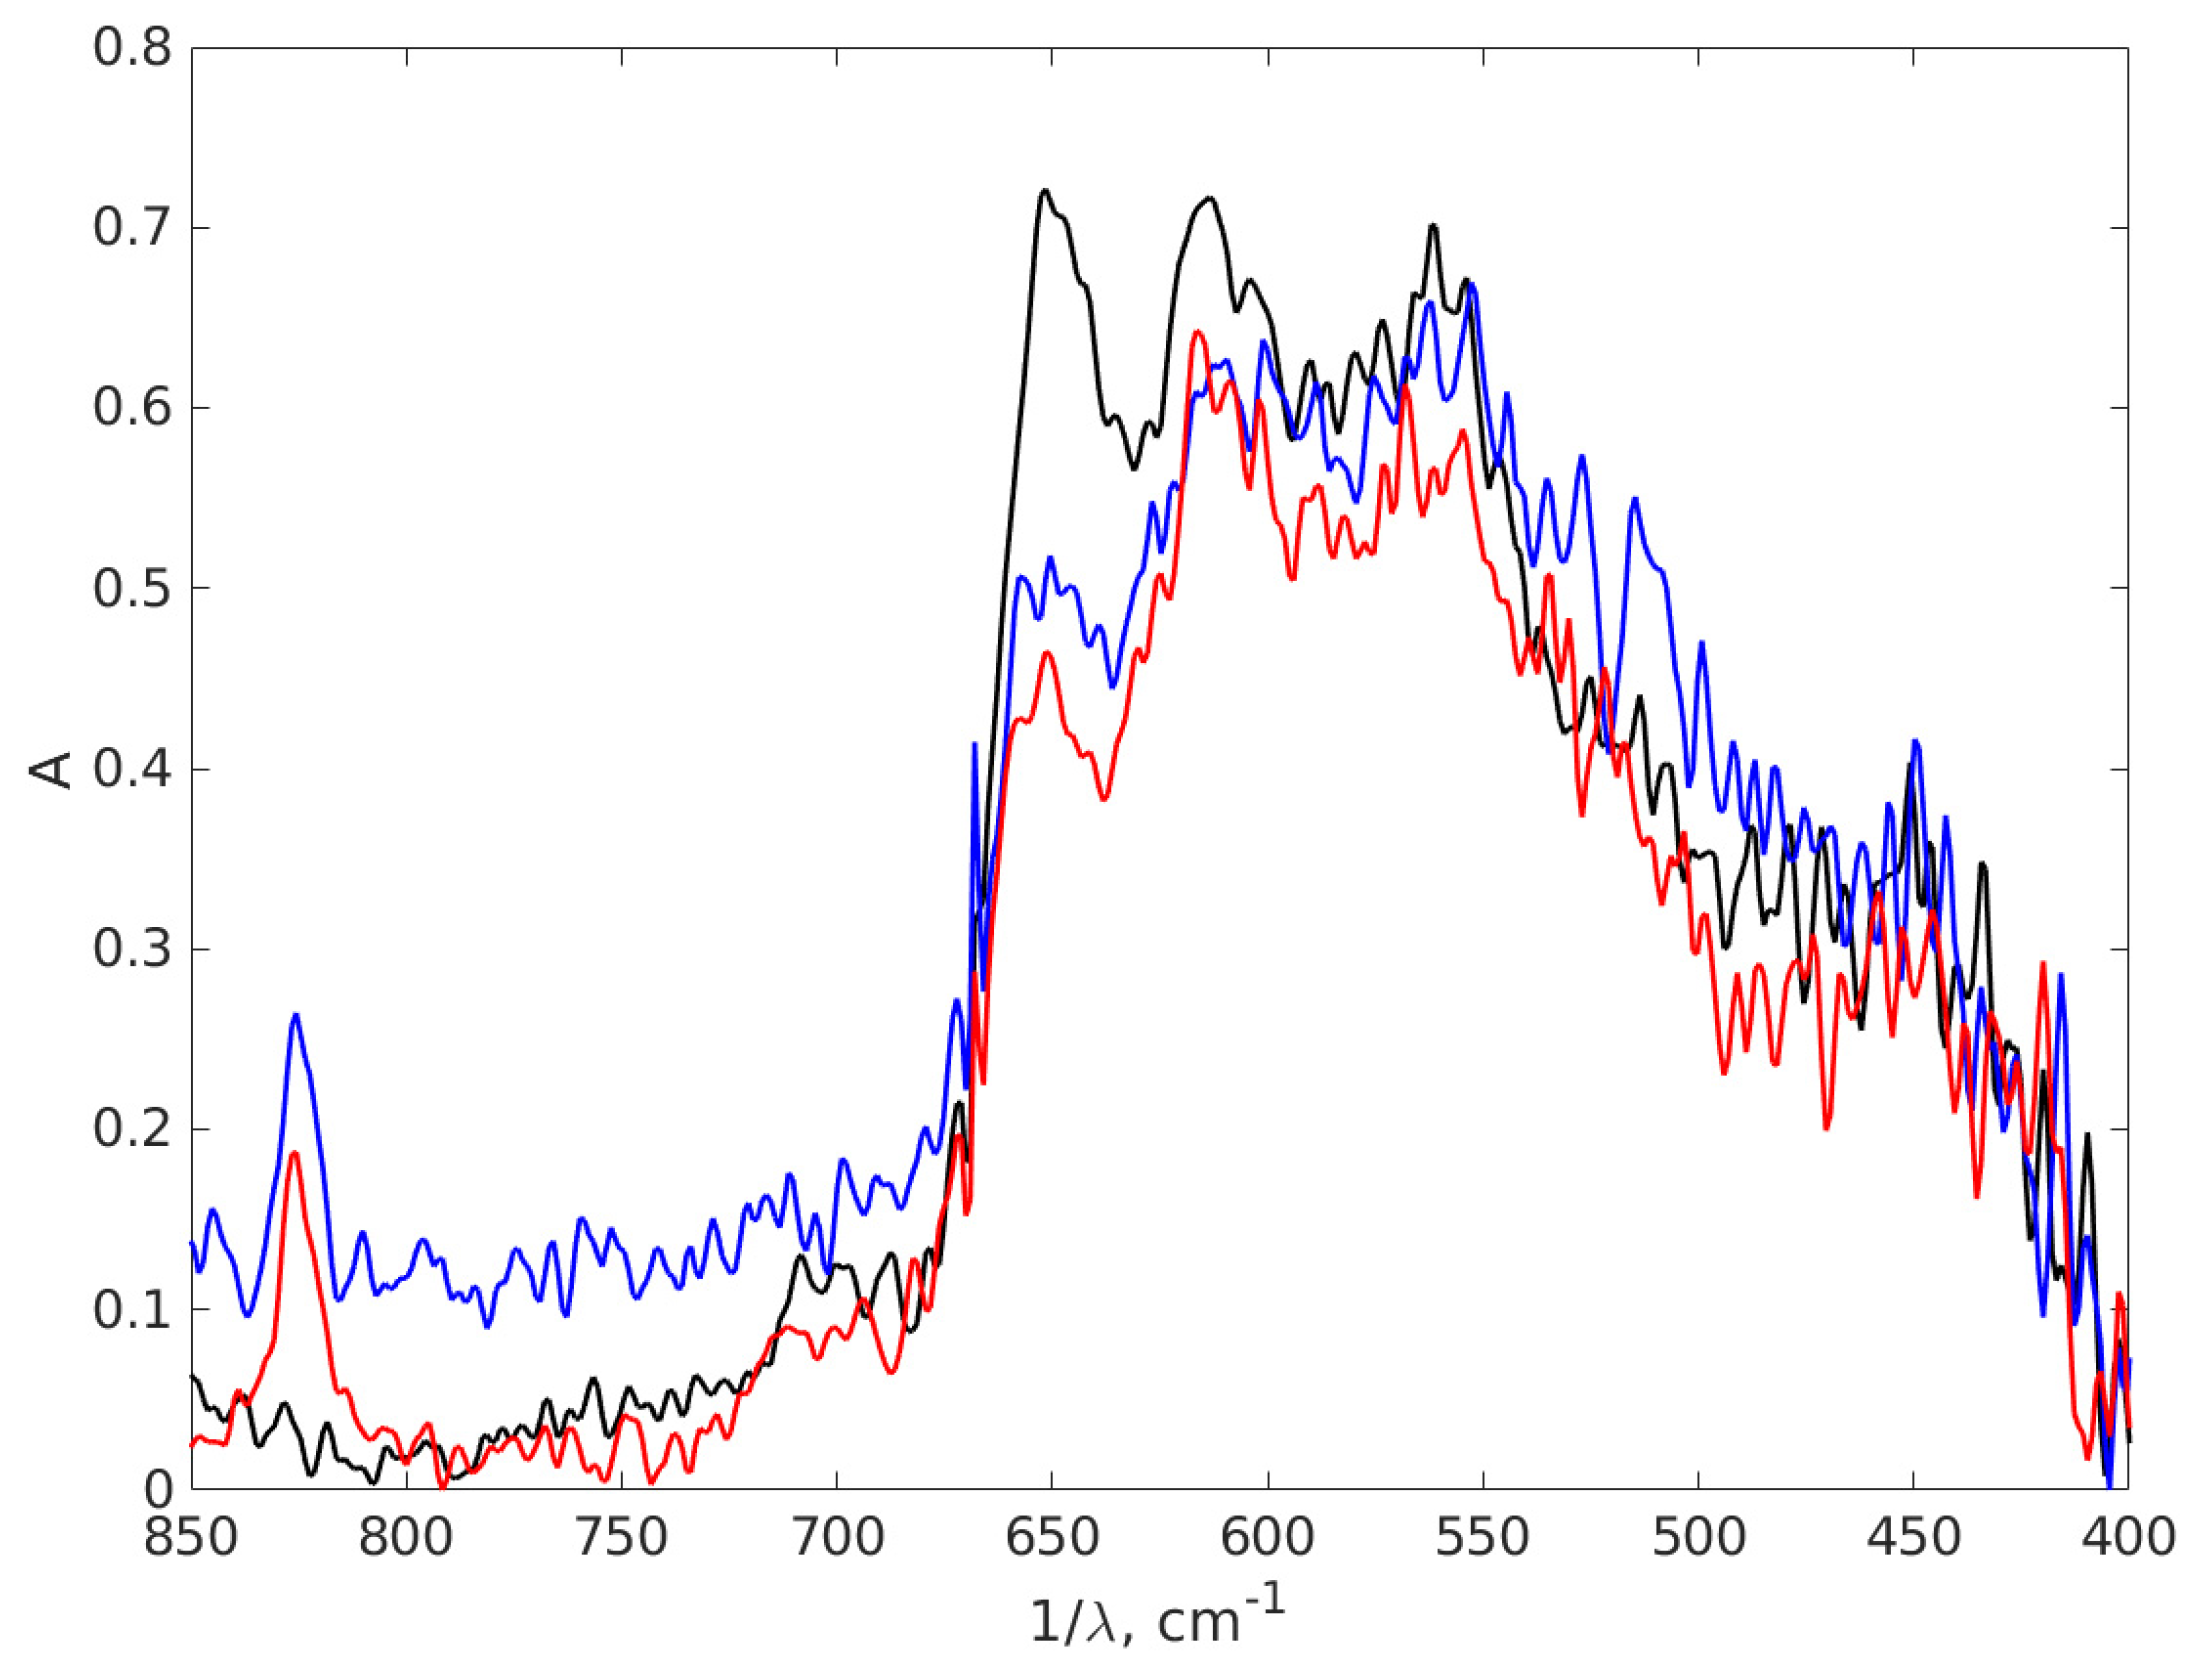
3.4. FT-IR Results
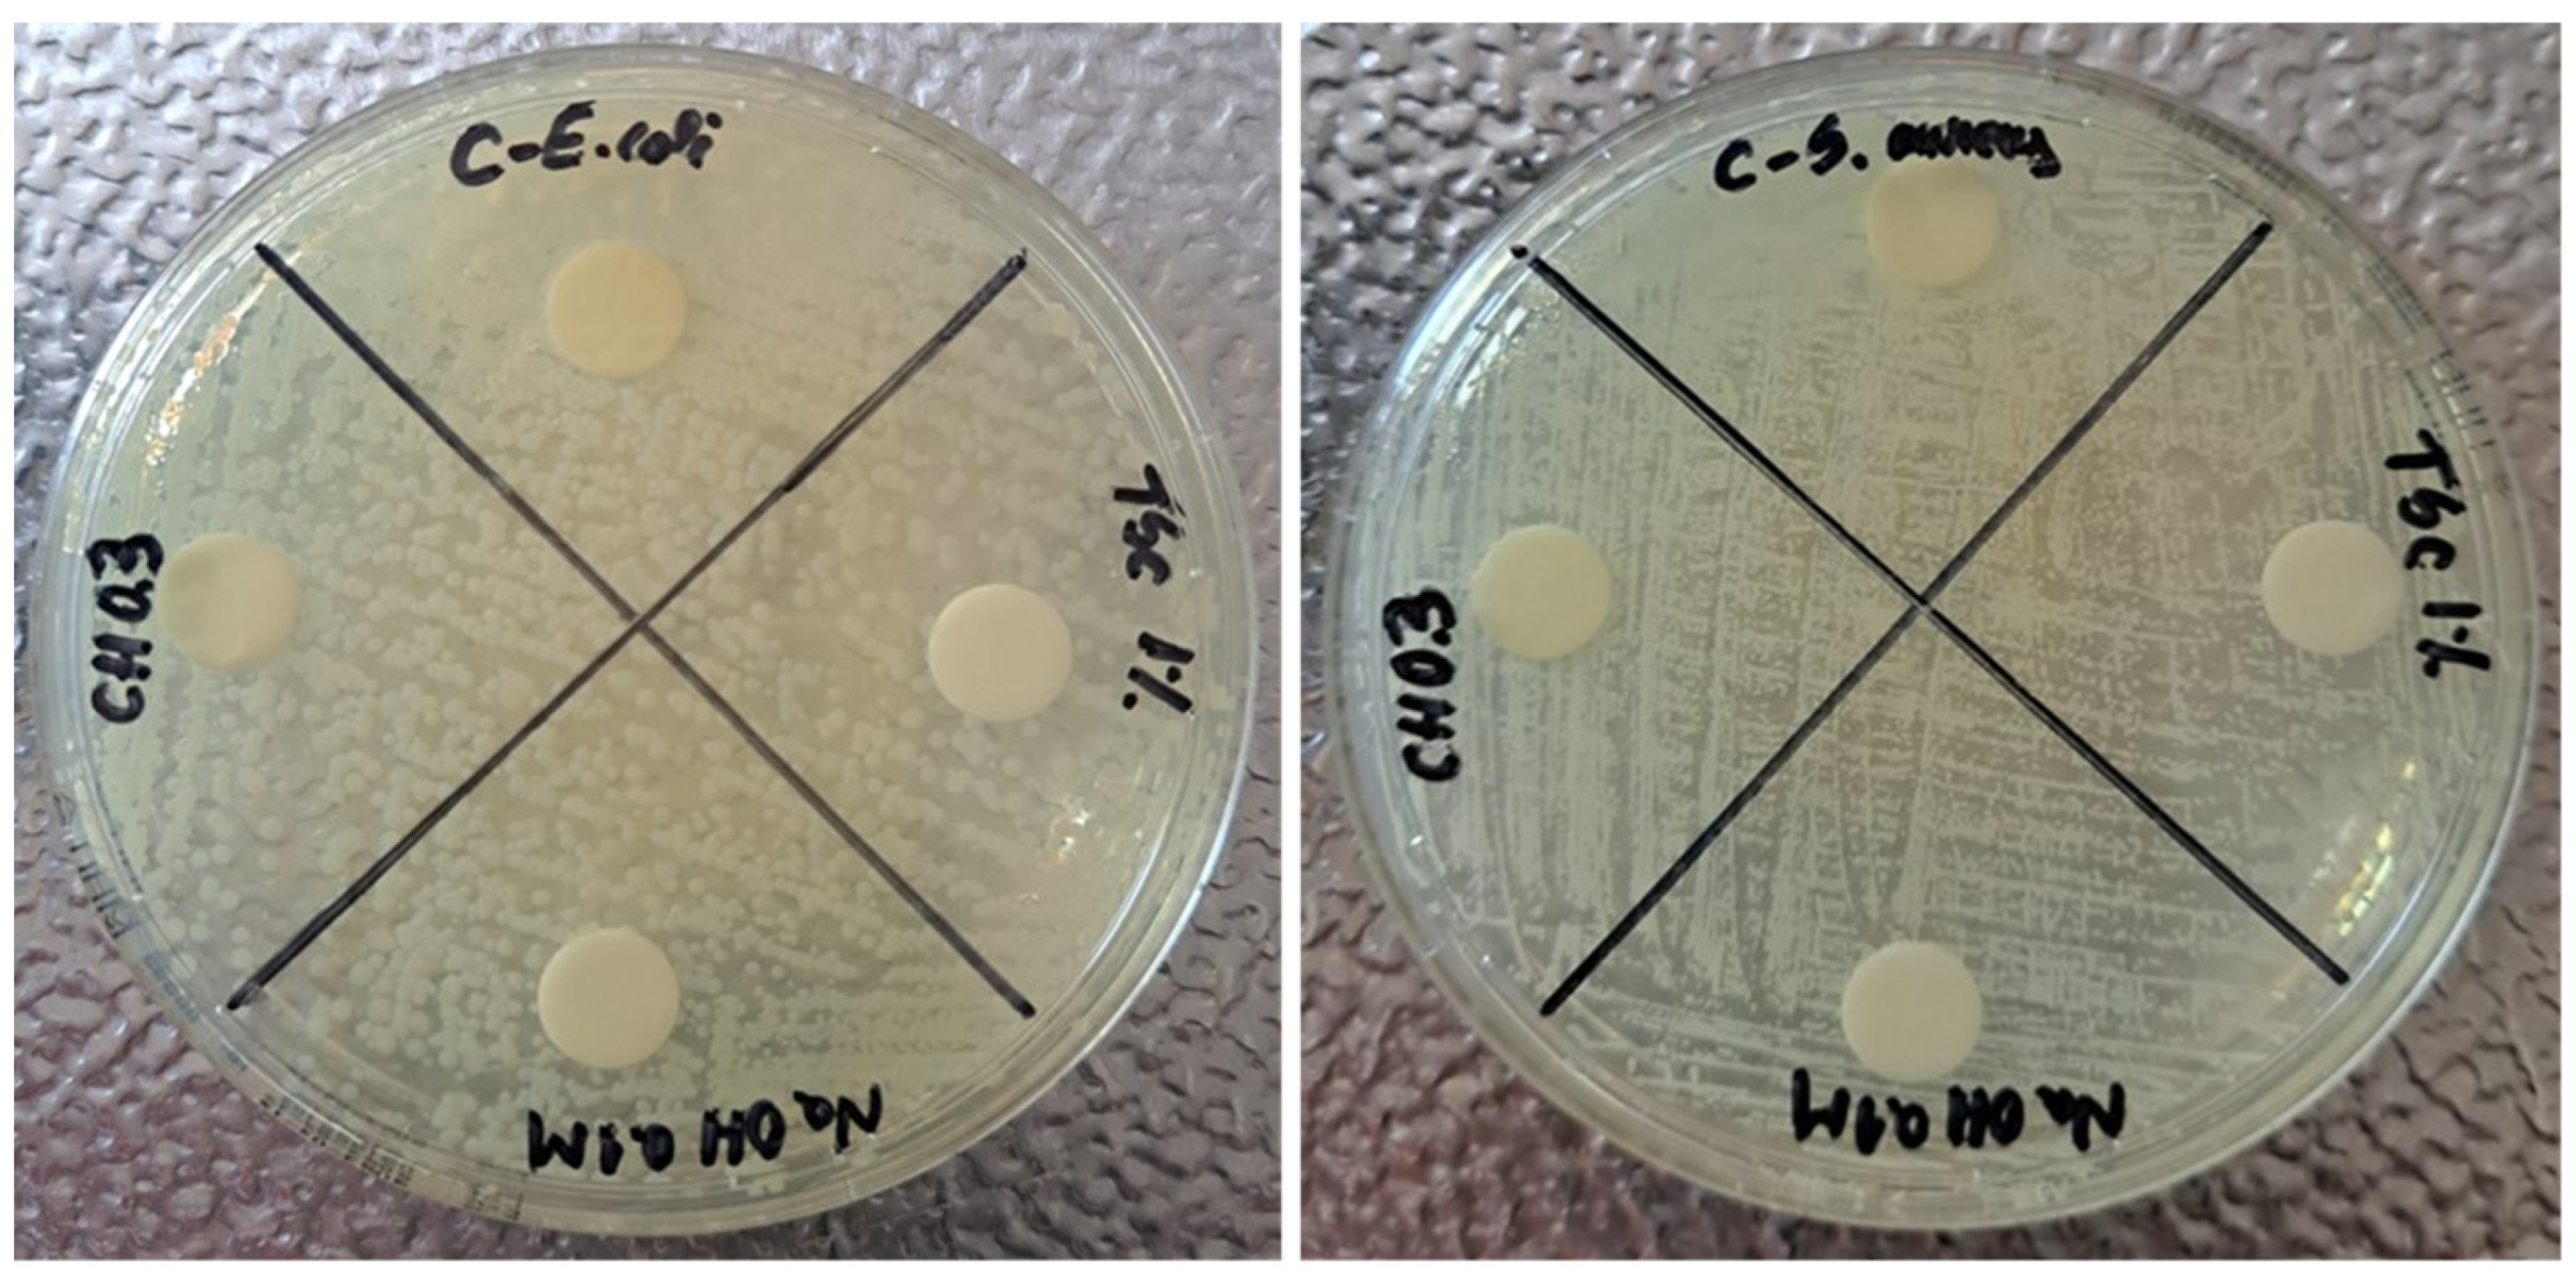
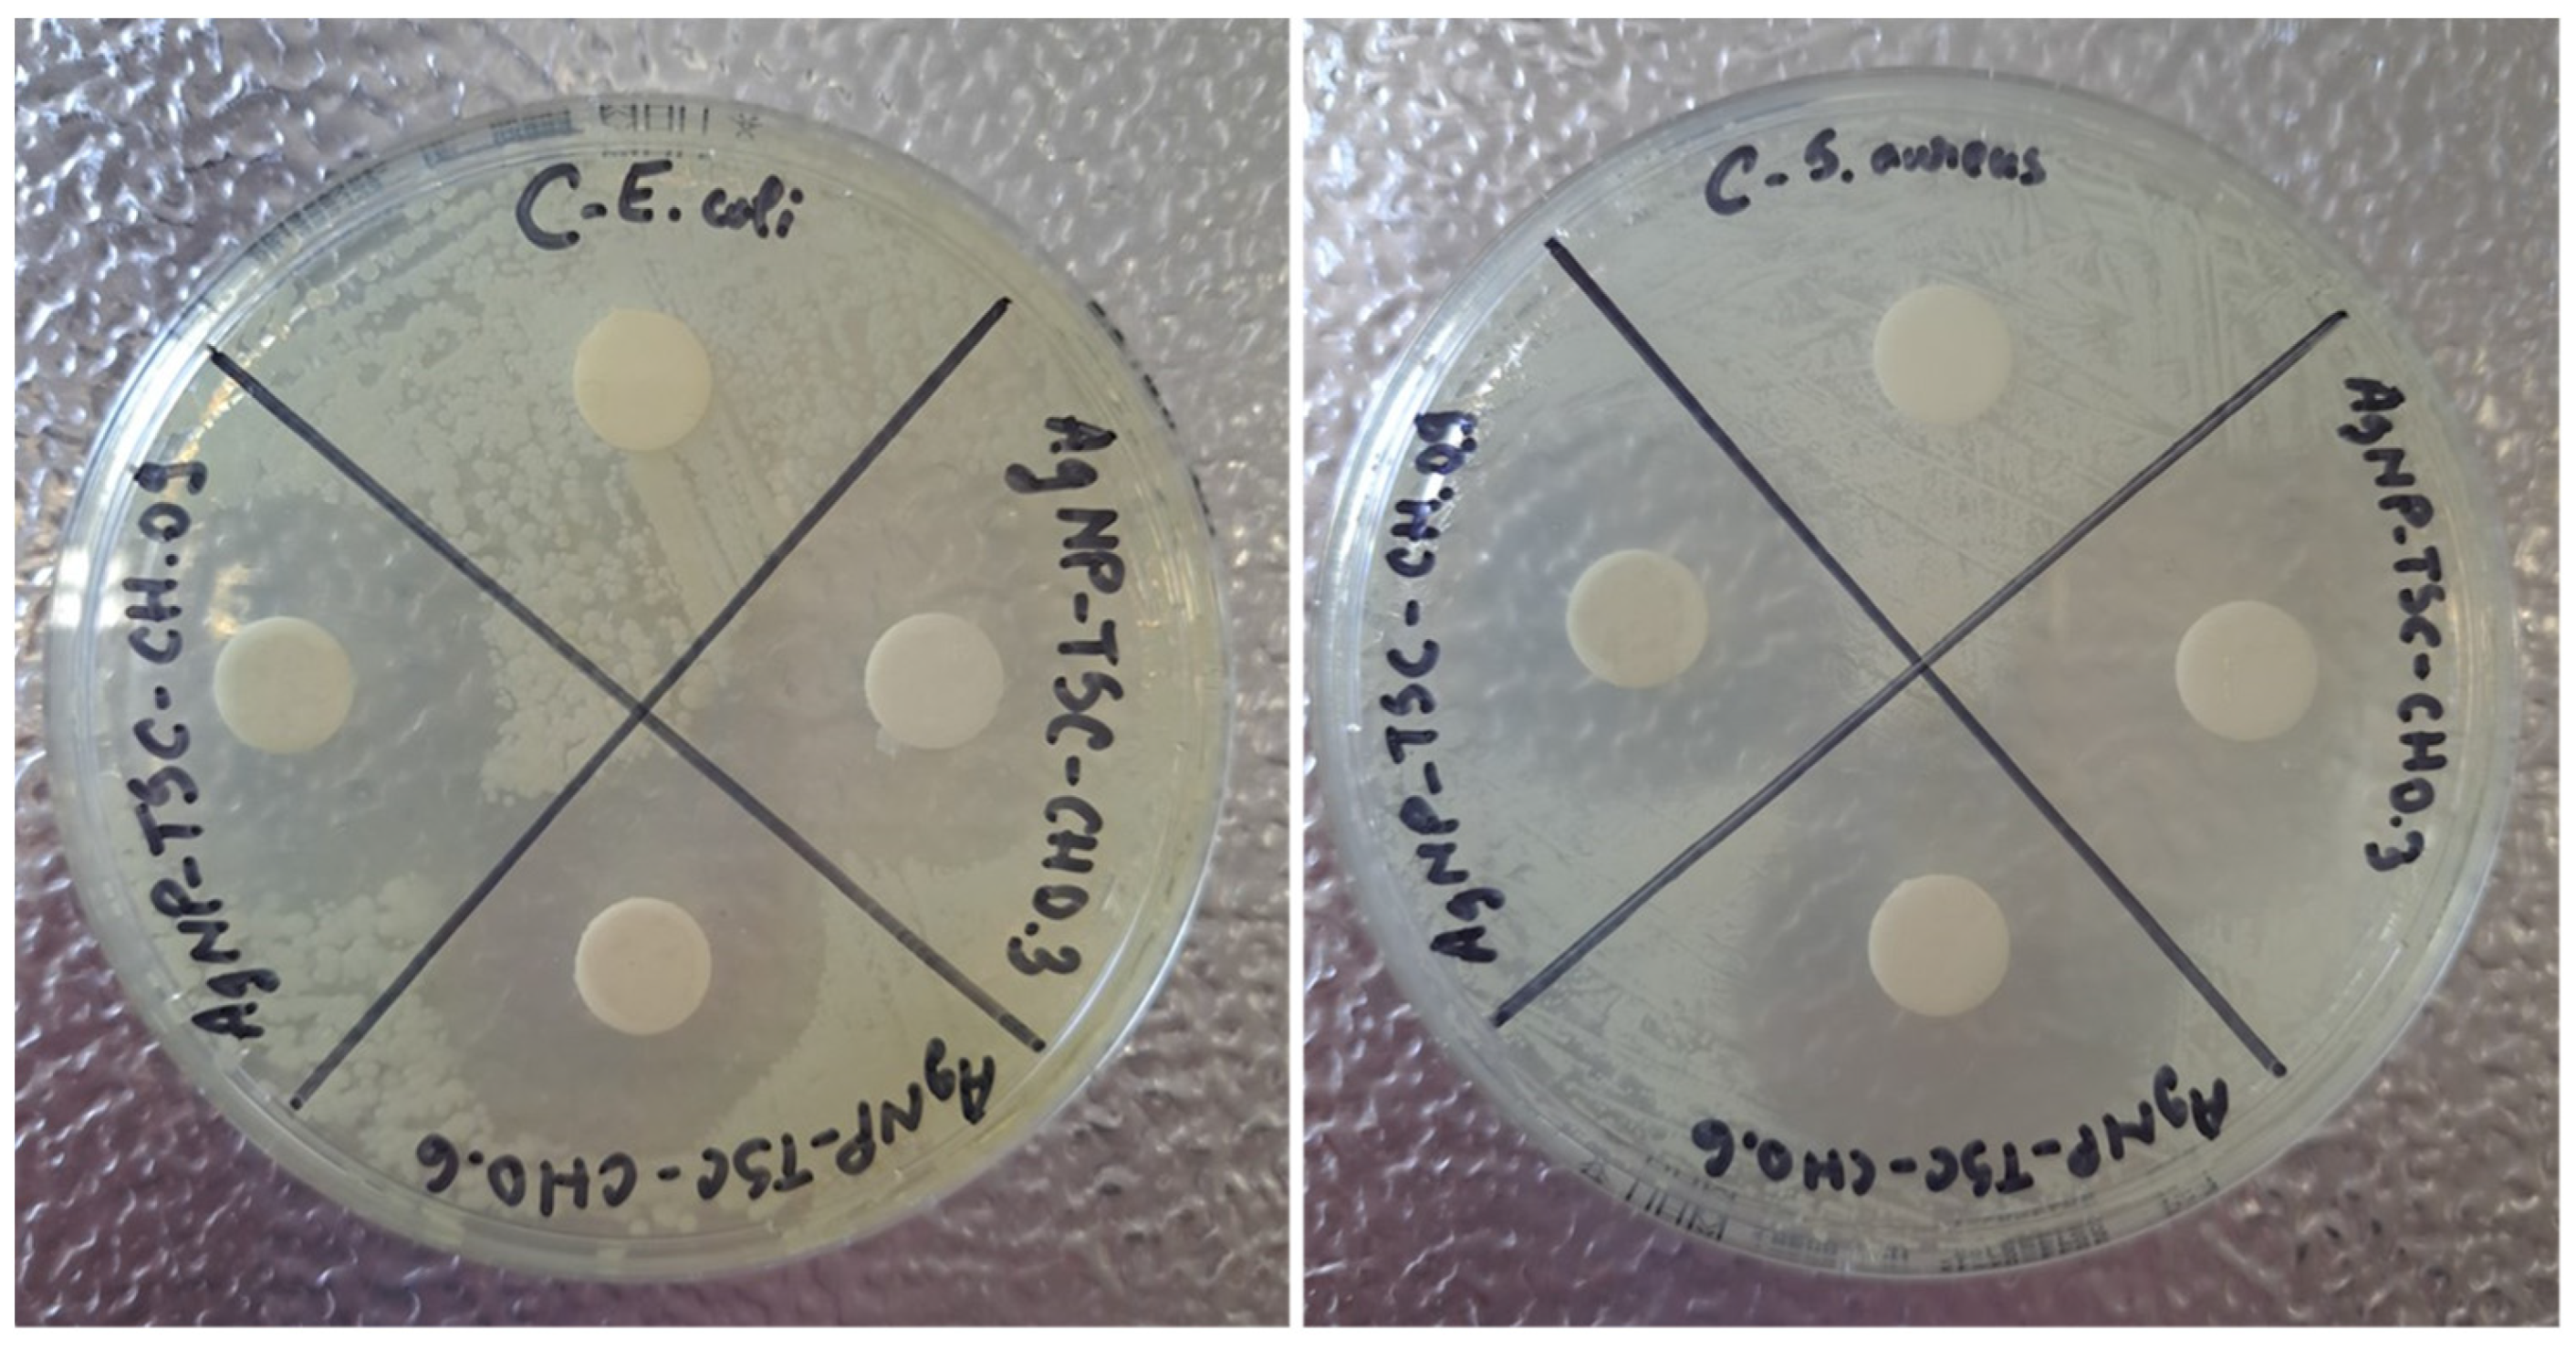
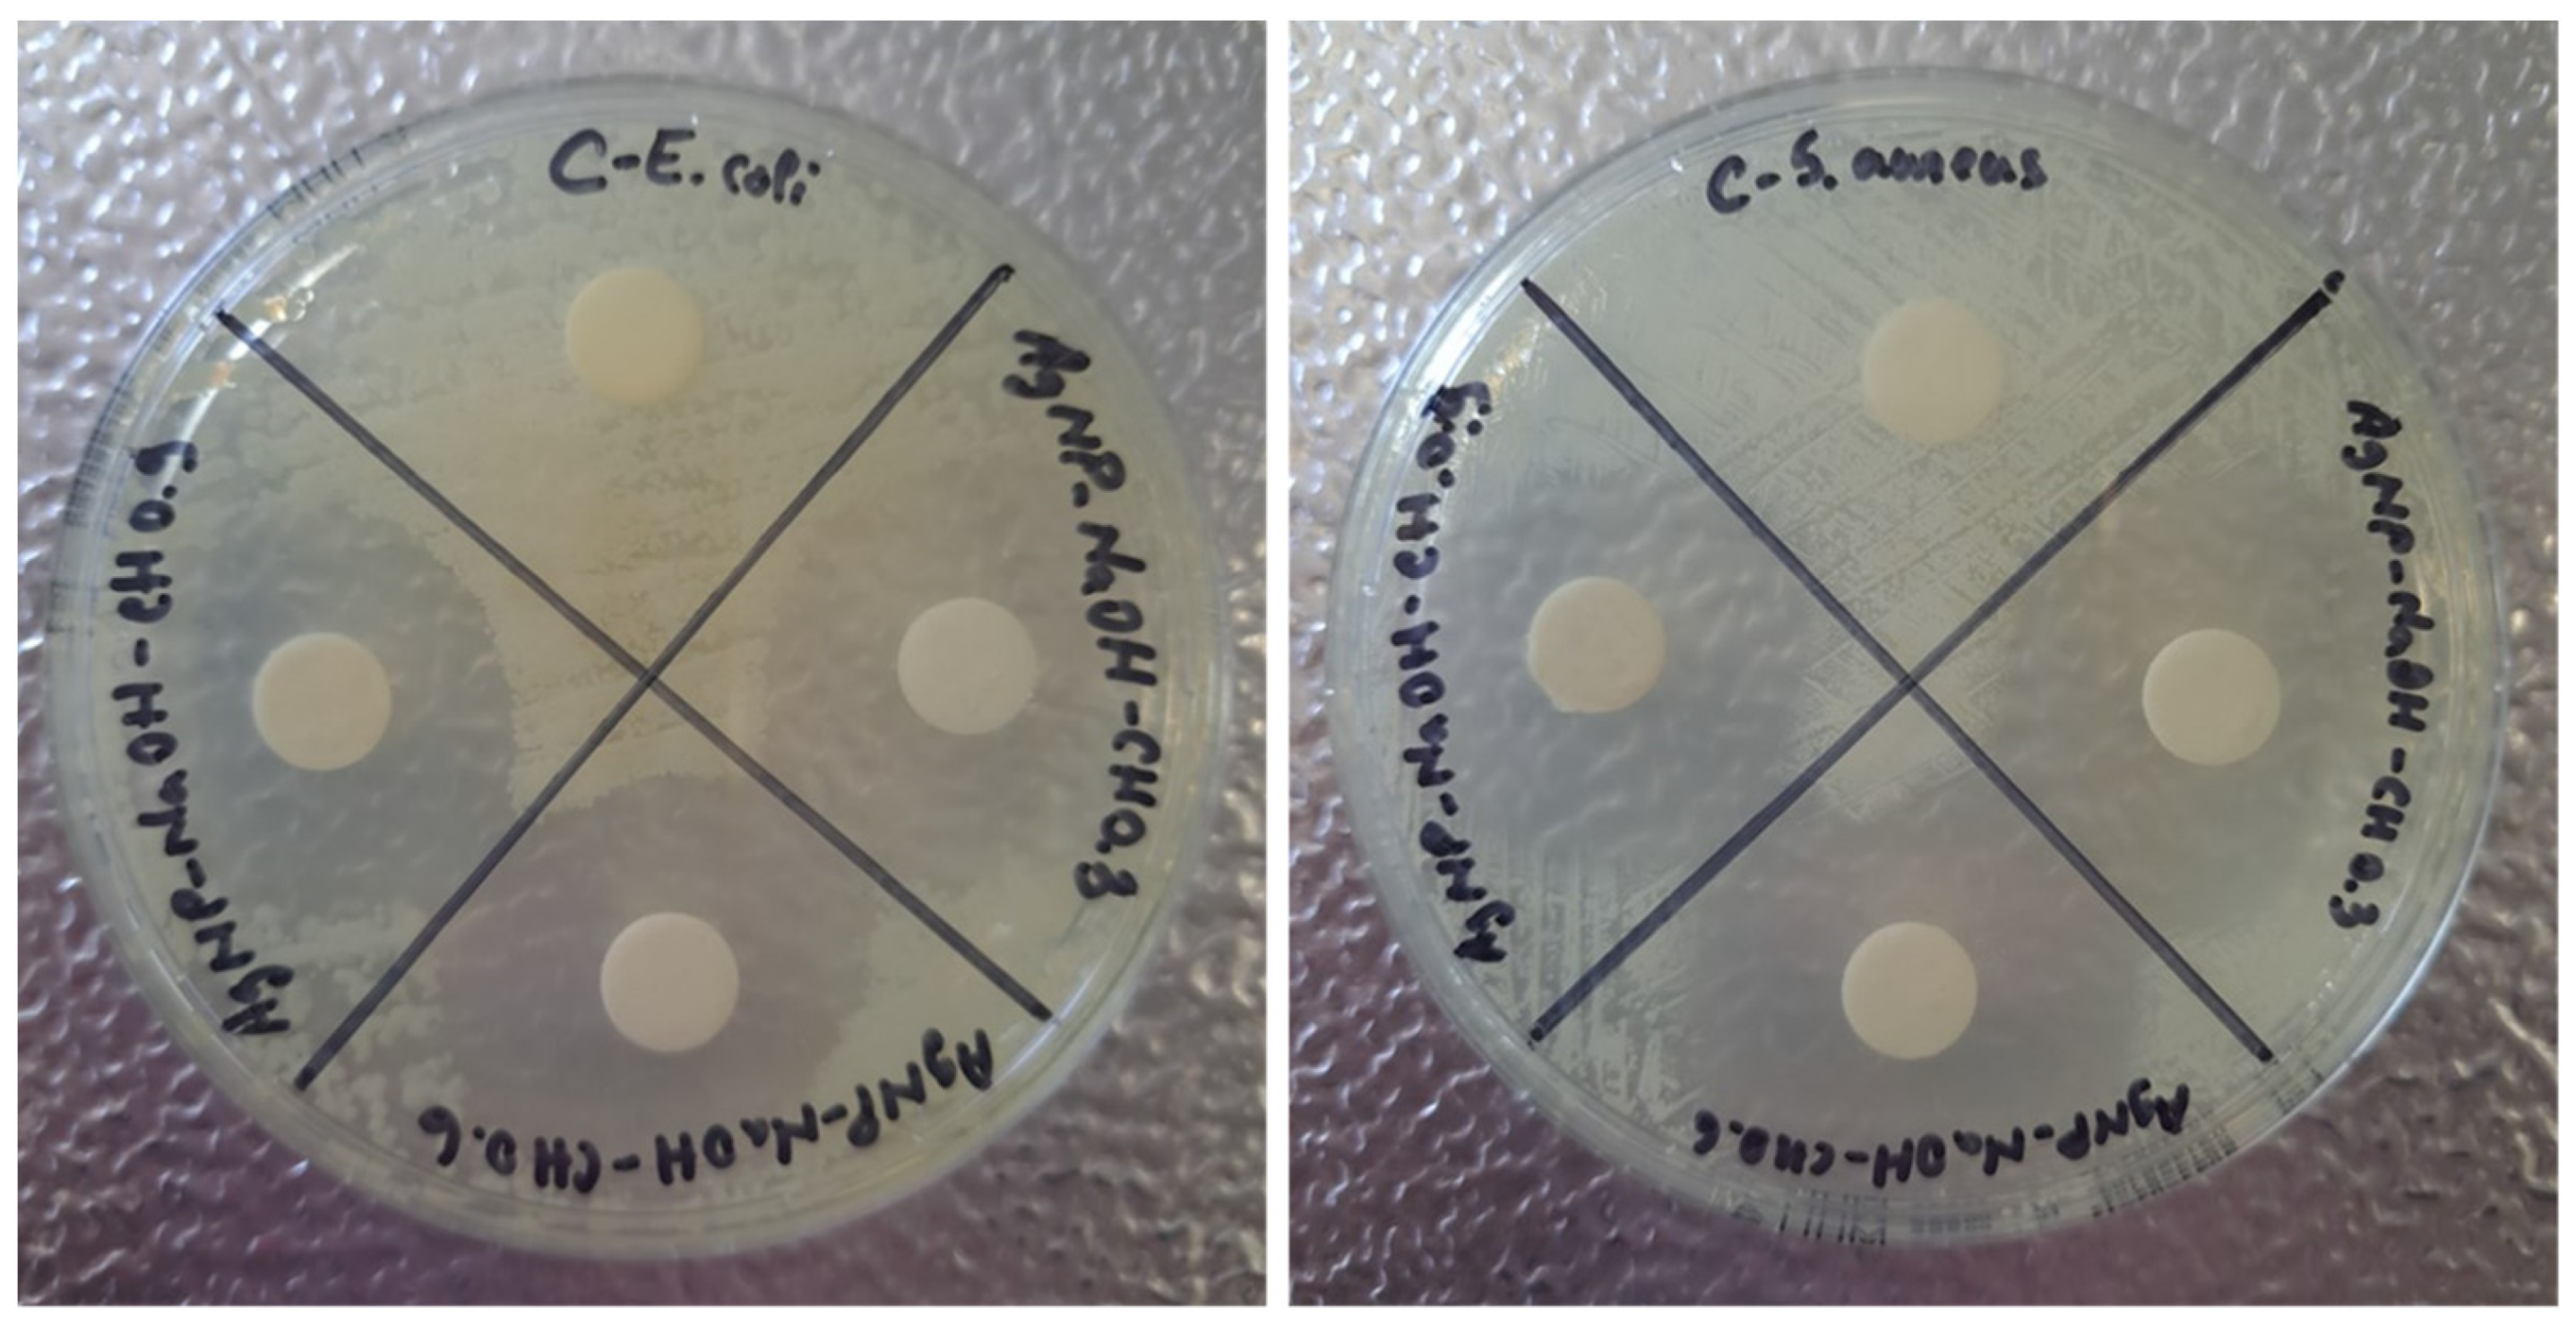
3.5. Antibacterial Test
4. Conclusions
Author Contributions
Funding
Institutional Review Board Statement
Data Availability Statement
Conflicts of Interest
Appendix A. Error Calculation for DLS Diameters
References
- Shafiee, A.; Atala, A. Tissue Engineering: Toward a New Era of Medicine. Annu. Rev. Med. 2017, 68, 29–40. [Google Scholar] [CrossRef]
- Vacanti, J.P.; Vacanti, C.A. Chapter 1—The History and Scope of Tissue Engineering. In Principles of Tissue Engineering, 4th ed.; Lanza, R., Langer, R., Vacanti, J., Eds.; Academic Press: Boston, MA, USA, 2014; pp. 3–8. [Google Scholar]
- Ghosh, C.; Sarkar, P.; Issa, R.; Haldar, J. Alternatives to conventional antibiotics in the era of antimicrobial resistance. Trends Microbiol. 2019, 27, 323–338. [Google Scholar] [CrossRef]
- Kulikouskaya, V.; Hileuskaya, K.; Kraskouski, A.; Kozerozhets, I.; Stepanova, E.; Kuzminski, I.; You, L.; Agabekov, V. Chitosan-capped silver nanoparticles: A comprehensive study of polymer molecular weight effect on the reaction kinetic, physicochemical properties, and synergetic antibacterial potential. SPE Polym. 2022, 3, 77–90. [Google Scholar] [CrossRef]
- Mubeen, B.; Ansar, A.N.; Rasool, R.; Ullah, I.; Imam, S.S.; Alshehri, S.; Ghoneim, M.M.; Alzarea, S.I.; Nadeem, M.S.; Kazmi, I. Nanotechnology as a novel approach in combating microbes providing an alternative to antibiotics. Antibiotics 2021, 10, 1473. [Google Scholar] [CrossRef]
- Jamkhande, P.G.; Ghule, N.W.; Bamer, A.H.; Kalaskar, M.G. Metal nanoparticles synthesis: An overview on methods of preparation, advantages and disadvantages, and applications. J. Drug Deliv. Sci. Technol. 2019, 53, 101174. [Google Scholar] [CrossRef]
- Ali, S.M.; Yousef, N.M.; Nafady, N.A. Application of biosynthesized silver nanoparticles for the control of land snail Eobania vermiculata and some plant pathogenic fungi. J. Nanomater. 2015, 2015, 218904. [Google Scholar] [CrossRef]
- Tang, S.; Zheng, J. Antibacterial activity of silver nanoparticles: Structural effects. Adv. Healthc. Mater. 2018, 7, 1701503. [Google Scholar] [CrossRef] [PubMed]
- Yin, I.X.; Zhang, J.; Zhao, I.S.; Mei, M.L.; Li, Q.; Chu, C.H. The antibacterial mechanism of silver nanoparticles and its application in dentistry. Int. J. Nanomed. 2020, 2020, 2555–2562. [Google Scholar] [CrossRef] [PubMed]
- Moore, M. Do nanoparticles present ecotoxicological risks for the health of the aquatic environment? Environ. Int. 2006, 32, 967–976. [Google Scholar] [CrossRef] [PubMed]
- Nicolae-Maranciuc, A.; Chicea, D.; Chicea, L.M. Ag nanoparticles for biomedical applications—Synthesis and characterization—A review. Int. J. Mol. Sci. 2022, 23, 5778. [Google Scholar] [CrossRef]
- Nadworny, P.L.; Landry, B.K.; Wang, J.; Tredget, E.E.; Burrell, R.E. Does nanocrystalline silver have a transferable effect? Wound Repair Regen. 2010, 18, 254–265. [Google Scholar] [CrossRef]
- Mirda, E.; Idroes, R.; Khairan, K.; Tallei, T.E.; Ramli, M.; Earlia, N.; Maulana, A.; Idroes, G.M.; Muslem, M.; Jalil, Z. Synthesis of chitosan-silver nanoparticle composite spheres and their antimicrobial activities. Polymers 2021, 13, 3990. [Google Scholar] [CrossRef]
- Kubo, A.-L.; Capjak, I.; Vrček, I.V.; Bondarenko, O.M.; Kurvet, I.; Vija, H.; Ivask, A.; Kasemets, K.; Kahru, A. Antimicrobial potency of differently coated 10 and 50 nm silver nanoparticles against clinically relevant bacteria Escherichia coli and Staphylococcus aureus. Colloids Surf. B Biointerfaces 2018, 170, 401–410. [Google Scholar] [CrossRef]
- Feng, Y.; Deng, T.; Lai, X.; Feng, Z.; Lyu, M.; Wang, S. Effect of properties of silver nanoparticles coated with polar material and the antibacterial activity on marine pathogenic bacteria. J. Nanomater. 2020, 2020, 1728305. [Google Scholar] [CrossRef]
- Hartati, H.; Subaer, S.; Hasri, H.; Wibawa, T.; Hasriana, H. Microstructure and Antibacterial Properties of Chitosan-Fe3O4-AgNP Nanocomposite. Nanomaterials 2022, 12, 3652. [Google Scholar] [CrossRef]
- Shih, Y.-H.; Pranata, R.; Chen, Y.-C.; Liao, M.-Y.; Cheng, Y.-H.; Chen, Y.-Y.; Lai, Y.-H.; Tsai, P.-J.; Chen, R.-J. Novel antibacterial activity of silver nanoparticles combined with pterostilbene against Staphylococcus aureus via induction of apoptosis-like cell death and downregulation of ribosomal gene expression. Environ. Sci. Nano 2023, 10, 2115–2131. [Google Scholar] [CrossRef]
- Ameen, F.; Alsamhary, K.; Alabdullatif, J.A.; ALNadhari, S. A review on metal-based nanoparticles and their toxicity to beneficial soil bacteria and fungi. Ecotoxicol. Environ. Saf. 2021, 213, 112027. [Google Scholar] [CrossRef] [PubMed]
- Mansoor, S.; Zahoor, I.; Baba, T.R.; Padder, S.A.; Bhat, Z.; Koul, A.M.; Jiang, L. Fabrication of silver nanoparticles against fungal pathogens. Front. Nanotechnol. 2021, 3, 679358. [Google Scholar] [CrossRef]
- Zienkiewicz-Strzałka, M.; Deryło-Marczewska, A.; Skorik, Y.A.; Petrova, V.A.; Choma, A.; Komaniecka, I. Silver nanoparticles on chitosan/silica nanofibers: Characterization and antibacterial activity. Int. J. Mol. Sci. 2019, 21, 166. [Google Scholar] [CrossRef] [PubMed]
- Shagdarova, B.; Konovalova, M.; Varlamov, V.; Svirshchevskaya, E. Anti-Obesity Effects of Chitosan and Its Derivatives. Polymers 2023, 15, 3967. [Google Scholar] [CrossRef] [PubMed]
- Taokaew, S.; Kaewkong, W.; Kriangkrai, W. Recent Development of Functional Chitosan-Based Hydrogels for Pharmaceutical and Biomedical Applications. Gels 2023, 9, 277. [Google Scholar] [CrossRef]
- Tang, G.; Tan, Z.; Zeng, W.; Wang, X.; Shi, C.; Liu, Y.; He, H.; Chen, R.; Ye, X. Recent advances of chitosan-based injectable hydrogels for bone and dental tissue regeneration. Front. Bioeng. Biotechnol. 2020, 8, 587658. [Google Scholar] [CrossRef] [PubMed]
- Younes, I.; Rinaudo, M. Chitin and chitosan preparation from marine sources. Structure, properties and applications. Mar. Drugs 2015, 13, 1133–1174. [Google Scholar] [CrossRef] [PubMed]
- Carpa, R.; Farkas, A.; Dobrota, C.; Butiuc-Keul, A. Double-network chitosan-based hydrogels with improved mechanical, conductive, antimicrobial, and antibiofouling properties. Gels 2023, 9, 278. [Google Scholar] [CrossRef] [PubMed]
- Hamed, I.; Özogul, F.; Regenstein, J.M. Industrial applications of crustacean by-products (chitin, chitosan, and chitooligosaccharides): A review. Trends Food Sci. Technol. 2016, 48, 40–50. [Google Scholar] [CrossRef]
- Wang, Y.; Xie, M.; Ma, G.; Fang, Y.; Yang, W.; Ma, N.; Fang, D.; Hu, Q.; Pei, F. The antioxidant and antimicrobial activities of different phenolic acids grafted onto chitosan. Carbohydr. Polym. 2019, 225, 115238. [Google Scholar] [CrossRef] [PubMed]
- Arora, S.; Das, G.; Alqarni, M.; Grover, V.; Manzoor Baba, S.; Saluja, P.; Hassan, S.A.B.; Abdulla, A.M.; Bavabeedu, S.S.; Abullais, S.S. Role of Chitosan Hydrogels in Clinical Dentistry. Gels 2023, 9, 698. [Google Scholar] [CrossRef]
- Chen, R.; Chen, Q.; Huo, D.; Ding, Y.; Hu, Y.; Jiang, X. In situ formation of chitosan–gold hybrid hydrogel and its application for drug delivery. Colloids Surf. B Biointerfaces 2012, 97, 132–137. [Google Scholar] [CrossRef]
- Baysal, K.; Aroguz, A.Z.; Adiguzel, Z.; Baysal, B.M. Chitosan/alginate crosslinked hydrogels: Preparation, characterization and application for cell growth purposes. Int. J. Biol. Macromol. 2013, 59, 342–348. [Google Scholar] [CrossRef]
- Wu, X.; Black, L.; Santacana-Laffitte, G.; Patrick Jr, C.W. Preparation and assessment of glutaraldehyde-crosslinked collagen–chitosan hydrogels for adipose tissue engineering. J. Biomed. Mater. Res. Part A 2007, 81, 59–65. [Google Scholar] [CrossRef]
- Chen, H.; Feng, R.; Xia, T.; Wen, Z.; Li, Q.; Qiu, X.; Huang, B.; Li, Y. Progress in Surface Modification of Titanium Implants by Hydrogel Coatings. Gels 2023, 9, 423. [Google Scholar] [CrossRef]
- Su, Z.; Sun, D.; Zhang, L.; He, M.; Jiang, Y.; Millar, B.; Douglas, P.; Mariotti, D.; Maguire, P.; Sun, D. Chitosan/silver nanoparticle/graphene oxide nanocomposites with multi-drug release, antimicrobial, and photothermal conversion functions. Materials 2021, 14, 2351. [Google Scholar] [CrossRef] [PubMed]
- Kalaivani, R.; Maruthupandy, M.; Muneeswaran, T.; Beevi, A.H.; Anand, M.; Ramakritinan, C.; Kumaraguru, A. Synthesis of chitosan mediated silver nanoparticles (Ag NPs) for potential antimicrobial applications. Front. Lab. Med. 2018, 2, 30–35. [Google Scholar] [CrossRef]
- Rezazadeh, N.H.; Buazar, F.; Matroodi, S. Synergistic effects of combinatorial chitosan and polyphenol biomolecules on enhanced antibacterial activity of biofunctionalized silver nanoparticles. Sci. Rep. 2020, 10, 19615. [Google Scholar] [CrossRef]
- Raza, M.A.; Kanwal, Z.; Rauf, A.; Sabri, A.N.; Riaz, S.; Naseem, S. Size-and shape-dependent antibacterial studies of silver nanoparticles synthesized by wet chemical routes. Nanomaterials 2016, 6, 74. [Google Scholar] [CrossRef]
- Artunduaga Bonilla, J.J.; Honorato, L.; Guimarães, A.J.; Miranda, K.; Nimrichter, L. Silver chitosan nanocomposites are effective to combat sporotrichosis. Front. Nanotechnol. 2022, 4, 857681. [Google Scholar] [CrossRef]
- Shehabeldine, A.M.; Salem, S.S.; Ali, O.M.; Abd-Elsalam, K.A.; Elkady, F.M.; Hashem, A.H. Multifunctional silver nanoparticles based on chitosan: Antibacterial, antibiofilm, antifungal, antioxidant, and wound-healing activities. J. Fungi 2022, 8, 612. [Google Scholar] [CrossRef]
- Chicea, D.; Nicolae-Maranciuc, A.; Doroshkevich, A.S.; Chicea, L.M.; Ozkendir, O.M. Comparative synthesis of silver nanoparticles: Evaluation of chemical reduction procedures, AFM and DLS size analysis. Materials 2023, 16, 5244. [Google Scholar] [CrossRef]
- Binnig, G.; Rohrer, H.; Gerber, C.; Weibel, E. Surface studies by scanning tunneling microscopy. Phys. Rev. Lett. 1982, 49, 57. [Google Scholar] [CrossRef]
- Giessibl, F.J. Advances in atomic force microscopy. Rev. Mod. Phys. 2003, 75, 949–983. [Google Scholar] [CrossRef]
- Gomès, S.; Assy, A.; Chapuis, P.O. Scanning thermal microscopy: A review. Phys. Status Solidi A 2015, 212, 477–494. [Google Scholar] [CrossRef]
- Chicea, D. Nanoparticles and nanoparticle aggregates sizing by DLS and AFM. J. Optoelectron. Adv. Mater. 2010, 4, 1310–1315. [Google Scholar]
- Chicea, D.; Indrea, E.; Cretu, C. Assesing Fe3O4 nanoparticle size by DLS, XRD and AFM. J. Optoelectron. Adv. Mater. 2012, 14, 460–466. [Google Scholar]
- Chicea, D.; Neamtu, B.; Chicea, R.; Chicea, L. The application of AFM for biological sample imaging. Dig. J. Nanomater. Biostruct. 2010, 5, 1015–1022. [Google Scholar]
- Clark, N.A.; Lunacek, J.H.; Benedek, G.B. A study of Brownian motion using light scattering. Am. J. Phys. 1970, 38, 575–585. [Google Scholar] [CrossRef]
- Dubin, S.B.; Lunacek, J.H.; Benedek, G.B. Observation of the spectrum of light scattered by solutions of biological macromolecules. Proc. Natl. Acad. Sci. USA 1967, 57, 1164–1171. [Google Scholar] [CrossRef] [PubMed]
- Goodman, J.W. Statistical Optics; Wiley: Hoboken, NJ, USA, 2000; p. 572. [Google Scholar]
- Hecht, E. Optics, 5th ed.; Pearson Education Limited: London, UK, 2017; p. 730. [Google Scholar]
- Chicea, D. A study of nanoparticle aggregation by coherent light scattering. Curr. Nanosci. 2012, 8, 259–265. [Google Scholar] [CrossRef]
- Poiseuille’s Law. Available online: http://hyperphysics.phy-astr.gsu.edu/hbase/ppois.html (accessed on 8 December 2023).
- Berg, R.F.; May, E.F.; Moldover, M.R. Viscosity Ratio Measurements with Capillary Viscometers. J. Chem. Eng. Data 2014, 59, 116–124. [Google Scholar] [CrossRef]
- Moon, D.; Migler, K.B. Measurement of dynamic capillary pressure and viscosity via the multi-sample micro-slit rheometer. Chem. Eng. Sci. 2009, 64, 4537–4542. [Google Scholar] [CrossRef]
- Yusibani, E.; Nagahama, Y.; Kohno, M.; Takata, Y.; Woodfield, P.L.; Shinzato, K.; Fujii, M. A Capillary Tube Viscometer Designed for Measurements of Hydrogen Gas Viscosity at High Pressure and High Temperature. Int. J. Thermophys. 2011, 32, 1111–1124. [Google Scholar] [CrossRef]
- Susilowati, E.; Maryani; Ashadi. Green synthesis of silver-chitosan nanocomposite and their application as antibacterial material. J. Phys. Conf. Ser. 2019, 1153, 012135. [Google Scholar] [CrossRef]
- Jaynes, E. Information Theory and Statistical Mechanics. Phys. Rev. 1957, 106, 620–630. [Google Scholar] [CrossRef]
- Provencher, S. An eigenfunction expansion method for the analysis of exponential decay curves. J. Chem. Phys. 1976, 64, 2772–2777. [Google Scholar] [CrossRef]
- Provencher, S. A constrained regularization method for inverting data represented by linear algebraic or integral equations. Comput. Phys. Commun. 1982, 9, 213–227. [Google Scholar] [CrossRef]
- Chicea, D. Coherent light scattering on nanofluids: Computer simulation results. Appl. Opt. 2008, 47, 1434–1442. [Google Scholar] [CrossRef]
- Craig, I.; Thompson, A.; Thompson, W.J. Practical numerical algorithms why Laplace transforms are difficult to invert numerically. Comput. Phys. 1994, 8, 648–653. [Google Scholar] [CrossRef]
- Kelly, K.L.; Coronado, E.; Zhao, L.L.; Schatz, G.C. The Optical Properties of Metal Nanoparticles: The Influence of Size, Shape, and Dielectric Environment. J. Phys. Chem. B 2003, 107, 668–677. [Google Scholar] [CrossRef]
- Wiley, B.; Sun, Y.; Mayers, B.; Xia, Y. Shape-Controlled Synthesis of Metal Nanostructures: The Case of Silver. Chem.–Eur. J. 2005, 11, 454–463. [Google Scholar] [CrossRef] [PubMed]
- Marinescu, L.; Ficai, D.; Ficai, A.; Oprea, O.; Nicoara, A.I.; Vasile, B.S.; Boanta, L.; Marin, A.; Andronescu, E.; Holban, A.-M. Comparative Antimicrobial Activity of Silver Nanoparticles Obtained by Wet Chemical Reduction and Solvothermal Methods. Int. J. Mol. Sci. 2022, 23, 5982. [Google Scholar] [CrossRef] [PubMed]
- Singh, A.; Gaud, B.; Jaybhaye, S. Optimization of synthesis parameters of silver nanoparticles and its antimicrobial activity. Mater. Sci. Energy Technol. 2020, 3, 232–236. [Google Scholar] [CrossRef]
- Abkhalimov, E.V.; Ershov, V.A.; Ershov, B.G. “Pure” silver hydrosol: Nanoparticles and stabilizing carbonate ions. J. Nanopart. Res. 2019, 21, 93. [Google Scholar] [CrossRef]
- Govindan, S.; Nivethaa, E.; Saravanan, R.; Narayanan, V.; Stephen, A. Synthesis and characterization of chitosan–silver nanocomposite. Appl. Nanosci. 2012, 2, 299–303. [Google Scholar] [CrossRef]
- Mallikarjuna, K.; Narasimha, G.; Dillip, G.; Praveen, B.; Shreedhar, B.; Lakshmi, C.S.; Reddy, B.; Raju, B.D.P. Green synthesis of silver nanoparticles using Ocimum leaf extract and their characterization. Dig. J. Nanomater. Biostruct. 2011, 6, 181–186. [Google Scholar]
- Rupiasih, N.N.; Suharta, W.G.; Sumadiyasa, M.; Nirwana Islami, M. The Current-Voltage Properties of Ch/AgNP Composite Membranes: A Study on the Effect of AgNP Content. IOP Conf. Ser. Mater. Sci. Eng. 2019, 515, 012064. [Google Scholar] [CrossRef]
- Shi, D.; Karmakar, B.; Hussein Osman, H.-E.; El-kott, A.F.; Morsy, K.; Abdel-Daim, M.M. Design and synthesis of chitosan/agar/Ag NPs: A potent and green bio-nanocomposite for the treatment of glucocorticoid induced osteoporosis in rats. Arab. J. Chem. 2022, 15, 103471. [Google Scholar] [CrossRef]
- Gowda, S.; Sriram, S. Green synthesis of chitosan silver nanocomposites and their antifungal activity against Colletotrichum truncatum causing anthracnose in chillies. Plant Nano Biol. 2023, 5, 100041. [Google Scholar] [CrossRef]
- Buszewski, B.; Rafiſska, K.; Pomastowski, P.; Walczak, J.; Rogowska, A. Novel aspects of silver nanoparticles functionalization. Colloids Surf. A Physicochem. Eng. Asp. 2016, 506, 170–178. [Google Scholar] [CrossRef]
- Canama, G.J.C.; Delco, M.C.L.; Talandron, R.A.; Tan, N.P. Synthesis of Chitosan-Silver Nanocomposite and Its Evaluation as an Antibacterial Coating for Mobile Phone Glass Protectors. ACS Omega 2023, 8, 17699–17711. [Google Scholar] [CrossRef]
- Krishna, C.N.; Katamaneni, M.; Yelavarti, K.C.; Babu, B.S.; Kumar, B.R.; Prakash, M.V. Synthesis and Characterization of the Chitosan Silver Nanoparticle-Reinforced Borassus flabellifer Trichome-and Prosopis juliflora Wood-Based Nanocomposite for Environmental Application. J. Nanomater. 2021, 2021, 3199949. [Google Scholar] [CrossRef]
- Dayakar, T.; Rao, K.V.; Park, J.; Sadasivuni, K.K.; Rao, K.R. Non-enzymatic biosensing of glucose based on silver nanoparticles synthesized from Ocimum tenuiflorum leaf extract and silver nitrate. Mater. Chem. Phys. 2018, 216, 502–507. [Google Scholar] [CrossRef]
- Setyaningrum, D.; Riyanto, S.; Rohman, A. Analysis of corn and soybean oils in red fruit oil using FTIR spectroscopy in combination with partial least square. Int. Food Res. J. 2013, 20, 1977–1981. [Google Scholar]
- Bruna, T.; Maldonado-Bravo, F.; Jara, P.; Caro, N. Silver Nanoparticles and Their Antibacterial Applications. Int. J. Mol. Sci. 2021, 22, 7202. [Google Scholar] [CrossRef] [PubMed]
- Rozilah, A.; Jaafar, C.N.A.; Sapuan, S.M.; Zainol, I.; Ilyas, R.A. The Effects of Silver Nanoparticles Compositions on the Mechanical, Physiochemical, Antibacterial, and Morphology Properties of Sugar Palm Starch Biocomposites for Antibacterial Coating. Polymers 2020, 12, 2605. [Google Scholar] [CrossRef] [PubMed]
- Gudkov, S.V.; Serov, D.A.; Astashev, M.E.; Semenova, A.A.; Lisitsyn, A.B. Ag2O Nanoparticles as a Candidate for Antimicrobial Compounds of the New Generation. Pharmaceuticals 2022, 15, 968. [Google Scholar] [CrossRef]


| Reagent | Chemical Formula | Purity | Form |
|---|---|---|---|
| Silver nitrate | AgNO3 | ≥99.8% ACS | powder |
| Trisodium citrate dihydrate (TSC) | C6H5Na3O7·2H2O | 99% | powder |
| Sodium hydroxide (NaOH) | NaOH | 97% | powder |
| Chitosan low molecular weight (CH) | [C6H11NO4]n | >75% deacetylation | powder |
| Acetic acid | C2H4O2 | 99.8% | liquid |
| Number | Sample | Chitosan, w/v (%) | AgNO3 (mM) | TSC 1% |
|---|---|---|---|---|
| 1 | AgNP-TSC-CH0.3 | 0.3 | 10 | 1 |
| 2 | AgNP-TSC-CH0.6 | 0.6 | 10 | 1 |
| 3 | AgNP-TSC-CH0.9 | 0.9 | 10 | 1 |
| Number | Sample | Chitosan, w/v (%) | AgNO3 (mM) | NaOH (mM) |
| 4 | AgNP-NaOH-CH0.3 | 0.3 | 10 | 0.1 |
| 5 | AgNP-NaOH-CH0.6 | 0.6 | 10 | 0.1 |
| 6 | AgNP-NaOH-CH0.9 | 0.9 | 10 | 0.1 |
| No. | Sample | d DLS, nm | d AFM, nm | Molar Conc. AgNPs-CH, mmol/L |
|---|---|---|---|---|
| 1 | AgNP-TSC-CH0.3 | 48.8 ± 6.3 | 44.5 ± 7.1 | 3.7 × 10⁻⁶ |
| 2 | AgNP-TSC-CH0.6 | 85.7 ± 11.1 | 82.7 ± 12.1 | 5.7 × 10⁻⁷ |
| 3 | AgNP-TSC-CH0.9 | 98.5 ± 12.8 | 89.1 ± 12.0 | 4.6 × 10⁻⁶ |
| 4 | AgNP-NaOH-CH0.3 | 46.6 ± 6.1 | 42.6 ± 5.2 | 4.2 × 10⁻⁶ |
| 5 | AgNP-NaOH-CH0.6 | 92.0 ± 12.0 | 76.7 ± 10.3 | 7.2 × 10⁻⁷ |
| 6 | AgNP-NaOH-CH0.9 | 100.8 ± 13.1 | 97.2 ± 14.8 | 3.6 × 10⁻⁷ |
| No. | Sample | Inhibition Zone for E. coli Strain | Inhibition Zone for S. aureus Strain |
|---|---|---|---|
| 1 | AgNP-TSC-CH03 | 31 mm | 32 mm |
| 2 | AgNP-TSC-CH06 | 30 mm | 31 mm |
| 3 | AgNP-TSC-CH09 | 30 mm | 27 mm |
| 4 | AgNP-NaOH-CH03 | 32 mm | 33 mm |
| 5 | AgNP-NaOH-CH06 | 32 mm | 33 mm |
| 6 | AgNP-NaOH-CH09 | 31 mm | 29 mm |
Disclaimer/Publisher’s Note: The statements, opinions and data contained in all publications are solely those of the individual author(s) and contributor(s) and not of MDPI and/or the editor(s). MDPI and/or the editor(s) disclaim responsibility for any injury to people or property resulting from any ideas, methods, instructions or products referred to in the content. |
© 2024 by the authors. Licensee MDPI, Basel, Switzerland. This article is an open access article distributed under the terms and conditions of the Creative Commons Attribution (CC BY) license (https://creativecommons.org/licenses/by/4.0/).
Share and Cite
Chicea, D.; Nicolae-Maranciuc, A.; Chicea, L.-M. Silver Nanoparticles-Chitosan Nanocomposites: A Comparative Study Regarding Different Chemical Syntheses Procedures and Their Antibacterial Effect. Materials 2024, 17, 1113. https://doi.org/10.3390/ma17051113
Chicea D, Nicolae-Maranciuc A, Chicea L-M. Silver Nanoparticles-Chitosan Nanocomposites: A Comparative Study Regarding Different Chemical Syntheses Procedures and Their Antibacterial Effect. Materials. 2024; 17(5):1113. https://doi.org/10.3390/ma17051113
Chicago/Turabian StyleChicea, Dan, Alexandra Nicolae-Maranciuc, and Liana-Maria Chicea. 2024. "Silver Nanoparticles-Chitosan Nanocomposites: A Comparative Study Regarding Different Chemical Syntheses Procedures and Their Antibacterial Effect" Materials 17, no. 5: 1113. https://doi.org/10.3390/ma17051113
APA StyleChicea, D., Nicolae-Maranciuc, A., & Chicea, L.-M. (2024). Silver Nanoparticles-Chitosan Nanocomposites: A Comparative Study Regarding Different Chemical Syntheses Procedures and Their Antibacterial Effect. Materials, 17(5), 1113. https://doi.org/10.3390/ma17051113