Abstract
A new type of poly-diamond plate without a catalyst was produced via the high-pressure high-temperature (HPHT) compression of diamond powders. The densification of diamond powders and sp3 to sp2 carbon on the surface under HPHT compression was investigated through the characterization of the microstructure, Raman spectroscopy analysis and electrical resistance measurement. The densification and sp3-sp2 transformation on the surface are mainly affected by the pressure, temperature and particle size. The quantitative analysis of the diamond sp3 and sp2 carbon amount was performed through the peak fitting of Raman spectra. It was found that finer diamond particles under a higher temperature and a lower pressure tend to produce more sp2 carbon; otherwise, they produce less. In addition, it is interesting to note that the local residual stresses measured using Raman spectra increase with the diamond particle size. The suspected reason is that the increased particle size reduces the number of contact points, resulting in a higher localized pressure at each contact point. The hypothesis was supported by finite element calculation. This study provides detailed and quantitative data about the densification of diamond powders and sp3 to sp2 transformation on the surface under HPHT treatment, which is valuable for the sintering of polycrystalline diamonds (PCDs) and the HPHT treatment of diamonds.
1. Introduction
Polycrystalline diamonds (PCDs) are sintered from micro- or sub-microdiamond powders with the catalysis of transition metals, usually Fe, Ni or Co, via HPHT compression [1,2]. PCDs have been popularly used as abrasion materials and thermal conductors due to their ultra-high wear resistance and excellent thermal conductivity [3]. The polycrystalline diamond compact (PDC), a composite of the PCD and the WC/Co substrate, is produced through the infiltration of Co from the substrate into diamond micropowders as a catalyst via HPHT compression [4]. PDCs combine the PCD’s ultra-high wear resistance and the relatively high impact toughness of the WC/Co substrate [5,6,7]. Consequently, PDCs have been widely employed as machining tools [8], oil and gas drilling bits [9], and grinding wheel dressing tools [10]. The performance of PDCs is generally believed to increase with the diamond content; therefore, it is of primary importance to improve the diamond density by optimizing the particle size distribution. The sintering of PDCs includes three main processes [11]: (1) cold compaction—where diamond powders are densified via fragmentation and rearrangement with the pressure increasing from the atmosphere to a high pressure of up to 7 or 8 GPa; (2) hot pressing—as the temperature increases to above 800 °C, diamond particles could be elastically deformed and the powders are hot compacted to become denser; (3) cobalt melting and infiltration—the catalyst cobalt infiltrates into diamond powders and assists in the formation of diamond to diamond bonds. The literature [12,13,14] mainly focuses on the third process, the influence of the synthesis pressure and temperature on PDC sintering. However, there is little research on the first and second process. Our group has conducted a detailed study on cold compaction and found that the packing density of diamond powder with two different particle sizes is higher than the one with a single particle size. For example, the density of the 2–4 μm:20–30 μm (1:3) powder increases by 27% to 50% after cold pressing compared to the density of the 2–4 μm powder [15]. Following that work, this paper investigated the further densification during the hot pressing. Before liquid catalyst cobalt infiltration, diamond particle surfaces experience different pressures depending on their contacting conditions. The actual pressure applied on the diamond surface around a space would be particularly lower than that on those in contact with each other, resulting in a partial sp3-sp2 transformation at high temperatures. The sp2 carbon would affect the following diamond sintering. With the increase in sp2 carbon, the hardness of the sintered PDCs will decrease. In order to further develop the properties of PCDs and PDCs, this paper also studied the effects of the pressure, heating power and particle size on the sp3 to sp2 carbon transformation on surfaces.
In addition, although there are extensive studies on the transformations of diamond into graphite at high temperatures, including natural single crystalline diamonds, HPHT and Chemical Vapor Deposition (CVD) synthesized diamonds and diamond composites [16,17,18,19,20,21], with the majority of the studies conducted at atmosphere, there is little research on diamond graphitization at high pressures. G. Davies [22] measured the graphitization of diamonds under high-pressure and zero-pressure conditions and calculated the activation energy of graphitization. Qian, J. [23] conducted high-temperature and high-pressure treatment on nanoscale diamonds and characterized the graphitization. The present study systematically investigated the densification and sp3 to sp2 transformation on the surface of microdiamond powders after high-pressure hot pressing, which is useful for the synthesis optimization of polycrystalline diamonds.
On the other side, the synthesis of polycrystalline diamonds via CVD usually employs substrates such as silicon and molybdenum [24,25]. Due to the thermal expansion coefficient difference between the diamond and substrate, huge stresses are introduced and could result in the cracking of CVD polycrystalline diamonds. In order to address this problem, a new type of substrate with a similar thermal expansion coefficient is desirable. The PCDs sintered via HPHT treatment have been used for CVD substrates, but they did not work due to the existence of catalyst cobalt. In this study, a new type of poly-diamond plate without cobalt has been produced. It has enough strength for a CVD substrate and possesses a thermal expansion coefficient similar to CVD polycrystalline diamonds. This hot-compressed poly-diamond plate shows promise in decreasing thermal stresses during the CVD synthesis of polycrystalline diamonds when used as a substrate.
2. Experimental Procedures
2.1. Materials
The diamond powders used in this experiment were provided by Henan Union Precision Share Co., Ltd., Zhengzhou, China, with the brand name of HDP-PCD. Five diamond powders with particle size ranges of 2–4 μm (G2–4), 6–12 μm (G6–12), 8–16 μm (G8–16), 15–25 μm (G15–25) and 20–30 μm (G20–30) were used and named as samples A, B, C, D and E.
2.2. HPHT Experiment
The hot-pressing experiments were conducted using a Φ800 cubic press YMTS800, which is produced by Zhengzhou Abrasives Grinding Research Institute Co., Ltd., Zhengzhou, China. Before hot pressing, different particle sizes of diamond powders with the same mass were weighed using an electronic balance. These five diamond powder samples were individually placed into niobium cups and then loaded into the same pyrophyllite cube to ensure that the temperature and pressure of different particle sizes of diamond powders were kept consistent during the hot-pressing process. The experiment used two different pressures (30 MPa and 40 MPa) and three different temperatures (4 kW (1023 °C), 5 kW (1256 °C) and 6 kW (1494 °C)). After a 5 min hot-pressing process, the pyrophyllite cube was allowed to cool naturally before being removed from the cubic press, then the pyrophyllite cubes were knocked open and hot-pressed samples were taken out.
2.3. Characterization Methods
After breaking these plate samples, the microscopic microstructures of the fracture surfaces were observed using a scanning electron microscope (SEM) that was produced by Germany Zeiss (Jena, Germany). The instrument model was G300, and the voltage of the instrument was 0.2–20 kV, which can be adjusted continuously in steps of 10 V. In addition, the secondary imaging resolution was 0.7 nm; the magnification of the image was 12~2,000,000 times. In this paper, a voltage of 15 kV was selected. The density was measured using the drainage method. All samples’ XRD spectra were measured, but the results did not show a noticeable graphite peak. Therefore, the sp2 carbon on surfaces of diamond powders after hot pressing was analyzed using France Horiba Raman spectroscopy. The Raman spectrometer has a resolution of 0.65 cm−1 and power of 100 mW/μm2. The displacement range is 50 cm−1 to 9000 cm−1. The displacement range used in this study is 200 cm−1 to 3000 cm−1, and the Raman spectrometer has four laser wavelengths, which are 325 nm, 532 nm, 633 nm and 785 nm. The instrument model was the LabRAM Odyssey. The electrical resistance of hot-pressed diamond samples with different components were measured via direct measurement using an Omron multimeter using the average value of 5 measurements. All samples prepared under various experimental conditions are listed in Table S1.
3. Results
3.1. Diamond Particle Size and Hot-Pressed Conditions
Figure 1a shows the pressure P-t and heating power curves that were used to hot press diamond powders into a compacted plate sample. The function of the pressure change with time is P = 0.475 t, and the function of the temperature change with time is T = 7.3 t. The actual heating temperatures corresponding to various heating powers were measured using a platinum–rhodium thermocouple, and the results are shown in Figure 1b. The actual pressure inside the cavity is calibrated through the phase transition of bismuth and barium under high pressure, and the corresponding relationship between system pressure and actual pressure inside the cavity is obtained [26]. The actual pressures in the sample capsule for 30 MPa and 40 MPa hydraulic pressures are estimated to be around 5 GPa and 7.7 GPa, respectively. The particle size distribution of five diamond powder samples were measured using a micron laser particle size analyzer, the Malvern MS 300, and the results are shown in Figure 1c. The average particle sizes corresponding to samples A, B, C, D and E are 3.1 μm, 8.8 μm, 13.4 μm, 19.7 μm and 24.5 μm, respectively.
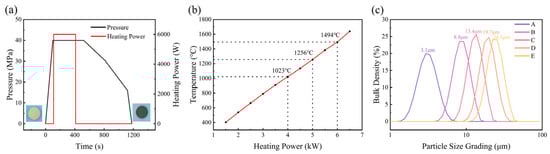
Figure 1.
(a) Hot-pressed conditions; (b) capsule temperature–heating power curve; (c) diamond particle size distributions.
3.2. Densities and Microstructure of Hot-Pressed Diamond Samples
The density of diamond samples with different particle sizes after hot pressing at 30 MPa-4 kW and 40 MPa-4 kW are shown in Figure 2. With increases in the diamond particle size, the density of the hot-pressed diamond increases and the porosity decreases. Sample E diamonds became remarkably dense after the treatments at 40 MPa-4 kW and reached 3.4 g/cm3, which is 97.1% of the theoretical density (3.5 g/cm3) of the diamond, which means that there is only 2.9 vol% porosity in the sample. For a given heating power, the samples became denser as the pressure increased. For a given pressure, the density slightly increased as the heating power inclined from 4 kW to 5 kW, which indicates that diamond elastically deformed more at a higher temperature. Due to the difficulty of removing the outside niobium cup, the densities of 6 kW samples have not been measured.
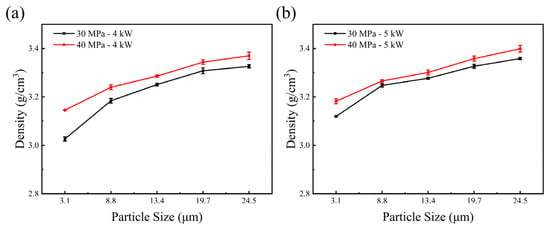
Figure 2.
(a) Densities of diamond samples A, B, C, D and E after hot pressing under 30 MPa-4 kW and 40 MPa-4 kW; (b) densities of diamond samples A, B, C, D and E after hot pressing under 30 MPa-5 kW and 40 MPa-5 kW.
Figure 3 shows the microstructures of sample A, sample B, sample C, sample D and sample E before and after 30 MPa and 6 kW hot pressing. Figure 3a,c,e,g,i are images before hot pressing, and it can be seen that the diamond particles retain their individual shapes, and their size gradually increases. Figure 3b,d,f,h,j are images after hot pressing. It is observed that the features of the cleavage surface on the original diamond particles have disappeared. The sharp edges on the surface have become smooth and rounded, and the particles are densely packed, as shown in Figure 3e,f. Furthermore, diamond particles can be observed bonding together in certain areas, and it is evident that diamond particles of various sizes have experienced crushing during HPHT treatment, with the smaller crushed particles filling the spaces around the larger particles. These smaller diamond particles have transformed into sheet-like structures after HTHP treatment. This indicates significant graphitization occurred during hot pressing. This may be due to the pressure between the large diamond grains being relatively low, resulting in the graphitization of the smaller crushed particles. Although some larger-sized components have experienced partial crushing during HPHT treatment, the percentage of fine particles is still the highest in sample A and the lowest in sample E.
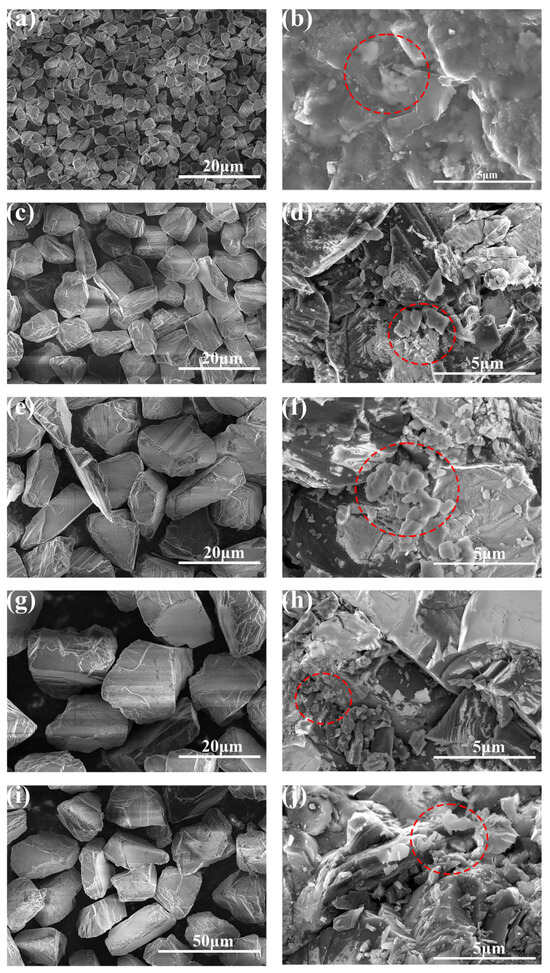
Figure 3.
SEM images of 30 MPa and 6 kW samples A, B, C, D and E: (a,c,e,g,i) are samples A, B, C, D and E before being hot pressed, respectively; (b,d,f,h,j) are samples A, B, C, D and E after being hot pressed, respectively (The red dashed circle represents diamond particles that become smooth and rounded after HPHT).
3.3. Electrical Resistance of Hot-Pressed Samples
The surfaces of the diamond samples after hot pressing were measured using an Omron multimeter. The electrical resistance was measured using the average value of five measurements. The results indicate that the HPHT hot-pressed diamond samples exhibit a certain level of electrical conductivity. In general, the pure diamond powder is non-conductive, while Figure 4a,b shows the electrical resistance of five samples hot pressed at 30 MPa and 40 MPa hydraulic pressures. It is evident that as the diamond particle size increases, the electric resistance of hot-pressed diamond samples gradually increases. This indicates that under the same treatment, smaller diamond particles (G2–4) have more sp3 carbon transformed to sp2 or amorphous carbon compared to coarser particles (G20–30), resulting in a reduction in the electrical resistance. This may be due to the higher pressure exerted on coarser diamond particles (G20–30) compared to smaller diamond particles (G2–4), resulting in the sp3 carbon on smaller diamond particles’ surfaces being less stable. It can be seen in Figure 4 that as the power increases, the electrical resistance decreases. This validates that at the same pressure, a higher temperature led to a higher degree of surface sp3 to sp2 carbon transformation.
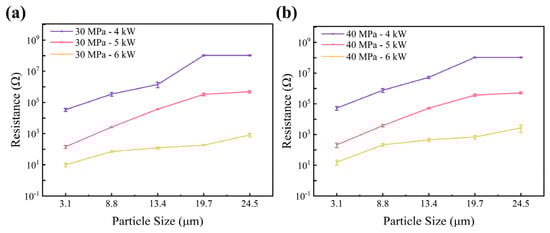
Figure 4.
Electrical resistance of the 30 MPa and 40 MPa hot-pressed diamond samples: (a) electrical resistance of hot-pressed diamond samples with different particle sizes under 30 MPa; (b) electrical resistance of hot-pressed diamond samples with different particle sizes under 40MPa.
3.4. Raman Spectra
Raman spectroscopy is an inelastic light scattering process that allows for the identification and characterization of the structure of molecules from gas to solid phases and from amorphous to crystals. In material sciences, it is commonly used to characterize the molecular structures of carbon-based materials and associated defects [27]. The Raman peaks of diamond and graphite are located at different positions, with 1332 cm−1 being the diamond peak and 1580 cm−1 being the graphite peak. Figure S1 shows the Raman and PL spectra of the original diamond. This indicates that nitrogen does exist in the original diamond. Figure S2 shows the Raman spectra of diamond samples with three different wavelengths of lasers: 325 nm, 532 nm and 785 nm. From the graph, it can be seen that the 1332 cm−1 peak is the diamond peak.
After removing the baseline through polynomial fitting and normalizing the diamond peaks of each sample, the results are shown in Figure 5.

Figure 5.
(a) Raman spectra of sample C after the treatments at 30 MPa with various heating powers; (b) Raman spectra of the 30 MPa-4 kW hot-pressed diamond samples A, B, C, D and E.
From Figure 5a, it can be observed that for sample C pressed at 30 MPa, as the heating temperature increases, the G peak at 1580 cm−1 gradually rises, as well as the amorphous peak in the range of 1450 cm−1 to 1555 cm−1. Figure 5b showed that for samples treated with 4 kW power and 30 MPa pressure, as the average particle size increases, the G peak at 1580 cm−1 gradually decreases, and the amorphous peak in the range of 1450 cm−1 to 1555 cm−1 also decreases.
During the hot-pressing stage, various carbon substances with sp2 and sp2/sp3 hybridization of carbon can be formed. From Figure 5, we did not see the sp2 peak at the low-frequency spectrum [28] or the second-order Raman peak [29] due to the insufficient sensitivity of the device. The peak shape is concentrated between 1000 cm−1 and 2000 cm−1. To quantitatively analyze the influence of pressure and temperature on the surface carbon phase transformation, select Raman spectra in the range of 800–2000 cm−1 for seven-peak fitting using Origin 2021 software. According to the references [30,31], the peak positions obtained through Gaussian fitting and their possible origins are listed in Table 1, and the peaks are numbered from left to right. The R2 values for all spectra during fitting are at least 0.995.

Table 1.
Seven peaks’ positions and boundaries.
Figure 6a–e represent hot-pressed samples of components A, B, C, D and E from 40 MPa to 4 kW, respectively. Figure 6c,f,g are 40 MPa -powder C samples treated with 4 kW, 5 kW and 6 kW heating powers. Other components can be found in Figure S4.
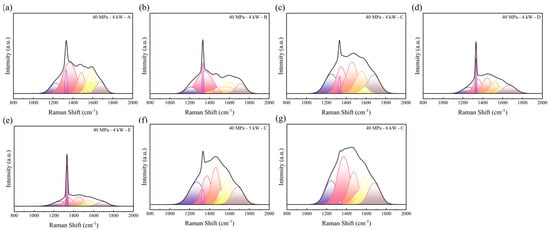
Figure 6.
Diamond Raman fitting peak: (a) sample A with 40 MPa-4 kW; (b) sample B with 40 MPa-4 kW; (c) sample C with 40 MPa-4 kW; (d) sample D with 40 MPa-6 kW; (e) sample E with 40 MPa-6 kW; (f) sample C with 40 MPa-5 kW; (g) sample C with 40 MPa-6 kW.
The sharp peak at 1330 cm−1 to 1340 cm−1 is characteristic of the first-order Raman line of crystalline diamond [33,34,35], and it indicates the presence of the diamond in the sample. As the heating power increases, the diamond peak area gradually decreases. The peak at 1575 cm−1 to 1600 cm−1 is caused by the “G peak” of sp2 carbon [36,37]; it indicates the conversion of the surface diamond into graphite after HPHT treatment. As the heating power increases, the G peak area gradually increases. The graphite content is represented by the ratio of the diamond peak area to the graphite G peak area (AC/AG) [38,39,40,41], as shown in Figure 7.
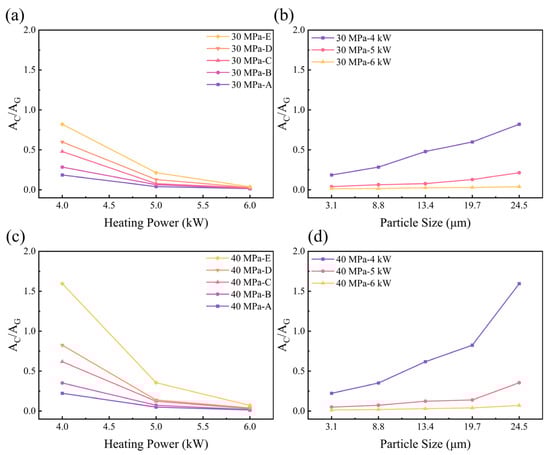
Figure 7.
Diamond samples’ graphite content parameter: (a) 30 MPa with different particle sizes; (b) 30 MPa with different heating powers; (c) 40 MPa with different particle sizes; (d) 40 MPa with different heating powers.
From Figure 7, it can be seen that under the same heating power and pressure conditions, as the diamond particle size increases, the AC/AG gradually increases, which indicates a lower degree of graphitization. For the same diamond particle size and pressure conditions, as the heating power increases, the AC/AG gradually decreases, which indicates a higher degree of graphitization.
3.5. Influence of Particle Sizes and Heating Powers on the Residual Stresses in Hot-Pressed Samples
A Raman spectrometer was employed to measure the diamond peak shifts of various diamond samples and calculate the residual stresses. In order to remove the particle size effect on the Raman spectra diamond peak [42], the reference peak position for five diamond powders with various particle sizes were determined individually using the average value of 10 measurements. The residual stresses were calculated using the Raman peak shifts after HTHP treatments. The results are shown in Table 2.
Table 2.
Raman diamond peaks and residual stresses of hot-pressed samples.
The stress values were calculated using the following formula [43,44]:
where σb is the residual stress, γ0 is the reference peak and γ is the diamond peak. Negative values represent compressive stress, while positive values indicate tensile stress. As seen in Table 2, all measured samples exhibited residual compressive stress. The residual compressive stress increases with increases in the particle size and also increases with higher heating temperatures. For the same diamond powders, as the pressure increases from 30 MPa to 40 MPa, the residual stress also increases.
Figure 8 shows the AC/AG and residual stress of hot-pressed samples plotted against the particle size. All data indicated that the residual internal stresses increased with increases in the particle size, although the trends were different as the HPHT parameters changed. As the diamond particle size increased, the increased residual stresses further proved that larger diamond particle surfaces have experienced higher local stresses. As a result, the graphite content decreased correspondingly.
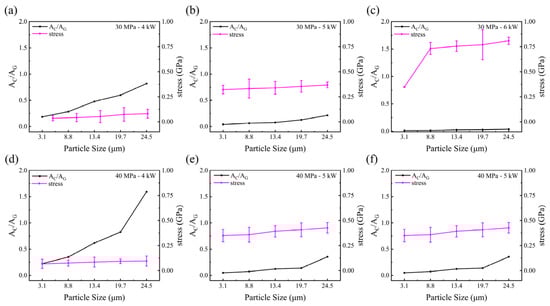
Figure 8.
The graphite content parameter (AC/AG) and the residual stresses of hot-pressed samples vary with particle sizes: (a) 30 MPa-4 kW; (b) 30 MPa-5 kW; (c) 30 MPa-6 kW; (d) 40 MPa-4 kW; (e) 40 MPa-5 kW; (f) 40 MPa-6 kW.
To deeply delve into the impact of the diamond particle size on residual internal stress, a two-dimensional finite element model was established using the finite element simulation software Abaqus 2020. Ignoring the irregular shapes of diamond particles, the diamond particles were represented as circular shapes. Force analyses were simulated for 7.5 mm and 30 mm diamond particles under identical external pressures. Figure 9 depicts the simulation results when the same external force was applied. The deeper the color, the higher the stress.
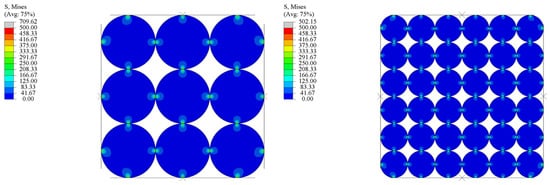
Figure 9.
Finite element simulation of stresses on diamond particles.
It clearly demonstrates that larger particles experience a higher pressure under the same external forces compared to smaller ones. The reason is that the increase in particle size leads to a reduction in the number of contact points, resulting in a higher localized pressure at each contact point, and the pressure is relatively low in the non-contact position. This explains why the residual stress increases with increases in the diamond powder particle size under the same temperature and pressure conditions. Furthermore, we believe that a higher pressure on the diamond surface is more conducive to maintaining the sp3 structure, which provides an explanation for the decrease in the graphite content as the diamond powder particle size increases. In additions, it is interesting to note that the residual stresses incline with increases in the heating temperature. This is because diamond particles deform more and reach a denser compact at a higher temperature; when they cool down, more residual stresses are left on the diamond particles’ surface.
4. Conclusions and Prospects
In summary, a series of poly-diamond plates were produced using a cubic press with a range of 6–8 GPa and 1000–1500 °C using various sizes of microdiamond powders. Some phenomena were found as follows:
- (1)
- After HPHT treatment, the diamond particles were observed to bond together in certain areas, resulting in the formation of diamond plate samples exhibiting both strength and some electrical conductivity.
- (2)
- During the HPHT hot-compressing stage, diamond powders were further densified via the elastic and non-elastic deformation of diamond powders, and the density can reach up to 3.4 g/cm3, 97.1% of the diamond itself, approaching a full dense diamond plate. The density increases with the diamond particle size, pressure and temperature.
- (3)
- Diamond powders with different particle sizes undergo varying degrees of sp3 to sp2 or amorphous carbon transformation on the surface. The graphite content on diamond surfaces increases as the particle size decreases. There are two primary reasons for this phenomenon. Firstly, smaller particles have a higher surface energy, resulting in a lower activation energy for graphite transformation and making the diamond more prone to graphitize. Secondly, smaller particles possess a higher number of contact areas, which can reduce the local stress on the diamond under the same pressure. Conversely, coarser diamond particles have a lower surface energy, higher activation energy for graphite and fewer contact areas. This can result in higher residual stresses and a reduced graphitization under the same pressure.
These valuable data are important to understand the hot-press stage of diamond powders, which could facilitate the optimization of the HPHT sintering process of PCDs and the HPHT treatment of diamonds. Due to the inherent low strength and similar thermal expansion coefficients of these hot-pressed diamond plates, these hot-pressed samples could be suitable as CVD polycrystalline diamonds’ substrates. Furthermore, with an adjustable electrical conductivity combined with a microporous microstructure and diamonds’ high resistance to chemicals, the poly-diamond plates might find some potential application in the electrical chemistry industry as electrodes.
Supplementary Materials
The following supporting information can be downloaded at https://www.mdpi.com/article/10.3390/ma17030603/s1, Figure S1: (a) Original diamond Raman spectroscopy and (b) original diamond PL spectrum; Figure S2: Raman spectra of hot-pressed diamonds with three different wavelengths; Figure S3: Raman spectra of each hot-pressed diamond sample; Figure S4: Fitted Raman spectra of each hot-pressed diamond sample; Table S1: Experimental conditions for hot-pressed samples.
Author Contributions
Conceptualization, R.M., X.C. and L.D.; Data curation, R.M.; Formal analysis, R.M. and X.C.; Funding acquisition, Y.L., L.D. and H.L.; Investigation, R.M. and X.C.; Methodology, R.M. and X.C.; Project administration, L.D.; Resources, J.H., S.Z., S.H., Y.L., H.L. and F.L.; Software, R.M.; Validation, R.M., X.C. and L.D.; Writing—original draft, R.M.; Writing—review and editing, R.M., X.C., H.L. and L.D. All authors have read and agreed to the published version of the manuscript.
Funding
This research was funded by the National Key R&D Program of China (2022YFB3706602), Ningbo 2025 Major Project (2022Z191), Yongjiang Talent Introduction Program of Ningbo (2021A-037-C, 2021A-108-G), Youth Fund of the Chinese Academy of Sciences (No. JCPYJ-22030), Science and Technology Major Project of Ningbo (2021ZDYF020196), Project of the Chinese Academy of Science (ZDKYYQ2020001) and National Natural Science Foundation of China (Grant No. U21A20122).
Institutional Review Board Statement
Not applicable.
Informed Consent Statement
Not applicable.
Data Availability Statement
Data are contained within the article.
Conflicts of Interest
The authors declare no conflicts of interest.
References
- Zeren, M.; Karagöz, Ş. Sintering of polycrystalline diamond cutting tools. Mater. Des. 2007, 28, 1055–1058. [Google Scholar] [CrossRef]
- Hall, H.T. Sintered diamond: A synthetic carbonado. Science 1970, 169, 868–869. [Google Scholar] [CrossRef] [PubMed]
- Zou, B.; Sun, H.; Guo, H.; Dai, B.; Zhu, J. Thermal characteristics of GaN-on-diamond HEMTs: Impact of anisotropic and inhomogeneous thermal conductivity of polycrystalline diamond. Diam. Relat. Mater. 2019, 95, 28–35. [Google Scholar] [CrossRef]
- Li, J.; Yue, W.; Qin, W.; Mao, Q.; Gao, B.; Li, Y. Effect of quenching processes on microstructures and tribological behaviors of polycrystalline diamond compact (PCD/WC-Co) in annealing treatment. Diam. Relat. Mater. 2017, 79, 79–87. [Google Scholar] [CrossRef]
- Knuteson, C.W.; Sexton, T.N.; Cooley, C.H. Wear-in behaviour of polycrystalline diamond thrust bearings. Wear 2011, 271, 2106–2110. [Google Scholar] [CrossRef]
- Belnap, D.; Griffo, A. Homogeneous and structured PCD/WC-Co materials for drilling. Diam. Relat. Mater. 2004, 13, 1914–1922. [Google Scholar] [CrossRef]
- Yahiaoui, M.; Gerbaud, L.; Paris, J.Y.; Denape, J.; Dourfaye, A. A study on PDC drill bits quality. Wear 2013, 298–299, 32–41. [Google Scholar] [CrossRef]
- Li, Z.; Jia, H.; Ma, H.; Guo, W.; Liu, X.; Huang, G.; Li, R.; Jia, X. FEM analysis on the effect of cobalt content on thermal residual stress in polycrystalline diamond compact (PDC). Sci. China Phys. Mech. Astron. 2012, 55, 639–643. [Google Scholar] [CrossRef]
- Sexton, T.N.; Cooley, C.H. Polycrystalline diamond thrust bearings for down-hole oil and gas drilling tools. Wear 2009, 267, 1041–1045. [Google Scholar] [CrossRef]
- Wentorf, R.H.; Devries, R.C.; Bundy, F.P. Sintered superhard materials. Science 1980, 208, 873–880. [Google Scholar] [CrossRef] [PubMed]
- Scott, T.A. The influence of microstructure on the mechanical properties of polycrystalline diamond: A literature review. Adv. Appl. Ceram. 2017, 117, 161–176. [Google Scholar] [CrossRef]
- Schnell, E.; Rein, C.; Rhede, D.; Zahn, G.; Stiller, H. To the synthesis of polycrystalline diamond. High Press. Res. 2006, 5, 917–919. [Google Scholar] [CrossRef]
- Yang, X.; Deng, F. Synthesis and characterisation of Φ62 mm polycrystalline diamond compact. Diam. Relat. Mater. 2019, 100, 107594. [Google Scholar] [CrossRef]
- Sha, X.; Feng, B.; Yue, W.; Wang, C. Comparison of tribological behaviors of polycrystalline diamonds synthesized by titanium- and boron-coated diamond particles. Diam. Relat. Mater. 2022, 128, 109242. [Google Scholar] [CrossRef]
- Cui, X.; Qin, Y.; Mao, R.; Hao, J.; Zhao, S.; Lin, Z.; Deng, L.; Jiang, N.; Cui, P. Particle Cold Pressing Fragmentation in the Process of Synthesizing Polycrystalline Diamond. Diam. Abras. Eng. 2023, 43, 440–446. [Google Scholar] [CrossRef]
- Hickey, D.P.; Jones, K.S.; Elliman, R.G. Amorphization and graphitization of single-crystal diamond—A transmission electron microscopy study. Diam. Relat. Mater. 2009, 18, 1353–1359. [Google Scholar] [CrossRef]
- Nikhar, T.; Rechenberg, R.; Becker, M.F.; Baryshev, S.V. Dynamic graphitization of ultra-nano-crystalline diamond and its effects on material resistivity. J. Appl. Phys. 2020, 128, 235305. [Google Scholar] [CrossRef]
- Bokhonov, B.B.; Dudina, D.V.; Sharafutdinov, M.R. Graphitization of synthetic diamond crystals: A morphological study. Diam. Relat. Mater. 2021, 118, 108563. [Google Scholar] [CrossRef]
- Chen, L.; Yang, X.; Fang, C.; Shi, A.; Liu, R.; Huang, Q. Improved Thermal Conductivity and Ablation Resistance of Microdiamond-Modified C/C Composites after Diamond Graphitization. Adv. Eng. Mater. 2019, 22, 1900934. [Google Scholar] [CrossRef]
- Yang, Z.-L.; Wang, L.-G.; Wang, L.-M.; He, X.-B.; Qu, X.-H.; Liu, R.-J.; Hu, H.-F. Microstructure and graphitization behavior of diamond/SiC composites fabricated by vacuum vapor reactive infiltration. Rare Met. 2014, 34, 400–406. [Google Scholar] [CrossRef]
- Yan, X.; Wei, J.; An, K.; Liu, J.; Chen, L.; Zheng, Y.; Zhang, X.; Li, C. High temperature surface graphitization of CVD diamond films and analysis of the kinetics mechanism. Diam. Relat. Mater. 2021, 120, 108647. [Google Scholar] [CrossRef]
- Davies, G.; Evans, T. Graphitization of Diamond at Zero Pressure and at a High Pressure. Proc. R. Soc. A Math. Phys. Eng. Sci. 1972, 328, 413–427. [Google Scholar]
- Qian, J.; Pantea, C.; Huang, J.; Zerda, T.W.; Zhao, Y. Graphitization of diamond powders of different sizes at high pressure-high temperature. Carbon 2004, 42, 2691–2697. [Google Scholar] [CrossRef]
- Iwanaga, K.; Tada, K.-i.; Chiba, H.; Yamamoto, T.; Maniwa, A.; Yotsuya, T.; Oshima, N. Development of Novel Silicon Precursors for Low-Temperature CVD/ALD Processes. ECS Trans. 2011, 41, 211–218. [Google Scholar] [CrossRef]
- Carcione, R.; Guglielmotti, V.; Mura, F.; Orlanducci, S.; Tamburri, E. Monitoring of Carbonated Hydroxyapatite Growth on Modified Polycrystalline CVD-Diamond Coatings on Titanium Substrates. Crystals 2024, 14, 66. [Google Scholar] [CrossRef]
- Haikuo, W.; Ying, R.; Duanwei, H.; Chao, X. Force analysis and pressure quantitative measurement for the high pressure cubic cell. Acta Phys. Sin. 2017, 66, 090702. [Google Scholar]
- Merlen, A.; Buijnsters, J.; Pardanaud, C. A Guide to and Review of the Use of Multiwavelength Raman Spectroscopy for Characterizing Defective Aromatic Carbon Solids: From Graphene to Amorphous Carbons. Coatings 2017, 7, 153. [Google Scholar] [CrossRef]
- Pardanaud, C.; Cartry, G.; Lajaunie, L.; Arenal, R.; Buijnsters, J.G. Investigating the Possible Origin of Raman Bands in Defective sp2/sp3 Carbons below 900 cm−1: Phonon Density of States or Double Resonance Mechanism at Play? J. Carbon Res. 2019, 5, 79. [Google Scholar] [CrossRef]
- Ferrari, A.C.; Robertson, J. Raman spectroscopy in carbons: From nanotubes to diamond. Philos. Trans. R. Soc. A Math. Phys. Eng. Sci. 2004, 362, 2269–2270. [Google Scholar] [CrossRef]
- Brubaker, Z.E.; Langford, J.J.; Kapsimalis, R.J.; Niedziela, J.L. Quantitative analysis of Raman spectral parameters for carbon fibers: Practical considerations and connection to mechanical properties. J. Mater. Sci. 2021, 56, 15087–15121. [Google Scholar] [CrossRef]
- Moseenkov, S.I.; Kuznetsov, V.L.; Zolotarev, N.A.; Kolesov, B.A.; Prosvirin, I.P.; Ishchenko, A.V.; Zavorin, A.V. Investigation of Amorphous Carbon in Nanostructured Carbon Materials (A Comparative Study by TEM, XPS, Raman Spectroscopy and XRD). Materials 2023, 16, 1112. [Google Scholar] [CrossRef] [PubMed]
- Ferrari, A.C.; Robertson, J. Raman spectroscopy of amorphous, nanostructured, diamond-like carbon, and nanodiamond. Philos. Trans. A Math. Phys. Eng. Sci. 2004, 362, 2477–2512. [Google Scholar] [CrossRef]
- Abdu, Y.A. Raman micro-spectroscopy of nanodiamonds from the Kapoeta meteorite. Diam. Relat. Mater. 2021, 118, 108536. [Google Scholar] [CrossRef]
- Orwa, J.O.; Andrienko, I.; Peng, J.L.; Prawer, S.; Zhang, Y.B.; Lau, S.P. Thermally induced sp2 clustering in tetrahedral amorphous carbon (ta-C) films. J. Appl. Phys. 2004, 96, 6286–6297. [Google Scholar] [CrossRef]
- Knight, D.S.; White, W.B. Characterization of diamond films by Raman spectroscopy. J. Mater. Res. 2011, 4, 385–393. [Google Scholar] [CrossRef]
- Conway, N.M.J.; Ferrari, A.C.; Flewitt, A.J.; Robertson, J.; Milne, W.I.; Tagliaferro, A.; Beyer, W. Defect and disorder reduction by annealing in hydrogenated tetrahedral amorphous carbon. Diam. Relat. Mater. 2000, 9, 765–770. [Google Scholar] [CrossRef]
- Rodil, S.E.; Ferrari, A.C.; Robertson, J.; Muhl, S. Infrared spectra of carbon nitride films. Thin Solid Film. 2002, 420–421, 122–131. [Google Scholar] [CrossRef]
- Gou, R.; Luo, X.; Li, K.; Kang, C.; Chen, J. PCD after cobalt leaching reinforced by high temperature annealing: Tribological properties and graphitization evolution. Diam. Relat. Mater. 2022, 125, 108988. [Google Scholar] [CrossRef]
- Zhang, Y.; Polychronopoulou, K.; Humood, M.; Polycarpou, A.A. High temperature nanotribology of ultra-thin hydrogenated amorphous carbon coatings. Carbon 2017, 123, 112–121. [Google Scholar] [CrossRef]
- Li, J.; Yue, W.; Qin, W.; Wang, C. Approach to controllable tribological properties of sintered polycrystalline diamond compact through annealing treatment. Carbon 2017, 116, 103–112. [Google Scholar] [CrossRef]
- Li, Q.; Zhang, J.; Liu, J.; Tian, Y.; Liang, W.; Zheng, L.; Zhou, L.; He, D. Effect of stress state on graphitization behavior of diamond under high pressure and high temperature. Diam. Relat. Mater. 2022, 128, 109241. [Google Scholar] [CrossRef]
- Osswald, S.; Mochalin, V.N.; Havel, M.; Yushin, G.; Gogotsi, Y. Phonon confinement effects in the Raman spectrum of nanodiamond. Phys. Rev. B 2009, 80, 075419. [Google Scholar] [CrossRef]
- Jia, H.; Ma, H.; Guo, W.; Jia, X. HPHT preparation and Micro-Raman characterization of polycrystalline diamond compact with low residual stress. Sci. China Phys. Mech. Astron. 2010, 53, 1445–1448. [Google Scholar] [CrossRef]
- Catledge, S.A.; Vohra, Y.K.; Ladi, R.; Rai, G. Micro-raman stress investigations and X-ray diffraction analysis of polycrystalline diamond (PCD) tools. Diam. Relat. Mater. 1996, 5, 1159–1165. [Google Scholar] [CrossRef]


Disclaimer/Publisher’s Note: The statements, opinions and data contained in all publications are solely those of the individual author(s) and contributor(s) and not of MDPI and/or the editor(s). MDPI and/or the editor(s) disclaim responsibility for any injury to people or property resulting from any ideas, methods, instructions or products referred to in the content. |
© 2024 by the authors. Licensee MDPI, Basel, Switzerland. This article is an open access article distributed under the terms and conditions of the Creative Commons Attribution (CC BY) license (https://creativecommons.org/licenses/by/4.0/).