
Fast Joule Heating for the Scalable and Green Production of Graphene with a High Surface Area

 ,
,
Abstract
1. Introduction
2. Materials and Methods
3. Results
4. Discussion
Author Contributions
Funding
Institutional Review Board Statement
Informed Consent Statement
Data Availability Statement
Acknowledgments
Conflicts of Interest
References
- Liu, P.; Chen, G.-F. Applications of Porous Ceramics. In Porous Materials Processing and Applications, 1st ed.; Elsevier Inc.: Amsterdam, The Netherlands, 2014; pp. 303–344. [Google Scholar]
- Huang, H.; Shi, H.; Das, P.; Qin, J.; Li, Y.; Wang, X.; Su, F.; Wen, P.; Li, S.; Lu, P.; et al. The chemistry and promising applications of graphene and porous graphene materials. Adv. Funct. Mater. 2020, 30, 1909035. [Google Scholar] [CrossRef]
- Wang, Y.; Chen, J.; Ihara, H.; Guan, M.; Qiu, H.D. Preparation of porous carbon nanomaterials and their application in sample preparation: A review. TrAC Trend. Anal. Chem. 2021, 143, 116421. [Google Scholar] [CrossRef]
- Han, J.; Johnson, I.; Chen, M. 3D continuously porous graphene for energy applications. Adv. Mater. 2022, 34, 2108750. [Google Scholar] [CrossRef]
- Das, A.; Deka, J.; Rather, A.M.; Bhunia, B.K.; Saikia, P.P.; Mandal, B.B.; Raidongia, K.; Manna, U. Strategic formulation of graphene oxide sheets for flexible monoliths and robust polymeric coatings embedded with durable bioinspired wettability. ACS Appl. Mater. Interfaces 2017, 9, 42354–42365. [Google Scholar] [CrossRef]
- Das, A.; Deka, J.; Raidongia, K.; Manna, U. Robust and self-healable bulk-superhydrophobic polymeric coating. Chem. Mater. 2017, 29, 8720–8728. [Google Scholar] [CrossRef]
- Hooch Antink, W.; Choi, Y.; Seong, K.D.; Kim, J.M.; Piao, Y. Recent progress in porous graphene and reduced graphene oxide-based nanomaterials for electrochemical energy storage devices. Adv. Mater. Interfaces 2018, 5, 1701212. [Google Scholar] [CrossRef]
- Zhu, Y.; Murali, S.; Cai, W.; Li, X.; Suk, J.W.; Potts, J.R.; Ruoff, R.S. Graphene and graphene oxide: Synthesis, properties, and applications. Adv. Mater. 2010, 22, 3906–3924. [Google Scholar] [CrossRef]
- Pei, S.; Cheng, H.-M. The reduction of graphene oxide. Carbon 2012, 50, 3210–3228. [Google Scholar] [CrossRef]
- Alam, S.N.; Sharma, N.; Kumar, L. Synthesis of graphene oxide (GO) by modified hummers method and its thermal reduction to obtain reduced graphene oxide (rGO). Graphene 2017, 6, 1–18. [Google Scholar] [CrossRef]
- Huang, L.; Liu, Y.; Ji, L.C.; Xie, Y.Q.; Wang, T.; Shi, W.Z. Pulsed laser assisted reduction of graphene oxide. Carbon 2011, 49, 2431–2436. [Google Scholar] [CrossRef]
- Voiry, D.; Yang, J.; Kupferberg, J.; Fullon, R.; Lee, C.; Jeong, H.Y.; Shin, H.S.; Chhowalla, M. High-quality graphene via microwave reduction of solution-exfoliated graphene oxide. Science 2016, 353, 1413–1416. [Google Scholar] [CrossRef] [PubMed]
- Park, S.; An, J.; Potts, J.R.; Velamakanni, A.; Murali, S.; Ruoff, R.S. Hydrazine-reduction of graphite- and graphene oxide. Carbon 2011, 49, 3019–3023. [Google Scholar] [CrossRef]
- Shin, H.J.; Kim, K.K.; Benayad, A.; Yoon, S.; Park, H. Efficient reduction of graphite oxide by sodium borohydride and its effect on electrical conductance. Adv. Funct. Mater. 2009, 19, 1987–1992. [Google Scholar] [CrossRef]
- de Barros, N.G.; Gonzaga Neto, A.C.; Vaccioli, K.B.; Angulo, H.R.V.; de Andrade e Silva, L.G.; Toffoli, S.M.; Valera, T.S. Graphene Oxide: A Comparison of Reduction Methods. C 2023, 9, 73. [Google Scholar] [CrossRef]
- Vasilieva, F.D.; Kapitonov, A.N.; Yakimchuk, E.A.; Smagulova, S.A.; Antonova, I.V.; Kotin, I.A. Mildly oxidized graphene oxide suspension for printing technologies. Mater. Res. Express 2018, 5, 65608. [Google Scholar] [CrossRef]
- Parvez, K.; Wu, Z.S.; Li, R.; Liu, X.; Graf, R.; Feng, X.; Müllen, K. Exfoliation of graphite into graphene in aqueous solutions of inorganic salts. J. Am. Chem. Soc. 2014, 136, 6083–6091. [Google Scholar] [CrossRef] [PubMed]
- Achee, T.C.; Sun, W.; Hope, J.T.; Quitzau, S.G.; Sweeney, C.B.; Shah, S.A.; Habib, T.; Green, M.J. High-Yield Scalable Graphene Nanosheet Production from Compressed Graphite Using Electrochemical Exfoliation. Sci. Rep. 2018, 8, 14525. [Google Scholar] [CrossRef] [PubMed]
- Muhsan, A.A.; Lafdi, K. Numerical study of the electrochemical exfoliation of graphite. SN Appl. Sci. 2019, 1, 276. [Google Scholar] [CrossRef]
- Heidarinejad, Z.; Dehghani, M.H.; Heidari, M.; Javedan, G.; Ali, I.; Sillanpää, M. Methods for preparation and activation of activated carbon: A review. Environ. Chem. Lett. 2020, 18, 393–415. [Google Scholar] [CrossRef]
- Wang, G.; Yu, M.; Feng, X. Carbon materials for ion-intercalation involved rechargeable battery technologies. Chem. Soc. Rev. 2021, 50, 2388–2443. [Google Scholar] [CrossRef]
- Wyss, K.M.; Luong, D.X.; Tour, J.M. Large-scale syntheses of 2D Materials: Flash joule heating and other methods. Adv. Mater. 2021, 34, 2106970. [Google Scholar] [CrossRef]
- Karim, G.M.; Dutta, P.; Majumdar, A.; Patra, A.; Deb, S.K.; Das, S.; Dambhare, N.V.; Rath, A.K.; Maiti, U.N. Ultra-fast electro-reduction and activation of graphene for high energy density wearable supercapacitor asymmetrically designed with MXene. Carbon 2023, 203, 191–201. [Google Scholar] [CrossRef]
- Zhao, Y.; Liu, H.; Li, S.; Chen, P.; Jiang, S.; Liu, J.; Meng, F. Rapid joule-heating activation boosted capacitive performance of carbon fibers. Compos. Commun. 2022, 34, 101263. [Google Scholar] [CrossRef]
- Prokop’ev, A.R.; Neustroev, E.P.; Loskin, N.N.; Vinokurov, P.V.; Evseev, Z.I.; Popov, D.N. Poluchenie turbostratnogo grafena iz plastikovyh othodov. Vestn. Sev.—Vostochnogo Fed. Univ. MK Ammosova 2023, 3, 33–41. (In Russian) [Google Scholar]
- ISO 9277:2022; Determination of the Specific Surface Area of Solids by Gas Adsorption. IUPAC: Zurich, Switzerland, 2022.
- Jamil, A.; Mustafa, F.; Aslam, S.; Arshad, U.; Ahmad, M.A. Structural and optical properties of thermally reduced graphene oxide for energy devices. Chin. Phys. B 2017, 26, 086501–086508. [Google Scholar] [CrossRef]
- Chen, D.; Feng, H.; Li, J. Graphene Oxide: Preparation, Functionalization, and Electrochemical Applications. Chem. Rev. 2012, 112, 6027–6053. [Google Scholar] [CrossRef]
- Malard, L.M.; Pimenta, M.A.; Dresselhaus, G.; Dresselhaus, M.S. Raman spectroscopy in graphene. Phys. Rep. 2009, 473, 51–87. [Google Scholar] [CrossRef]
- Das, A.; Chakraborty, B.; Sood, A.K. Raman spectroscopy of graphene on different substrates and influence of defects. Bull. Mater. Sci. 2008, 31, 579–584. [Google Scholar] [CrossRef]
- Roscher, S.; Hoffmann, R.; Ambacher, O. Determination of the graphene-graphite ratio of graphene powder by Raman 2D band symmetry analysis. Anal. Methods 2019, 11, 1224–1228. [Google Scholar] [CrossRef]
- Ferrari, A.C.; Basko, D.M. Raman spectroscopy as a versatile tool for studying the properties of graphene. Nat. Nano 2013, 8, 235–246. [Google Scholar] [CrossRef]
- Compagnini, G.; Giannazzo, F.; Sonde, S.; Raineri, V.; Rimini, E. Ion irradiation and defect formation in single layer graphene. Carbon 2009, 47, 3201–3207. [Google Scholar] [CrossRef]
- Díez-Betriu, X.; Álvarez-García, S.; Botas, C.; Álvarez, P.; Sánchez-Marcos, J.; Prieto, C.; Menendez, R.; De Andrés, A. Raman spectroscopy for the study of reduction mechanisms and optimization of conductivity in graphene oxide thin films. J. Mater. Chem. C 2013, 1, 6905. [Google Scholar] [CrossRef]
- Giannazzo, F.; Dagher, R.; Schilirò, E.; Panasci, S.E.; Greco, G.; Nicotra, G.; Roccaforte, F.; Agnello, S.; Brault, J.; Cordier, Y.; et al. Nanoscale structural and electrical properties of graphene grown on AlGaN by catalyst-free chemical vapor deposition. Nat. Nanotechnol. 2020, 32, 015705. [Google Scholar] [CrossRef]
- Beams, R.; Gustavo Cançado, L.; Novotny, L. Raman characterization of defects and dopants in graphene. J. Phys. Condens. Matter 2015, 27, 083002. [Google Scholar] [CrossRef]
- Bhatt, M.D.; Kim, H.; Kim, G. Various defects in graphene: A review. RSC Adv. 2022, 12, 21520–21547. [Google Scholar] [CrossRef] [PubMed]
- Cançado, L.G.; Takai, K.; Enoki, T.; Endo, M.; Kim, Y.A.; Mizusaki, H.; Jorio, A.; Coelho, L.N.; Magalhães-Paniago, R.; Pimenta, M.A. General equation for the determination of the crystallite size La of nanographite by Raman spectroscopy. Appl. Phys. Lett. 2006, 88, 163106. [Google Scholar] [CrossRef]
- Graf, D.; Molitor, F.; Ensslin, K.; Stampfer, C.; Jungen, A.; Hierold, C.; Wirtz, L. Spatially resolved Raman spectroscopy of single-and few-layer graphene. Nano Lett. 2007, 7, 238–242. [Google Scholar] [CrossRef]

| Content | MOG | aMOG–200 |
|---|---|---|
| C, at. % | 85.9 | 95.8 |
| O, at. % | 14.1 | 4.2 |
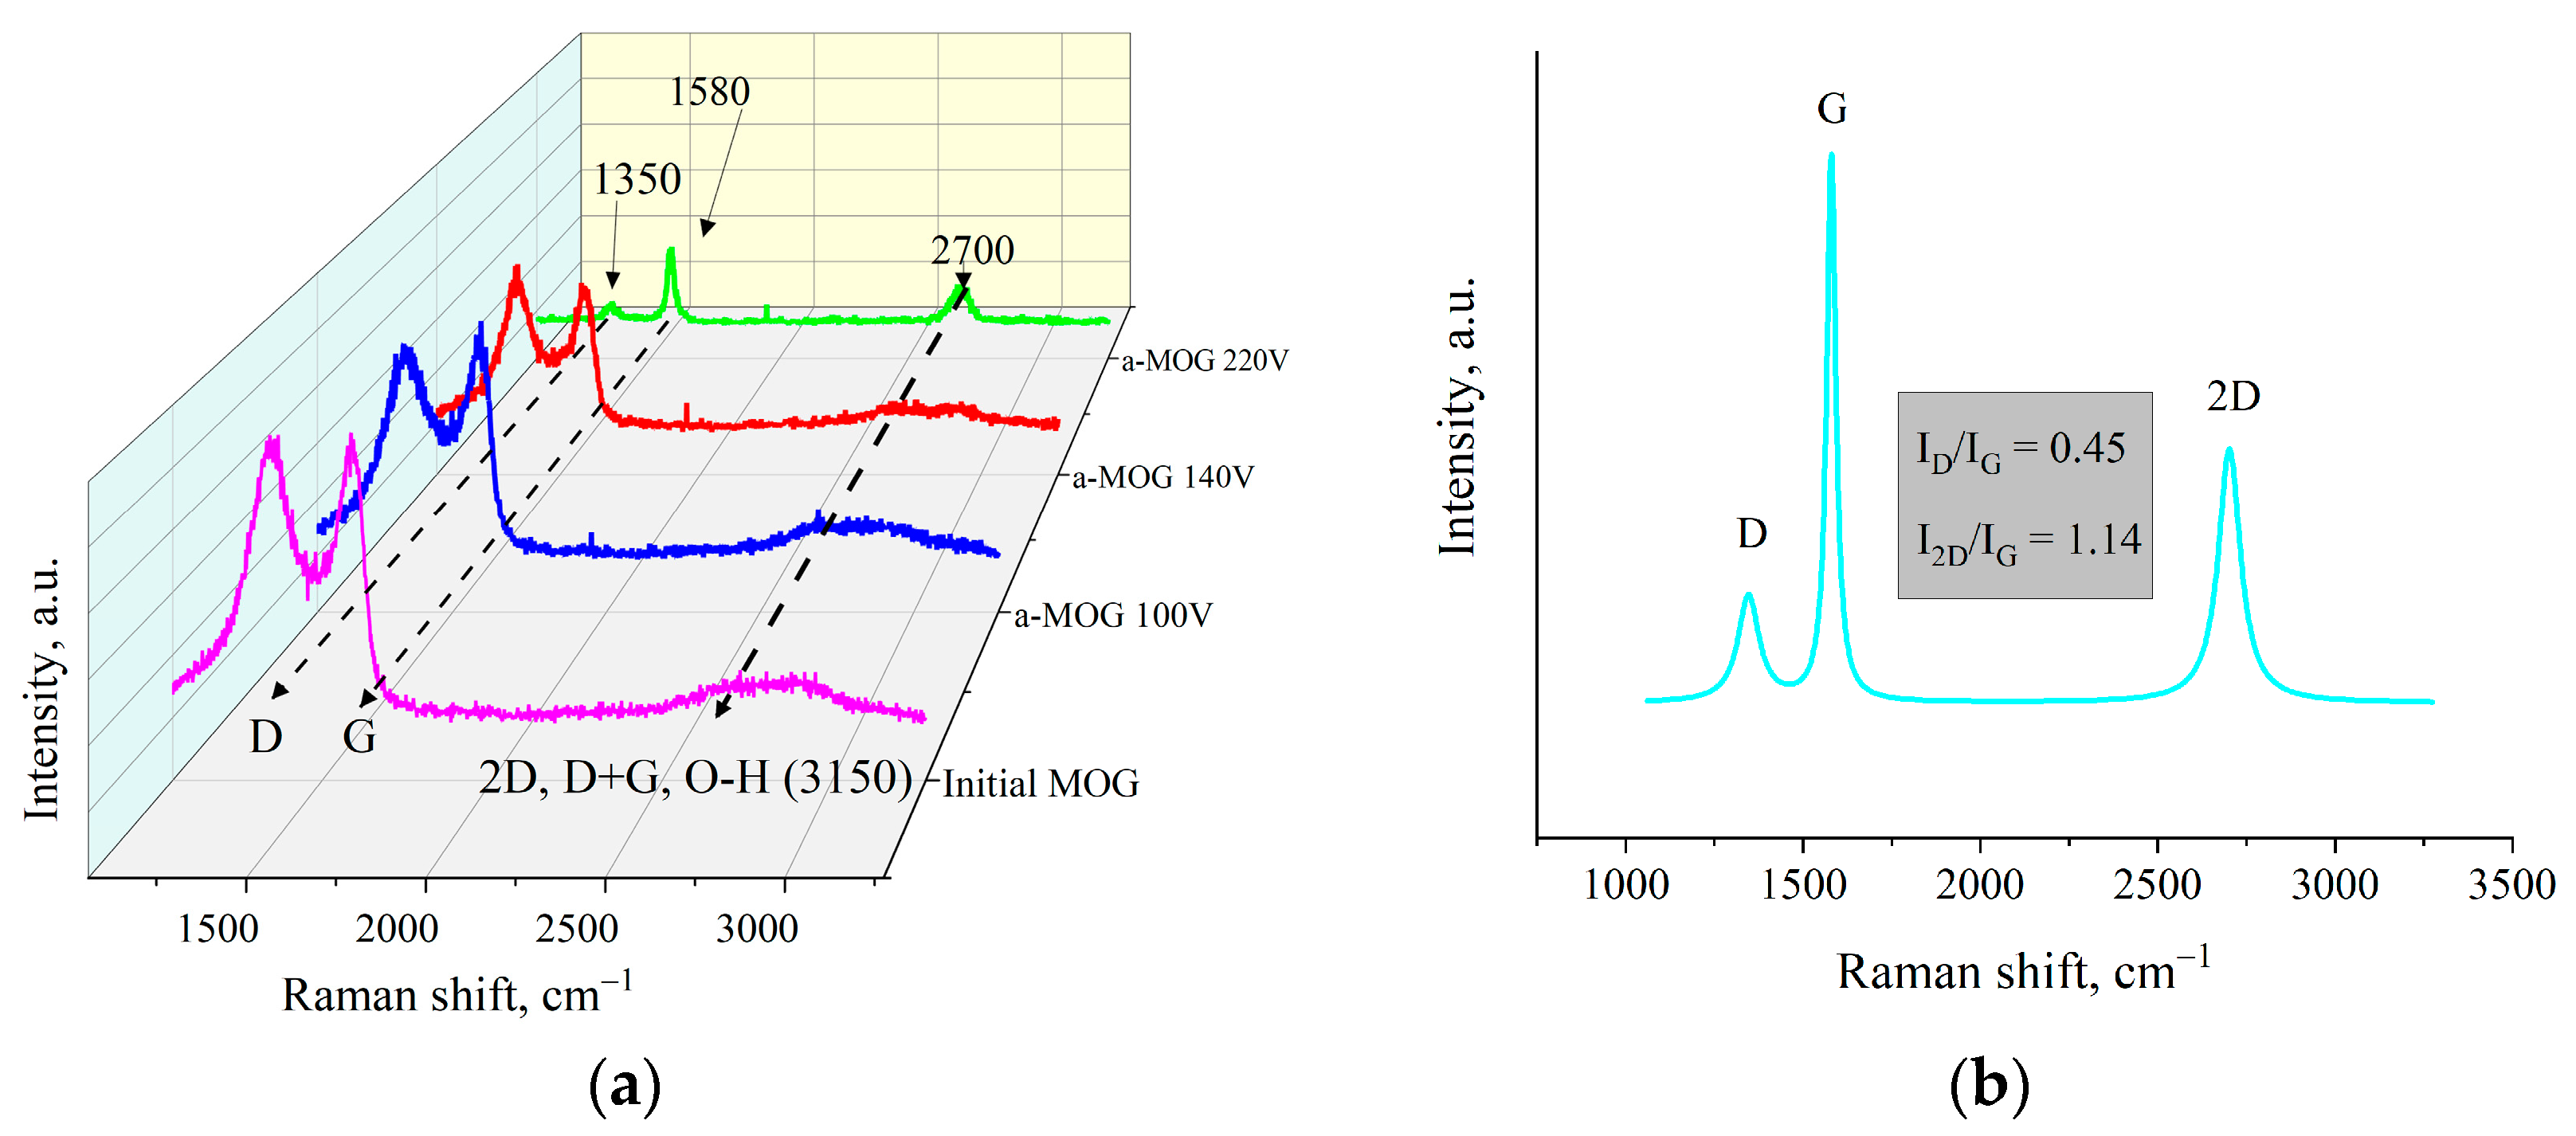
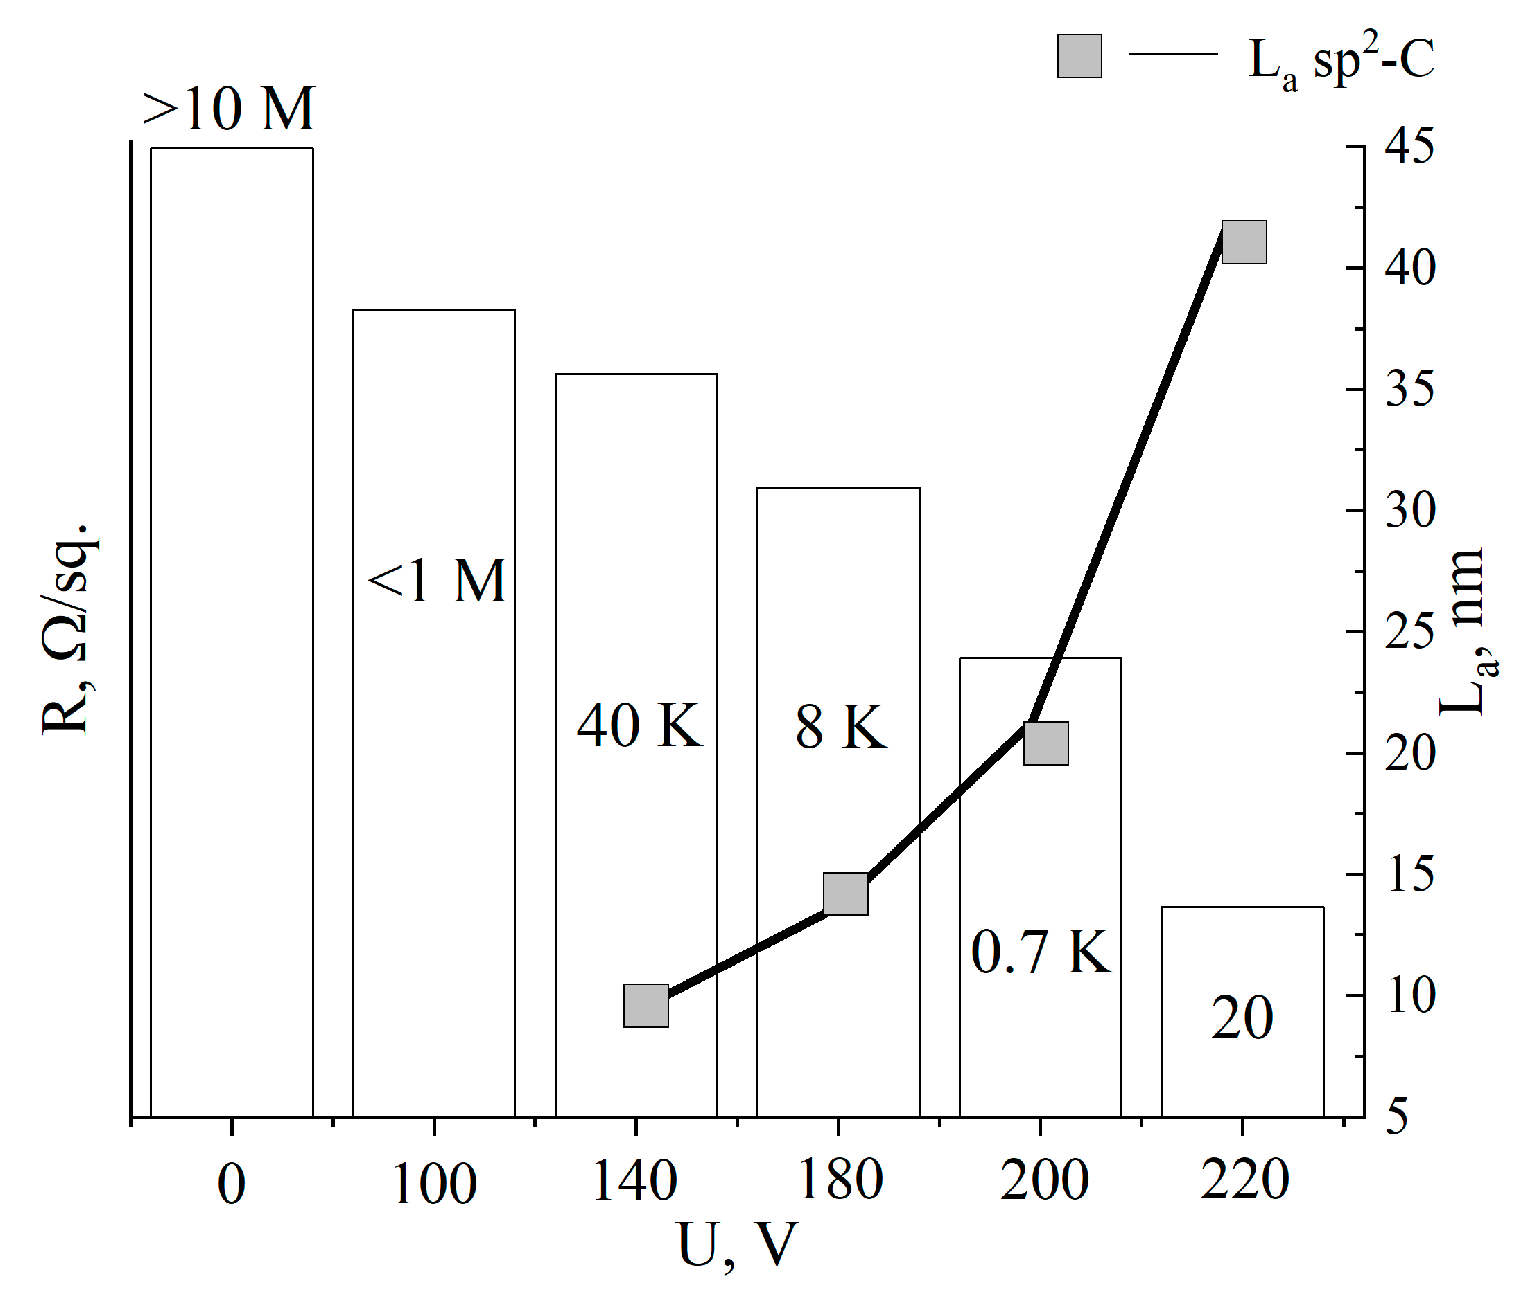
| Voltage, V | Resistance, R/sq | ID/IG | La, nm |
|---|---|---|---|
| Initial MOG | >10 MΩ | >3 | – |
| 100 | <1 MΩ | >3 | – |
| 140 | 40 kΩ | <2 | 9.6 |
| 180 | 8 kΩ | 1.4 | 13.7 |
| 200 | 0.7 kΩ | 0.9 | 21.3 |
| 220 | 20 Ω | 0.45 | 42.6 |
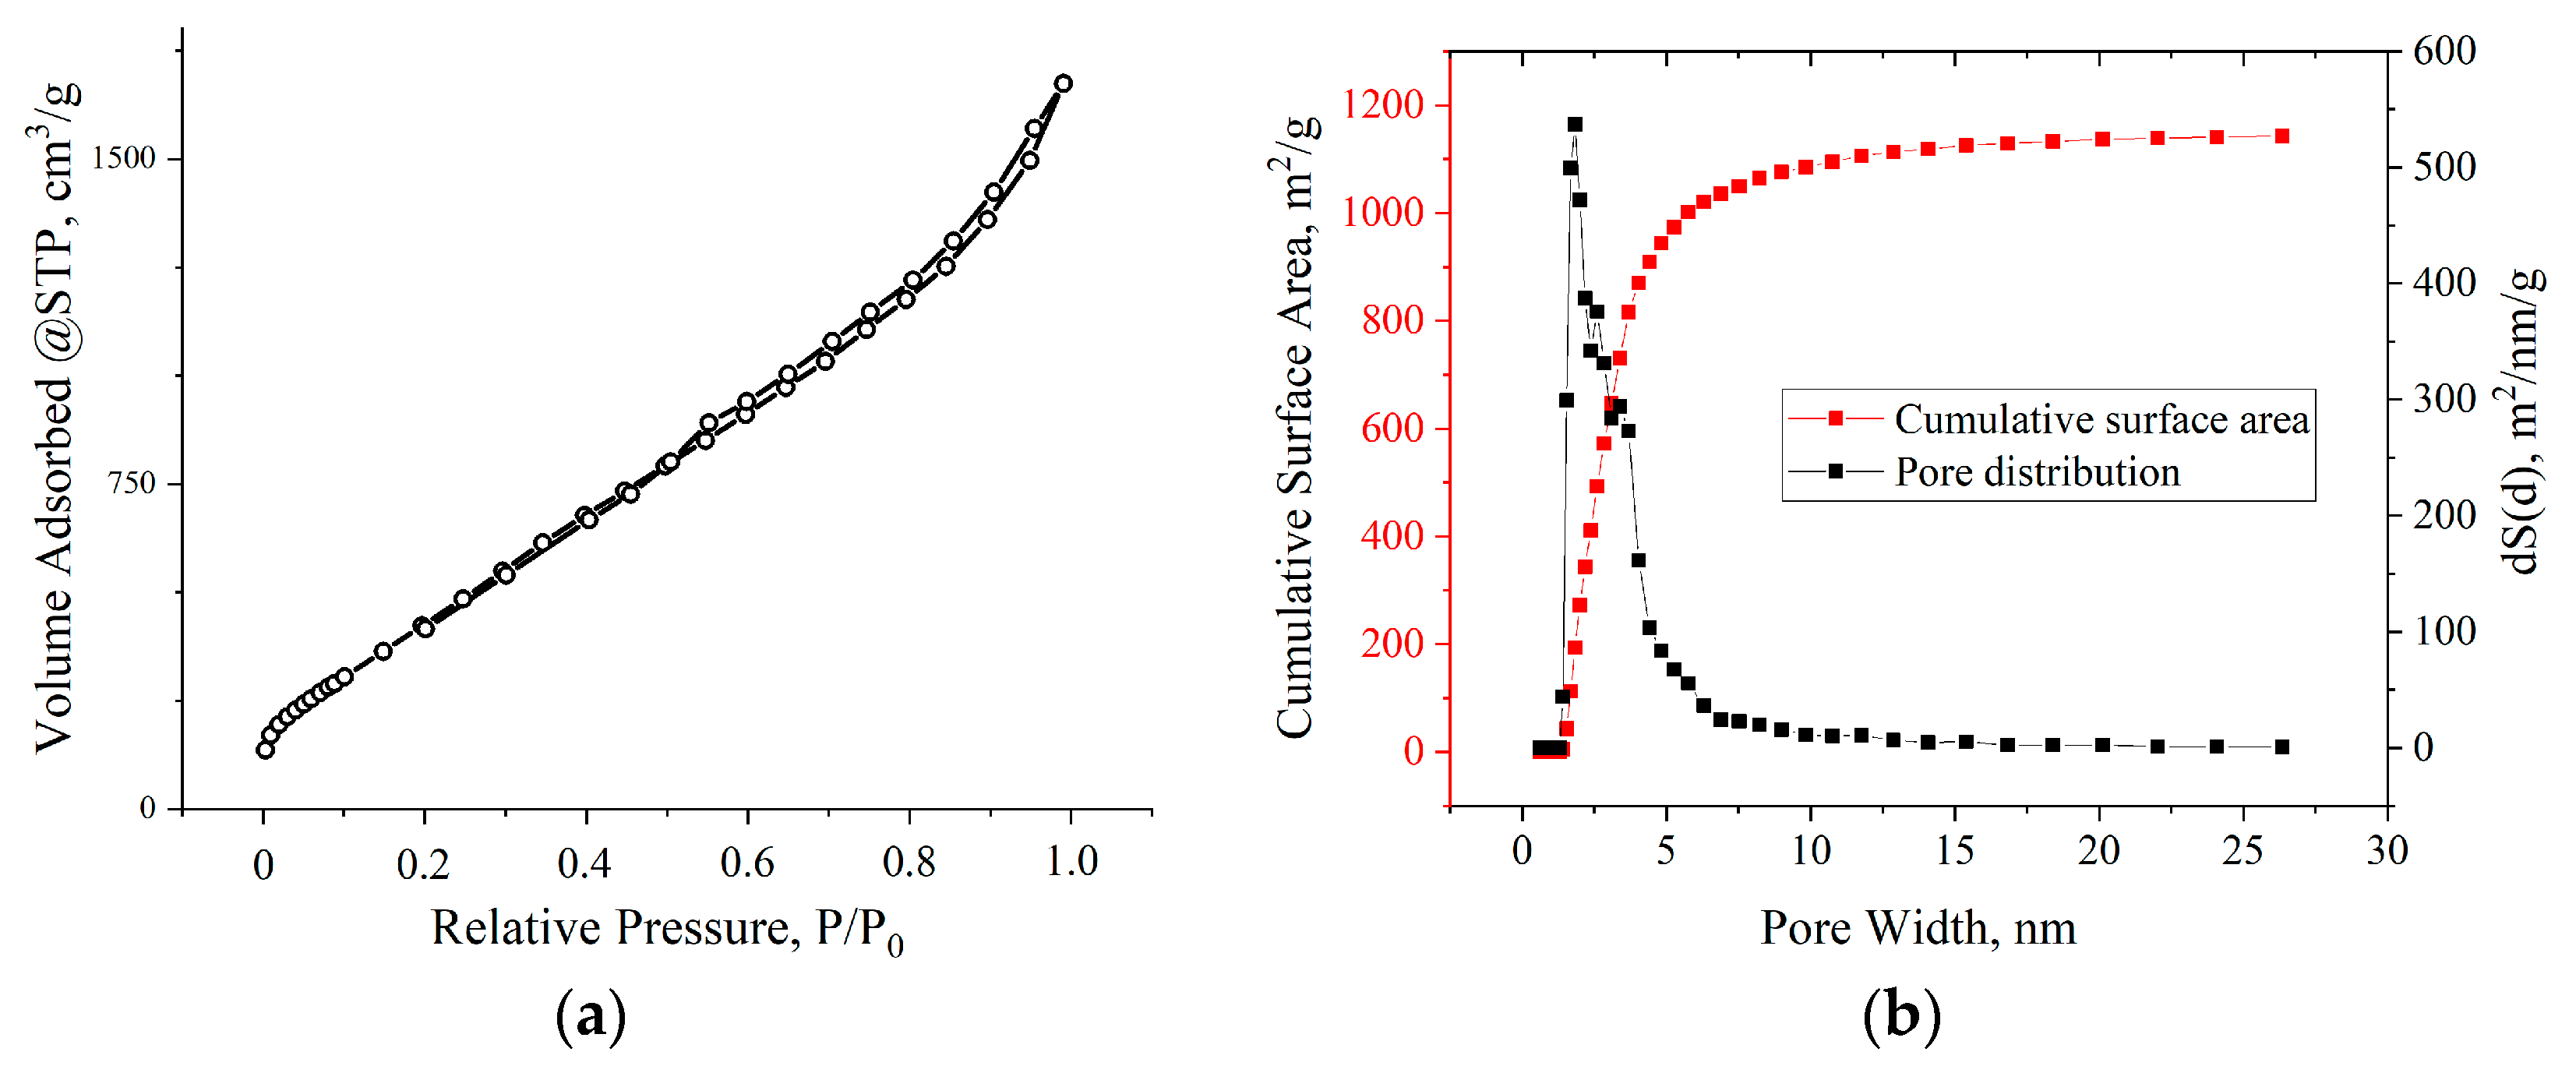
| Voltage, V | SBET, m2/g |
|---|---|
| Initial MOG | 181.5 |
| 100 | 278.2 |
| 140 | 313.3 |
| 180 | 414.6 |
| 200 | 1984.5 |
| 220 | 260.5 |
Disclaimer/Publisher’s Note: The statements, opinions and data contained in all publications are solely those of the individual author(s) and contributor(s) and not of MDPI and/or the editor(s). MDPI and/or the editor(s) disclaim responsibility for any injury to people or property resulting from any ideas, methods, instructions or products referred to in the content. |
© 2024 by the authors. Licensee MDPI, Basel, Switzerland. This article is an open access article distributed under the terms and conditions of the Creative Commons Attribution (CC BY) license (https://creativecommons.org/licenses/by/4.0/).
Share and Cite
Evseev, Z.I.; Prokopiev, A.R.; Dmitriev, P.S.; Loskin, N.N.; Popov, D.N. Fast Joule Heating for the Scalable and Green Production of Graphene with a High Surface Area. Materials 2024, 17, 576. https://doi.org/10.3390/ma17030576
Evseev ZI, Prokopiev AR, Dmitriev PS, Loskin NN, Popov DN. Fast Joule Heating for the Scalable and Green Production of Graphene with a High Surface Area. Materials. 2024; 17(3):576. https://doi.org/10.3390/ma17030576
Chicago/Turabian StyleEvseev, Zakhar Ivanovich, Aisen Ruslanovich Prokopiev, Petr Stanislavovich Dmitriev, Nikolay Nikolaevich Loskin, and Dmitrii Nikolaevich Popov. 2024. "Fast Joule Heating for the Scalable and Green Production of Graphene with a High Surface Area" Materials 17, no. 3: 576. https://doi.org/10.3390/ma17030576
APA StyleEvseev, Z. I., Prokopiev, A. R., Dmitriev, P. S., Loskin, N. N., & Popov, D. N. (2024). Fast Joule Heating for the Scalable and Green Production of Graphene with a High Surface Area. Materials, 17(3), 576. https://doi.org/10.3390/ma17030576