
Nondestructive Monitoring of Textile-Reinforced Cementitious Composites Subjected to Freeze–Thaw Cycles

 ,
,  , and
, and 
Highlights
- Deterioration caused by freeze–thaw was detected with UPV and MMW spectrometry;
- In saturated conditions, freeze-thaw deterioration increases de permittivity;
- Freeze–thaw deterioration decreases the UPV;
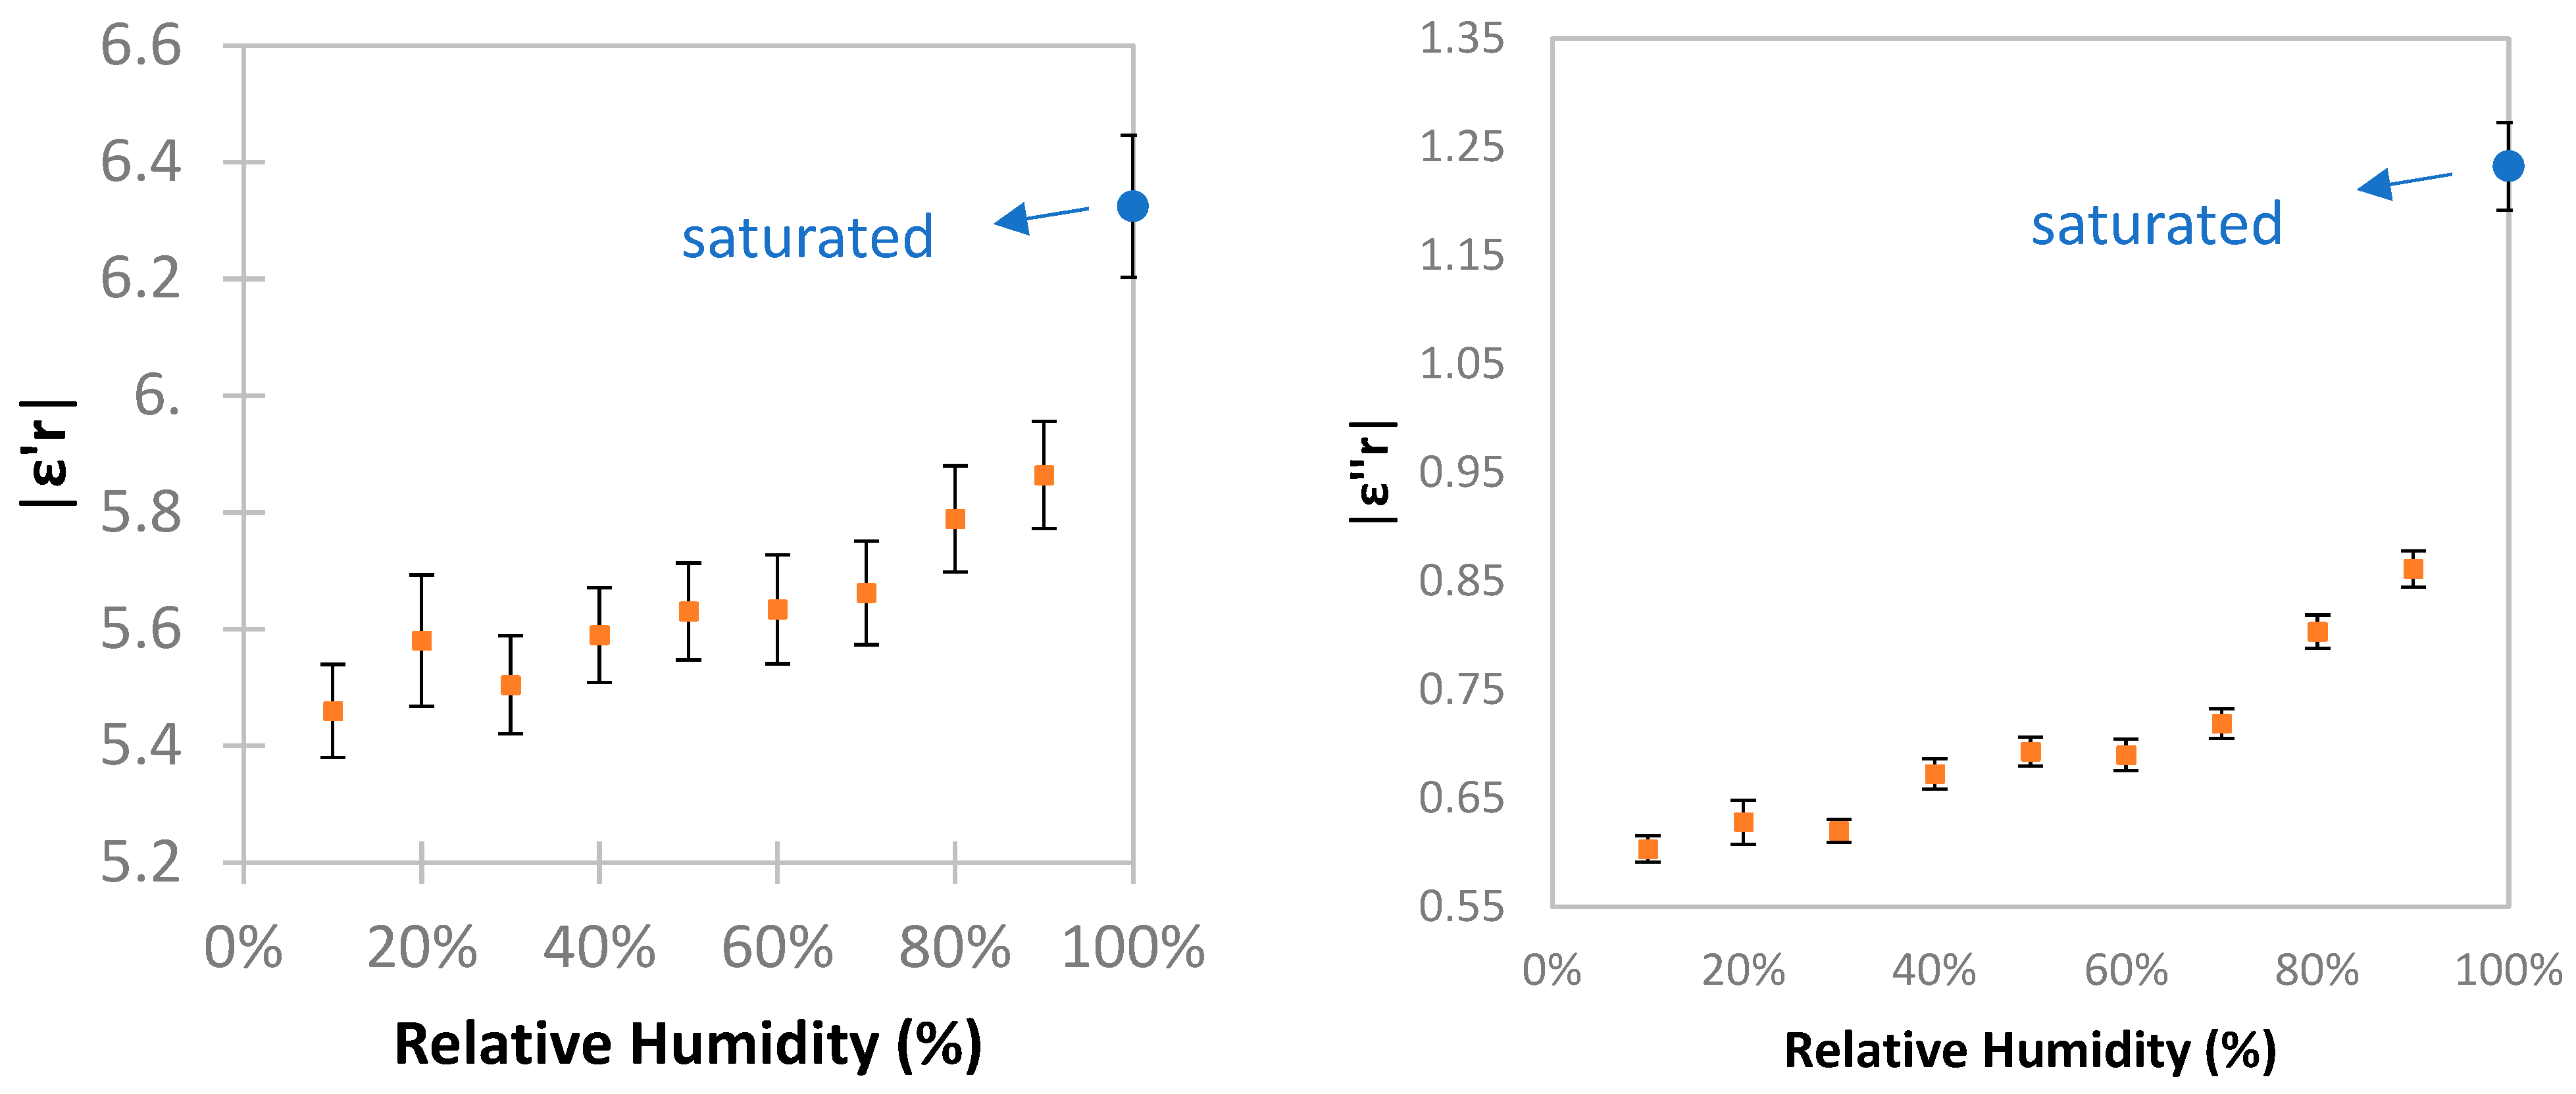
- The relative humidity severely affects the permittivity of TRC specimens.
Abstract
1. Introduction
2. Materials and Methods
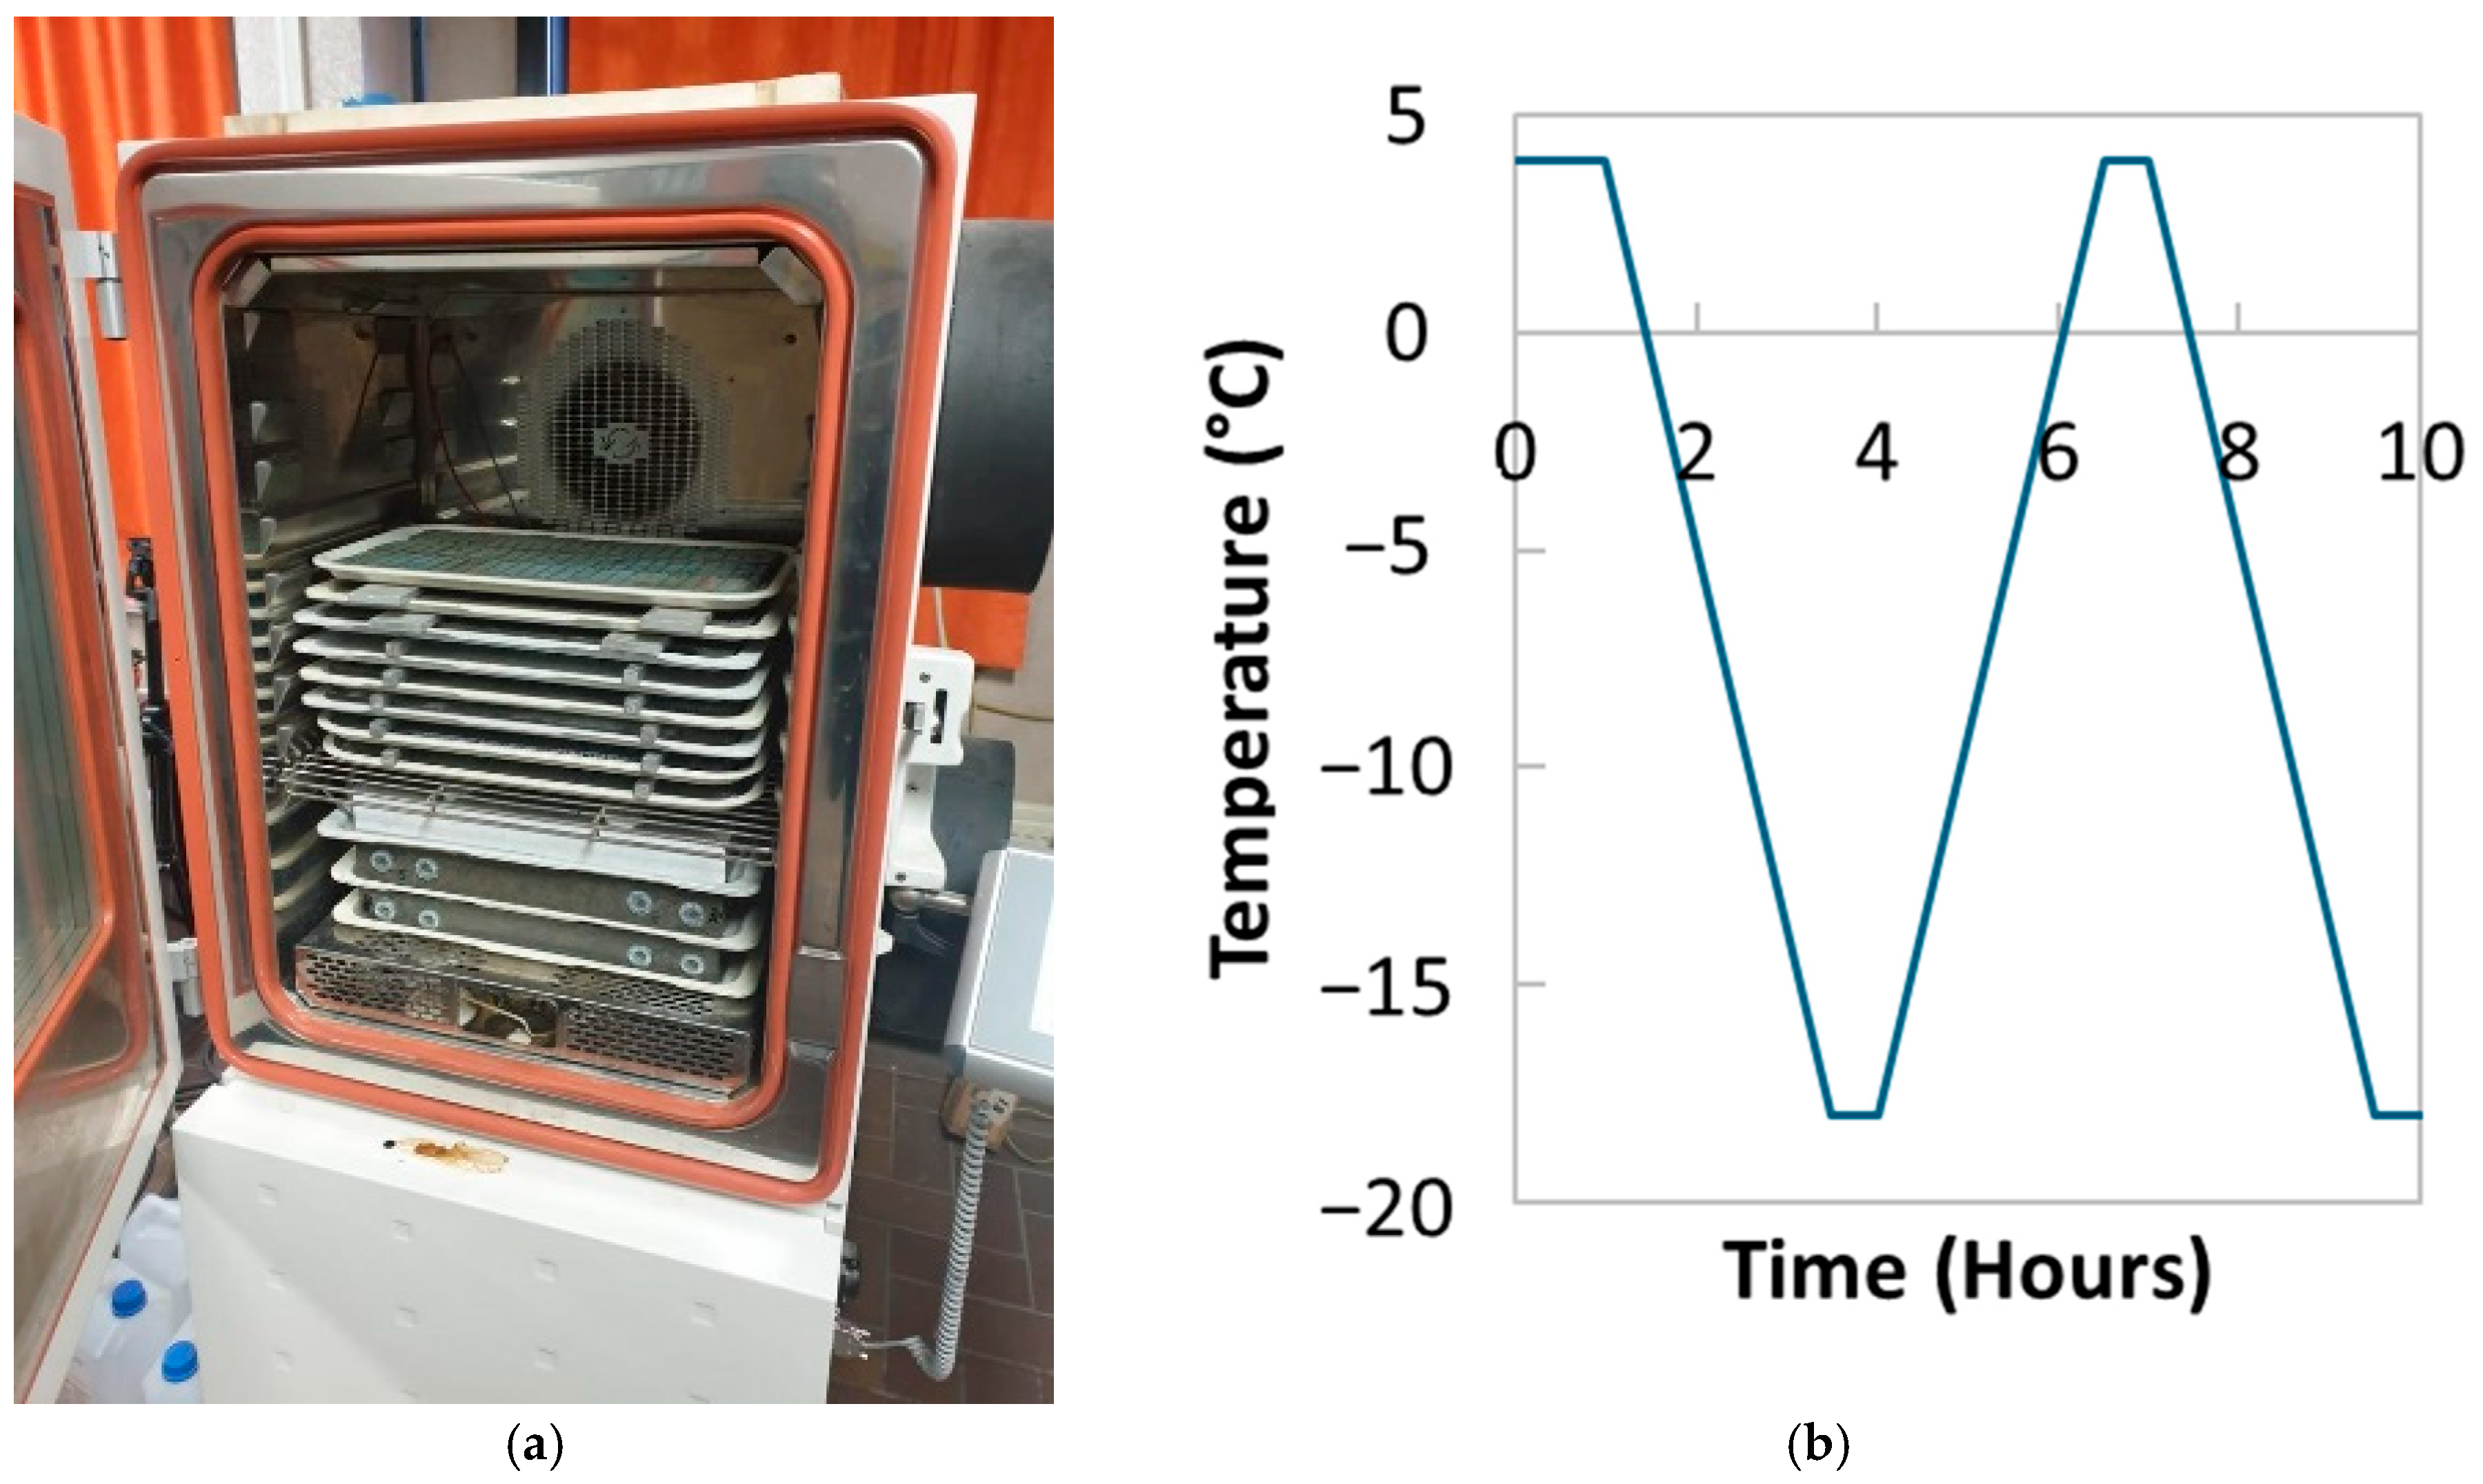
2.1. Freeze–Thaw
2.2. Ultrasonic Pulse Velocity (UPV)
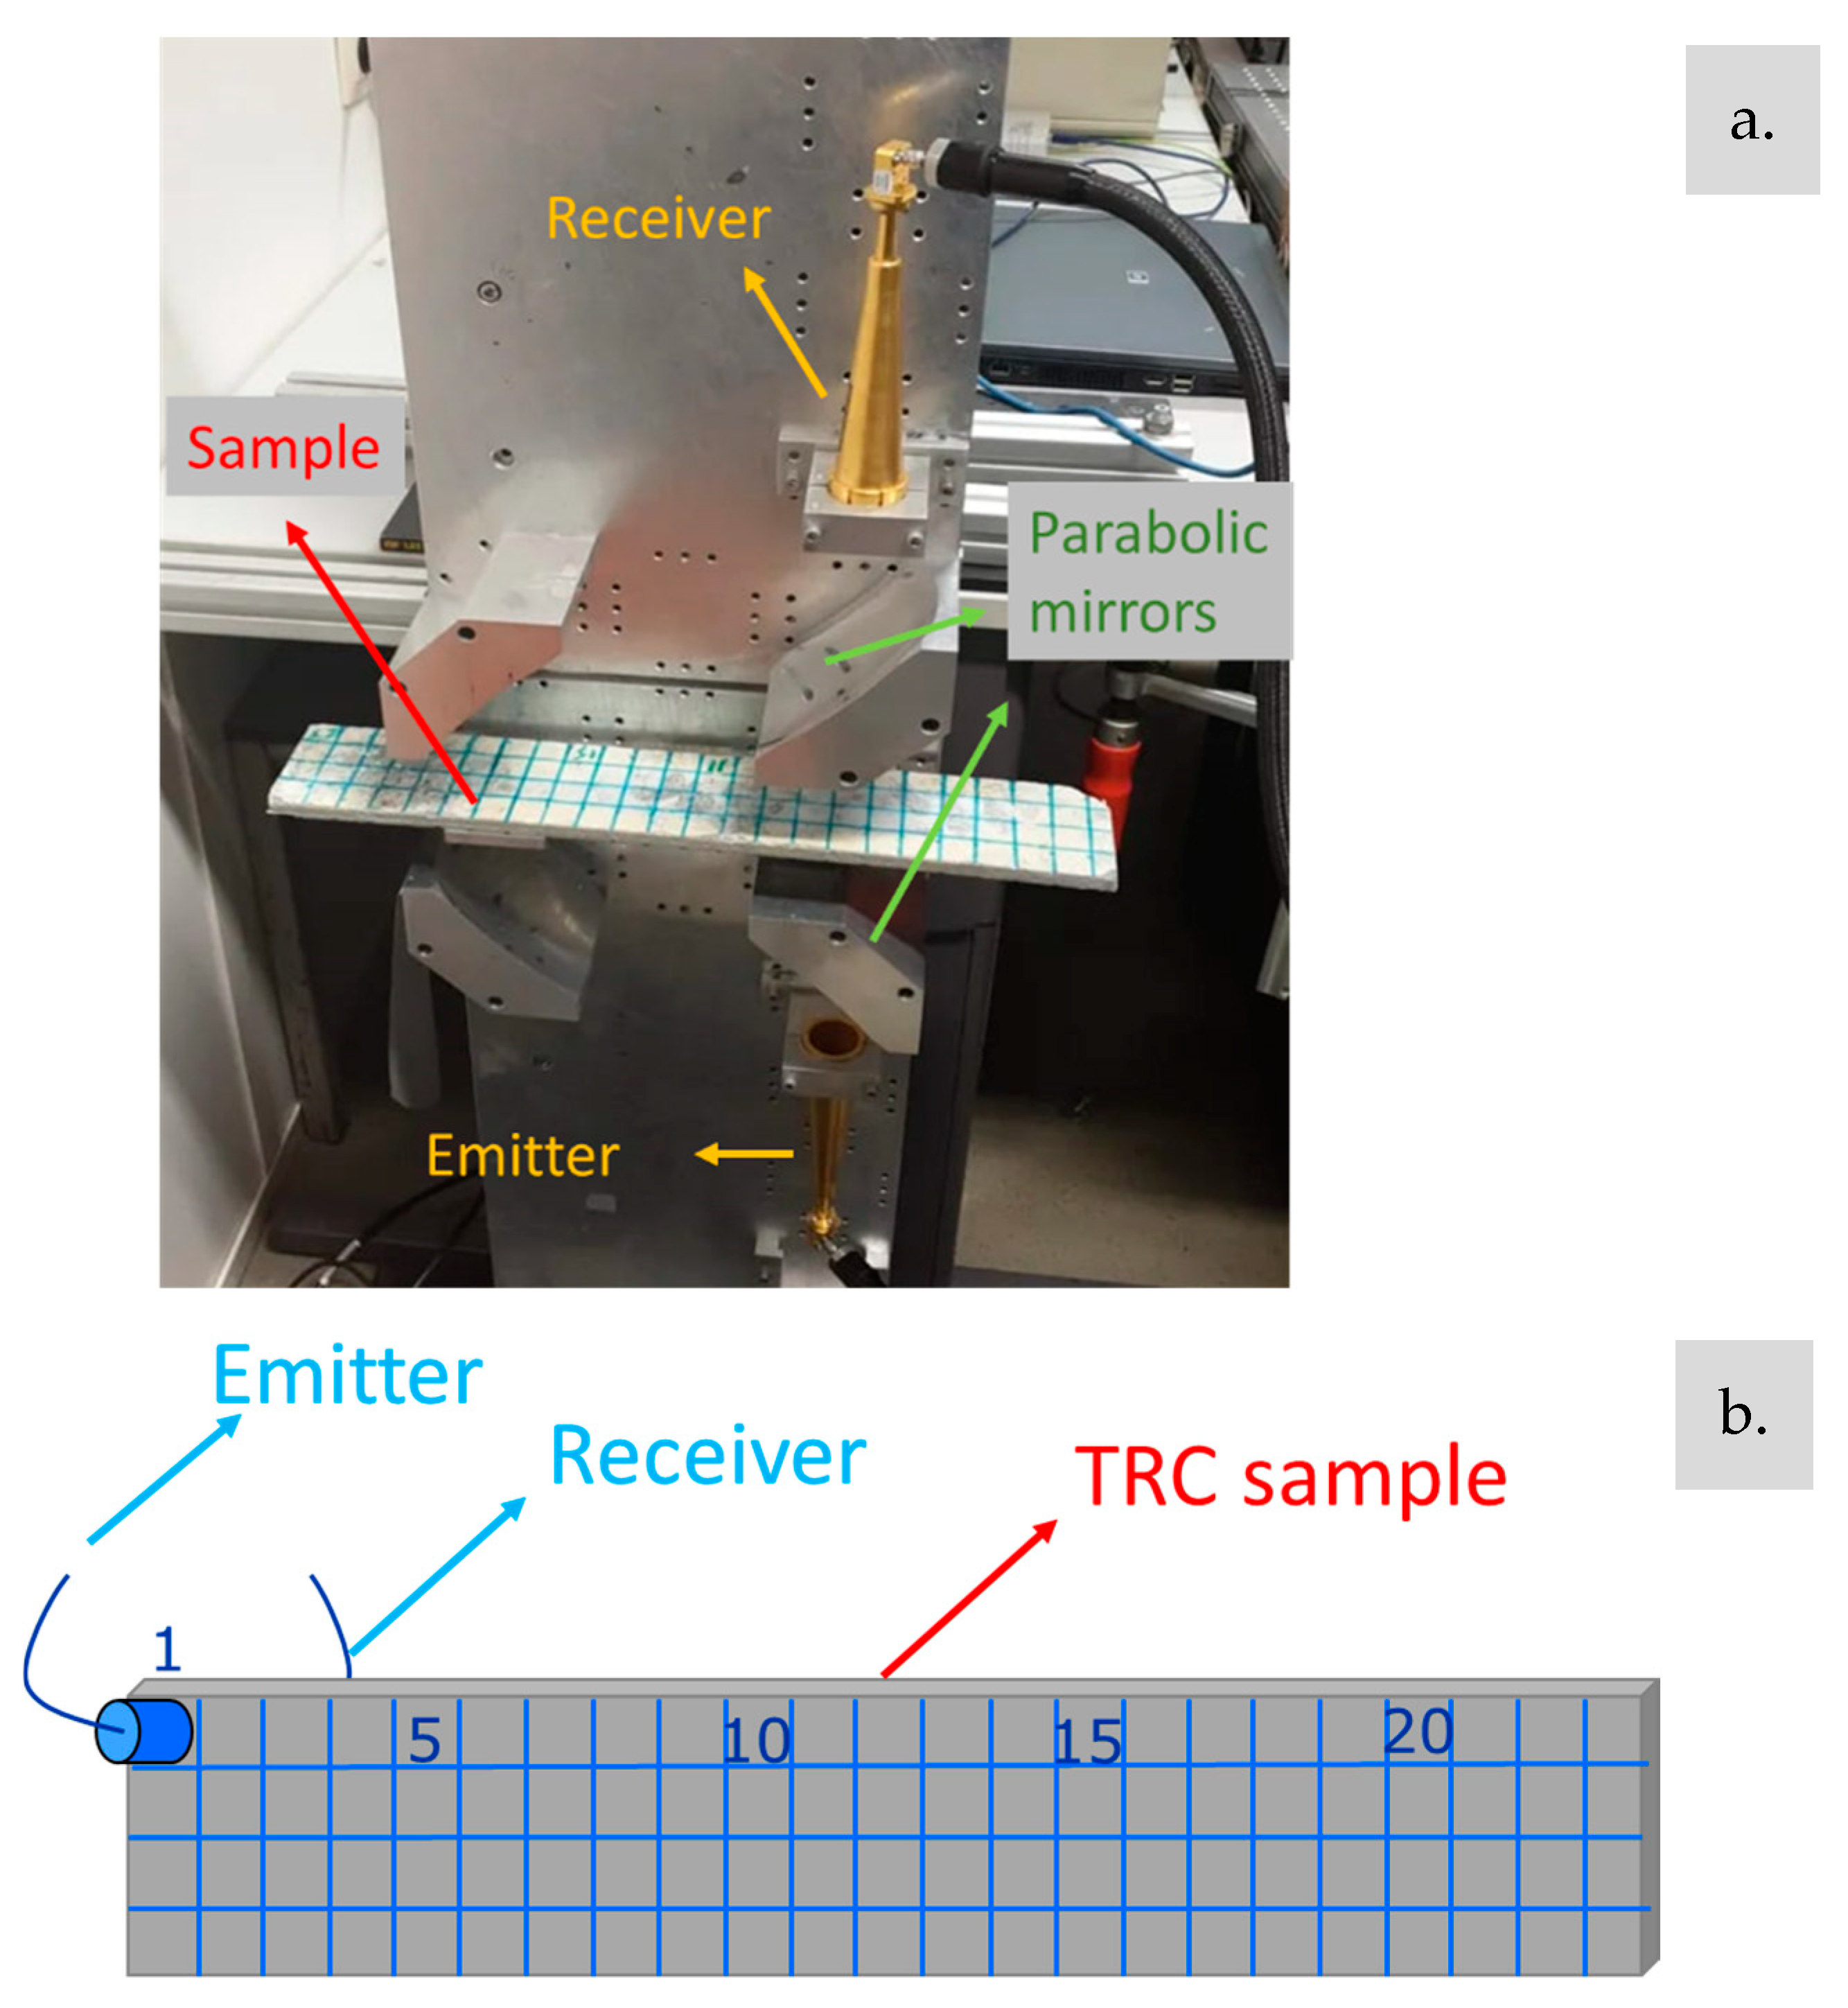
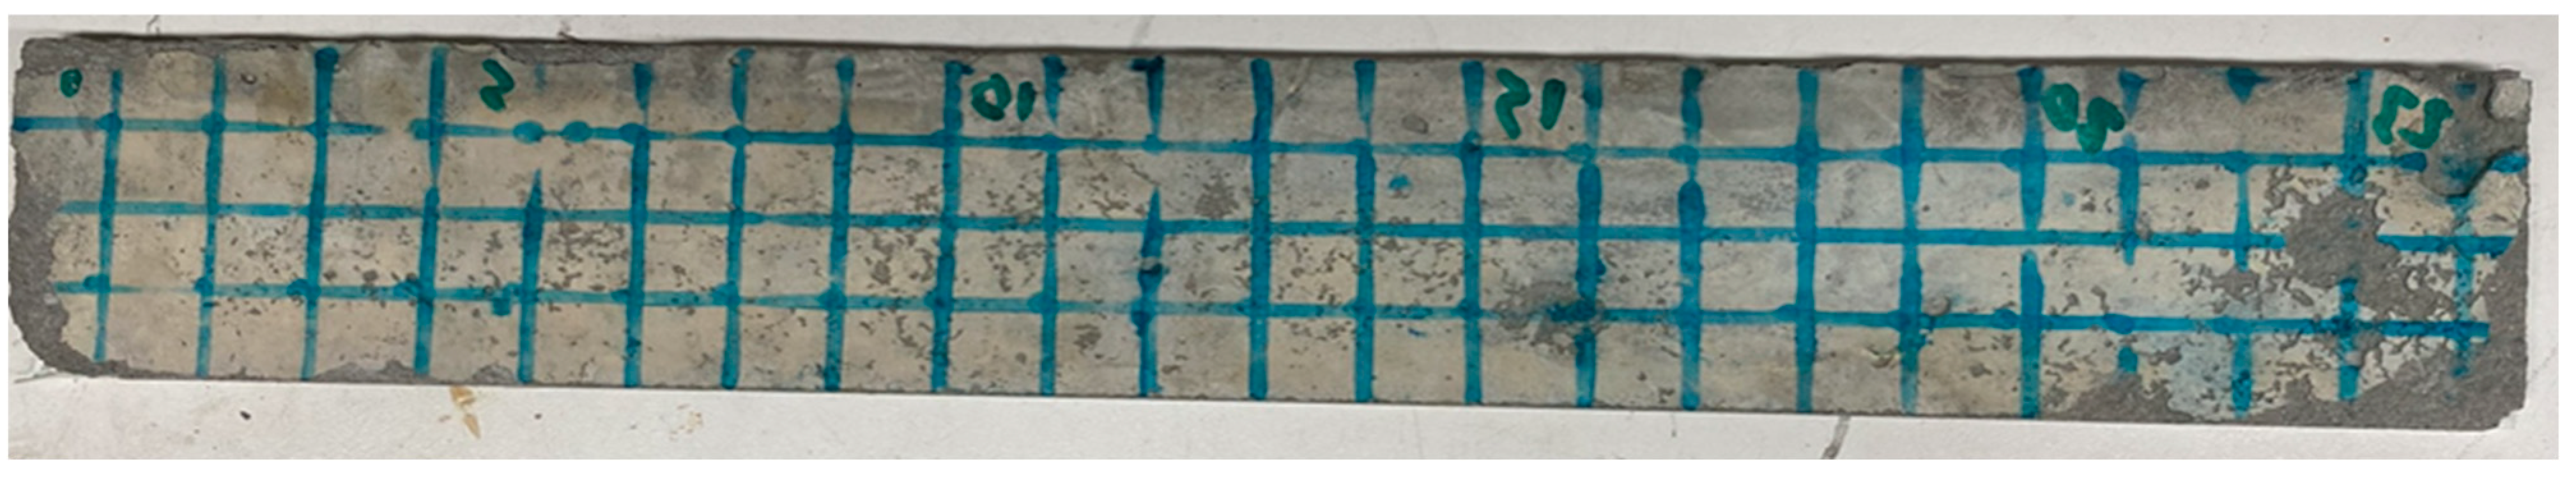
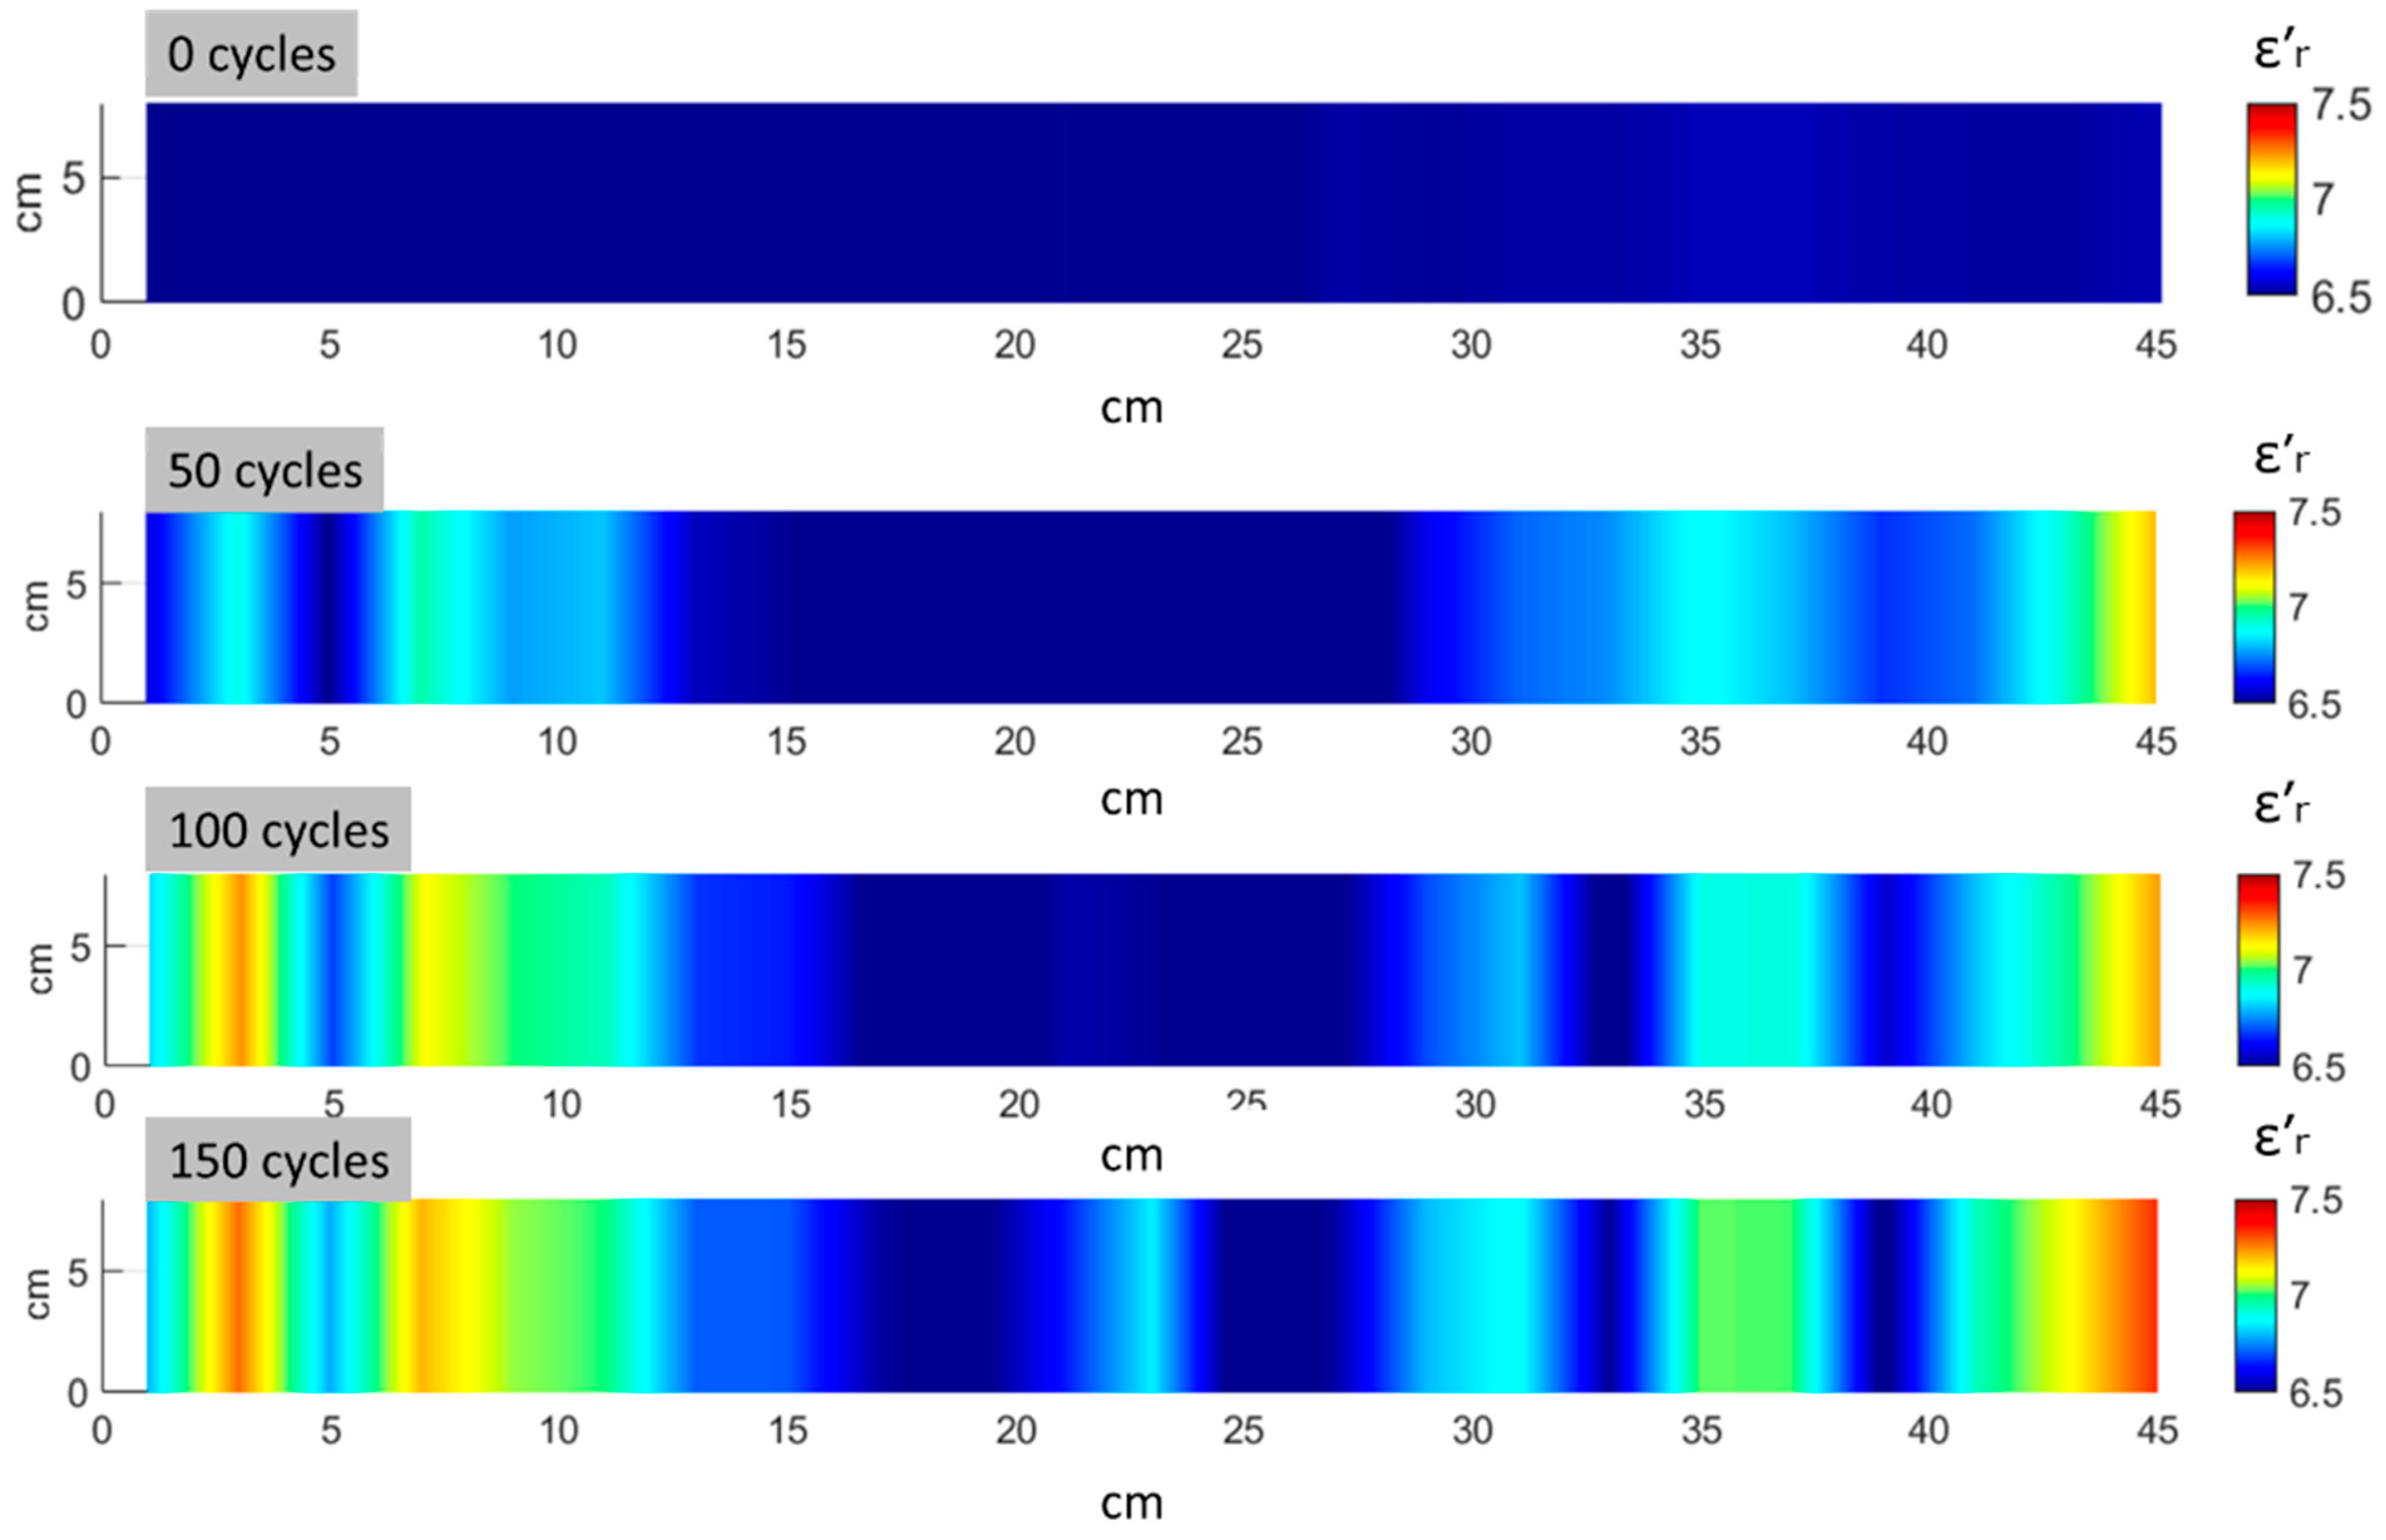
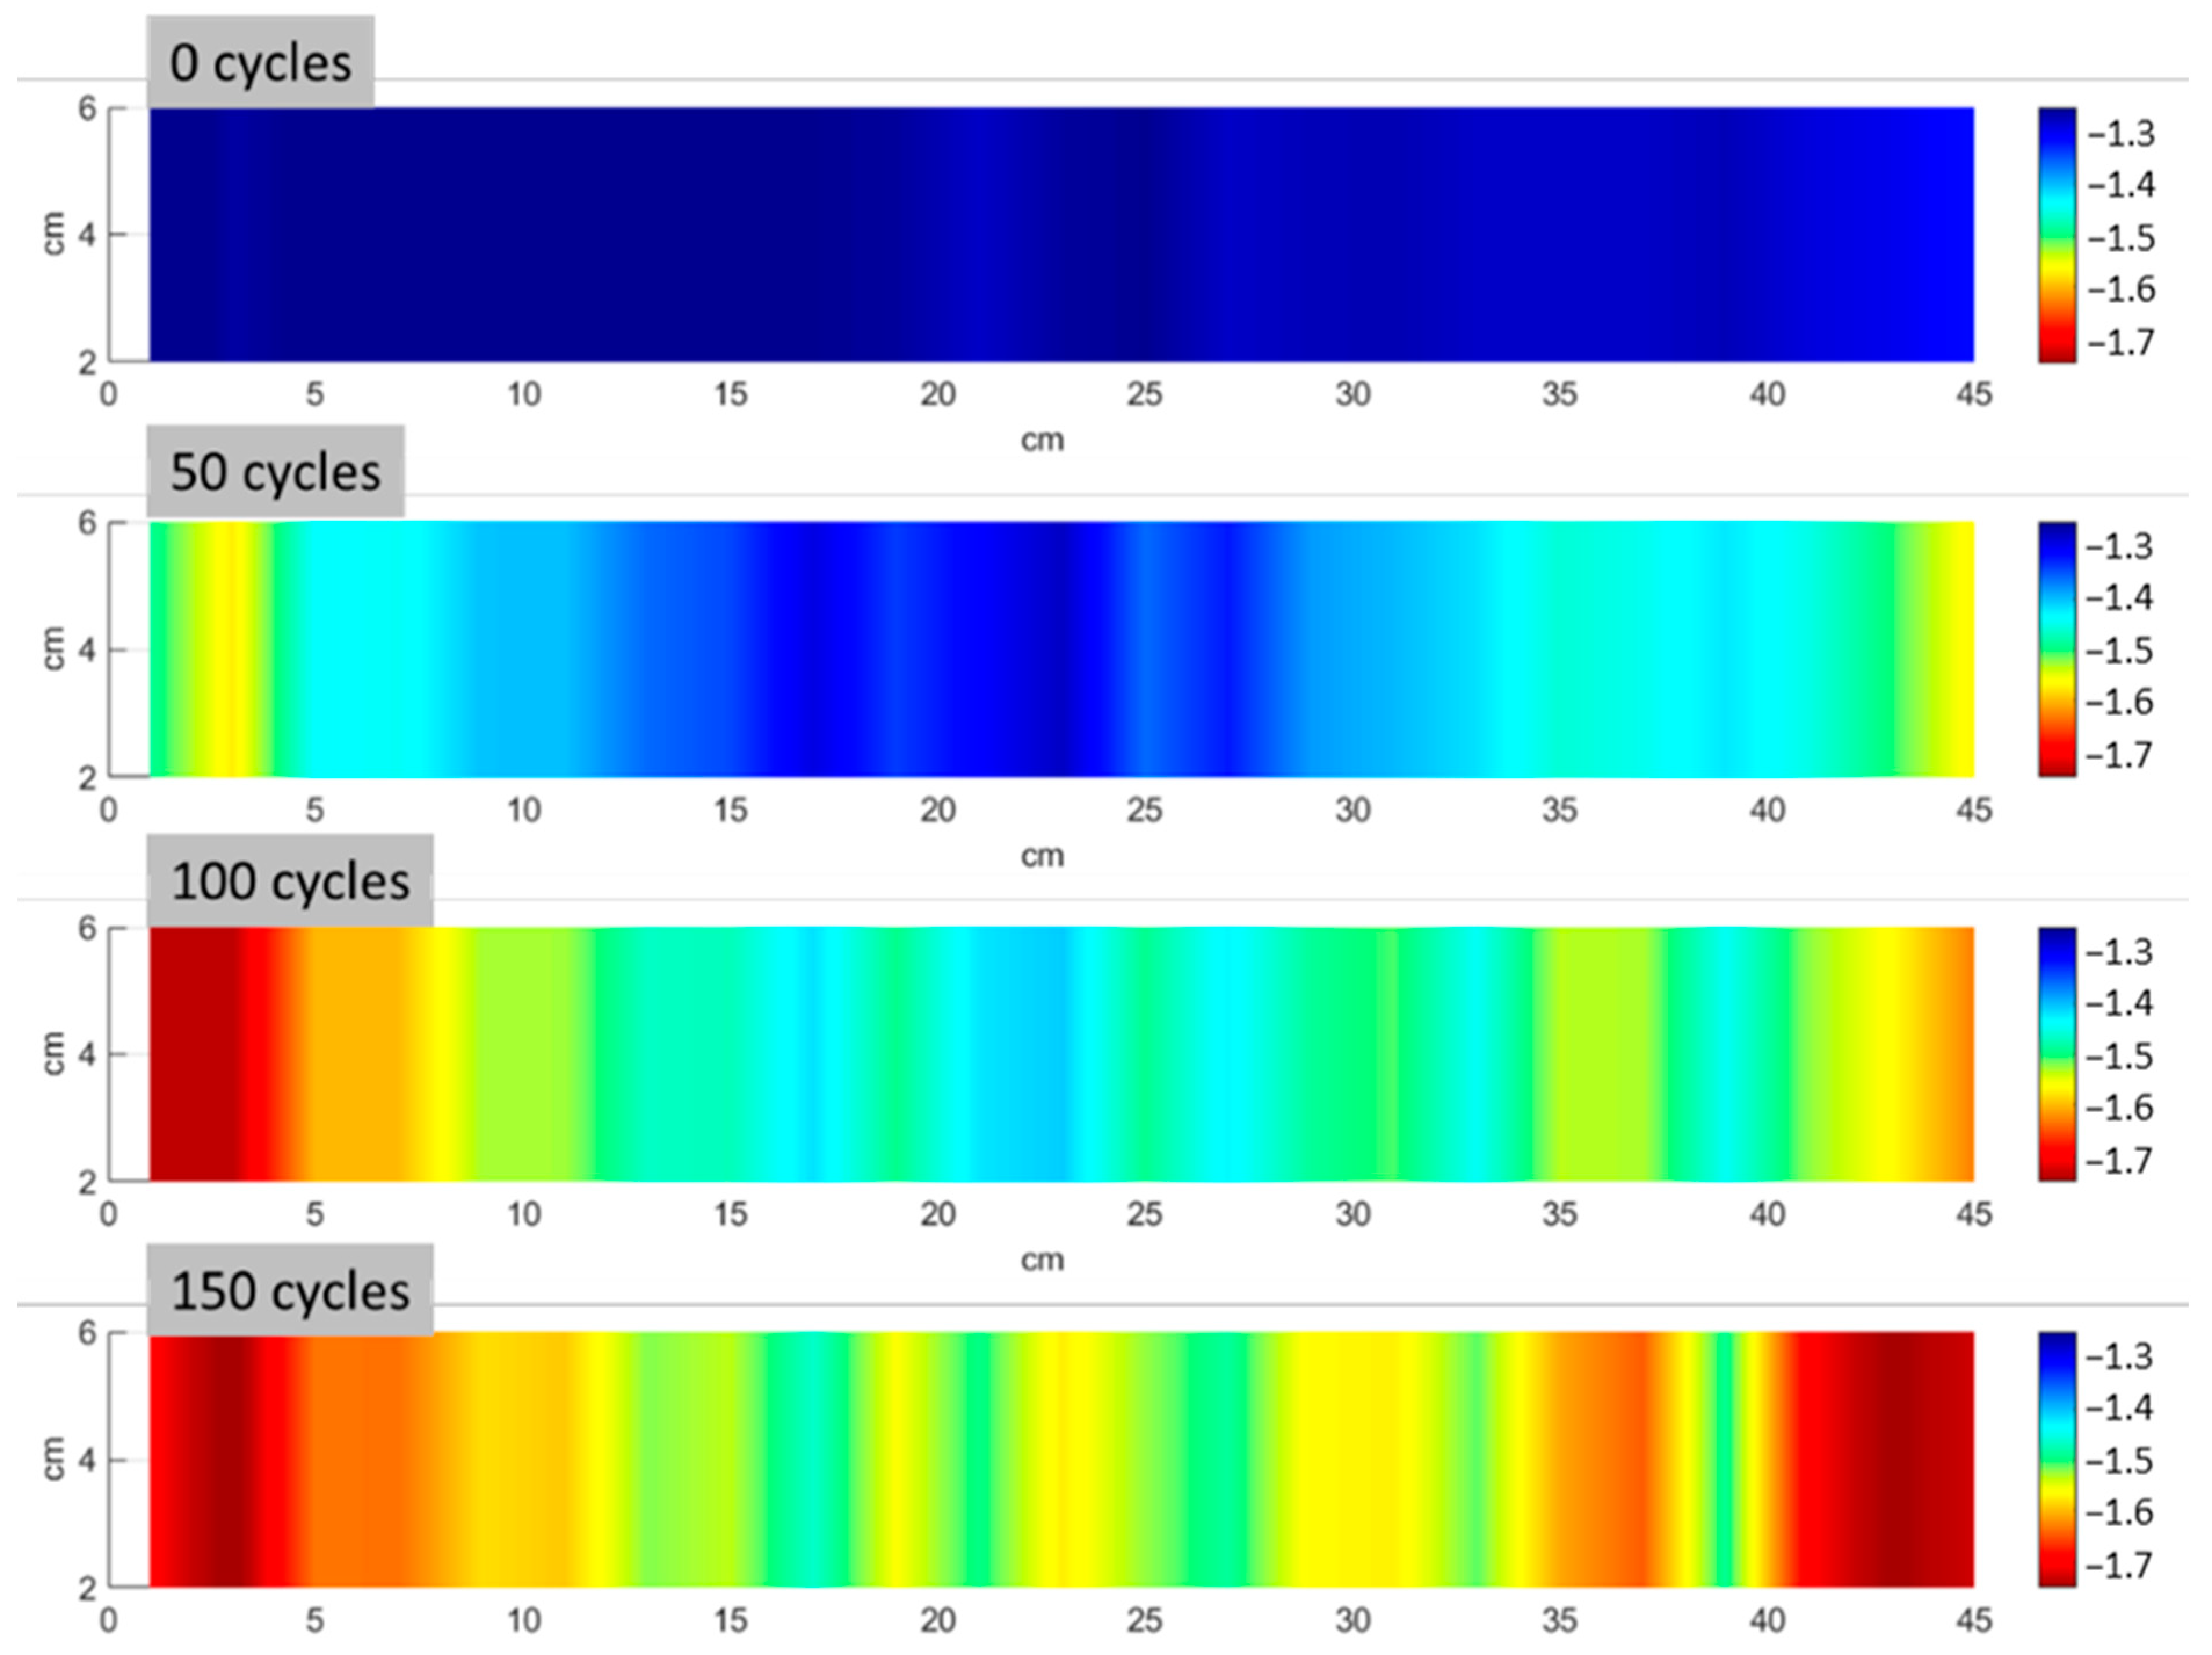
2.3. MMW Spectrometry
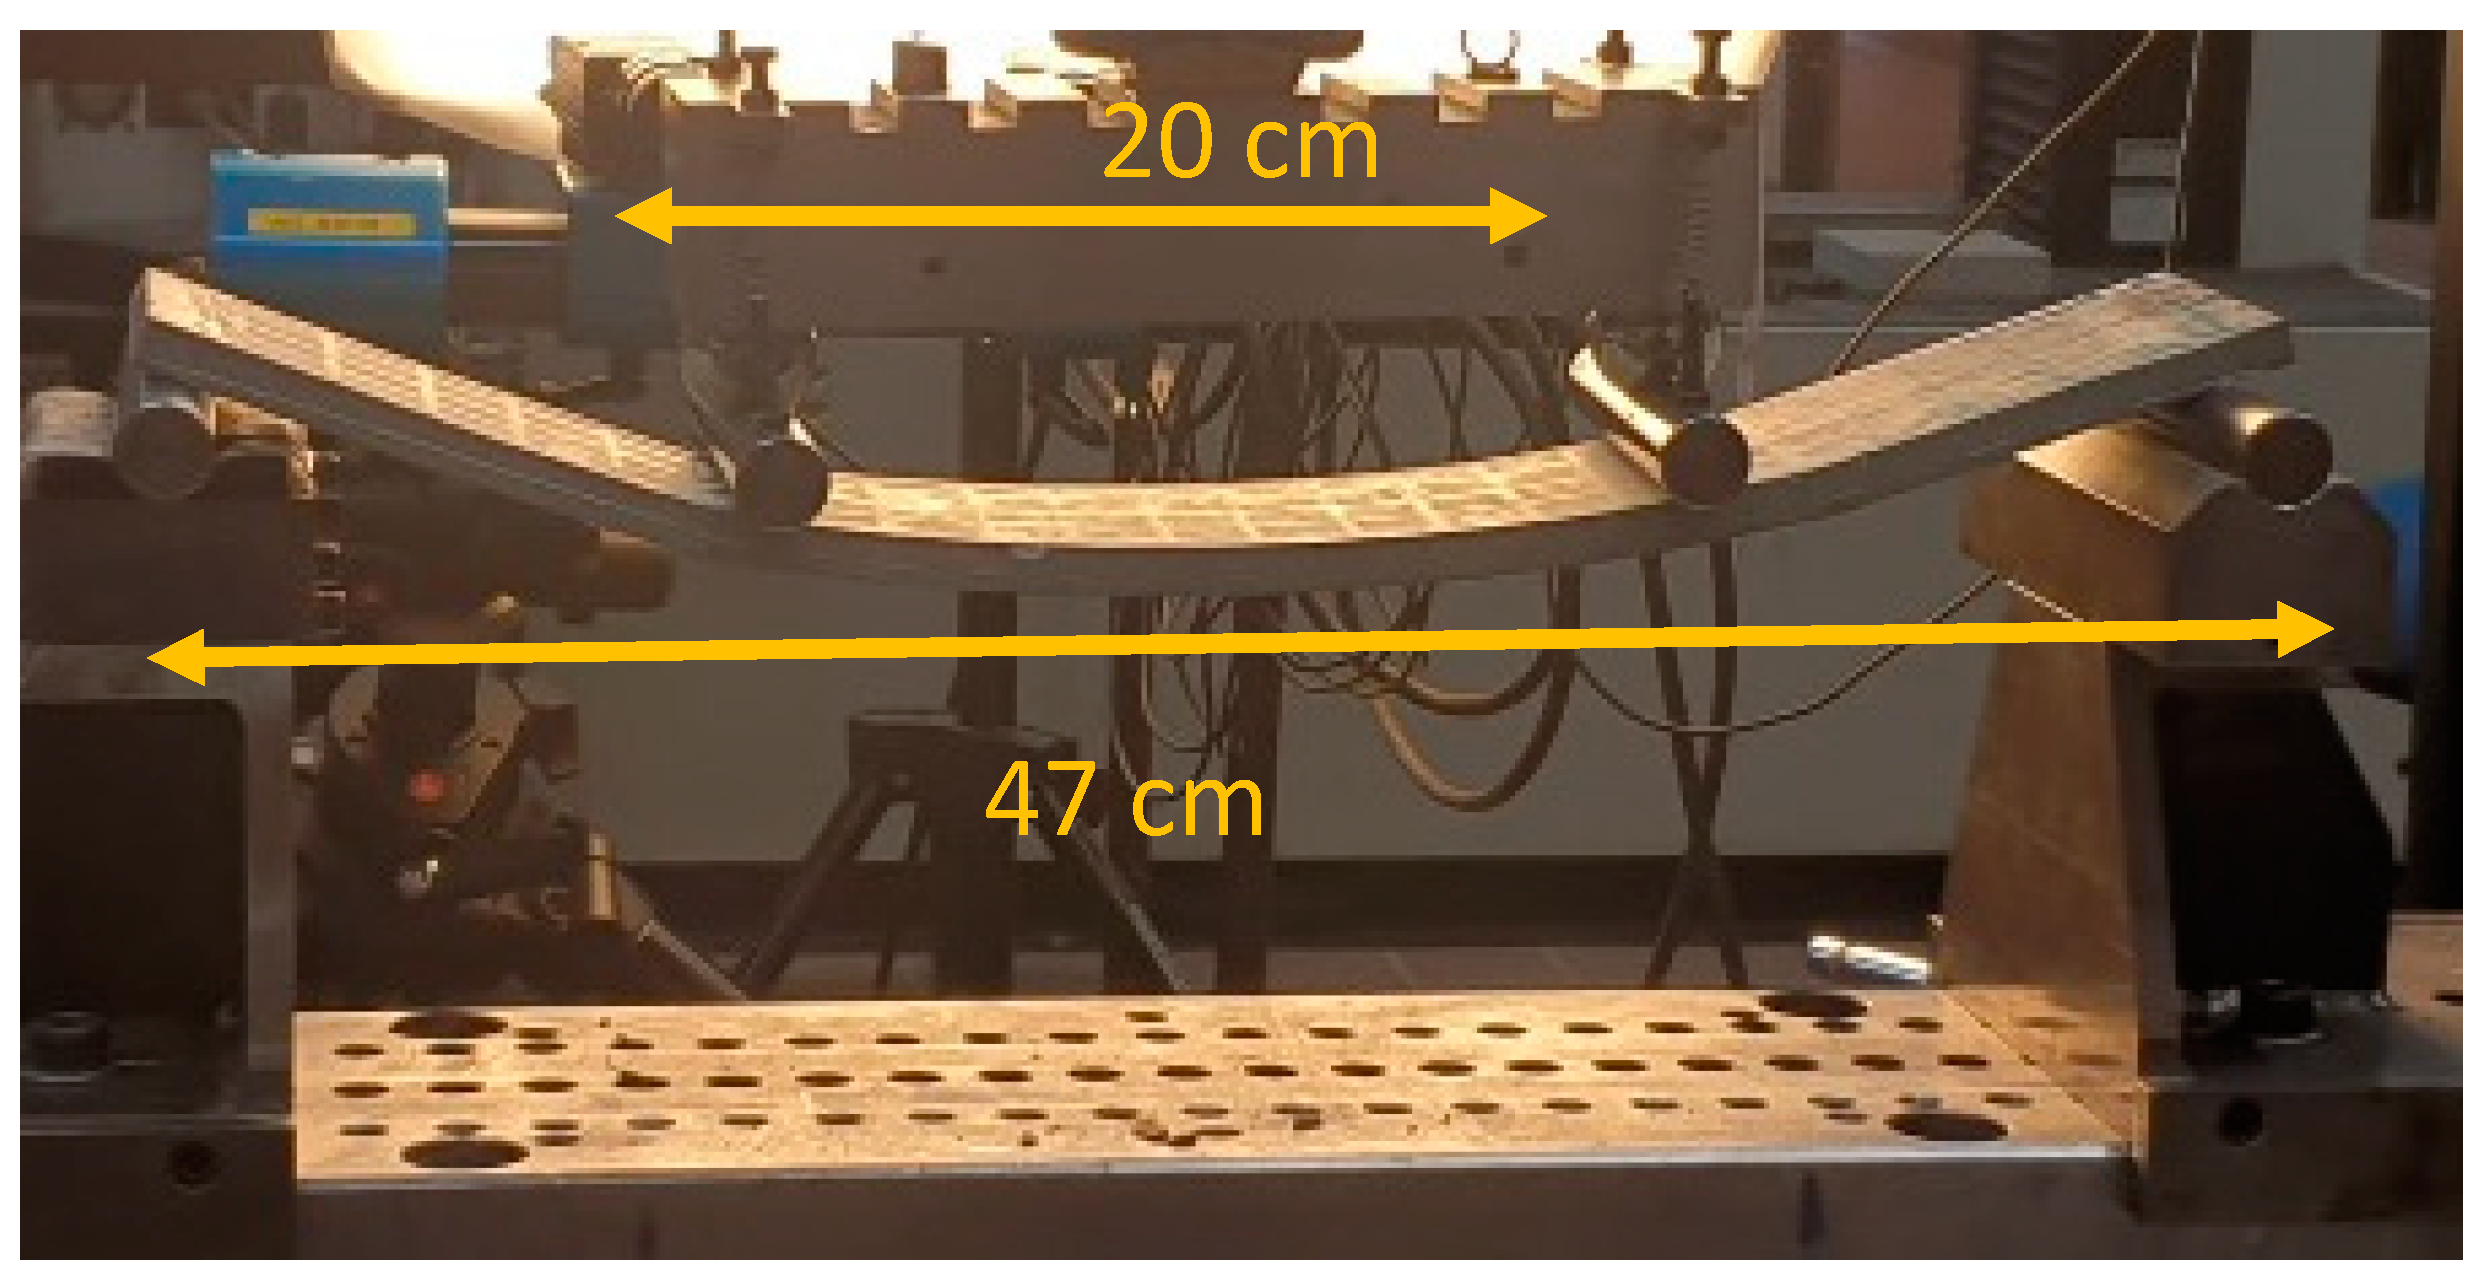
2.4. Four-Point Bending
3. Results and Discussion
3.1. Freeze–Thaw

3.2. Analysis on Effect of Humidity and Permittivity
4. Conclusions
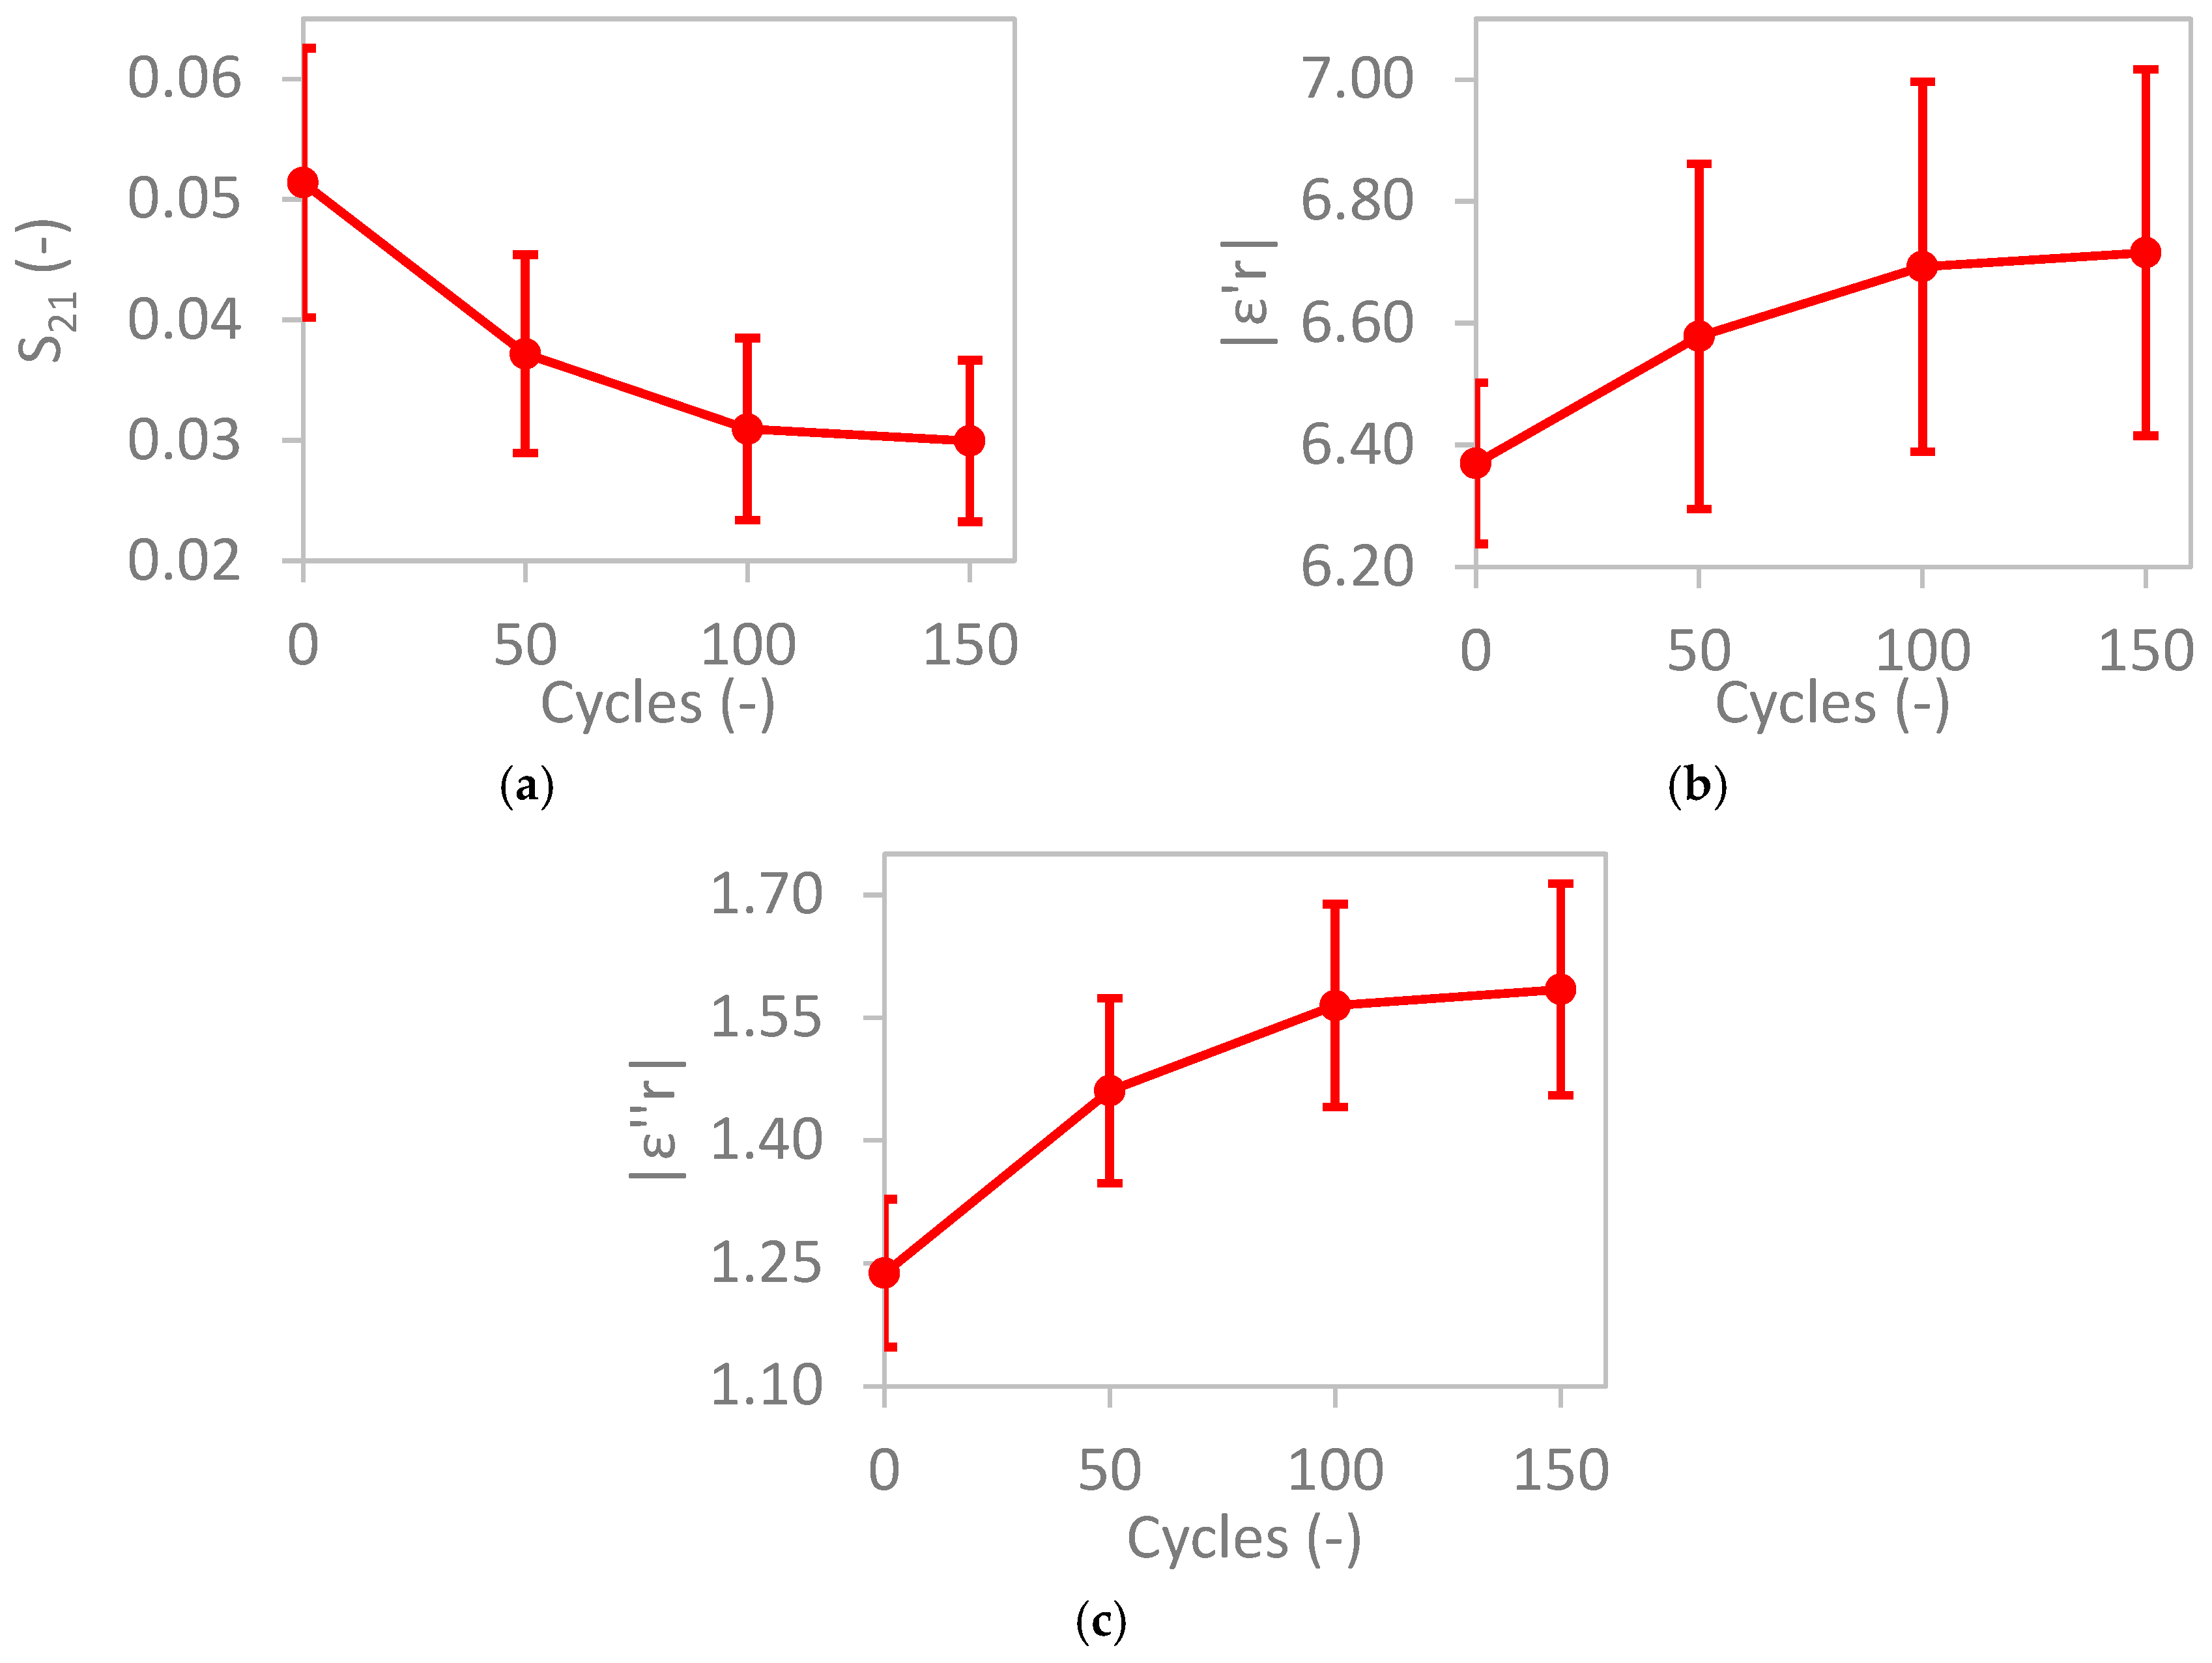
- The complex permittivity proved to be a useful parameter to quantify freeze–thaw degradation. Under saturated conditions, the permittivity increased due to internal cracking and surface degradation.
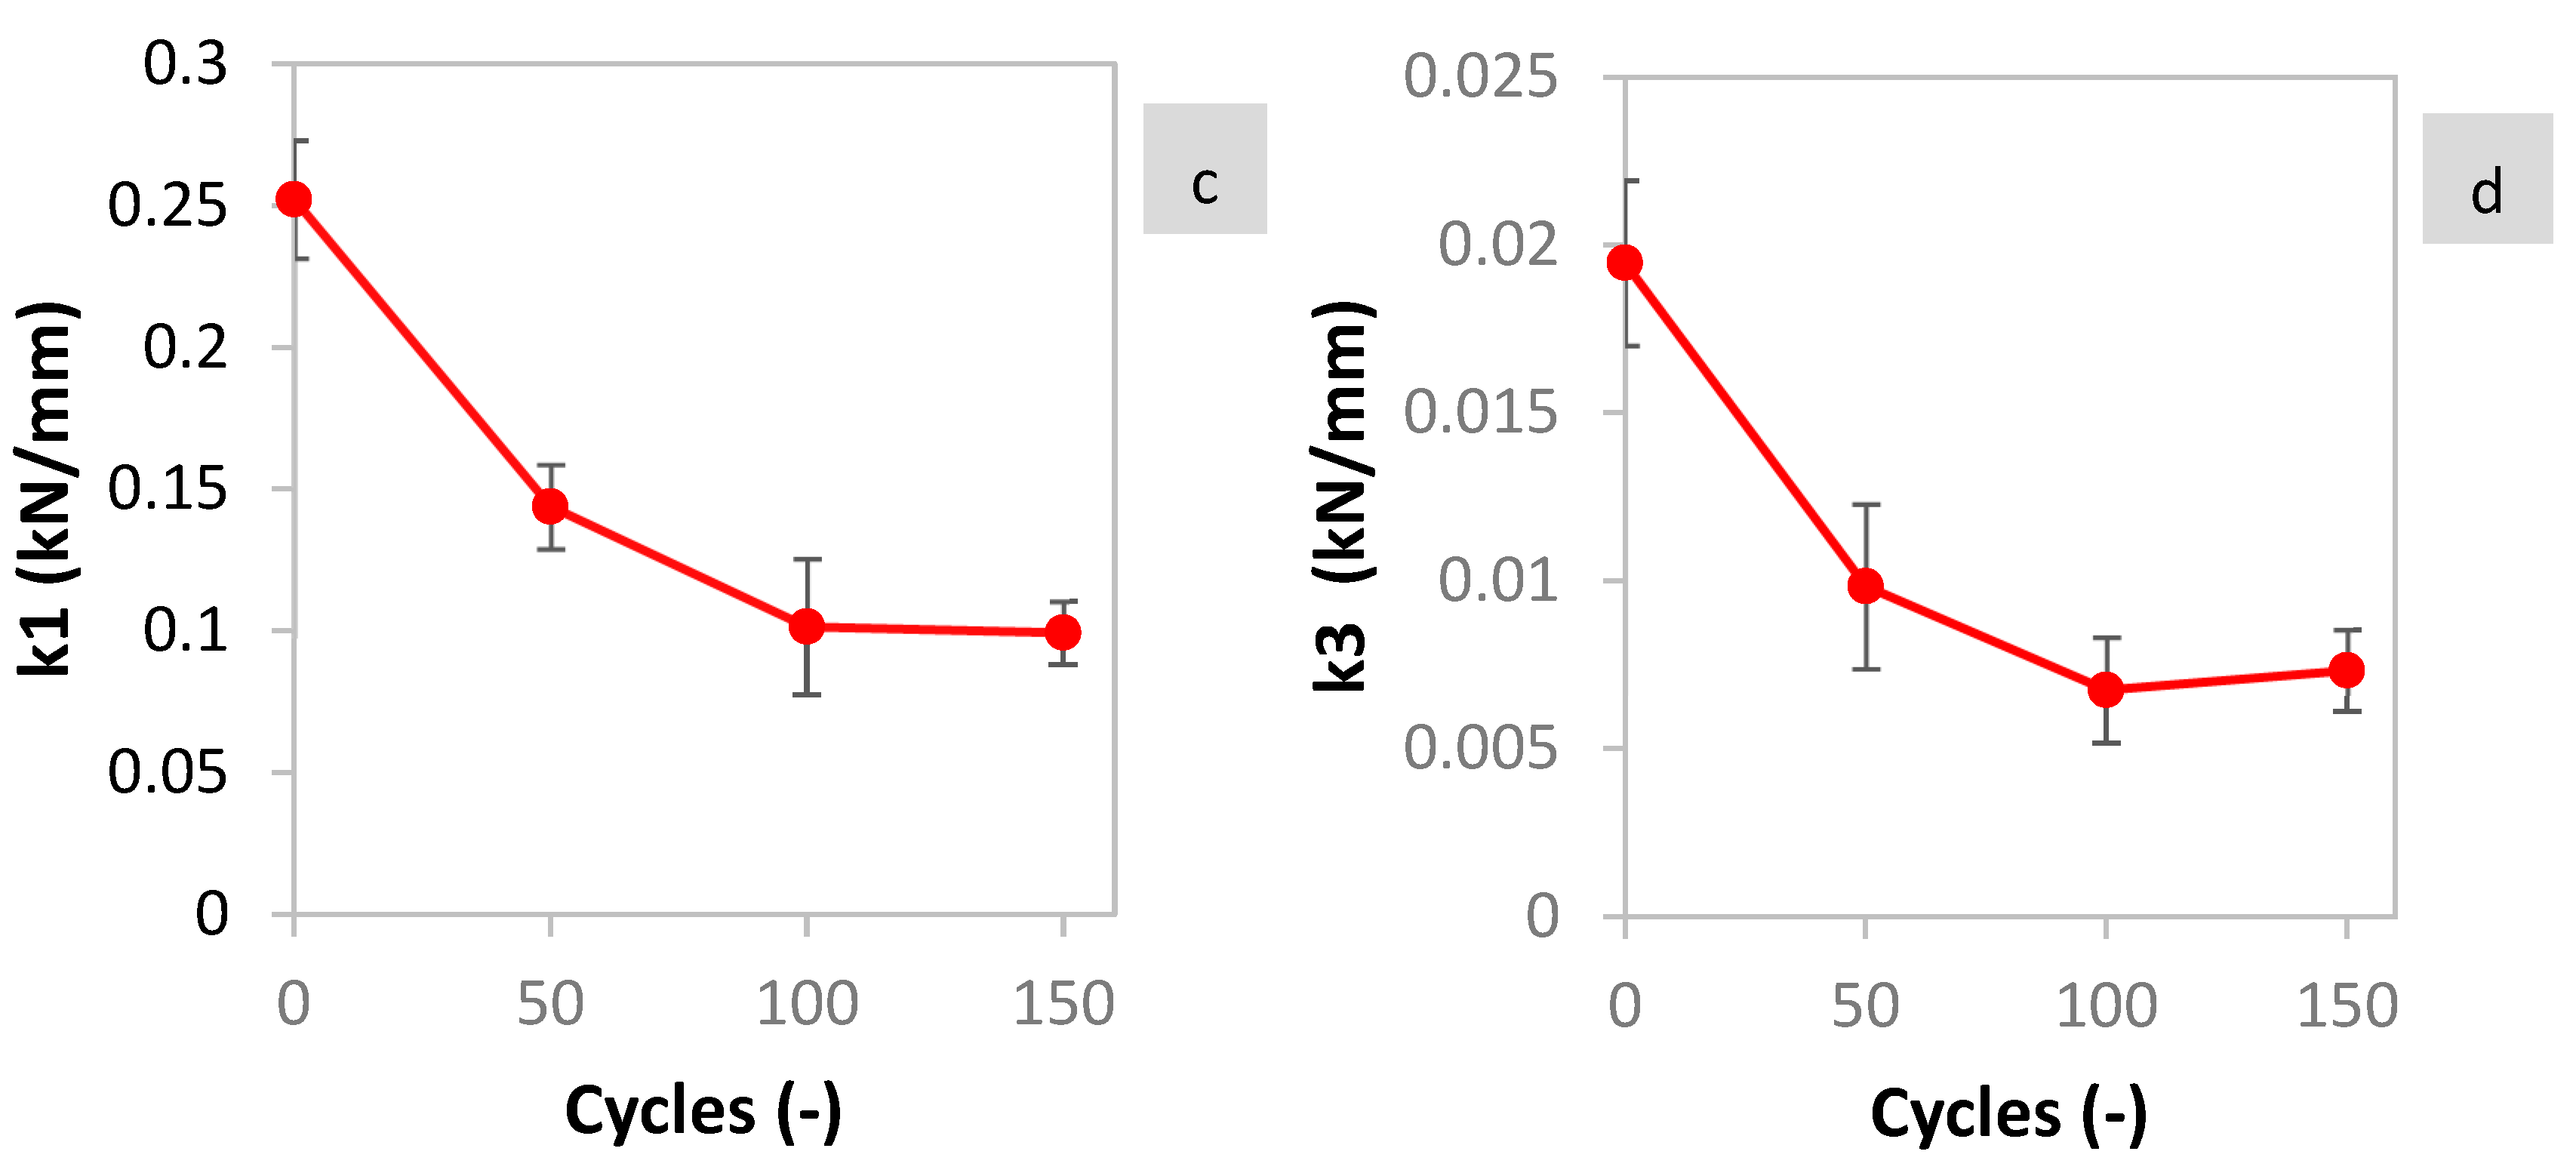
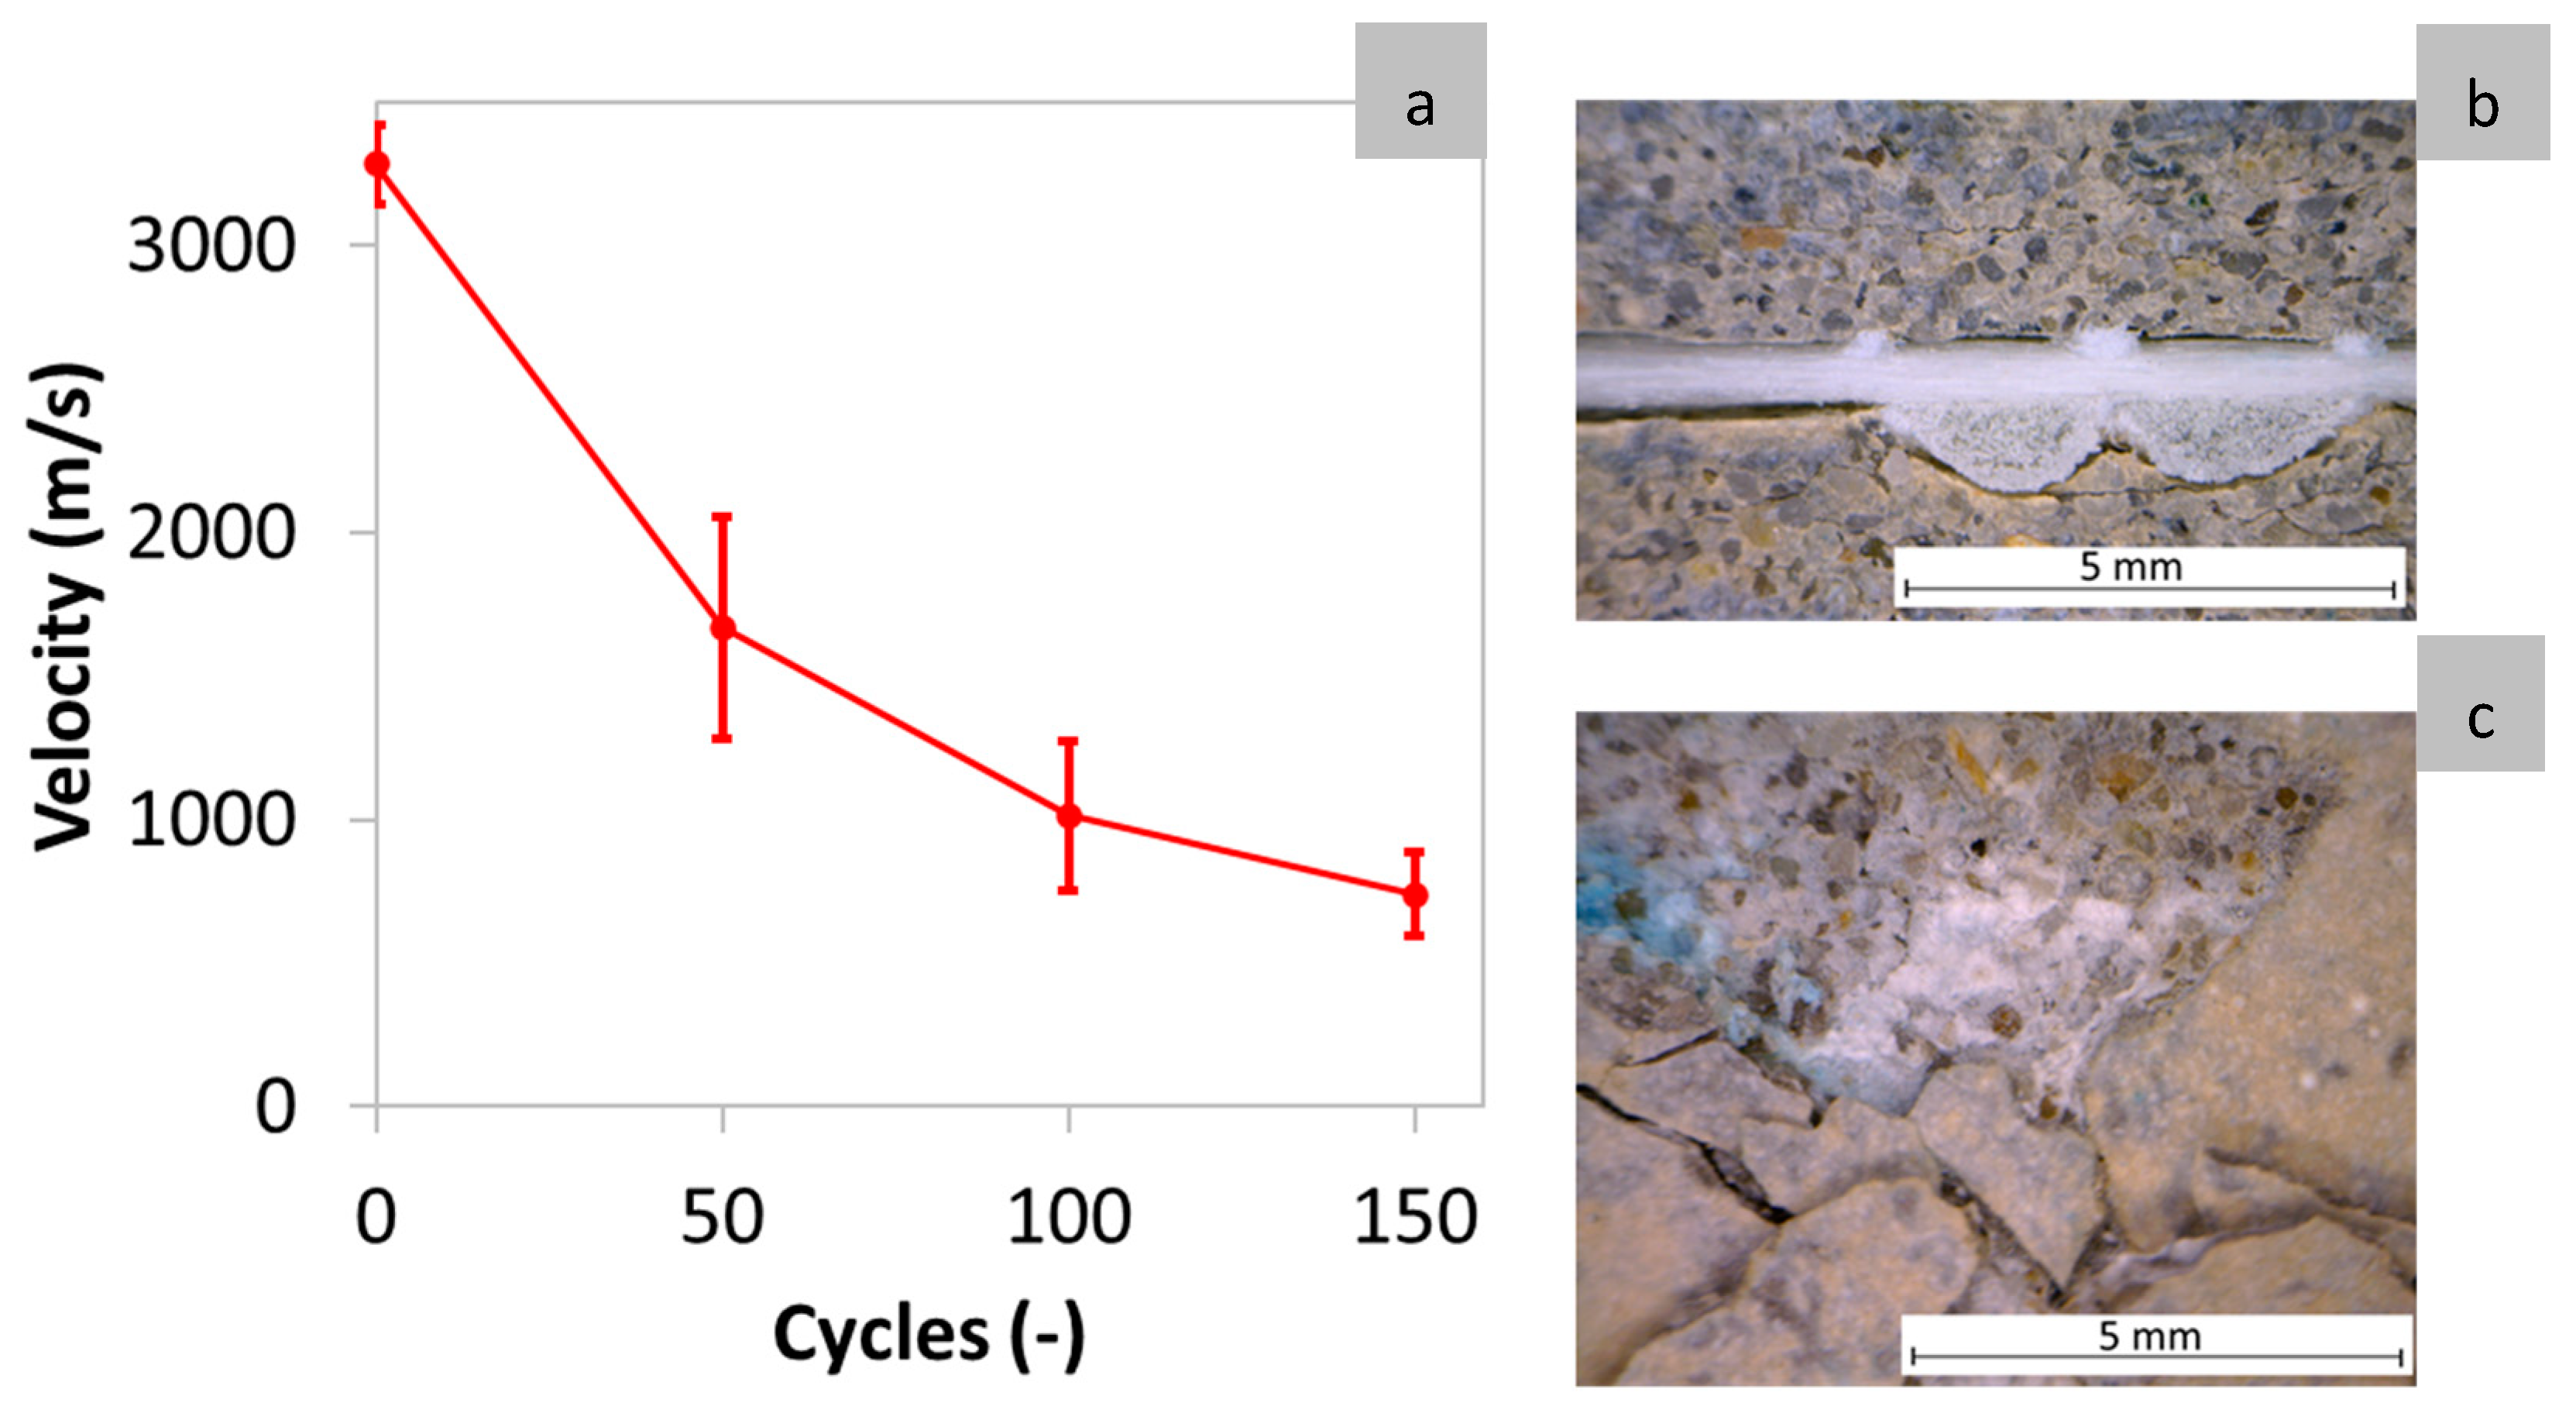
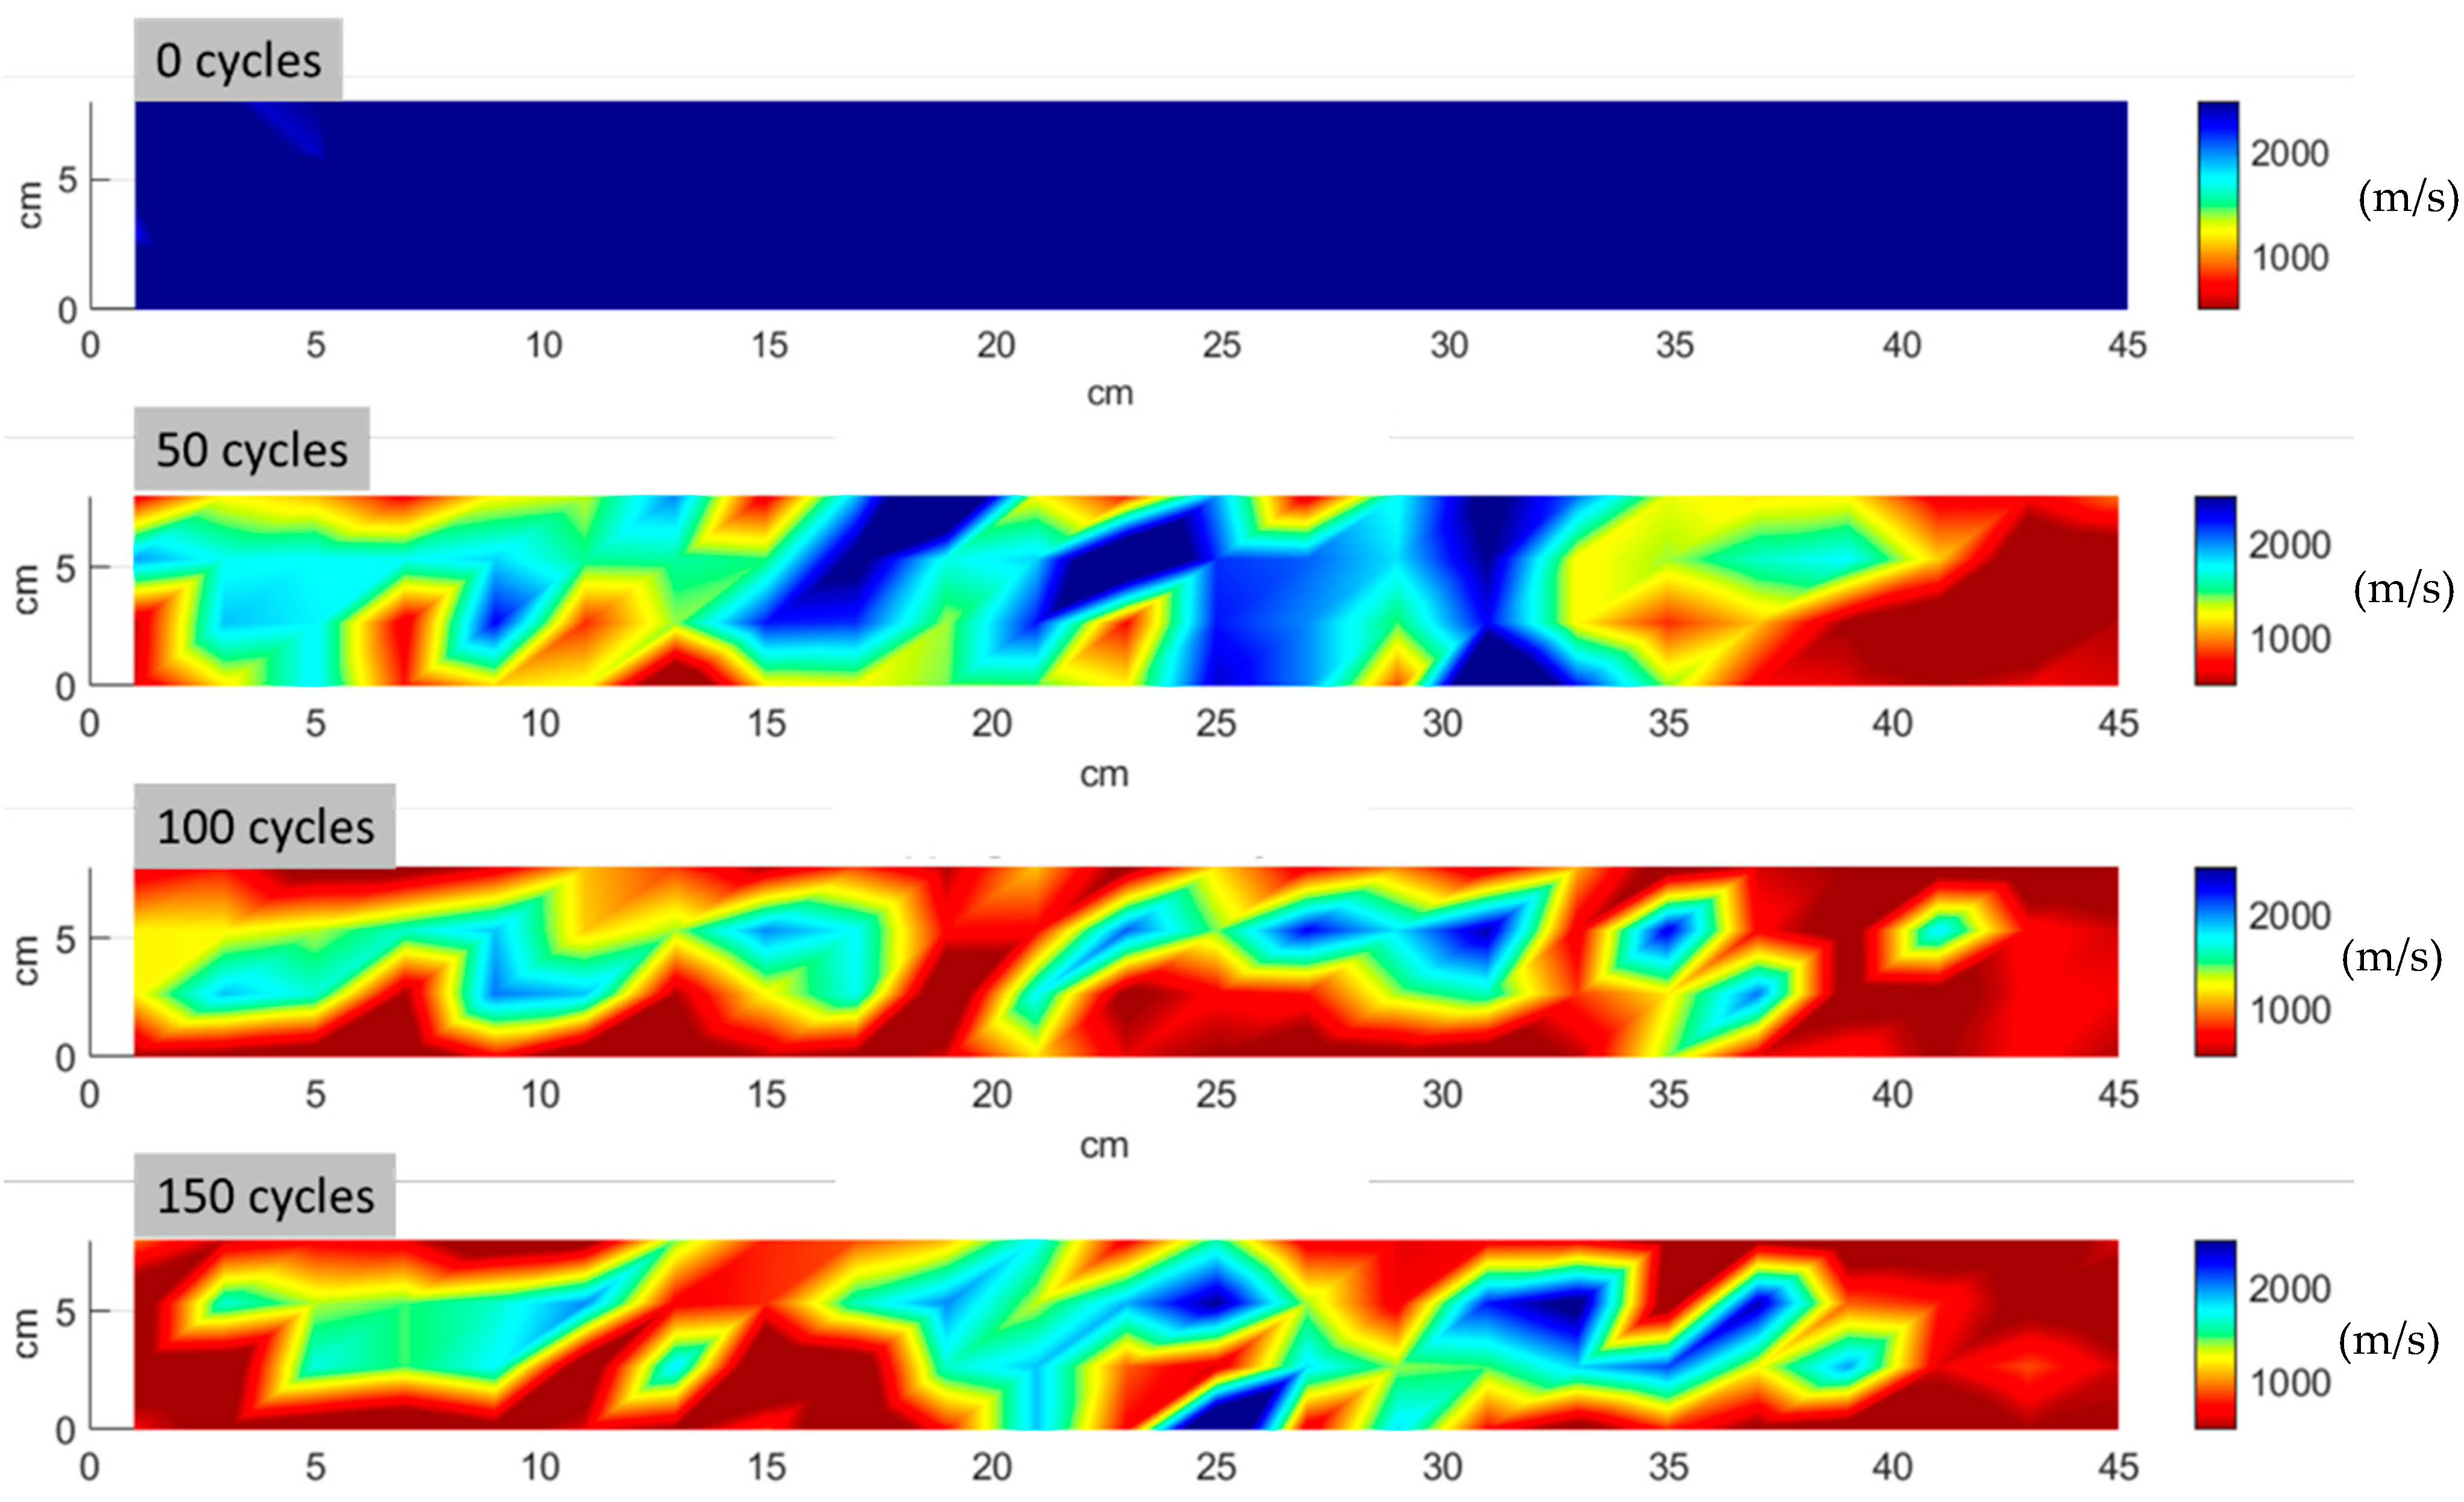
- UPV demonstrated a high sensitivity to freeze–thaw cycles, with velocity decreasing by approximately 60% after the first 50 cycles. UPV results aligned with MMW findings, which showed more pronounced damage-related changes near the specimen edges.
- Both permittivity and UPV exhibited greater sensitivity to early-stage freeze–thaw damage compared to mass loss, which was used to quantify the damage produced by freeze–thaw cycles.
- Humidity significantly influences the permittivity of cementitious media. Higher relative humidity correlates with increased permittivity. This effect was quantified for reference TRC specimens as a first step to increase the applicability of the technique. However, further research is still required.
Author Contributions
Funding
Institutional Review Board Statement
Informed Consent Statement
Data Availability Statement
Acknowledgments
Conflicts of Interest
References
- Flansbjer, M.; Williams Portal, N.; Vennetti, D.; Mueller, U. Composite Behaviour of Textile Reinforced Reactive Powder Concrete Sandwich Façade Elements. Int. J. Concr. Struct. Mater. 2018, 12, 71. [Google Scholar] [CrossRef]
- Blom, J.; El Kadi, M.; Wastiels, J.; Aggelis, D.G. Bending fracture of textile reinforced cement laminates monitored by acoustic emission: Influence of aspect ratio. Constr. Build. Mater. 2014, 70, 370–378. [Google Scholar] [CrossRef]
- Colombo, I.G.; Colombo, M.; Di Prisco, M. Tensile behavior of textile reinforced concrete subjected to freezing-thawing cycles in un-cracked and cracked regimes. Cem. Concr. Res. 2015, 73, 169–183. [Google Scholar] [CrossRef]
- Kovler, K.; Chernov, V. Types of damage in concrete structures. In Failure, Distress and Repair of Concrete Structures; Woodhead Publishing Limited: Sawston, UK, 2009; pp. 32–56. ISBN 9781845694081. [Google Scholar]
- De Munck, M.; Tysmans, T.; El Kadi, M.; Wastiels, J.; Vervloet, J.; Kapsalis, P.; Remy, O. Durability of sandwich beams with textile reinforced cementitious composite faces. Constr. Build. Mater. 2019, 229, 116832. [Google Scholar] [CrossRef]
- Dalalbashi, A.; Ghiassi, B.; Oliveira, D.V. Influence of freeze–thaw cycles on the pull-out response of lime-based TRM composites. Constr. Build. Mater. 2021, 313, 125473. [Google Scholar] [CrossRef]
- Sheng, J.; Wang, L.-C.; Yin, S.P. Study on the mechanical performance of TRC-strengthened RC beams under a salt freeze–thaw environment. Cold Reg. Sci. Technol. 2021, 192, 103384. [Google Scholar] [CrossRef]
- Alma’aitah, M.; Ghiassi, B.; Dalalbashi, A. Durability of textile reinforced concrete: Existing knowledge and current gaps. Appl. Sci. 2021, 11, 2771. [Google Scholar] [CrossRef]
- Yin, S.; Jing, L.; Yin, M.; Wang, B. Mechanical properties of textile reinforced concrete under chloride wet-dry and freeze-thaw cycle environments. Cem. Concr. Compos. 2019, 96, 118–127. [Google Scholar] [CrossRef]
- International Atomic Energy Agency Guidebook on non-destructive testing of concrete structures. Ind. Appl. Chem. Sect. IAEA 2002, 17, 231.
- Verma, S.K.; Bhadauria, S.S.; Akhtar, S. Review of Nondestructive Testing Methods for Condition Monitoring of Concrete Structures. J. Constr. Eng. 2013, 2013, 834572. [Google Scholar] [CrossRef]
- Payan, C.; Abraham, O.; Garnier, V. Ultrasonic Methods. In Non-Destructive Testing and Evaluation of Civil Engineering Structures; Elsevier: Amsterdam, The Netherlands, 2018; pp. 21–85. [Google Scholar] [CrossRef]
- Öztürk, T.; Kroggel, O.; Grübl, P.; Popovics, J.S. Improved ultrasonic wave reflection technique to monitor the setting of cement-based materials. NDT E Int. 2006, 39, 258–263. [Google Scholar] [CrossRef]
- Öztürk, T.; Rapoport, J.; Popovics, J.S.; Shah, S.P. Monitoring the setting and hardening of cement-based materials with ultrasound. Concr. Sci. Eng. 1999, 1, 83–91. [Google Scholar]
- Rapoport, J.R.; Popovics, J.S.; Kolluru, S.V.; Shah, S.P. Using ultrasound to monitor stiffening process of concrete with admixtures. ACI Struct. J. 2000, 97, 675–683. [Google Scholar] [CrossRef]
- Guan, X.; Chen, J.; Qiu, J.; Gao, Y.; Gao, J. Damage evaluation method based on ultrasound technique for gangue concrete under freezing-thawing cycles. Constr. Build. Mater. 2020, 246, 118437. [Google Scholar] [CrossRef]
- Ju, T.; Achenbach, J.D.; Jacobs, L.J.; Guimaraes, M.; Qu, J. Ultrasonic nondestructive evaluation of alkali–silica reaction damage in concrete prism samples. Mater. Struct. Constr. 2017, 50, 60. [Google Scholar] [CrossRef]
- Bouchaala, F.; Payan, C.; Garnier, V.; Balayssac, J.P. Carbonation assessment in concrete by nonlinear ultrasound. Cem. Concr. Res. 2011, 41, 557–559. [Google Scholar] [CrossRef]
- Ghione, G.; Pirola, M. Microwave Electronics; Cambridge University Press: Cambridge, UK, 2017; ISBN 9781316756171. [Google Scholar]
- Brinker, K.; Dvorsky, M.; Al Qaseer, M.T.; Zoughi, R. Review of advances in microwave and millimetre-wave NDT&E: Principles and applications: Microwave and Millimeter-Wave NDT&E. Philos. Trans. R. Soc. A Math. Phys. Eng. Sci. 2020, 378, 20190585. [Google Scholar] [CrossRef]
- Bescher, E.; Sambol, M.; Rice, E.K.; Mackenzie, J.D. Determination of water-to-cement ratio in freshly mixed rapid-setting calcium sulfoaluminate concrete using 2.45 GHz microwave radiation. Cem. Concr. Res. 2004, 34, 807–812. [Google Scholar] [CrossRef]
- Bois, K.J.; Benally, A.D.; Nowak, P.S.; Zoughi, R. Cure-state monitoring and water-to-cement ratio determination of fresh portland cement-based materials using near-field microwave techniques. IEEE Trans. Instrum. Meas. 1998, 47, 628–637. [Google Scholar] [CrossRef]
- Bois, K.J.; Benally, A.; Nowak, P.S.; Zoughi, R. Microwave nondestructive determination of sand-to-cement ratio in mortar. Res. Nondestruct. Eval. 1997, 9, 227–238. [Google Scholar] [CrossRef]
- Shalaby, W.; Zoughi, R. Microwave compressive strength estimation of cement paste using monopole probes. Res. Nondestruct. Eval. 1995, 7, 101–115. [Google Scholar] [CrossRef]
- Ospitia, N.; Tsangouri, E.; Pourkazemi, A.; Wang, Q.; Keshavarzi, M.S.; Stiens, J.H.; Aggelis, D.G. Elastic and electromagnetic monitoring of TRC sandwich panels in fracture under four-point bending. Constr. Build. Mater. 2023, 400, 132824. [Google Scholar] [CrossRef]
- Ospitia, N.; Pourkazemi, A.; Tsangouri, E.; Aggelis, D.G.; Stiens, J.H. Linking the elastic, electromagnetic and thermal properties of fresh cement. NDT E Int. 2022, 131, 102704. [Google Scholar] [CrossRef]
- Gorur, K.; Smit, M.K.; Wittmann, F.H. Microwave Study of Hydrating Cement Paste at Early Age. Cem. Concr. Res. 1982, 12, 447–454. [Google Scholar] [CrossRef]
- Ding, X.Z.; Zhang, X.; Ong, C.K.; Tan, B.T.G.; Yang, J. Study of dielectric and electrical properties of mortar in the early hydration period at microwave frequencies. J. Mater. Sci. 1996, 31, 5339–5345. [Google Scholar] [CrossRef]
- Hasar, U.C. Non-destructive testing of hardened cement specimens at microwave frequencies using a simple free-space method. NDT E Int. 2009, 42, 550–557. [Google Scholar] [CrossRef]
- Kharkovsky, S.N.; Akay, M.F.; Hasar, U.C.; Atis, C.D. Measurement and monitoring of microwave reflection and transmission properties of cement-based specimens. IEEE Trans. Instrum. Meas. 2002, 51, 1210–1217. [Google Scholar] [CrossRef]
- Holcim, “Cem I 52,5 N Strong,” p. 2, 2013. Available online: https://www.holcim.be/sites/belgium/files/2024-03/ft_cem_i_52.5_n_mf_nl.pdf (accessed on 16 December 2024).
- V. FRAAS Solutions in Textile Datenblatt: SITgrid200. 2017, p. 1. Available online: www.solutions-in-textile.com (accessed on 16 December 2024).
- Tolegenova, A.; Skripkiunas, G.; Rishko, L.; Akmalaiuly, K. Both Plasticizing and Air-Entraining Effect on Cement-Based Material Porosity and Durability. Materials 2022, 15, 4382. [Google Scholar] [CrossRef] [PubMed]
- Lu, Z.; Feng, Z.-G.; Yao, D.; Li, X.; Ji, H. Freeze-thaw resistance of Ultra-High performance concrete: Dependence on concrete composition. Constr. Build. Mater. 2021, 293, 123523. [Google Scholar] [CrossRef]
- Astm C666/C666M; Standard Test Method for Resistance of Concrete to Rapid Freezing and Thawing. ASTM International: West Conshohocken, PA, USA, 2003.
- Pourkazemi, A.; Stiens, J.H.; Becquaert, M.; Vandewal, M. Transient Radar Method: Novel Illumination and Blind Electromagnetic/Geometrical Parameter Extraction Technique for Multilayer Structures. IEEE Trans. Microw. Theory Tech. 2017, 65, 2171–2184. [Google Scholar] [CrossRef]
- El Kadi, M. Experimental Characterization, Benchmarking and Modelling of 3D Textile Reinforced Cement Composites. Ph.D. Thesis, Vrije Universiteit Brussel, Ixelles, Belgium, 2019. [Google Scholar]

| Cement type I 52.5 N | 1 |
| River sand | 2 |
| Water | 0.45 |
| Superplasticizer | 0.5% |
| SIT Grid 200 | Standard Deviation | |
|---|---|---|
| σmax (MPa) | 979.10 | 22.04 |
| E-modulus (GPa) | 69.57 | 0.34 |
Disclaimer/Publisher’s Note: The statements, opinions and data contained in all publications are solely those of the individual author(s) and contributor(s) and not of MDPI and/or the editor(s). MDPI and/or the editor(s) disclaim responsibility for any injury to people or property resulting from any ideas, methods, instructions or products referred to in the content. |
© 2024 by the authors. Licensee MDPI, Basel, Switzerland. This article is an open access article distributed under the terms and conditions of the Creative Commons Attribution (CC BY) license (https://creativecommons.org/licenses/by/4.0/).
Share and Cite
Ospitia, N.; Pourkazemi, A.; Tsangouri, E.; Tayeh, T.; Stiens, J.H.; Aggelis, D.G. Nondestructive Monitoring of Textile-Reinforced Cementitious Composites Subjected to Freeze–Thaw Cycles. Materials 2024, 17, 6232. https://doi.org/10.3390/ma17246232
Ospitia N, Pourkazemi A, Tsangouri E, Tayeh T, Stiens JH, Aggelis DG. Nondestructive Monitoring of Textile-Reinforced Cementitious Composites Subjected to Freeze–Thaw Cycles. Materials. 2024; 17(24):6232. https://doi.org/10.3390/ma17246232
Chicago/Turabian StyleOspitia, Nicolas, Ali Pourkazemi, Eleni Tsangouri, Thaer Tayeh, Johan H. Stiens, and Dimitrios G. Aggelis. 2024. "Nondestructive Monitoring of Textile-Reinforced Cementitious Composites Subjected to Freeze–Thaw Cycles" Materials 17, no. 24: 6232. https://doi.org/10.3390/ma17246232
APA StyleOspitia, N., Pourkazemi, A., Tsangouri, E., Tayeh, T., Stiens, J. H., & Aggelis, D. G. (2024). Nondestructive Monitoring of Textile-Reinforced Cementitious Composites Subjected to Freeze–Thaw Cycles. Materials, 17(24), 6232. https://doi.org/10.3390/ma17246232