Author Contributions
Conceptualization, K.Ż. and P.Ż.; methodology, K.Ż. and P.Ż.; software, K.S., M.B., I.R. and Ł.K.; validation, K.Ż. and P.Ż.; investigation, K.Ż., P.Ż., K.S., M.B., I.R. and Ł.K.; data curation, K.Ż., P.Ż., K.S., M.B., I.R. and Ł.K.; writing—original draft preparation, K.Ż. and P.Ż.; writing—review and editing, K.Ż., P.Ż., K.S., M.B., I.R. and Ł.K.; visualization, K.Ż., P.Ż., K.S., M.B., I.R. and Ł.K. All authors have read and agreed to the published version of the manuscript.
Figure 1.
Introductory graphical abstract for the research processes.
Figure 1.
Introductory graphical abstract for the research processes.
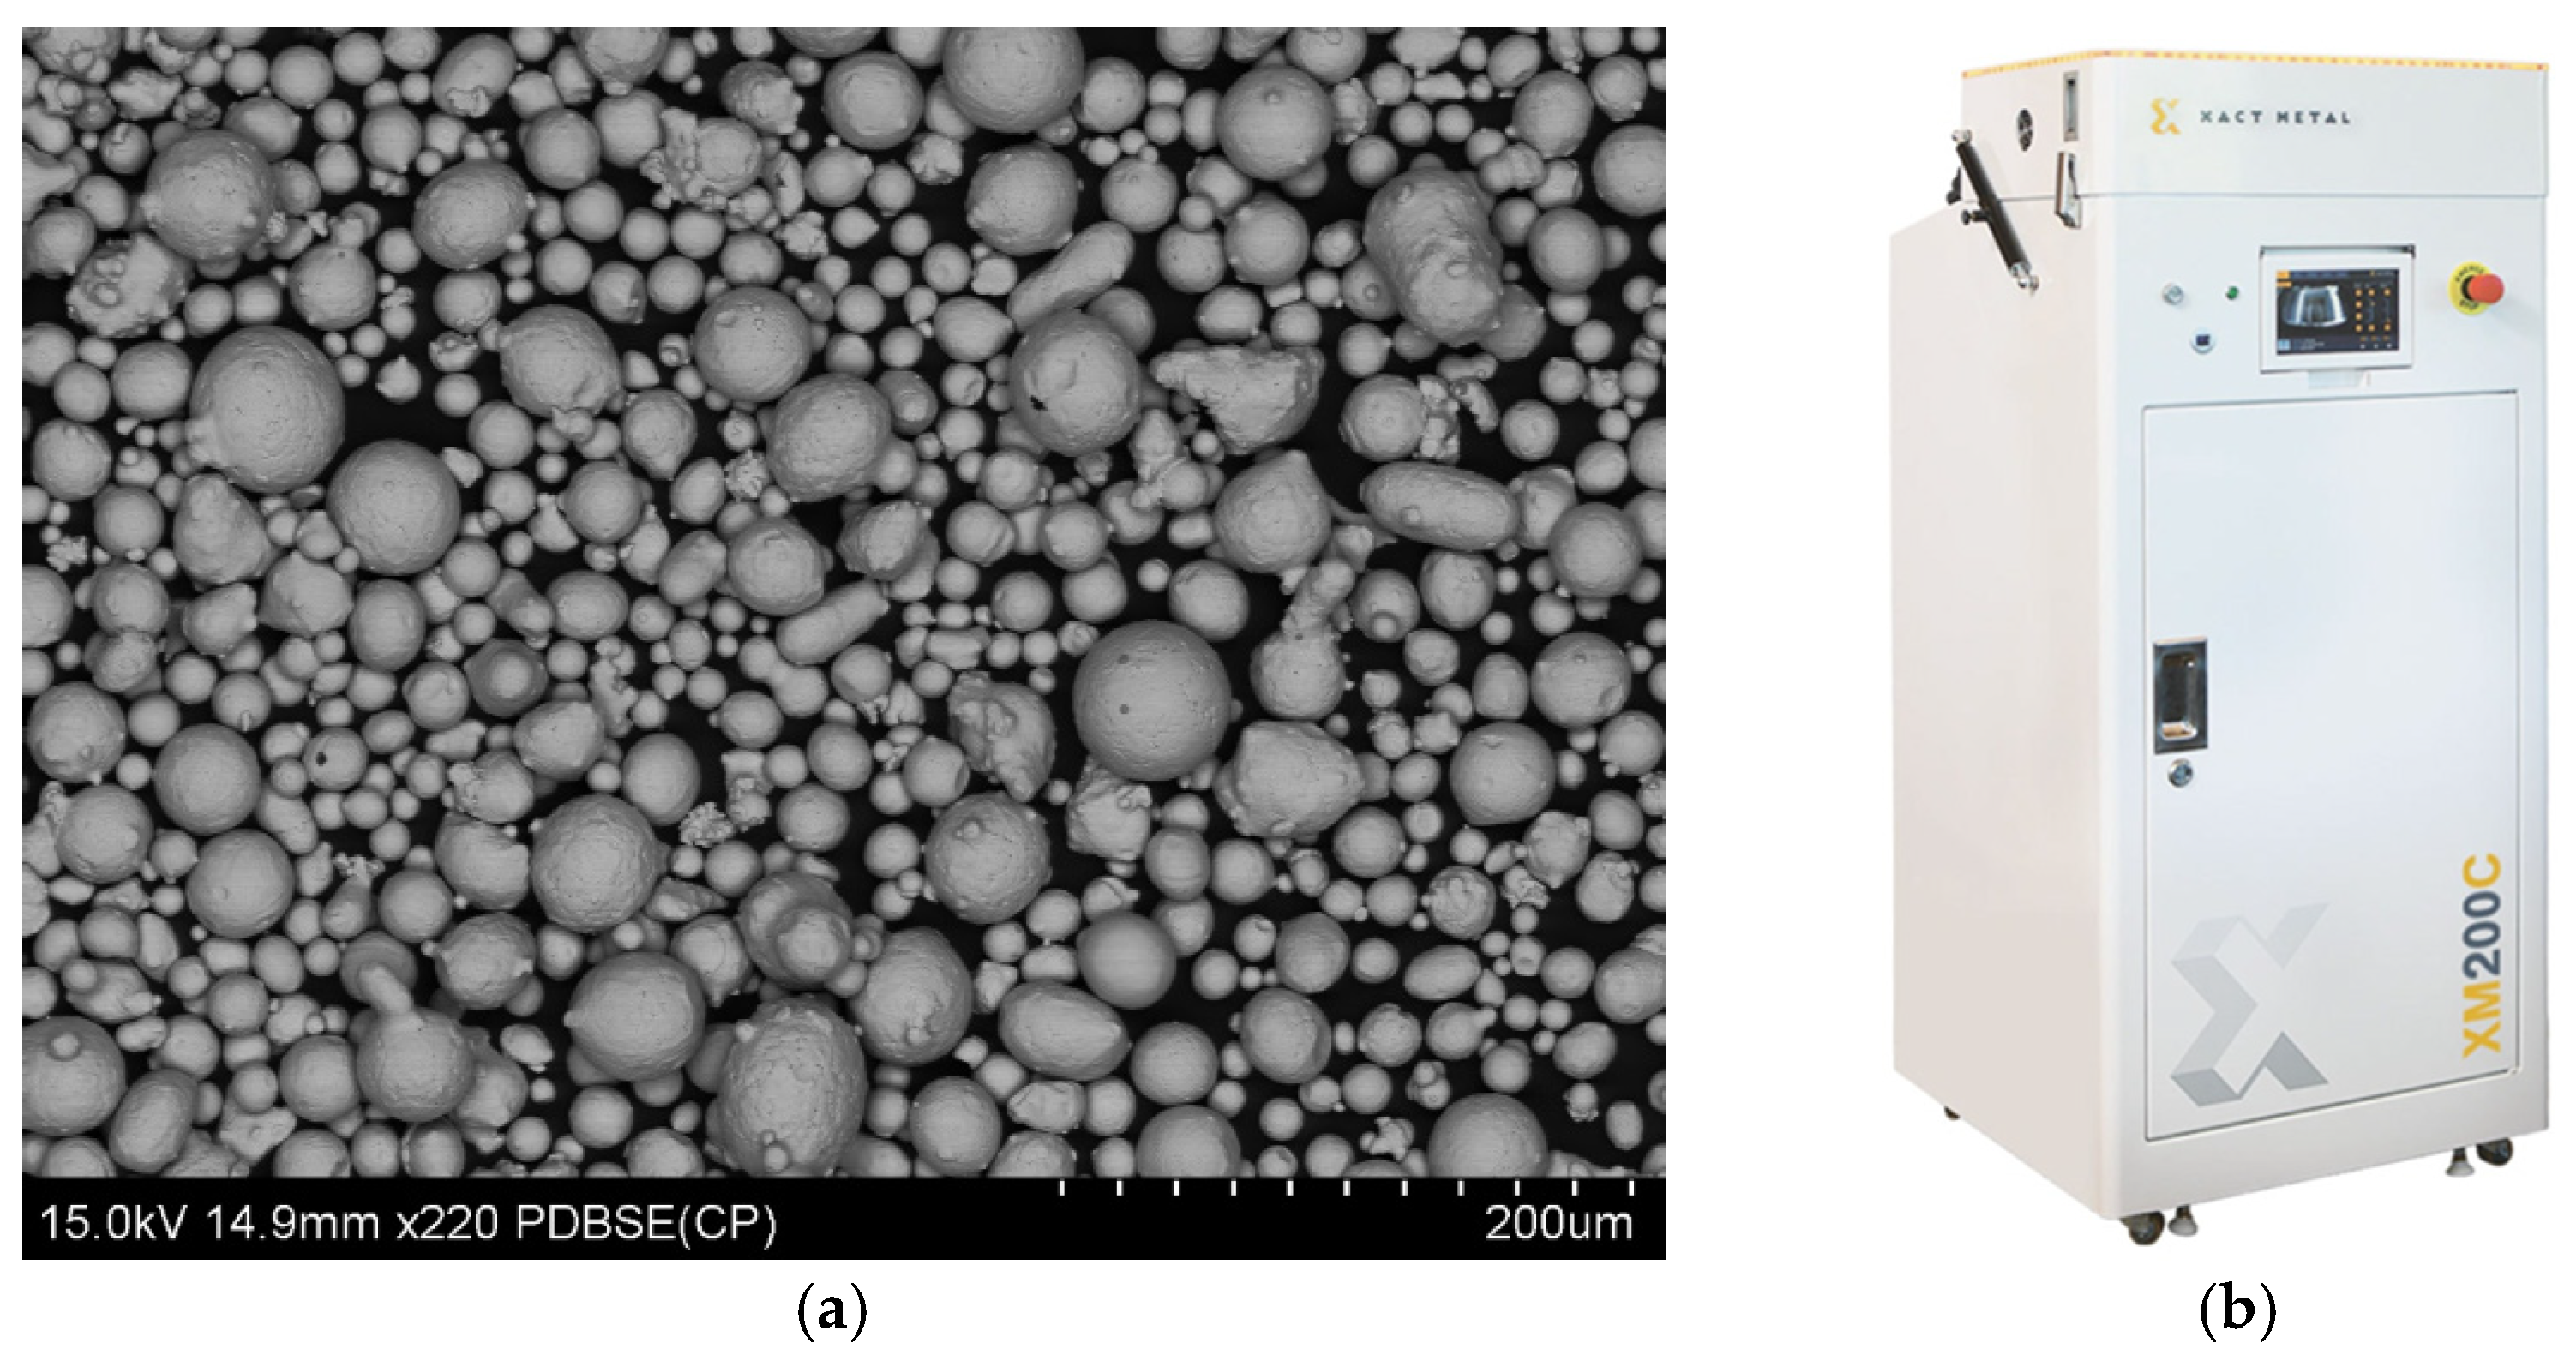
Figure 2.
Xact Metal XM200C 3D Printer (a), SEM image of M300 steel powder (b).
Figure 2.
Xact Metal XM200C 3D Printer (a), SEM image of M300 steel powder (b).
Figure 3.
A 3D model (a) and an exemplary sample made using the DMLS method (b).
Figure 3.
A 3D model (a) and an exemplary sample made using the DMLS method (b).
Figure 4.
Photo of the unpolished sample before testing, (a) macroscopic, (b) sample surface (front) ×500, (c) sample surface (top) ×200, (d) sample surface metallographic cross-section (front) ×500. (SEM).
Figure 4.
Photo of the unpolished sample before testing, (a) macroscopic, (b) sample surface (front) ×500, (c) sample surface (top) ×200, (d) sample surface metallographic cross-section (front) ×500. (SEM).
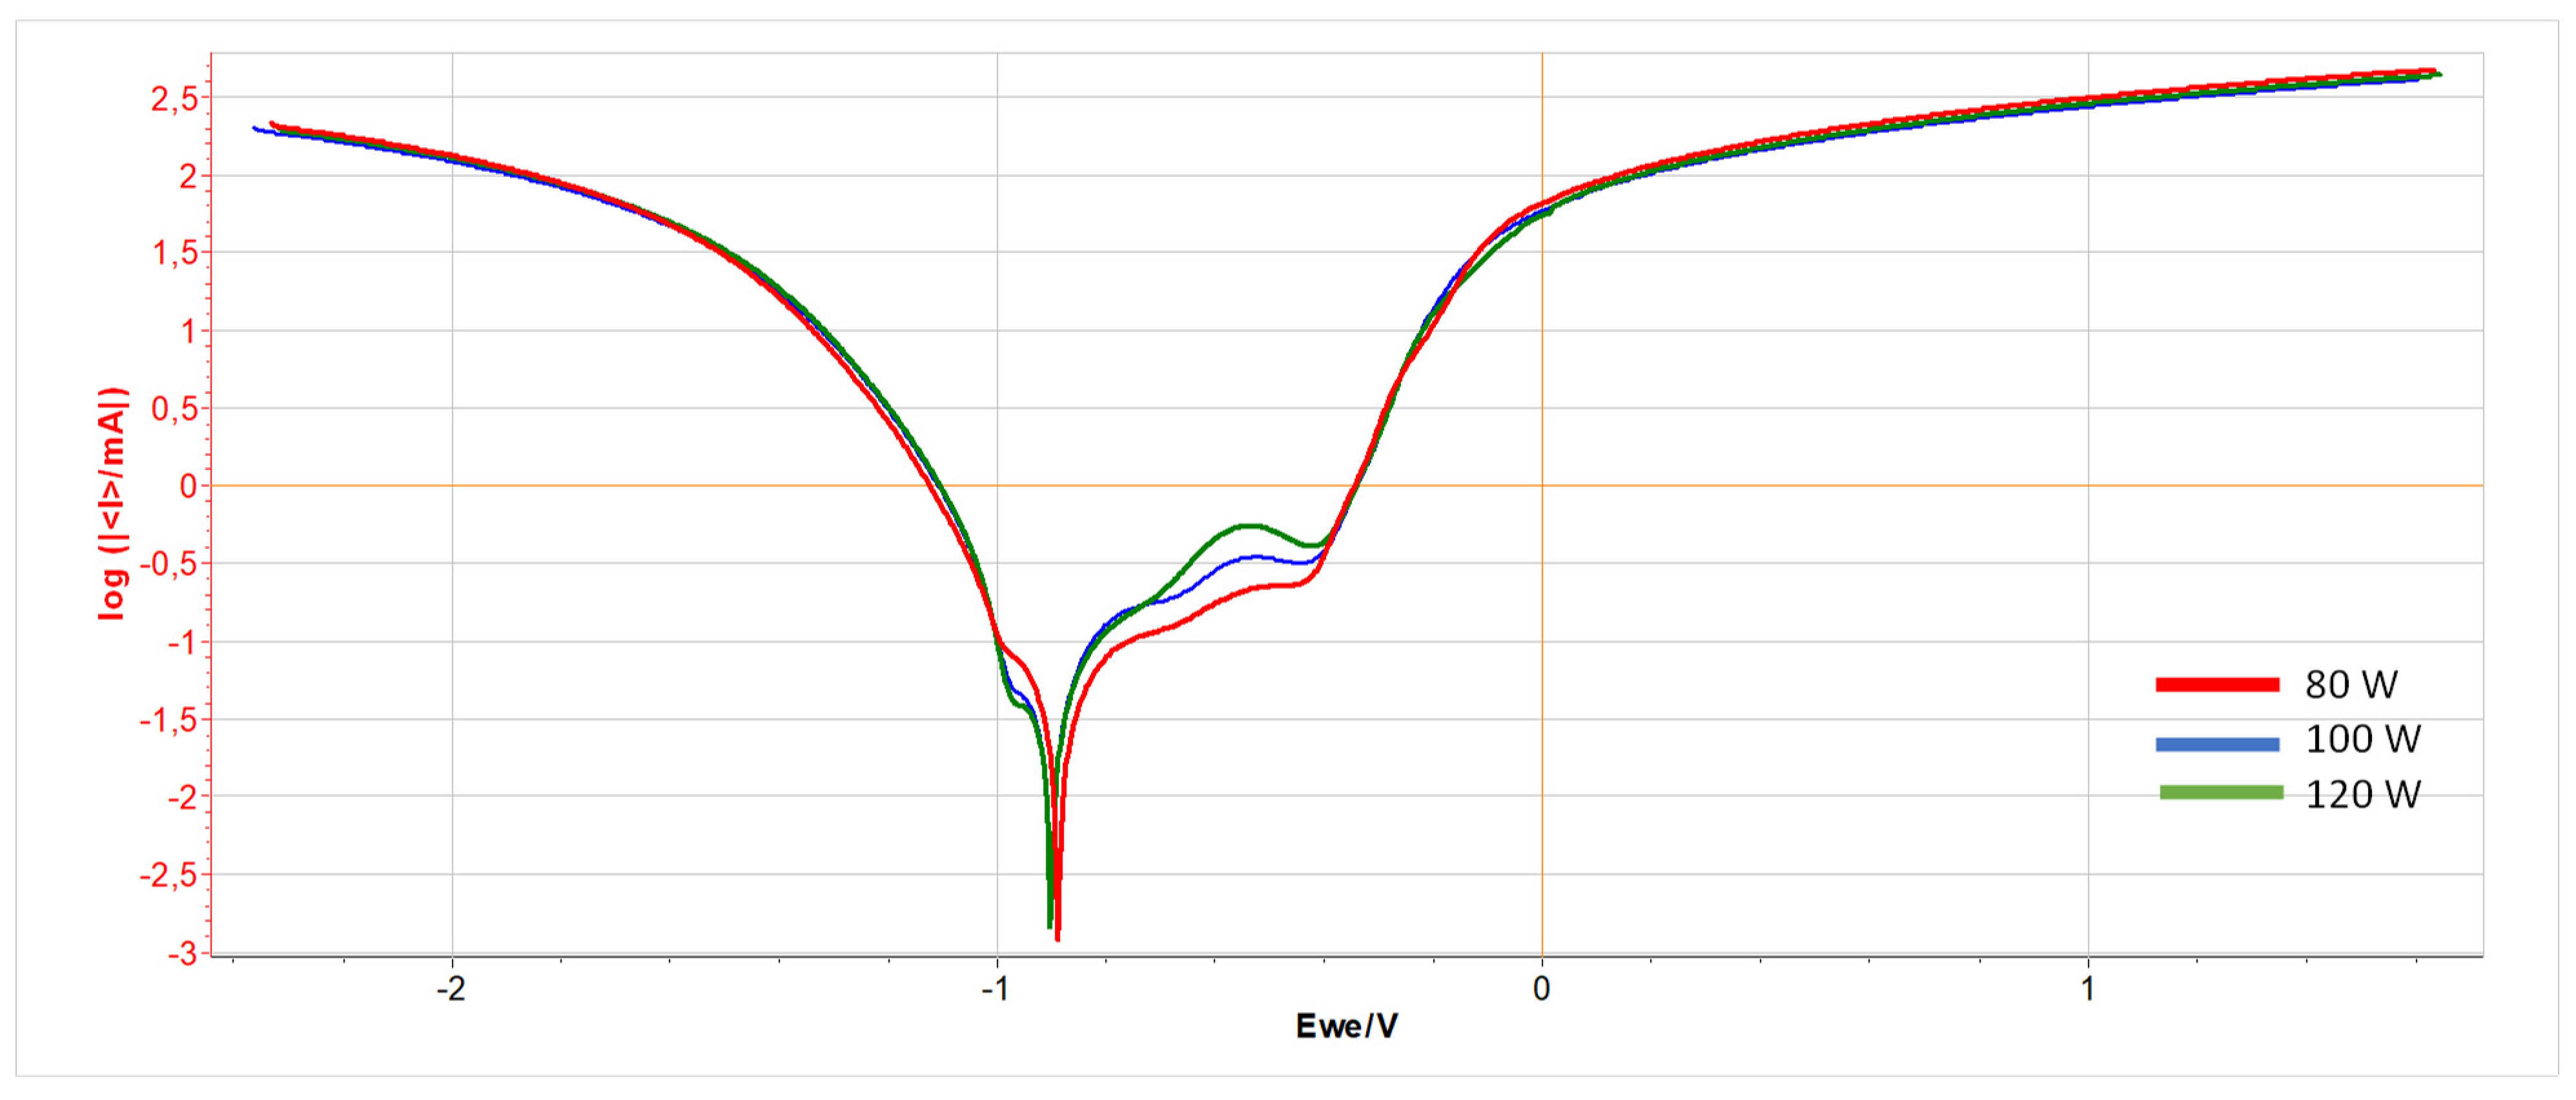
Figure 5.
Potentiodynamic test graph for unpolished samples printed with power: 80 W (red line), 100 W (blue line), and 120 W (green line).
Figure 5.
Potentiodynamic test graph for unpolished samples printed with power: 80 W (red line), 100 W (blue line), and 120 W (green line).
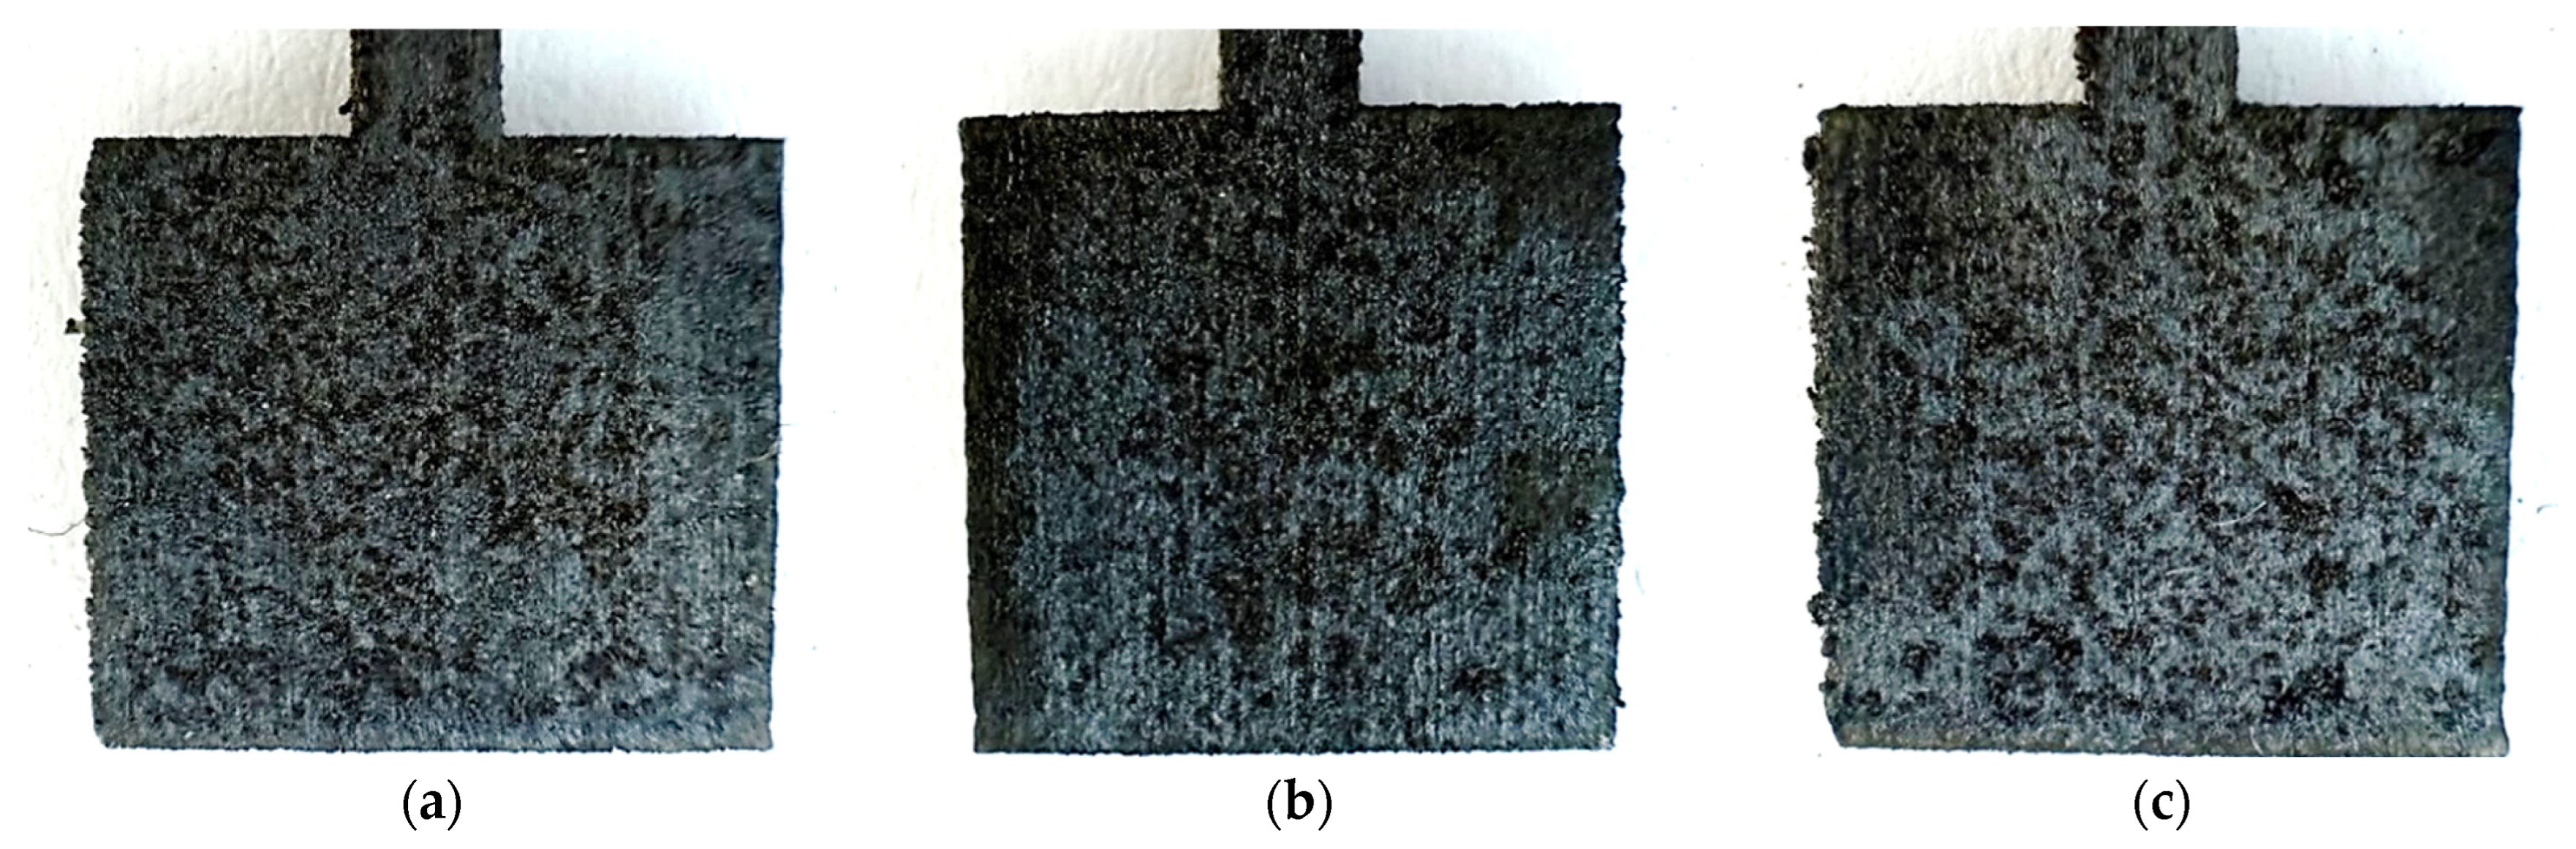
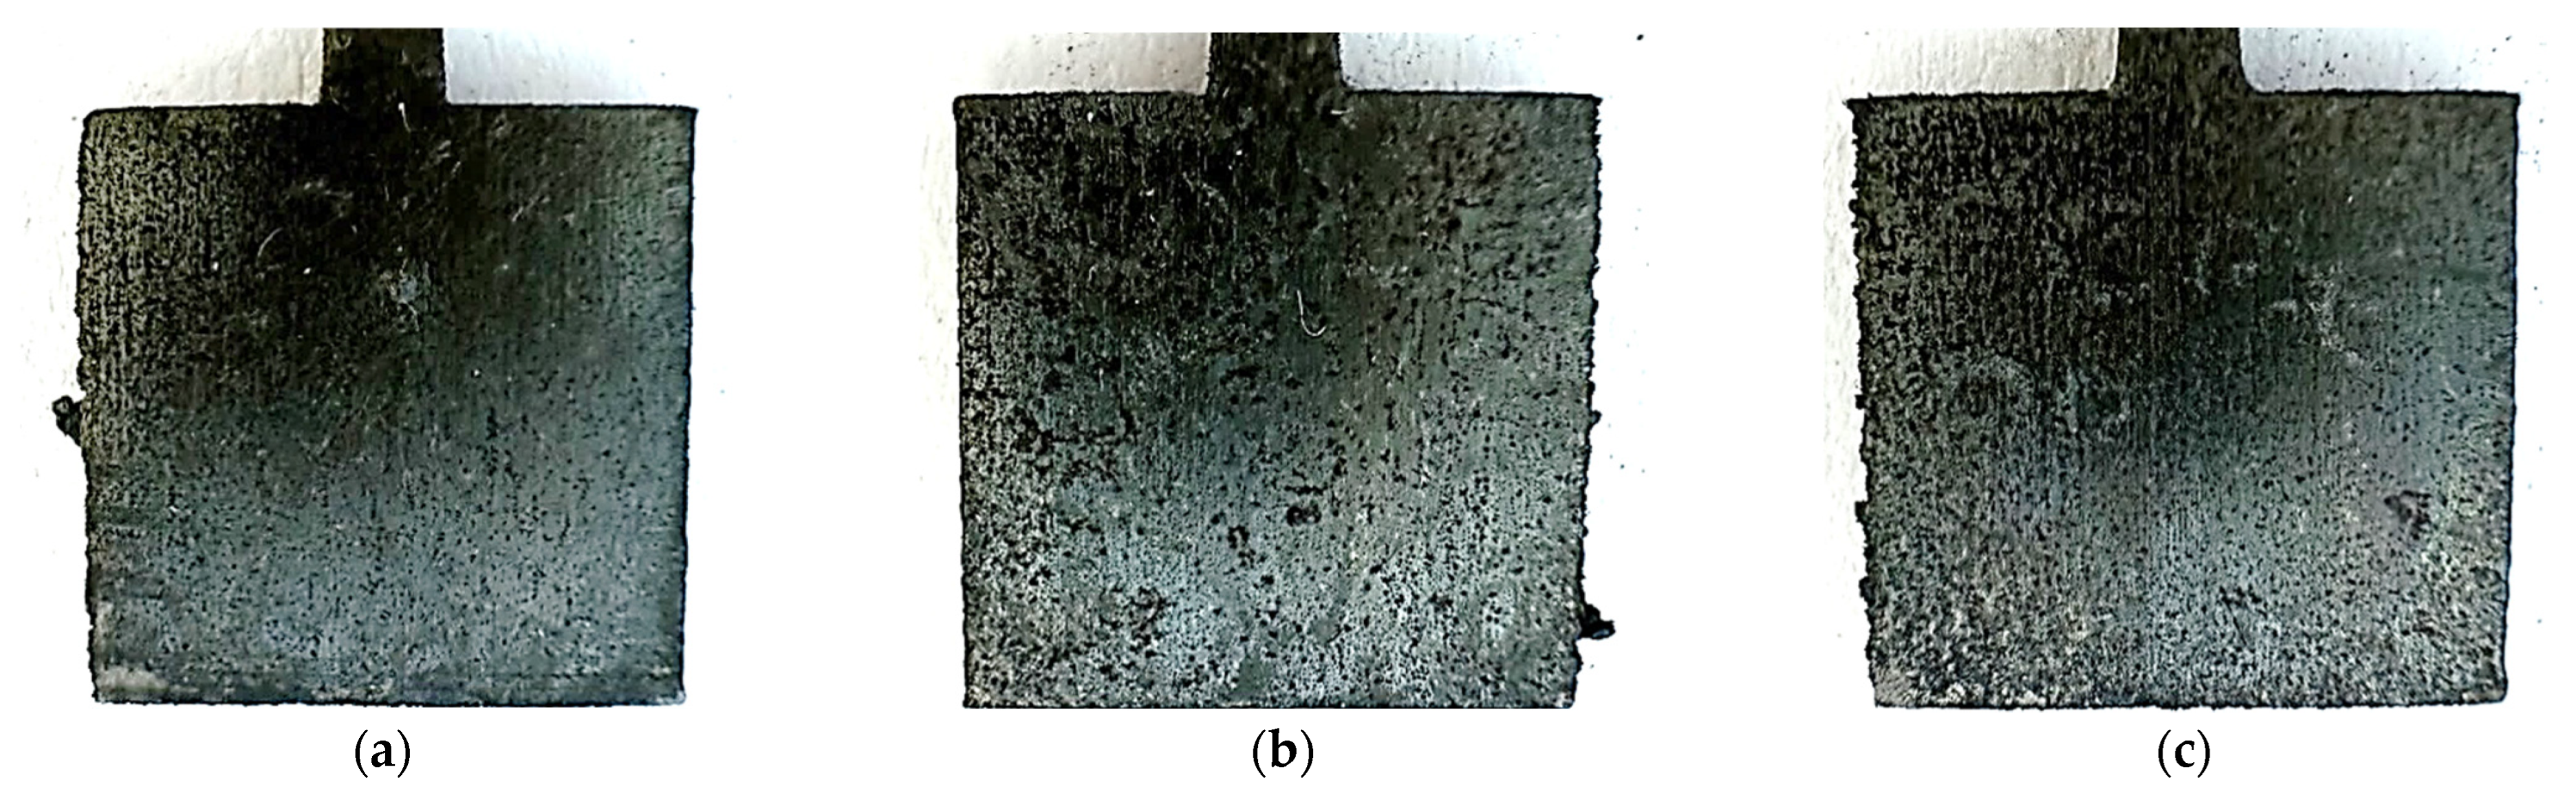
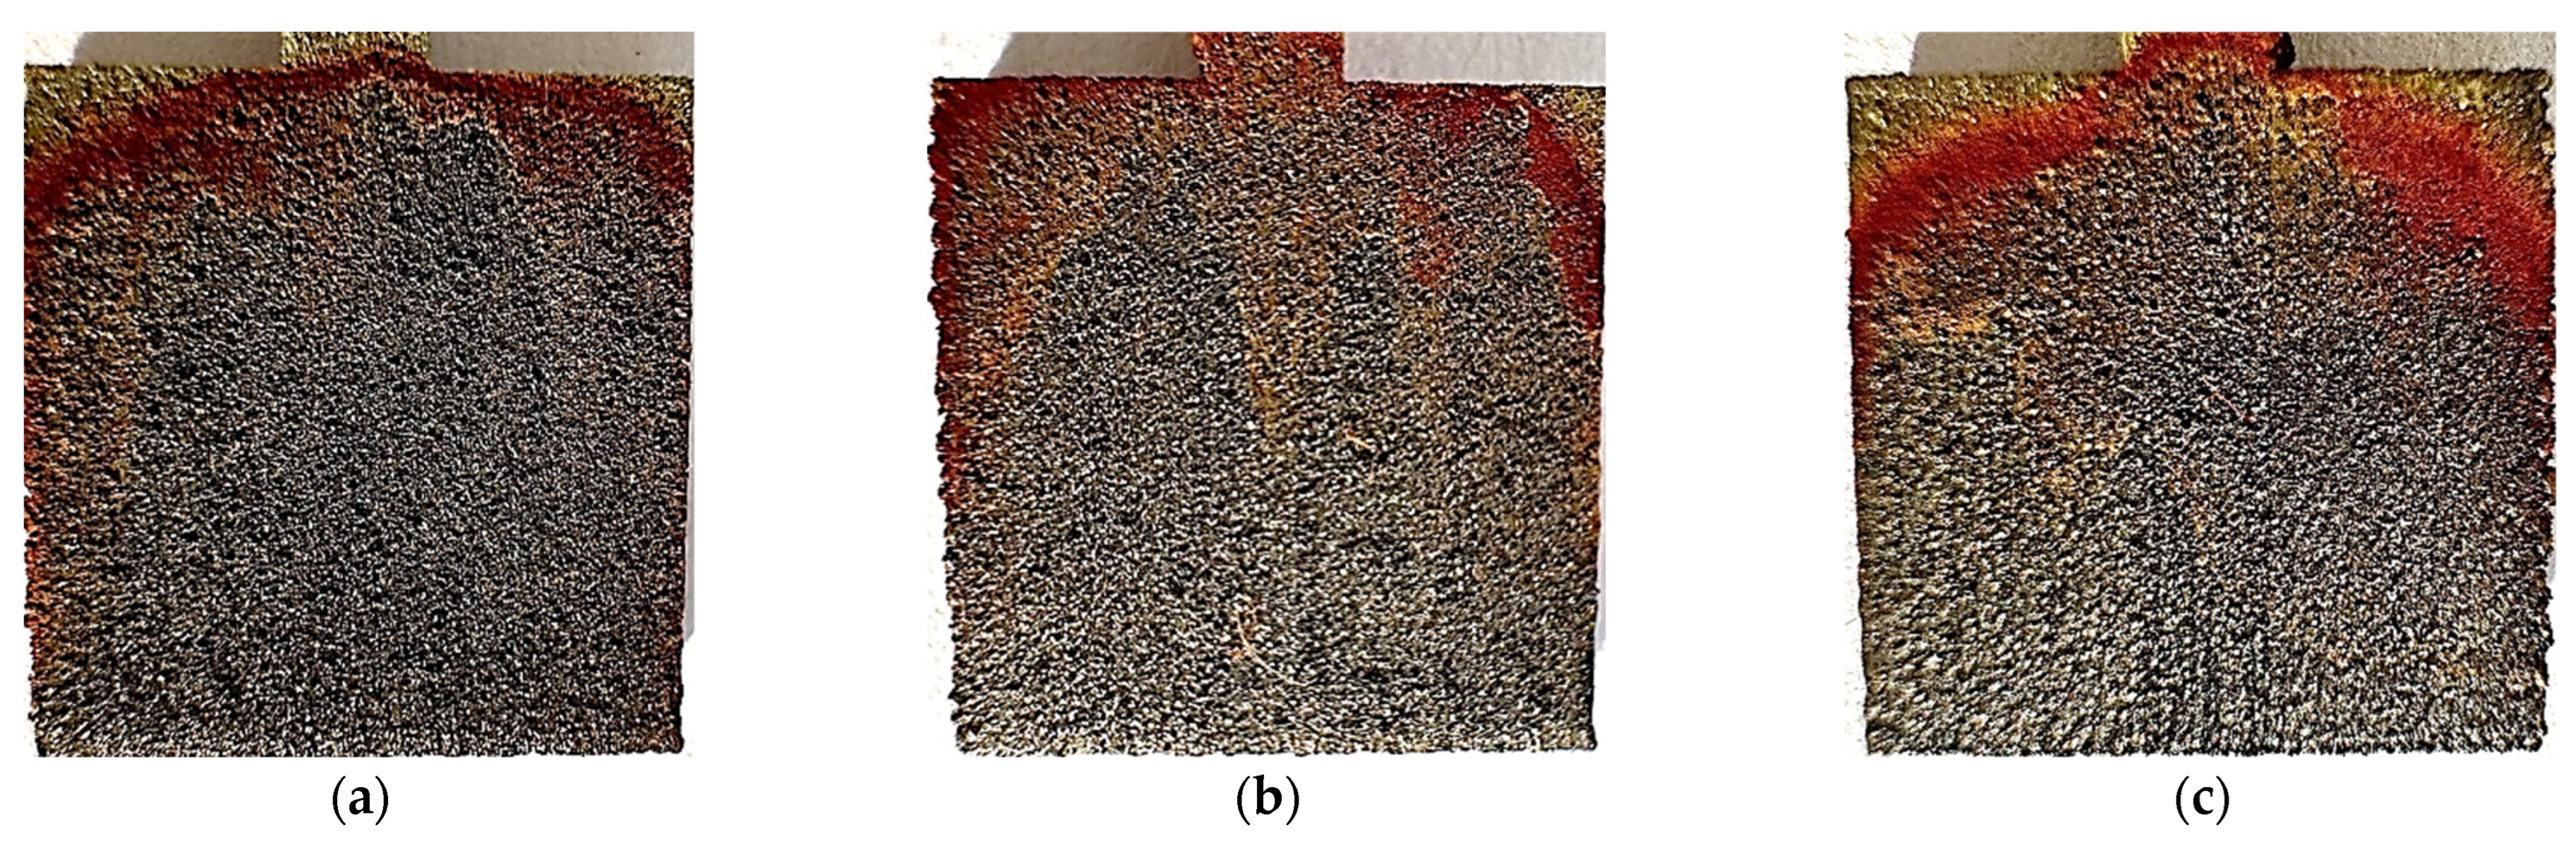
Figure 6.
Photos of unpolished samples after the potentiostatic test, printed with laser power: (a) 80 W, (b) 100 W, and (c) 120 W.
Figure 6.
Photos of unpolished samples after the potentiostatic test, printed with laser power: (a) 80 W, (b) 100 W, and (c) 120 W.
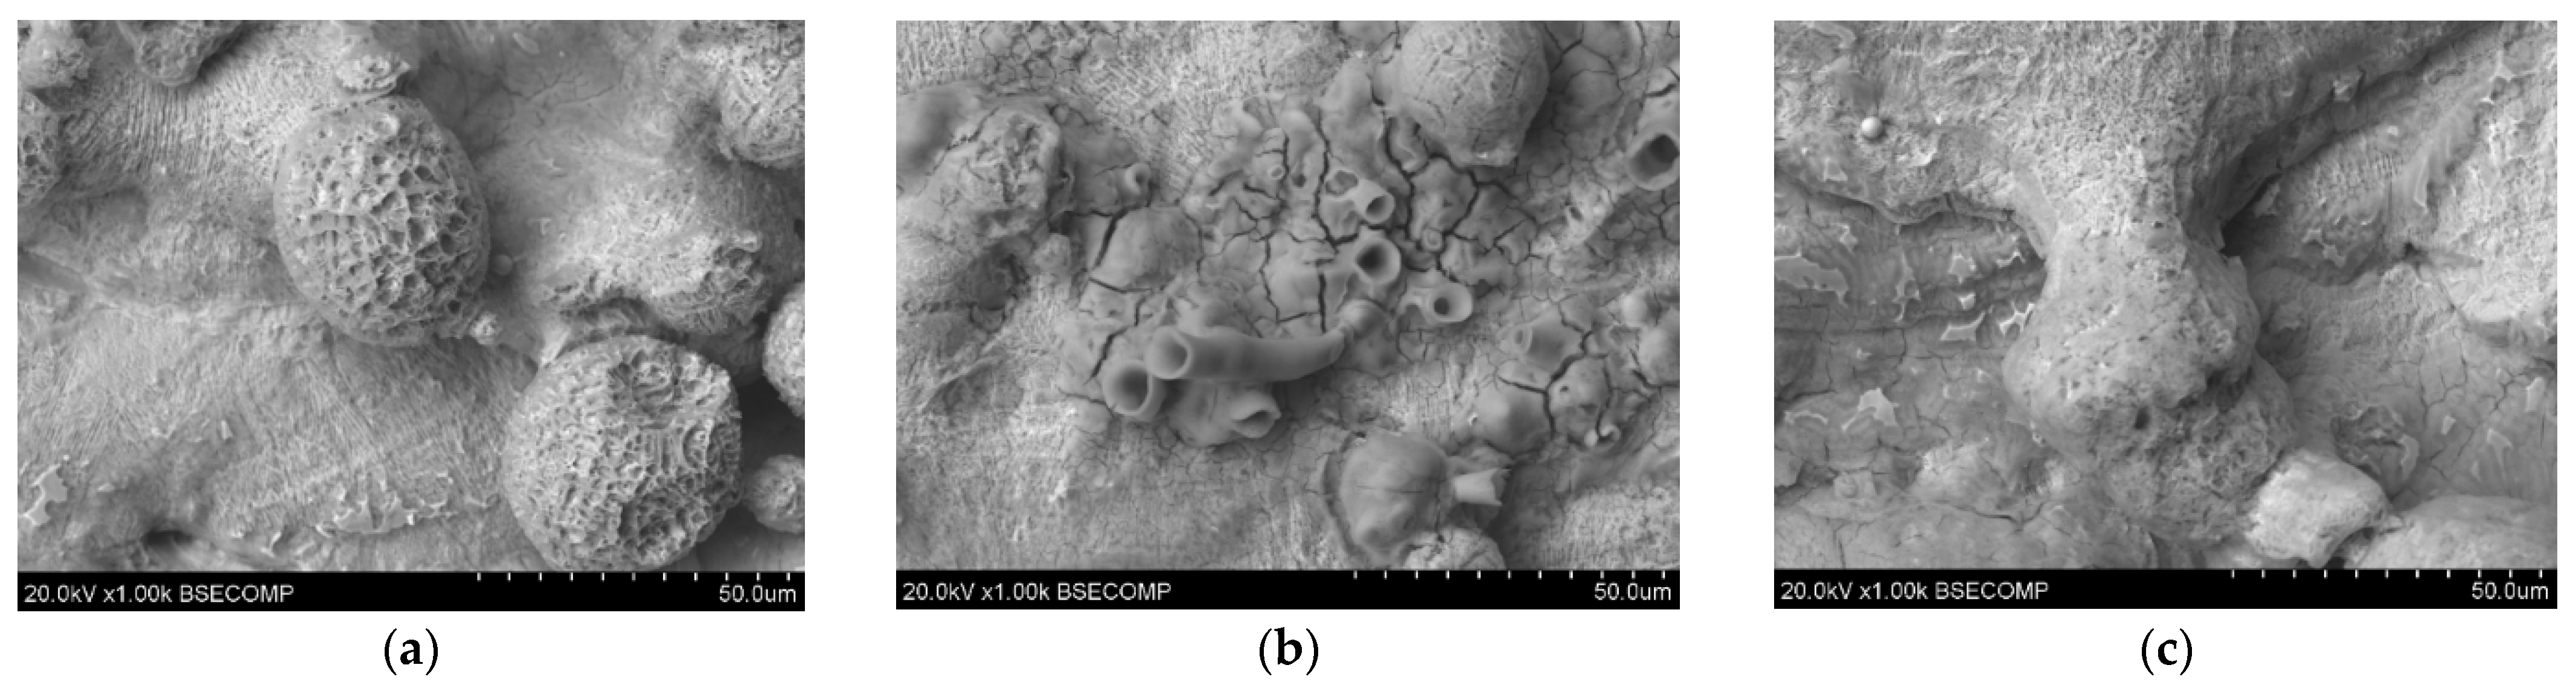
Figure 7.
Microscopic images of unpolished samples printed with laser power: (a) 80 W (1000× magnification), (b) 100 W (1000× magnification), and (c) 120 W (1000× magnification).
Figure 7.
Microscopic images of unpolished samples printed with laser power: (a) 80 W (1000× magnification), (b) 100 W (1000× magnification), and (c) 120 W (1000× magnification).
Figure 8.
Potentiodynamic test graph for polished samples printed with power: 80 W (blue line), 100 W (green line), and 120 W (red line).
Figure 8.
Potentiodynamic test graph for polished samples printed with power: 80 W (blue line), 100 W (green line), and 120 W (red line).
Figure 9.
Photos of polished samples after the potentiodynamic test, printed with a laser power of: (a) 80 W, (b) 100 W, and (c) 120 W.
Figure 9.
Photos of polished samples after the potentiodynamic test, printed with a laser power of: (a) 80 W, (b) 100 W, and (c) 120 W.
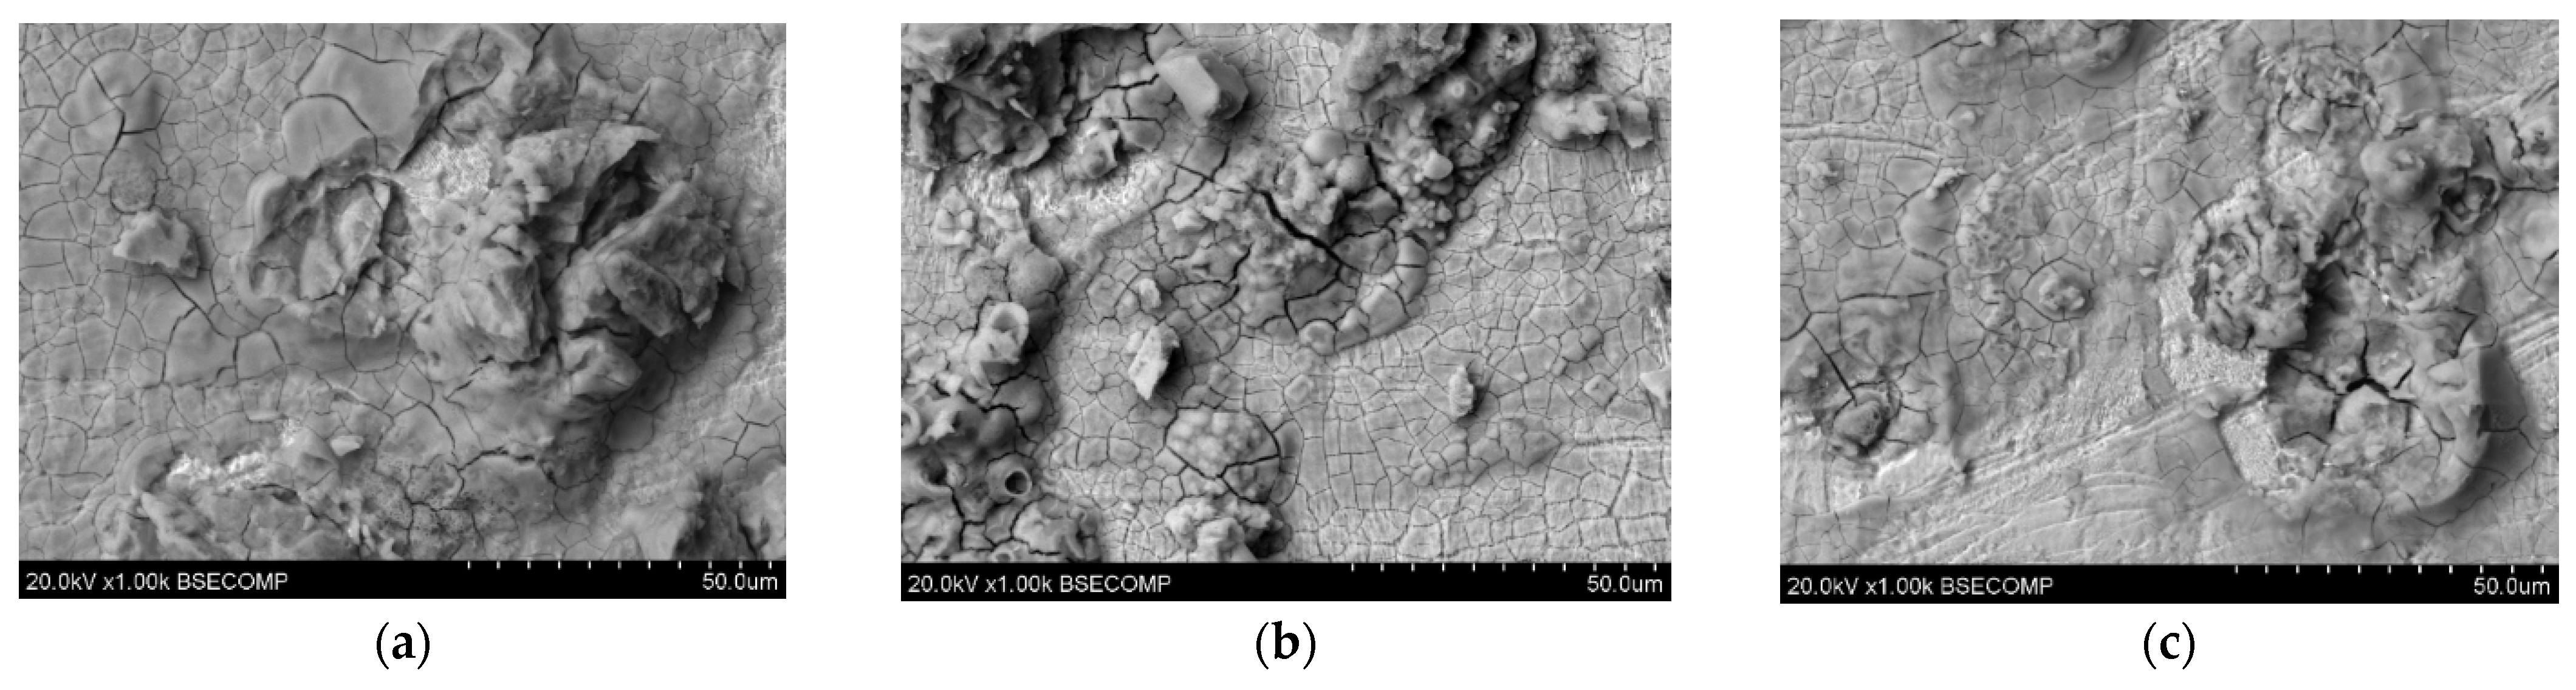
Figure 10.
Microscopic photos of polished samples printed with a laser power of: (a) 80 W (magnification 1000×), (b) 100 W (magnification 1000×), and (c) 120 W (magnification 1000×).
Figure 10.
Microscopic photos of polished samples printed with a laser power of: (a) 80 W (magnification 1000×), (b) 100 W (magnification 1000×), and (c) 120 W (magnification 1000×).
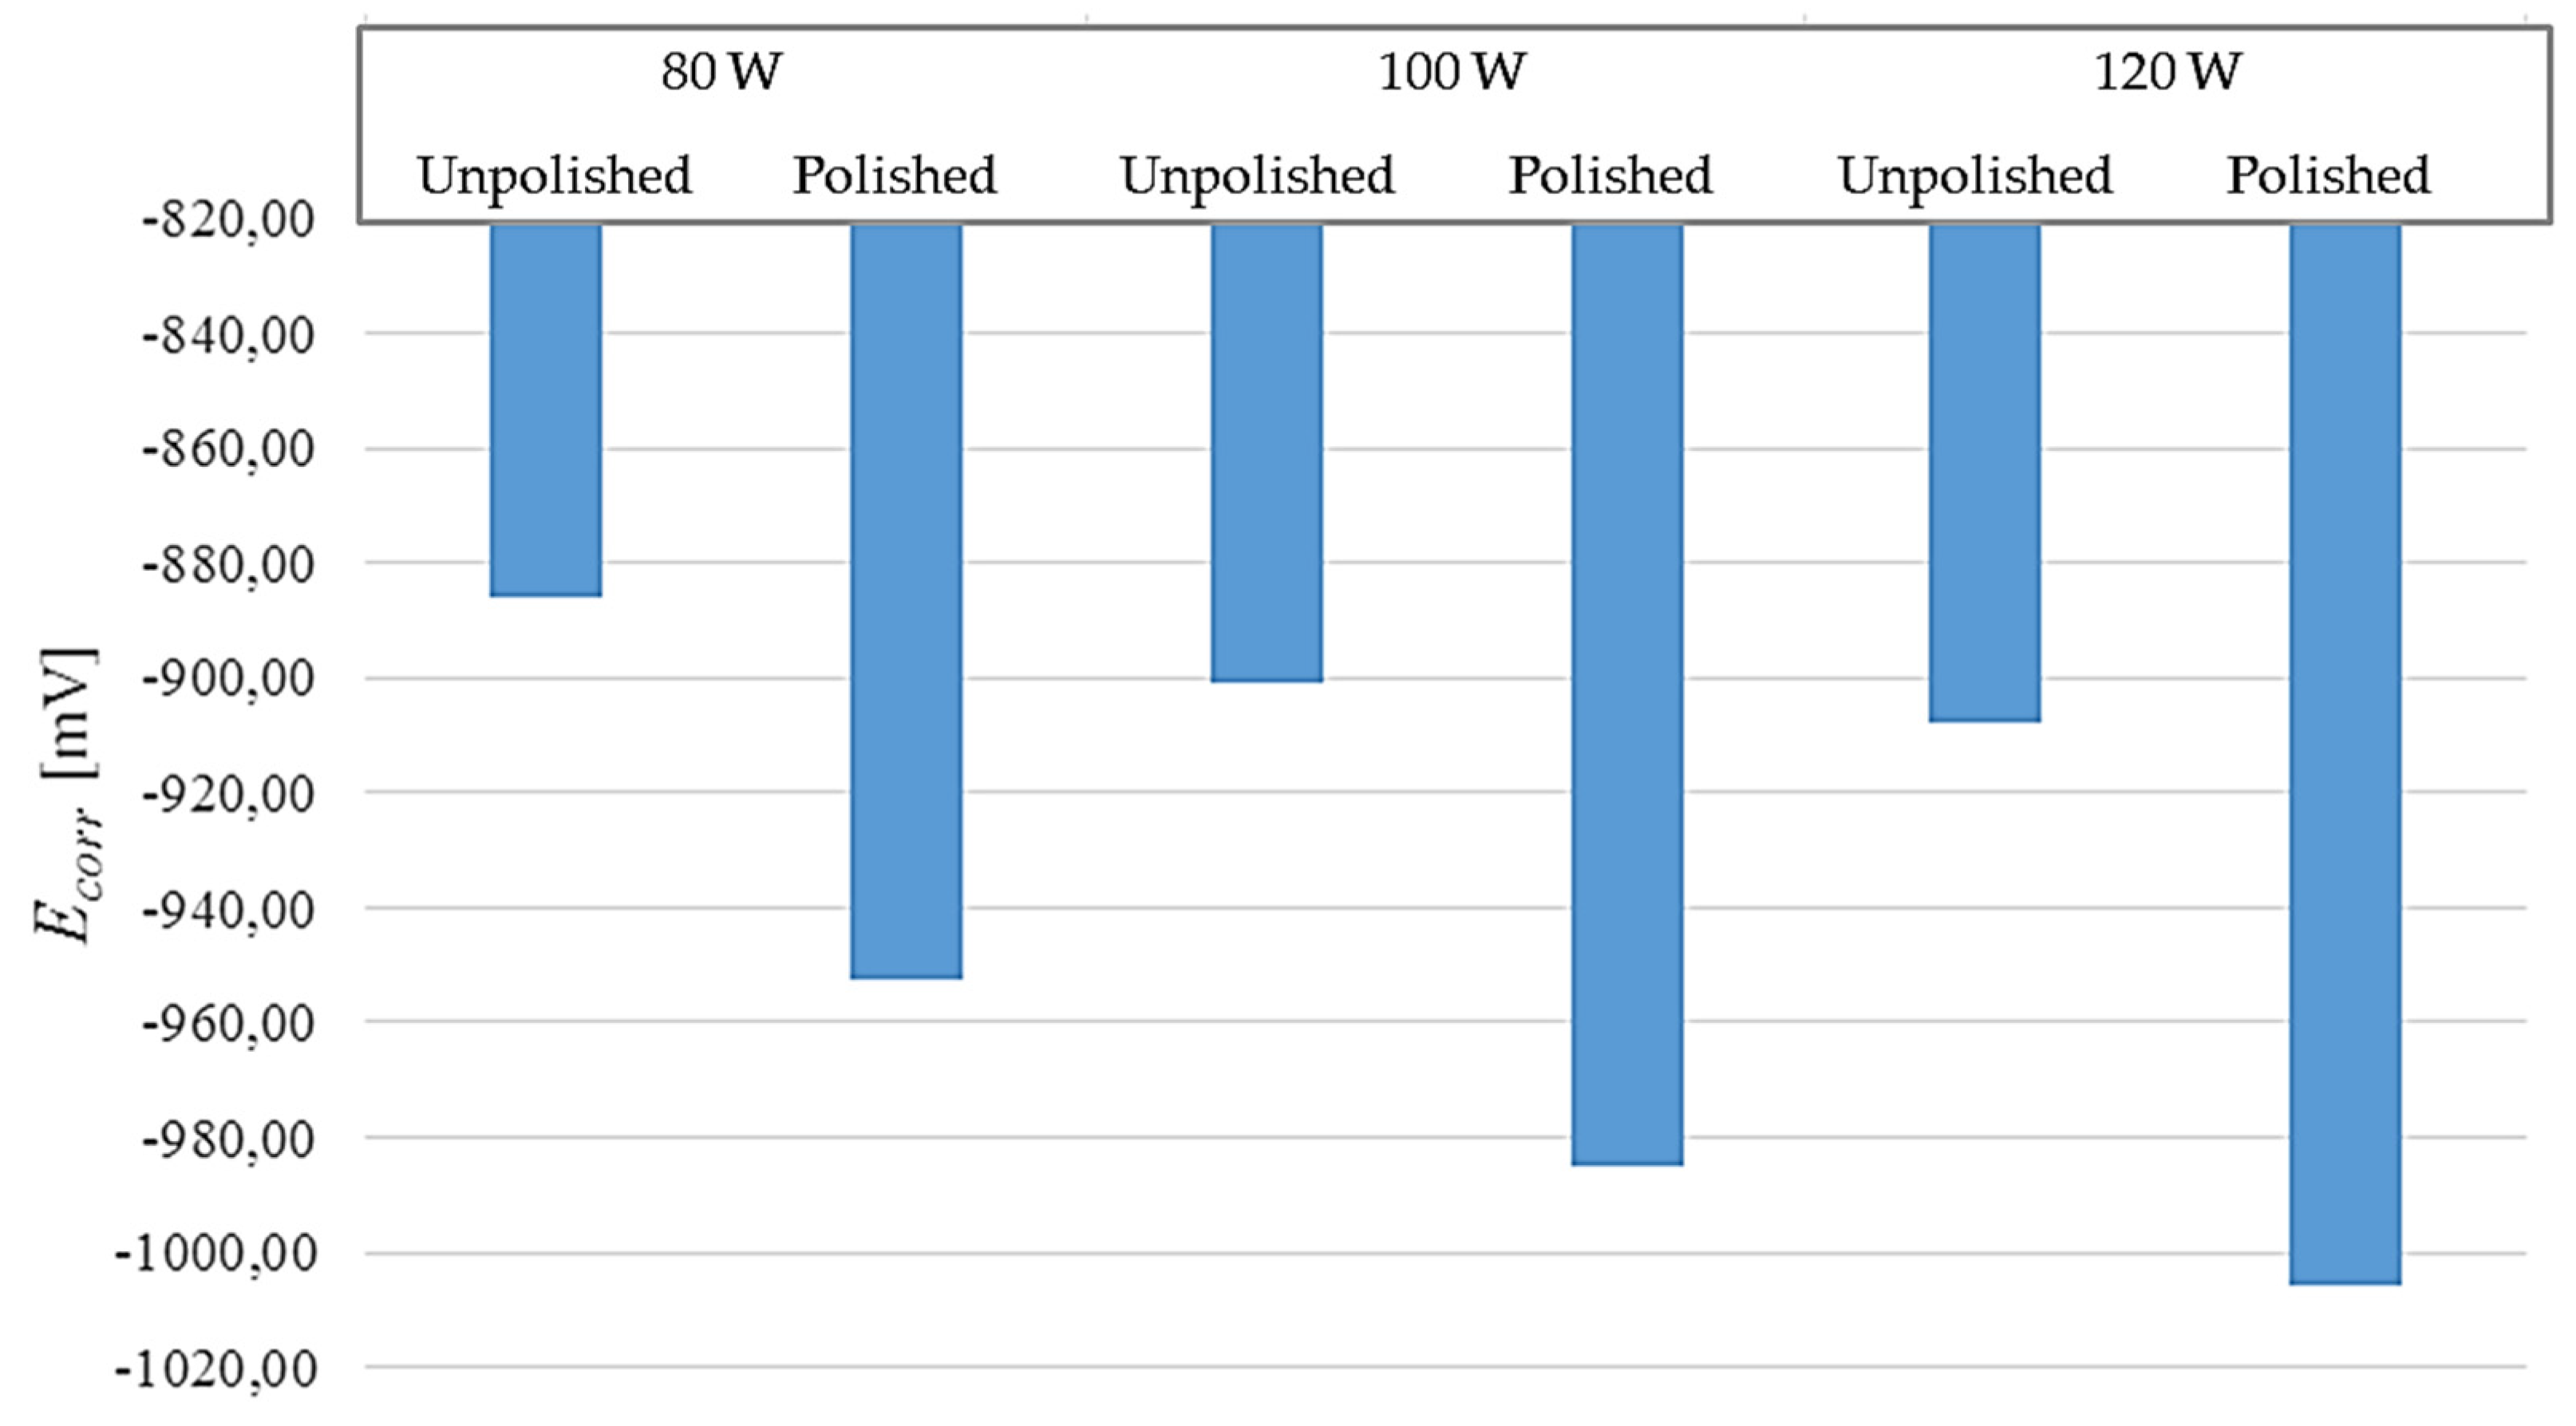
Figure 11.
Comparison of corrosion potentials obtained during the potentiodynamic test in relation to the surface condition.
Figure 11.
Comparison of corrosion potentials obtained during the potentiodynamic test in relation to the surface condition.
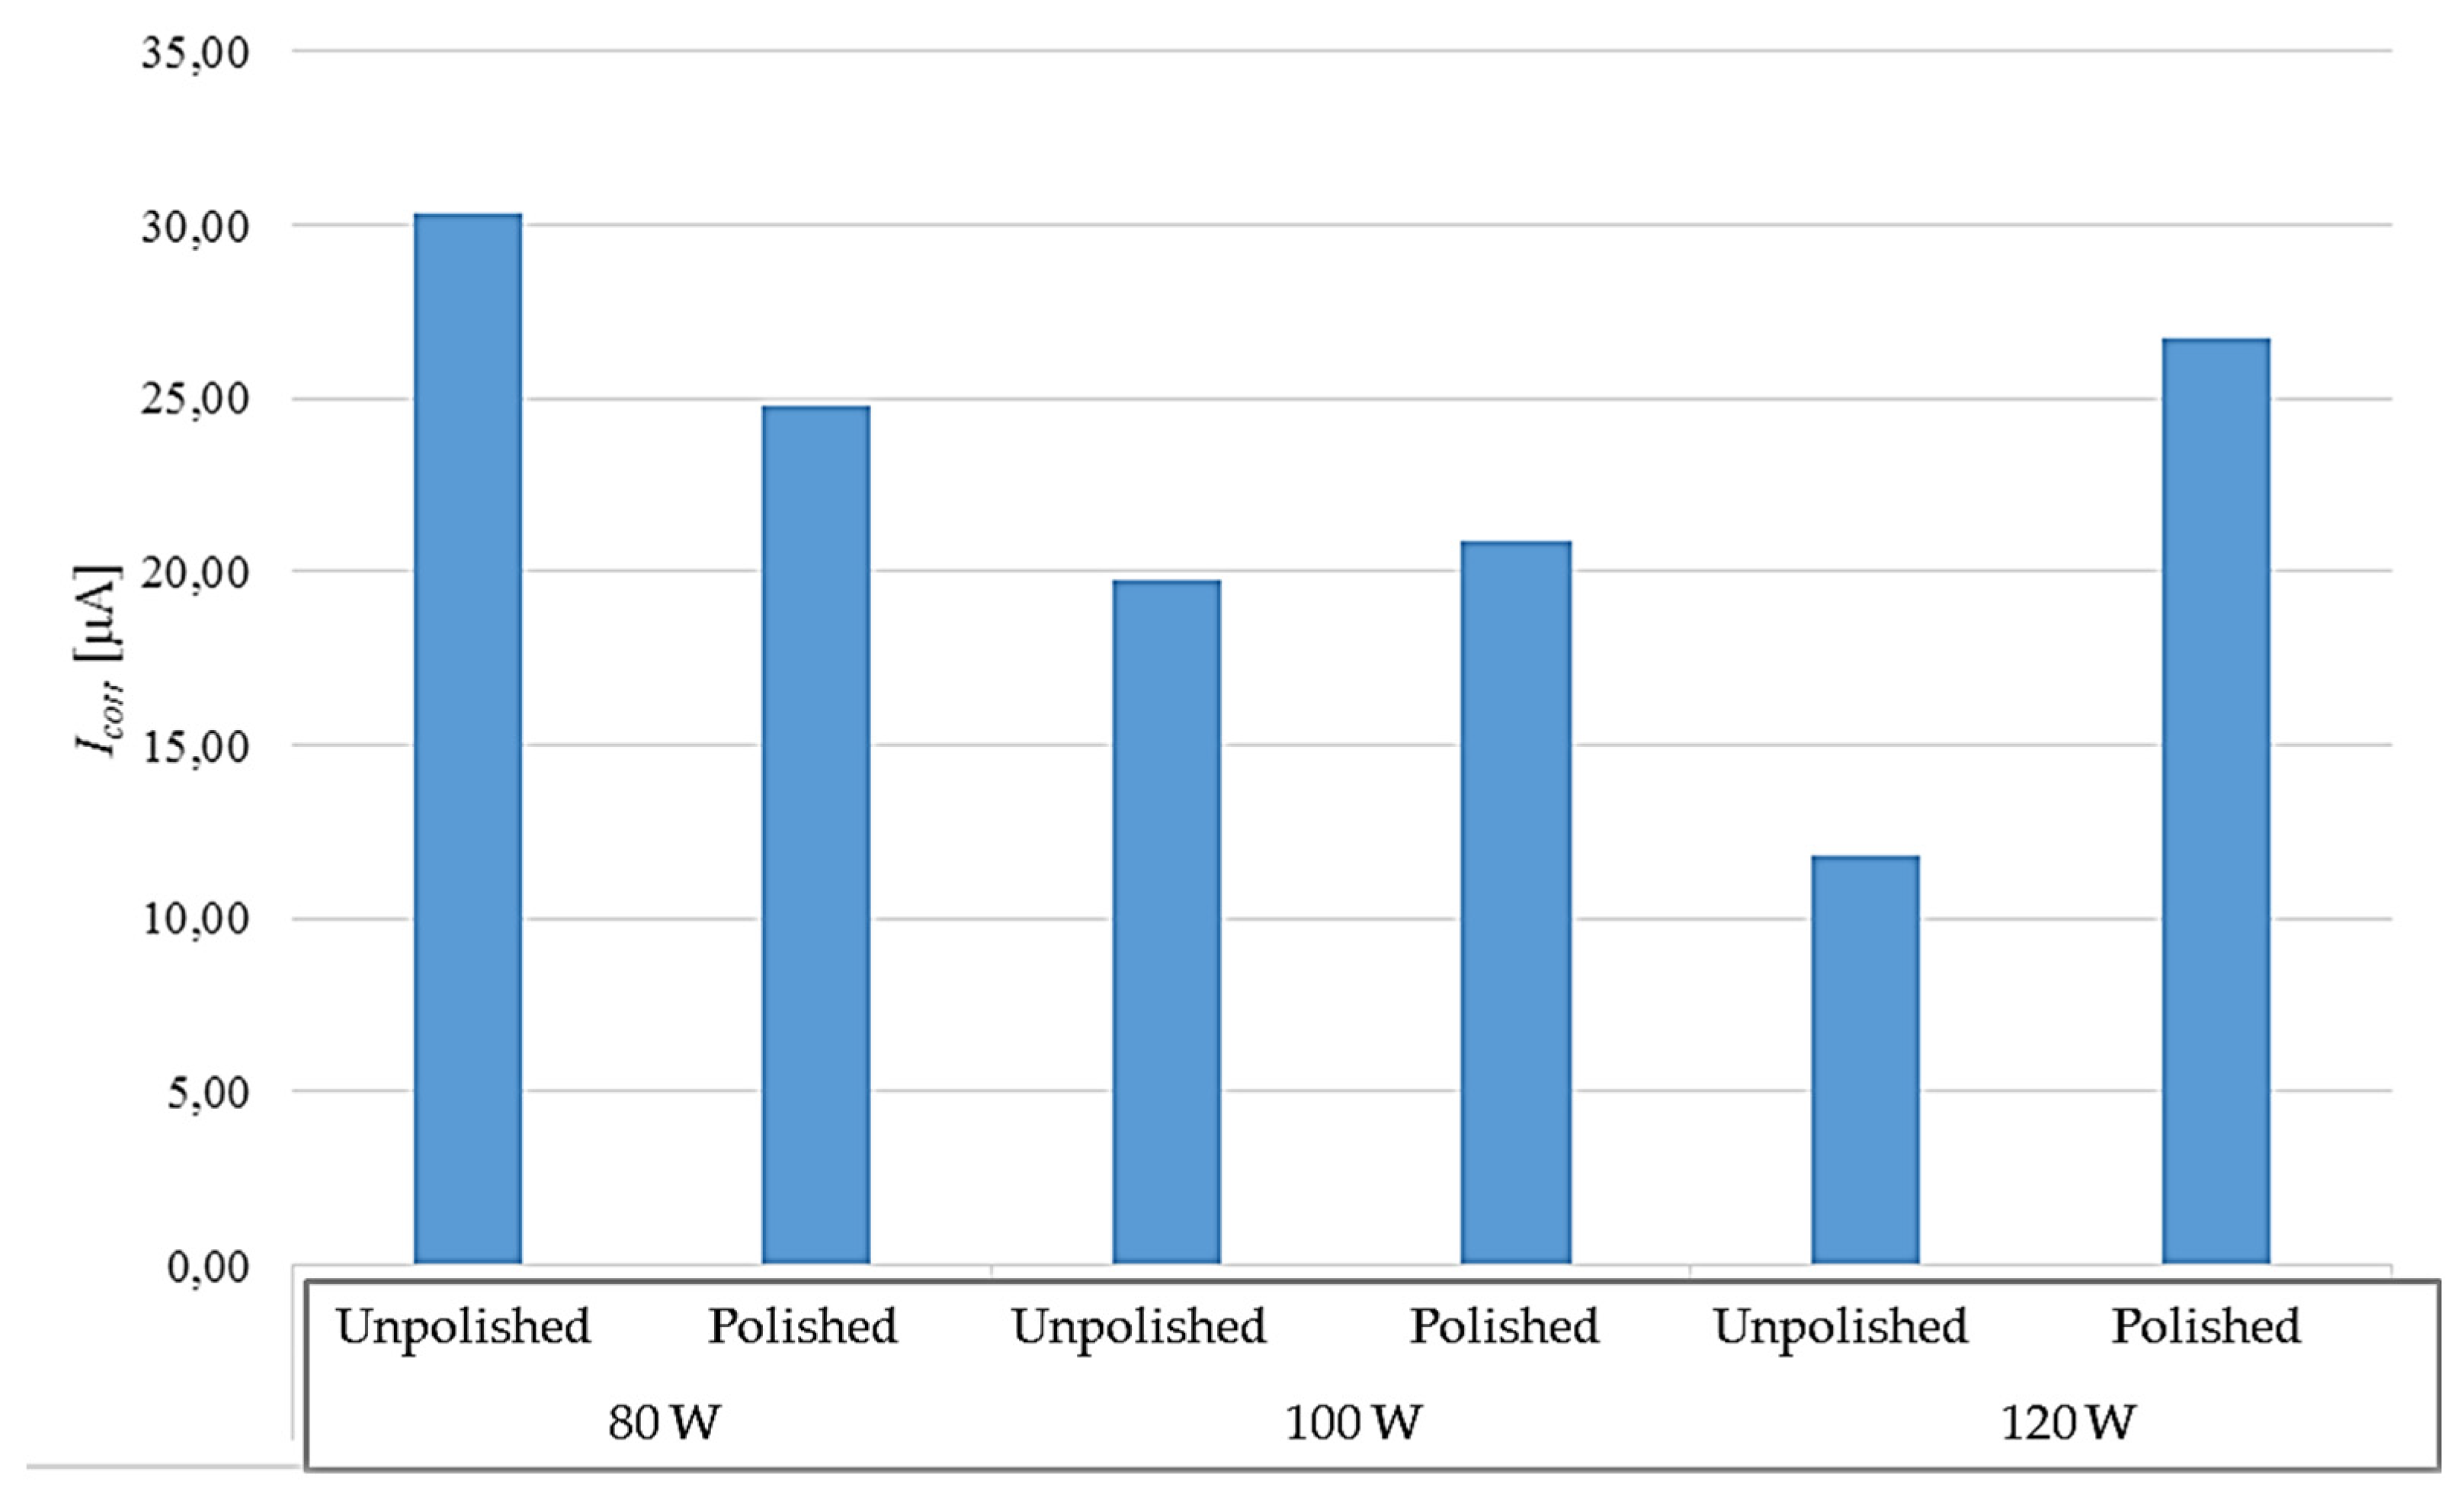
Figure 12.
Comparison of corrosion currents obtained during the potentiodynamic test in relation to the surface condition.
Figure 12.
Comparison of corrosion currents obtained during the potentiodynamic test in relation to the surface condition.
Figure 13.
Weight loss of samples tested at room temperature.
Figure 13.
Weight loss of samples tested at room temperature.
Figure 14.
Photos after testing at room temperature for unpolished samples made with laser power: (a) 80 W, (b) 100 W, and (c) 120 W.
Figure 14.
Photos after testing at room temperature for unpolished samples made with laser power: (a) 80 W, (b) 100 W, and (c) 120 W.
Figure 15.
Photos after testing at room temperature for polished samples made with laser power: (a) 80 W, (b) 100 W, and (c) 120 W.
Figure 15.
Photos after testing at room temperature for polished samples made with laser power: (a) 80 W, (b) 100 W, and (c) 120 W.
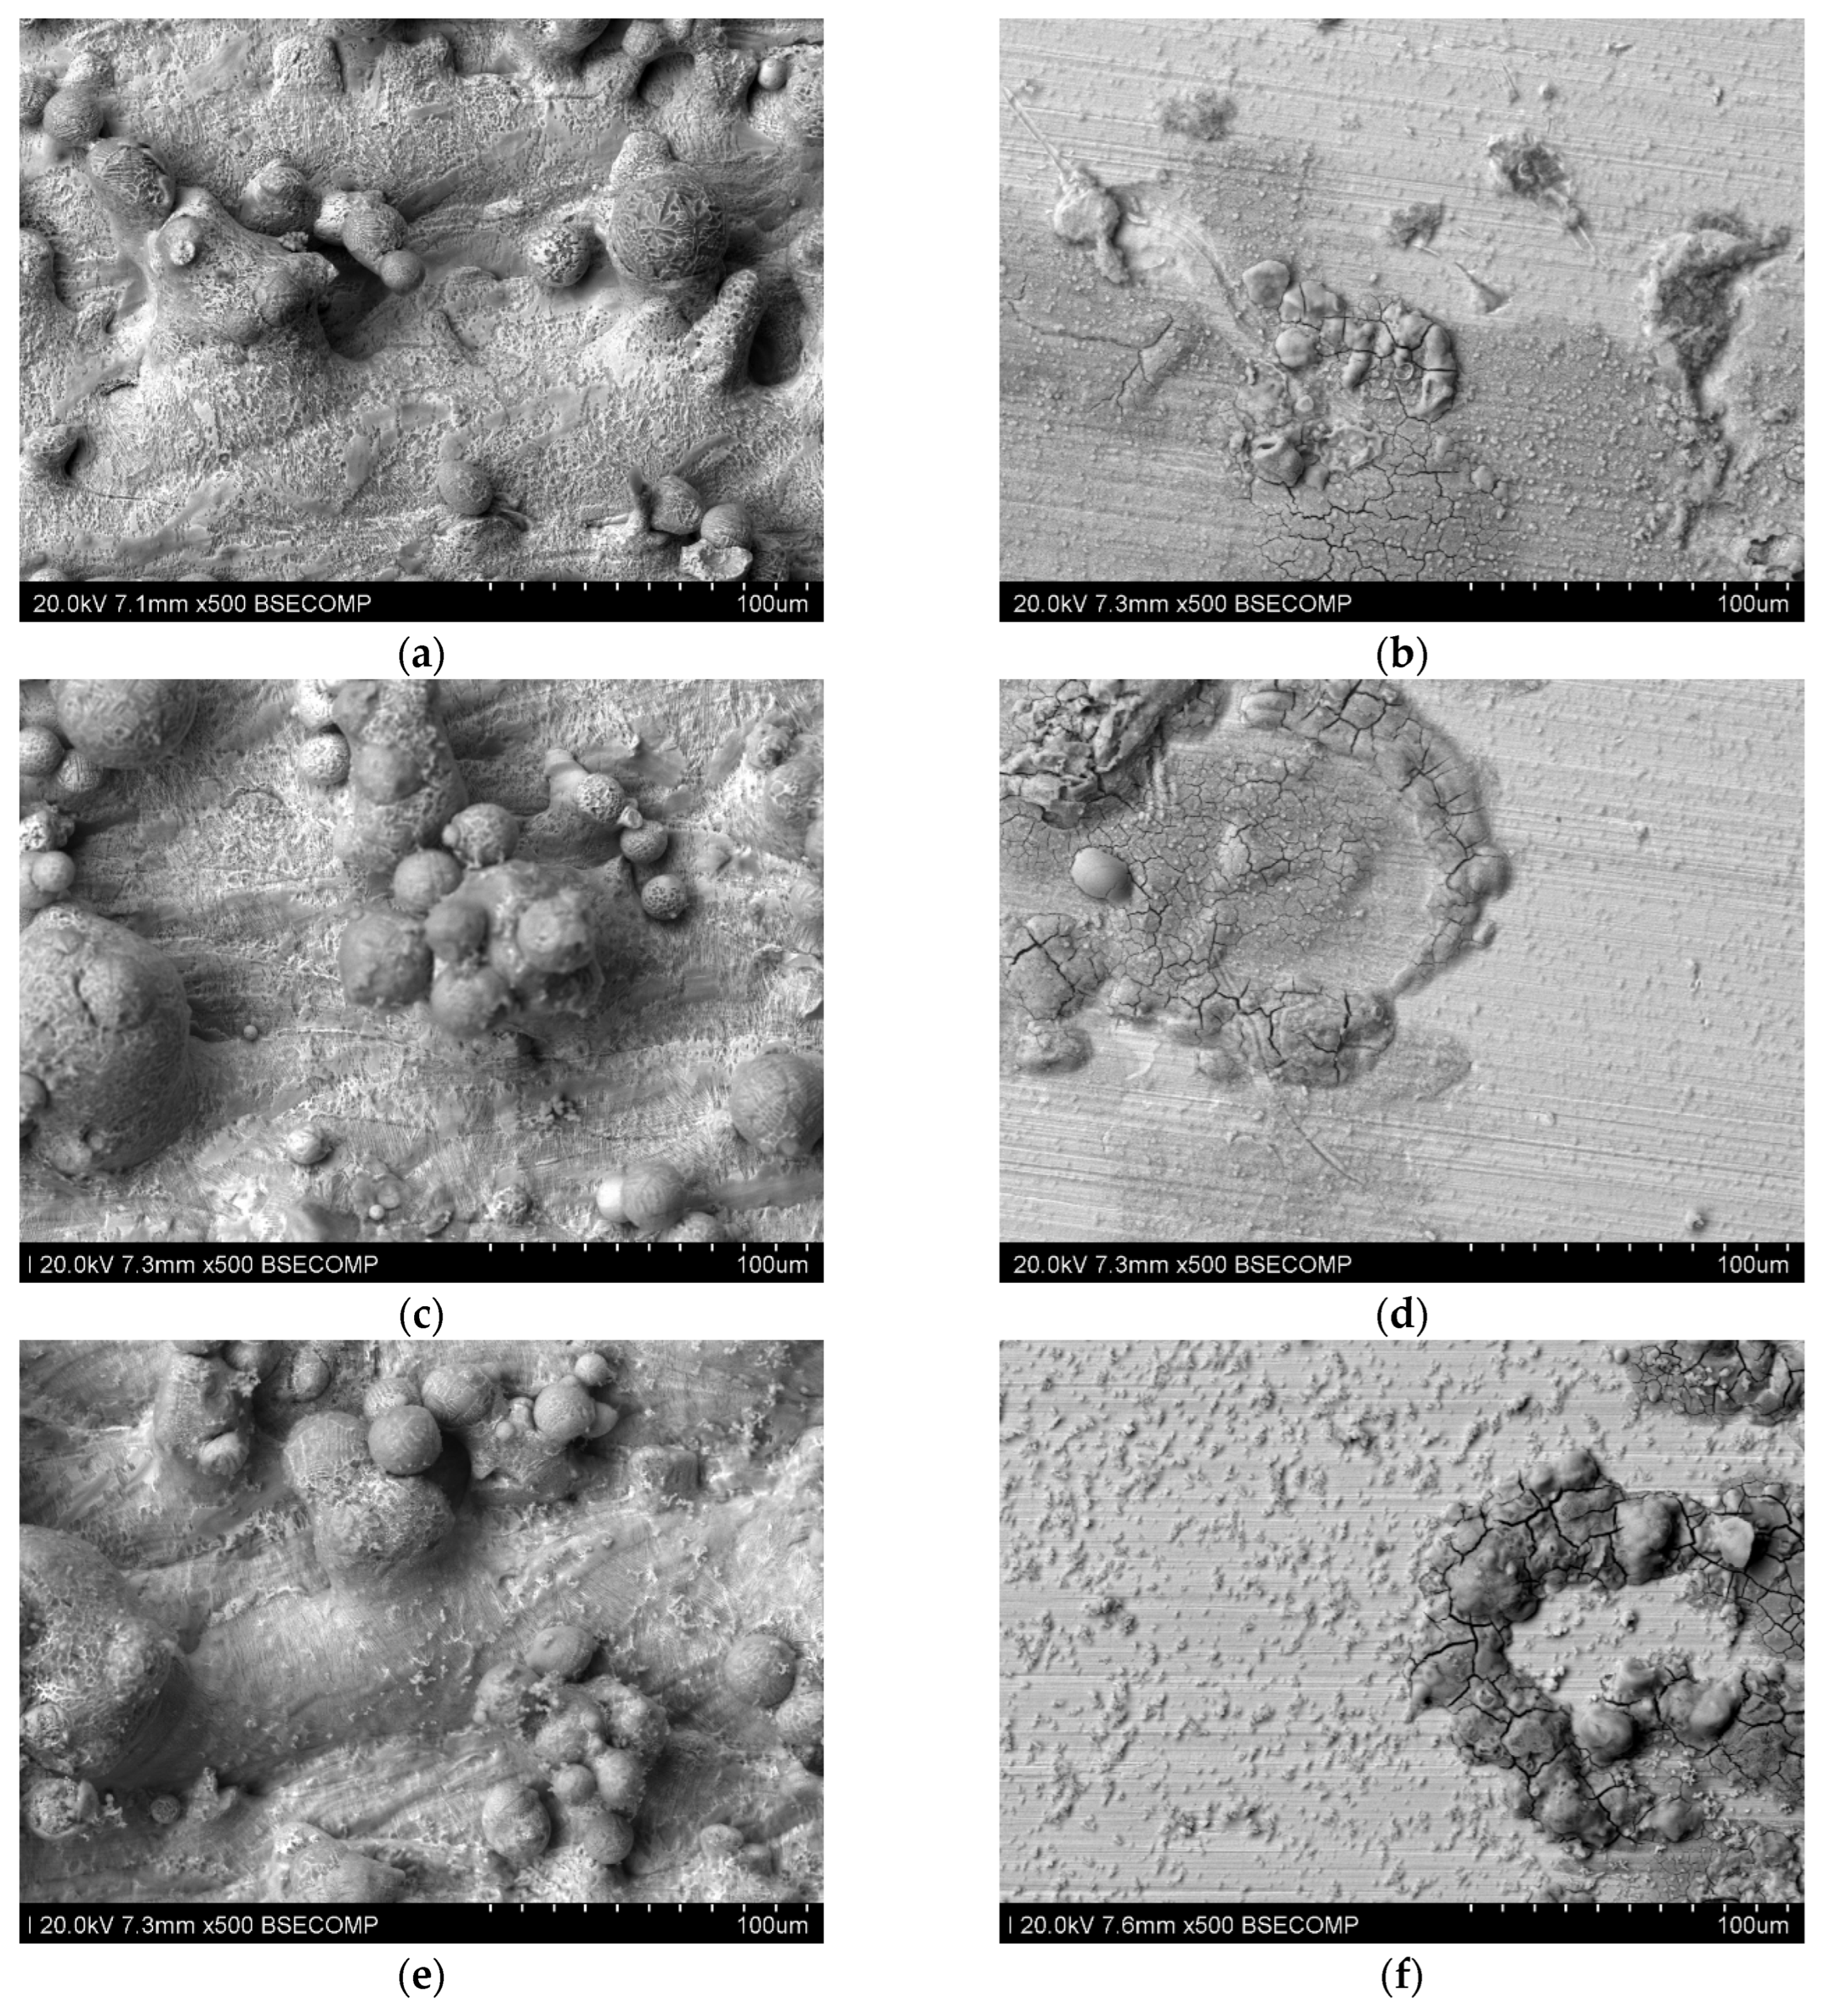
Figure 16.
Microscopic photos of samples tested at room temperature (seven days) printed with different laser power. Unpolished surface: (a) 80 W (500× magnification), (b) 100 W (500× magnification), and (c) 120 W (500× magnification); polished surface: (d) 80 W (500× magnification), (e) 100 W (500× magnification), and (f) 120 W (500× magnification).
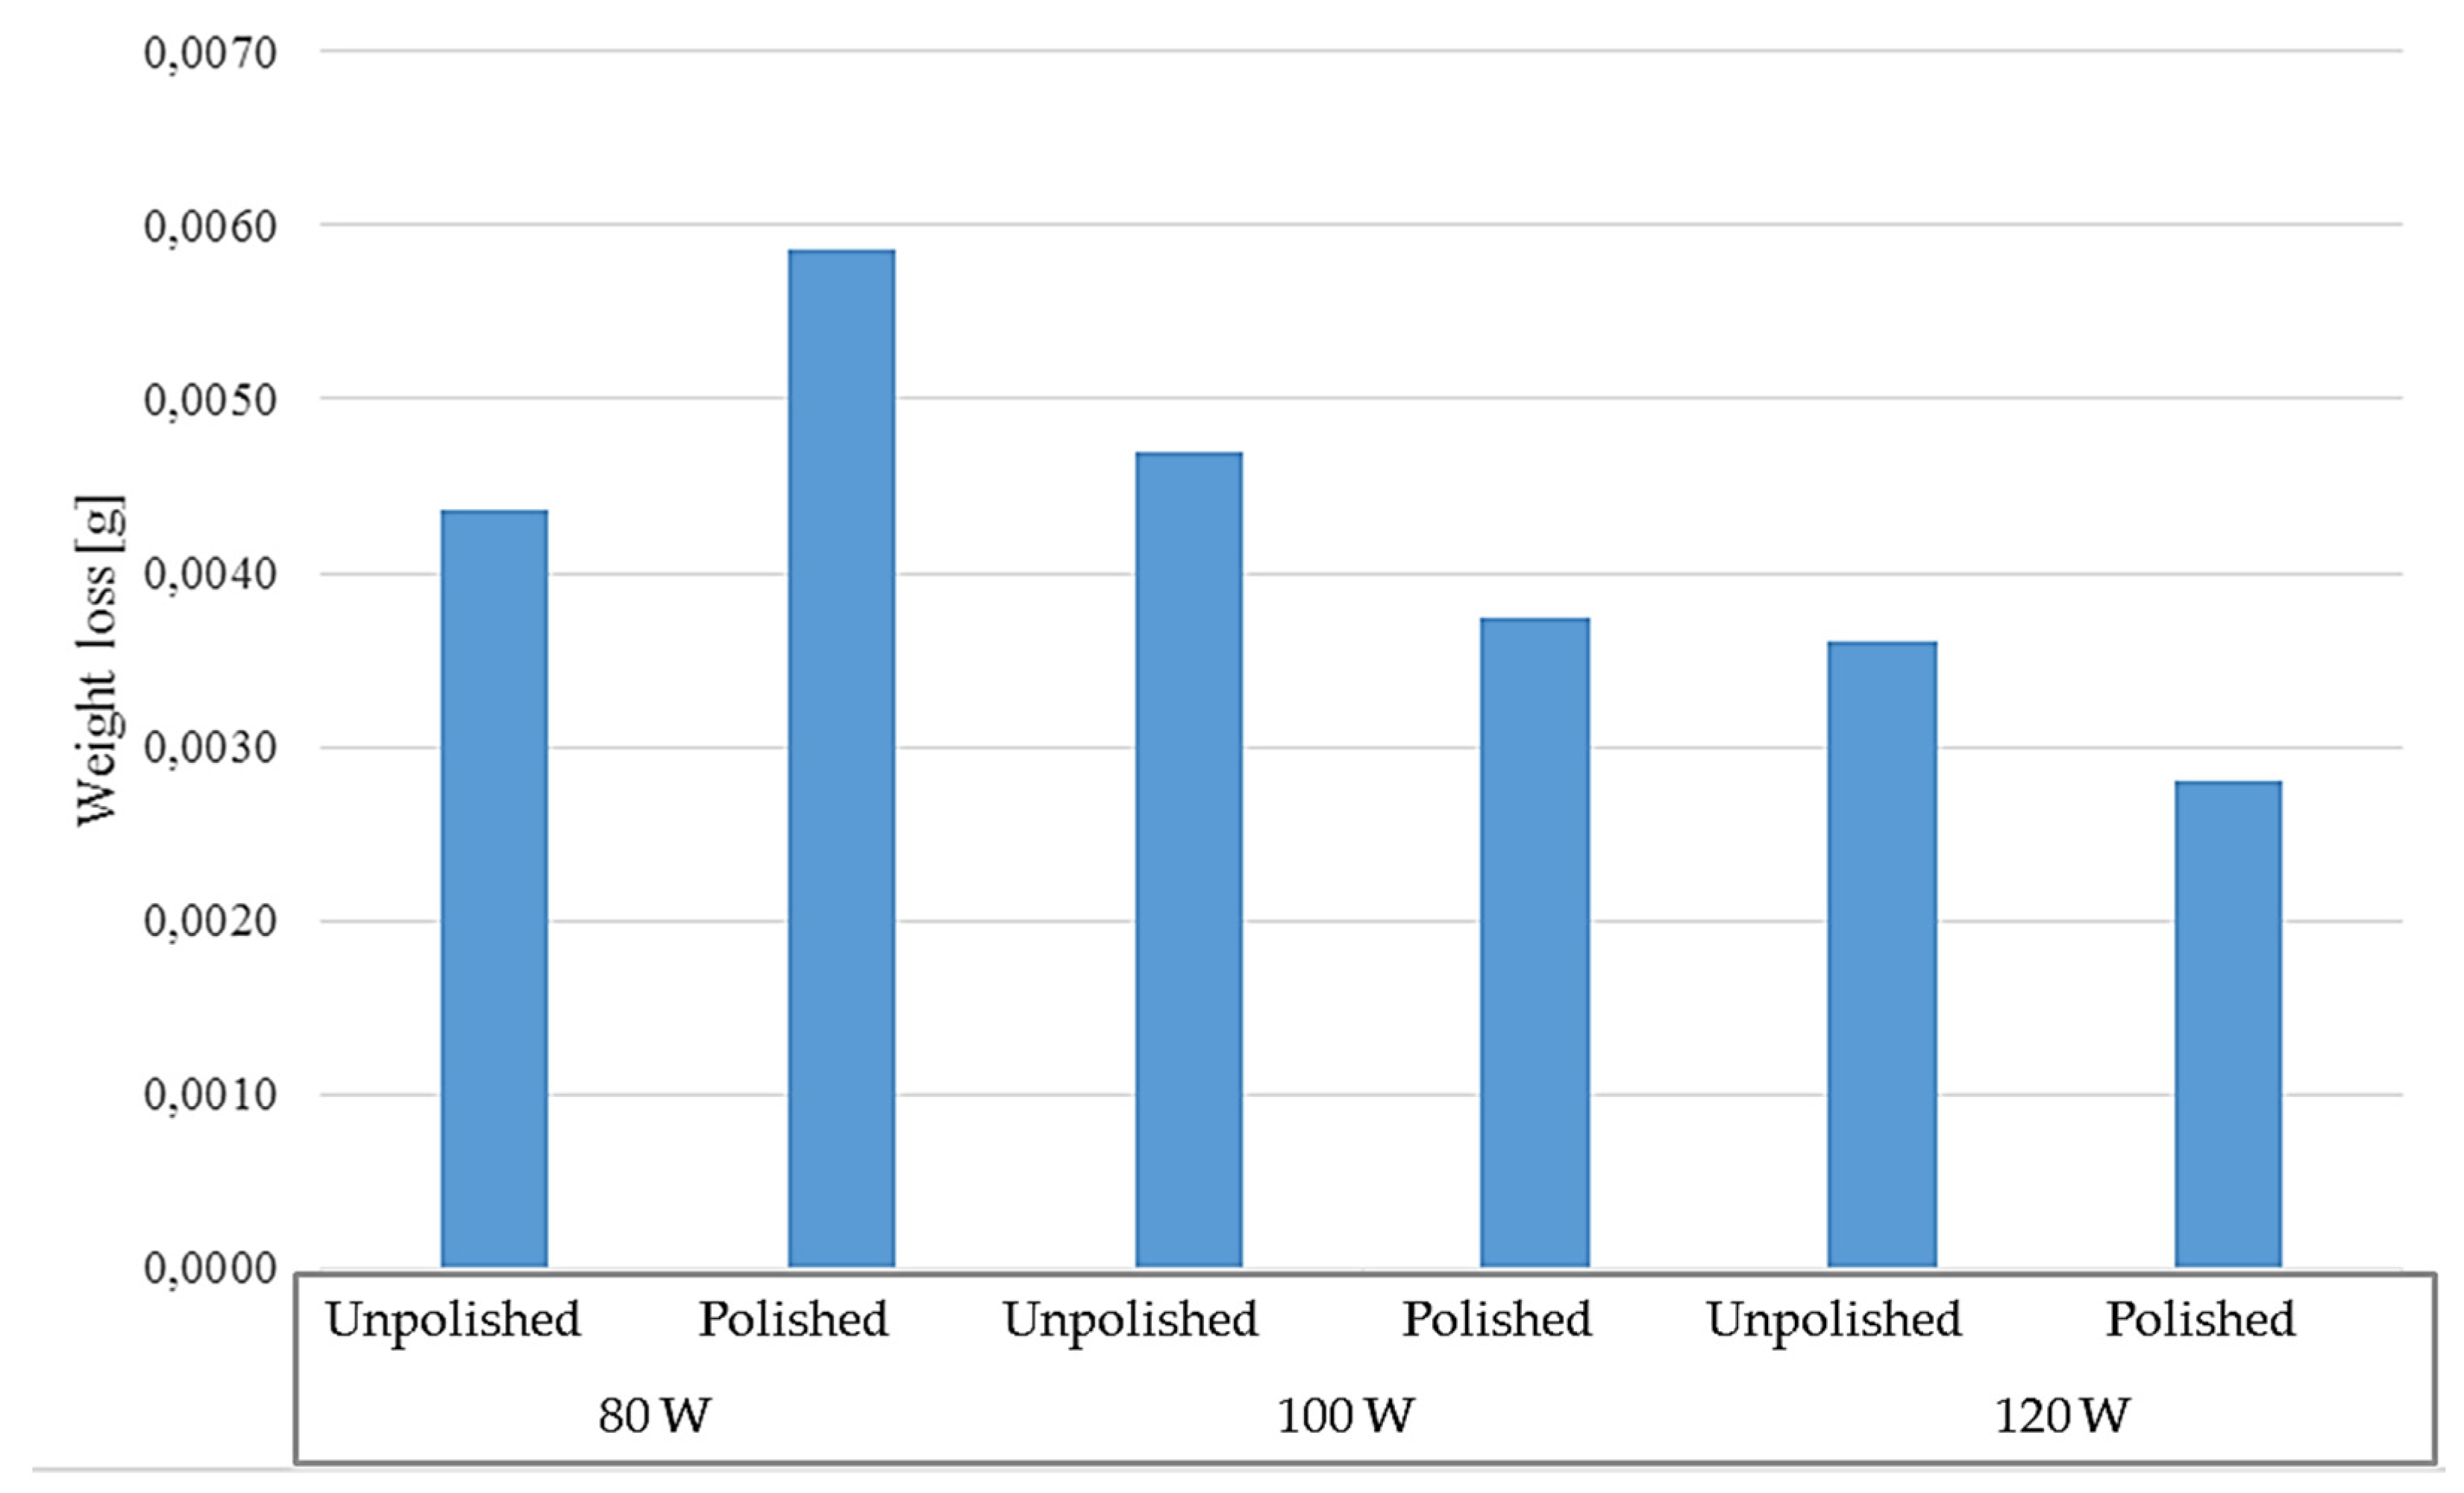
Figure 17.
Weight loss of samples tested at elevated temperature.
Figure 17.
Weight loss of samples tested at elevated temperature.
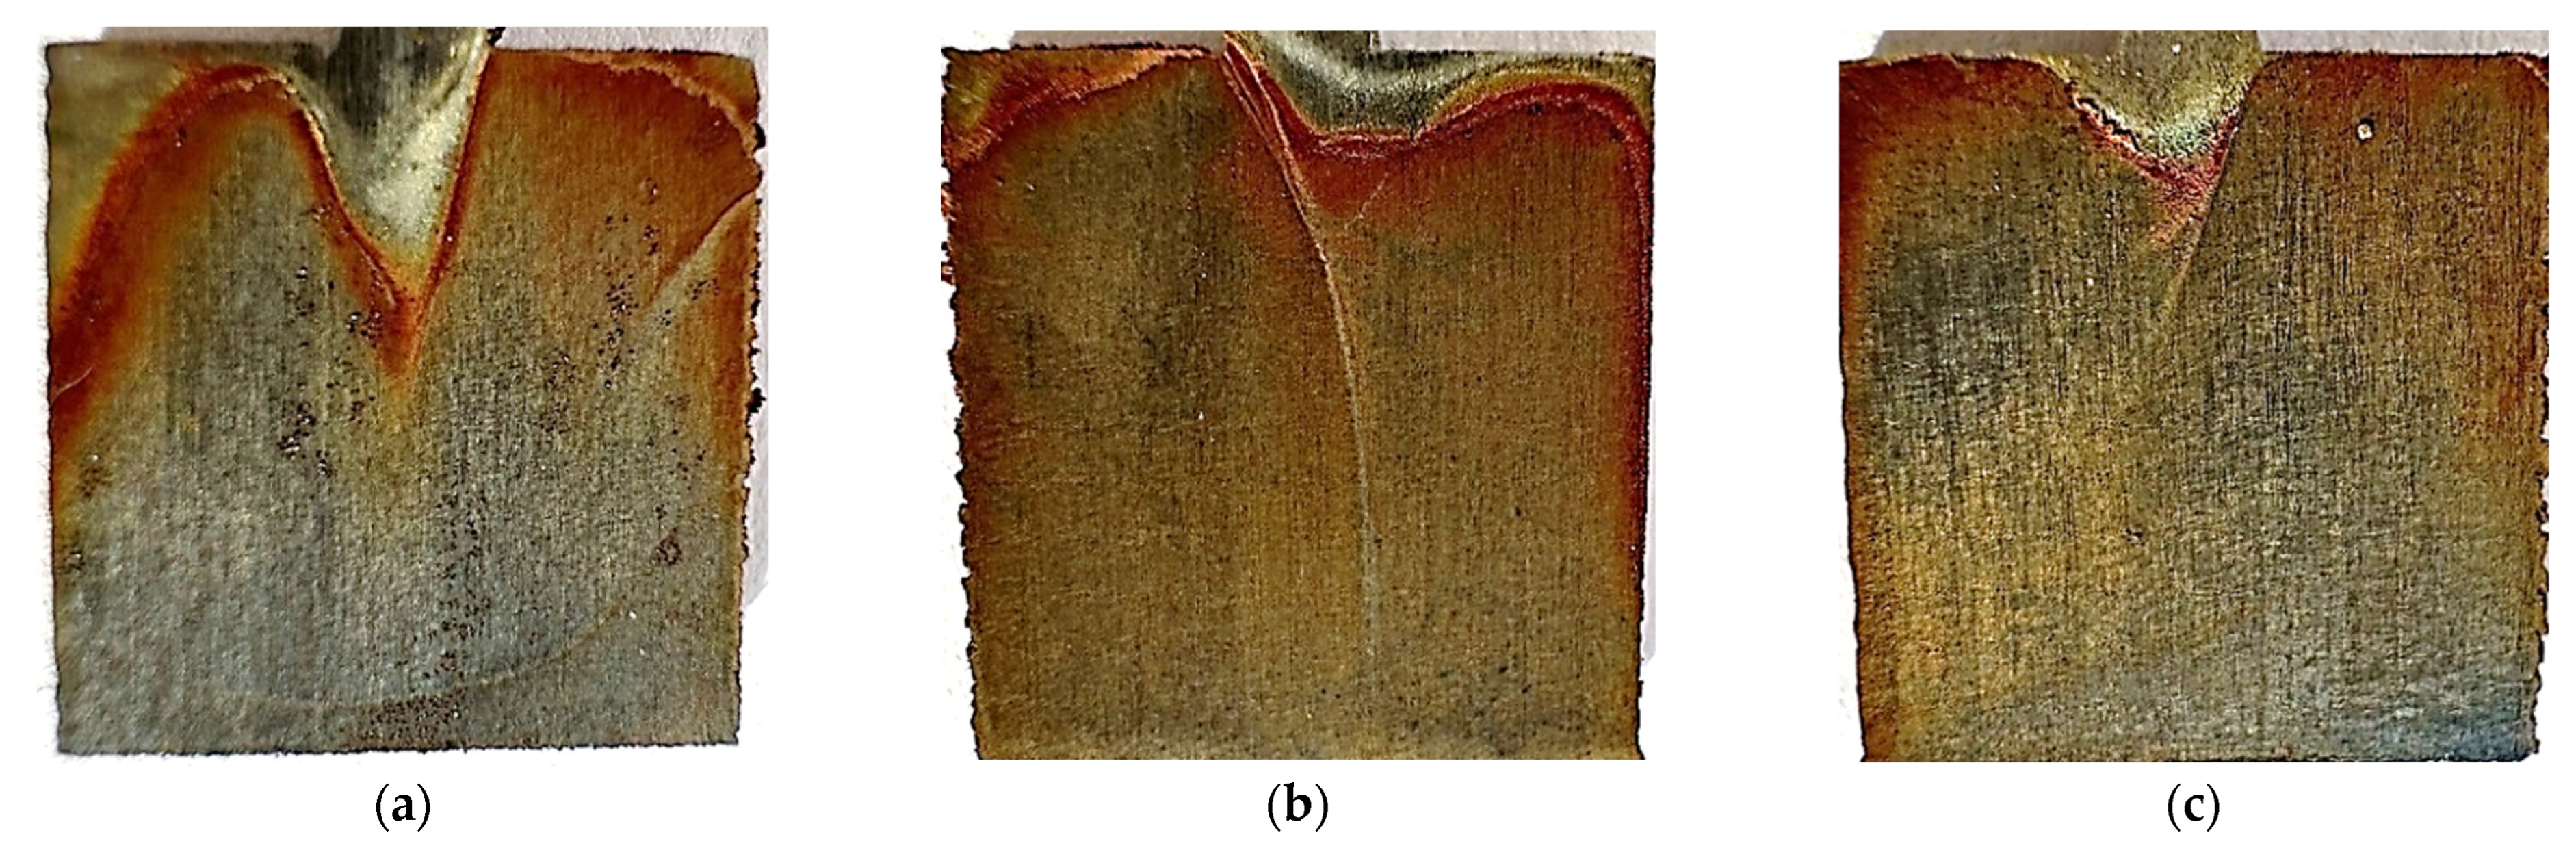
Figure 18.
Photos after the test conducted at 40 °C for unpolished samples made with laser power: (a) 80 W, (b) 100 W, and (c) 120 W.
Figure 18.
Photos after the test conducted at 40 °C for unpolished samples made with laser power: (a) 80 W, (b) 100 W, and (c) 120 W.
Figure 19.
Photos after the test conducted at 40 °C for polished samples made with laser power: (a) 80 W, (b) 100 W, and (c) 120 W.
Figure 19.
Photos after the test conducted at 40 °C for polished samples made with laser power: (a) 80 W, (b) 100 W, and (c) 120 W.
Figure 20.
Microscopic photos of samples tested at 40 °C (seven days) printed with different laser power. Unpolished surface: (a) 80 W (500× magnification), (b) 100 W (500× magnification), and (c) 120 W (500× magnification); polished surface: (d) 80 W (500× magnification), (e) 100 W (500× magnification), and (f) 120 W (500× magnification).
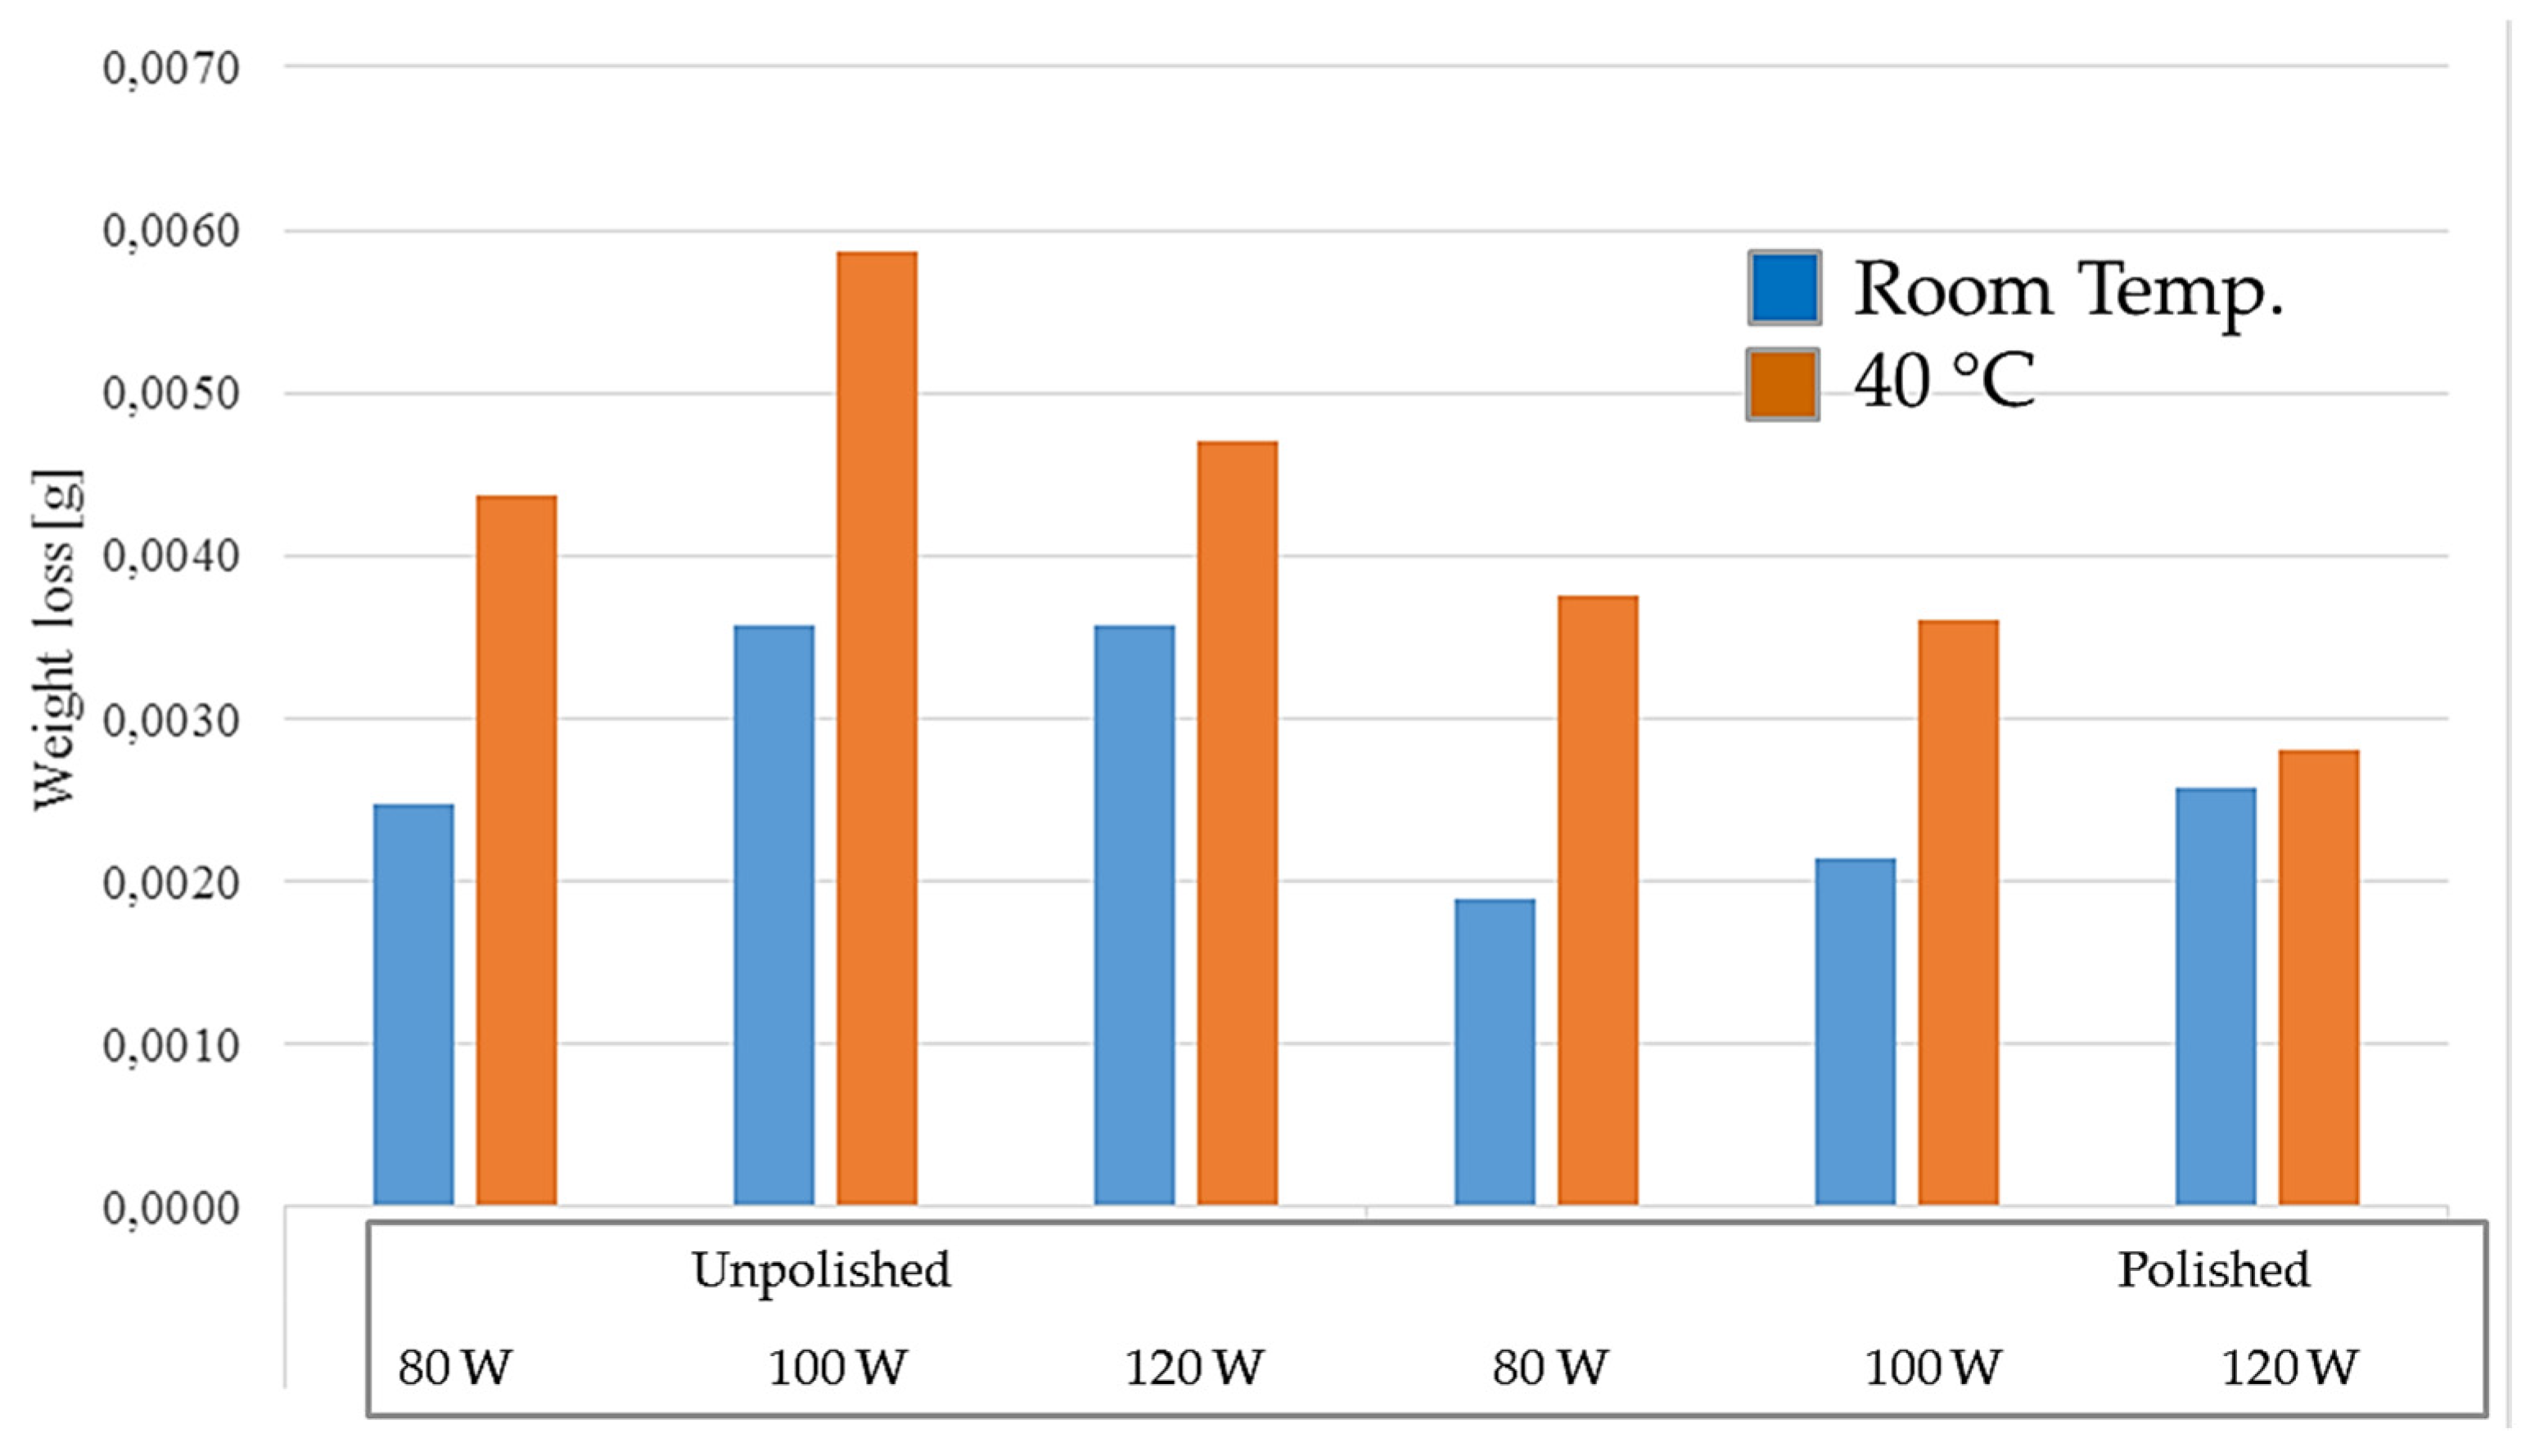
Figure 21.
Long-term test results comparison graph for room temperature and 40 °C.
Figure 21.
Long-term test results comparison graph for room temperature and 40 °C.
Table 1.
Chemical composition of maraging M300 steel (wt.%), mean value of three measurements.
Table 1.
Chemical composition of maraging M300 steel (wt.%), mean value of three measurements.
| Ni | Co | Mo | Ti | Mn | Si | C | P | S | Fe |
|---|
| 18.50 | 9.25 | 4.75 | 0.90 | 0.10 | 0.15 | 0.015 | 0.005 | 0.005 | balance |
Table 2.
Selected parameters of the 3D-printing process.
Table 2.
Selected parameters of the 3D-printing process.
| Parameter | Value |
|---|
| Laser powder | 80 W |
| 100 W |
| 120 W |
| Laser spot size | 100 µm |
| Laser speed | 600 mm/s |
| Scanning path spacing | 100 µm |
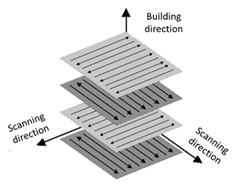
| Laser beam scanning strategy | Changing the scanning angle of each of the individual powder layers by 67°
![Materials 17 06047 i001]() |
| Layer thickness | 30 µm |
Table 3.
Composition of the starting material in the tested micro-area.
Table 3.
Composition of the starting material in the tested micro-area.
| Element | C-K | Si-K | Ti-K | Fe-K | Ni-K | Mo-L |
|---|
| Atomic % | 2.25 | 0.08 | 1.42 | 79.99 | 14.68 | 1.57 |
Table 4.
Electrochemical parameters obtained during potentiostatic test for unpolished samples.
Table 4.
Electrochemical parameters obtained during potentiostatic test for unpolished samples.
| Laser Power | Ecorr, mV | Icorr, μA |
|---|
| 80 W | −885.82 | 30.35 |
| 100 W | −901.16 | 19.74 |
| 120 W | −907.97 | 11.86 |
Table 5.
Chemical composition of micro-area corrosion samples for samples printed with different laser powers.
Table 5.
Chemical composition of micro-area corrosion samples for samples printed with different laser powers.
| | Atomic % |
|---|
| Laser Power | C-K | O-K | Si-K | Al-K | Ca-K | Ti-K | Fe-K | Co-K | Ni-K | Mo-L |
|---|
| 80 W | 4.32 | 37.56 | 0.07 | 0.96 | 0.07 | 1.06 | 28.40 | 4.67 | 7.00 | 1.88 |
| 100 W | 3.00 | 48.25 | 0.10 | 0.74 | 0.02 | - | 38.99 | 3.45 | 5.38 | 0.08 |
| 120 W | 4.22 | 43.65 | 0.01 | 0.19 | 0.06 | 0.11 | 37.87 | 1.73 | 3.57 | 0.23 |
Table 6.
Electrochemical parameters obtained during the potentiodynamic test for polished samples.
Table 6.
Electrochemical parameters obtained during the potentiodynamic test for polished samples.
| Laser Power | Ecorr, mV | Icorr, μA |
|---|
| 80 W | −952.55 | 24.81 |
| 100 W | −985.10 | 20.89 |
| 120 W | −1005.96 | 26.72 |
Table 7.
Chemical composition of micro-area corrosion samples for samples printed with different laser powers.
Table 7.
Chemical composition of micro-area corrosion samples for samples printed with different laser powers.
| | Atomic % |
|---|
| Laser Power | C-K | O-K | Si-K | Al-K | Ca-K | Ti-K | Fe-K | Co-K | Ni-K | Mo-L |
|---|
| 80 W | 7.16 | 43.56 | 0.28 | 0.92 | 0.07 | 0.48 | 36.25 | 3.79 | 6.03 | 1.53 |
| 100 W | 5.35 | 45.25 | 0.60 | 0.76 | - | 0.08 | 39.60 | 2.00 | 5.27 | 1.09 |
| 120 W | 15.98 | 33.76 | 0.11 | 0.17 | - | 0.04 | 43.85 | 1.67 | 4.17 | 0.16 |
Table 8.
Comparison of parameters obtained in the potentiodynamic test for both types of samples.
Table 8.
Comparison of parameters obtained in the potentiodynamic test for both types of samples.
| | Laser Power |
|---|
| Parameter | 80 W | 100 W | 120 W |
|---|
| Unpolished | Polished | Unpolished | Polished | Unpolished | Polished |
|---|
| Ecorr, mV | −885.82 | −952.55 | −901.16 | −985.10 | −907.97 | −1005.96 |
| Icorr, μA | 30.35 | 24.81 | 19.74 | 20.89 | 11.86 | 26.72 |
Table 9.
Weight loss of samples tested at room temperature.
Table 9.
Weight loss of samples tested at room temperature.
| Weight Loss After 7 Days |
|---|
| | Unpolished | Polished |
|---|
| Laser power | 80 W | 100 W | 120 W | 80 W | 100 W | 120 W |
| Weight loss [g] | 0.0025 | 0.0036 | 0.0036 | 0.0019 | 0.0021 | 0.0026 |
Table 10.
Corrosion rate of samples at room temperature.
Table 10.
Corrosion rate of samples at room temperature.
| Corrosion Rate |
|---|
| | Unpolished | Polished |
|---|
| Laser power | 80 W | 100 W | 120 W | 80 W | 100 W | 120 W |
| Corrosion rate [(g/cm2)/year] | 0.0459 | 0.0664 | 0.0664 | 0.0354 | 0.0400 | 0.0478 |
Table 11.
Chemical composition of samples subjected to long-term corrosion at room temperature in the tested micro-area.
Table 11.
Chemical composition of samples subjected to long-term corrosion at room temperature in the tested micro-area.
| | | Atomic % |
|---|
| | Laser Power | C-K | O-K | Si-K | Al-K | Ca-K | Ti-K | Fe-K | Co-K | Ni-K | Mo-L | S-K |
|---|
| Unpolished | 80 W | 4.84 | 45.91 | 0.13 | 0.55 | 0.05 | 0.48 | 50.15 | 2.00 | 3.63 | 1.28 | 0.9 |
| 100 W | 3.81 | 45.95 | 0.20 | 0.03 | - | 0.69 | 40.11 | 2.16 | 4.57 | 2.13 | - |
| 120 W | 5.98 | 38.76 | 0.13 | 0.14 | - | 0.90 | 43.85 | 0.77 | 2.29 | 3.08 | - |
| Polished | 80 W | 3.75 | 34.14 | 0.16 | 0.24 | 0.02 | 0.88 | 44.45 | 5.57 | 9.73 | 1.12 | 0.18 |
| 100 W | 4.83 | 46.26 | 0.06 | 0.34 | 0.03 | 0.69 | 39.54 | 2.45 | 4.34 | 1.47 | - |
| 120 W | 3.73 | 40.36 | 0.04 | 0.36 | - | 0.71 | 46.50 | 2.49 | 4.34 | 1.47 | - |
Table 12.
Weight loss of samples tested at elevated temperature.
Table 12.
Weight loss of samples tested at elevated temperature.
| Weight Loss After 7 Days |
|---|
| | Unpolished | Polished |
|---|
| Laser power | 80 W | 100 W | 120 W | 80 W | 100 W | 120 W |
| Weight loss [g] | 0.0044 | 0.0059 | 0.0047 | 0.0037 | 0.0036 | 0.0028 |
Table 13.
Corrosion rate of samples at elevated temperature.
Table 13.
Corrosion rate of samples at elevated temperature.
| Corrosion Rate |
|---|
| | Unpolished | Polished |
|---|
| Laser power | 80 W | 100 W | 120 W | 80 W | 100 W | 120 W |
| Corrosion rate [(g/cm2)/year] | 0.0813 | 0.1093 | 0.0875 | 0.0698 | 0.0670 | 0.0521 |
Table 14.
Chemical composition of samples subjected to long-term corrosion at 40 °C in the tested micro-area.
Table 14.
Chemical composition of samples subjected to long-term corrosion at 40 °C in the tested micro-area.
| | | Atomic % |
|---|
| | Laser Power | C-K | O-K | Si-K | Al-K | Ca-K | Ti-K | Fe-K | Co-K | Ni-K | Mo-L | S-K |
|---|
| Unpolished | 80 W | 8.57 | 38.80 | 0.26 | 0.34 | - | 1.77 | 37.47 | 3.86 | 6.25 | 2.51 | 0.17 |
| 100 W | 8.81 | 40.95 | 0.30 | 0.26 | - | 7.69 | 43.11 | 2.16 | 4.57 | 7.69 | - |
| 120 W | 4.92 | 36.71 | 0.19 | 0.11 | - | 3.90 | 44.97 | 2.70 | 2.09 | 3.24 | - |
| Polished | 80 W | 8.25 | 42.14 | | 0.07 | 0.01 | 2.56 | 37.59 | 2.77 | 6.32 | 0.14 | 0.16 |
| 100 W | 8.84 | 39.14 | 0.03 | 0.06 | 0.04 | 0.29 | 45.29 | 2.01 | 3.78 | 0.57 | - |
| 120 W | 7.61 | 45.46 | 0.11 | 0.9 | - | 0.33 | 40.11 | 2.33 | 3.34 | 0.50 | 0.07 |
Table 15.
Summary of long-term test results for room temperature and 40 °C.
Table 15.
Summary of long-term test results for room temperature and 40 °C.
| Mass Loss After 7 Days |
|---|
| | Unpolished | Polished |
|---|
| | 80 W | 100 W | 120 W | 80 W | 100 W | 120 W |
|---|
| Room temperature | 0.0025 | 0.0036 | 0.0036 | 0.0019 | 0.0021 | 0.0026 |
| Temperature 40 °C | 0.0044 | 0.0059 | 0.0047 | 0.0037 | 0.0036 | 0.0028 |
Table 16.
Corrosion rate comparison of samples at room temperature and 40 °C.
Table 16.
Corrosion rate comparison of samples at room temperature and 40 °C.
| Corrosion Rate [(g/cm2)/year] |
|---|
| | Unpolished | Polished |
|---|
| | 80 W | 100 W | 120 W | 80 W | 100 W | 120 W |
|---|
| Room temperature | 0.0459 | 0.0664 | 0.0664 | 0.0354 | 0.0400 | 0.0478 |
| Temperature 40 °C | 0.0813 | 0.1093 | 0.0875 | 0.0698 | 0.0670 | 0.0521 |


 ,
, 


