Article

Structure–Dopant Concentration Relations in Europium-Doped Yttrium Molybdate and Peak-Sharpening for Luminescence Temperature Sensing

Center of Excellence for Photoconversion, Vinča Institute of Nuclear Sciences-National Institute of the Republic of Serbia, University of Belgrade, 11001 Belgrade, Serbia
*
Authors to whom correspondence should be addressed.
Materials 2024, 17(17), 4267; https://doi.org/10.3390/ma17174267
Submission received: 23 July 2024 / Revised: 12 August 2024 / Accepted: 20 August 2024 / Published: 28 August 2024

Abstract

:
A set of Eu3+-doped molybdates, Y2−xEuxMo3O12 (x = 0.04; 0.16; 0.2; 0.4; 0.8; 1; 1.6; 2), was synthesized using a solid-state technique and their properties studied as a function of Eu3+ concentration. X-ray diffraction showed that the replacement of Y3+ with larger Eu3+ resulted in a transformation from orthorhombic (low doping concentrations) through tetragonal (high doping concentrations), reaching monoclinic structure for full replacement in Eu2Mo3O12. The intensity of typical Eu3+ red emission slightly increases in the orthorhombic structure then rises significantly with dopant concentration and has the highest value for the tetragonal Y2Mo3O12:80mol% Eu3+. Further, the complete substitution of Y3+ with Eu3+ in the case of monoclinic Eu2Mo3O12 leads to decreased emission intensity. Lifetime follows a similar trend; it is lower in the orthorhombic structure, reaching slightly higher values for the tetragonal structure and showing a strong decrease for monoclinic Eu2Mo3O12. Temperature-sensing properties of the sample with the highest red Eu3+ emission, Y2Mo3O12:80mol% Eu3+, were analyzed by the luminescence intensity ratio method. For the first time, the peak-sharpening algorithm was employed to separate overlapping peaks in luminescence thermometry, in contrast to the peak deconvolution method. The Sr (relative sensitivity) value of 2.8 % K−1 was obtained at room temperature.

1. Introduction

Single or composite materials that can be used for multiple applications are known as multifunctional materials. Those systems are “smart” because they react to external stimuli based on the material’s properties (mechanical, electrical, or optical). Multifunctional optical materials interact strongly with electromagnetic radiation in the spectrum’s visible, ultraviolet, and infrared regions. They can be used as the building blocks of innovative technologies with the potential to address different societal challenges. These materials have significant potential for increasing efficiency, safety, and responsiveness while reducing size, weight, cost, power consumption, and complexity in new system performance. Therefore, the identification of high-performance multifunctional optical materials is a continuous task.
Herein, we propose Eu3+-doped molybdates as a promising luminescent material with potential applications (i) as a red phosphor in the field of lighting and displays and (ii) as a thermal probe in the luminescent thermometry field.
At present, red phosphors with a variety of luminescence centers are available in the field of lighting and displays but there is a space room for further improvement, in terms of:
(1)
Ease of synthesis, cost-effectiveness, and long-term stability.
(2)
Increased emission intensity and luminous efficacy for improved brightness and reduced energy consumption in WLED devices.
(3)
Enhanced thermal stability of emission intensity to ensure that LEDs and displays function optimally at elevated temperatures.
Thus, advancing emission efficiency, fine-tuning luminescence spectra, and boosting thermal stability in red phosphors are crucial for the LED and display industries.
Thermometry, the practice of measuring temperature, is currently performed using various devices based on different measurement principles. However, there is an ongoing demand for innovative measurement concepts and temperature probes, particularly for applications in emerging fields such as nanotechnology, biotechnology, and integrated optics. Today, there is an urgent need for non-contact thermometry for objects that are either in motion, sensitive to contact, hard to access, or located in hazardous environments. To meet these needs, temperature measurements that leverage changes in the optical properties of materials are seen as particularly promising, with a notable focus on the temperature-dependent luminescent properties of materials [1]. Like the field of lighting and displays, researchers reported numerous luminescence temperature probes; however, there is always room for improvement:
(1)
Higher emission intensity for easy signal detection.
(2)
Better sensitivity to temperature, namely higher relative sensitivity values.
In this research, Y2Mo3O12 was selected for the following reasons. Firstly, host materials with optically inactive rare-earth ions such as Y3+, La3+, Gd3+, and Lu3+ are suitable candidates for the incorporation of optically active lanthanides, to synthesize highly efficient luminescent materials. Secondly, these types of materials remain rather stable against environmental influence, are non-toxic, and have excellent chemical, thermal, and electrical stability [2,3]. Thirdly, molybdates form complex crystal structures with a set of temperature- and pressure-dependent phase transitions that show interesting luminescent properties [4,5,6,7,8,9,10,11,12]. In addition, when doped with Eu3+ ions Y2Mo3O12 shows efficient red photoluminescence necessary for the development of WLEDs with spectral characteristics comparable to daylight [13]. Also, rare-earth-doped molybdates have shown excellent performance in the field of luminescence thermometry due to the good thermal stability and realization of non-contact measurements with high precision and sensitivity [14,15,16,17,18,19,20,21].
In this paper, we studied the set of Eu3+-doped molybdates of general formula Y2−xEuxMo3O12 (x = 0.04; 0.16; 0.2; 0.4; 0.8; 1; 1.6 and 2). We showed how different Eu3+ dopant concentrations affect structural properties and induce phase transitions from orthorhombic via tetragonal to monoclinic. The optical properties of the set were investigated in detail using UV-VIS and photoluminescent spectroscopy. Further, luminescence thermometry using luminescence intensity ratio (LIR) in the 300 K to 650 K temperature range was demonstrated on the sample with the highest emission intensity. LIR is the most researched temperature-readout method in luminescence thermometry and among lanthanide-doped probes, LIR by Eu3+ shows the highest sensitivity. In Y2Mo3O12 Eu3+, the emissions of thermally coupled levels overlap. Traditionally, they are separated by deconvolution; otherwise, the sensitivity would be reduced [22]. The peak sharpening method as an easier and simpler alternative to peak deconvolution was used for the first time to separate overlapping peaks.

2. Materials and Methods

2.1. Phosphor Synthesis

Yttrium (III) oxide (Y2O3, Alfa Aesar, purity 99.9%), europium (III) oxide (Eu2O3, Alfa Aesar, purity 99.9%), and molybdenum (VI) oxide (MoO3, Alfa Aesar, purity 99.95%) were used as starting materials without further purification. Herein, eight samples with abbreviated names, YMO2Eu, YMO8Eu, YMO10Eu, YMO20Eu, YMO40Eu, YMO50Eu, YMO80Eu, and EuMO, were synthesized by a high-temperature solid-state method (the exact doping concentrations of Eu3+ ions and sample formulas are provided in Table 1). In an optimized synthesis, the stoichiometric amounts of Y2O3, Eu2O3, and MoO3, were homogenized by dry grinding in methanol in an agate mortar and heated for 4 h in open crucibles at 300 °C. To complete the reaction, the products were cooled down to room temperature, finely ground, and annealed at 800 °C in an air atmosphere for 4 h. The collected powders were white, and with an increase in the doping concentration of Eu3+ ions, they became pale pink.

2.2. Characterization

The crystal structure of the samples was investigated by X-ray diffractometer (XRD) (Cu-Kα1,2 radiation, λ = 0.1540 nm, Rigaku SmartLab, Tokyo, Japan) at room temperature. The measurements were recorded over the 10°–70° range, with 0.02° step size and 10°/min counting time. Built-in PDXL2 v2.1 package software was used to obtain relevant parameters of the structural analysis. The morphology of the prepared sample was defined by a field emission gun MIRA3 (TESCAN, Brno Kohoutovice, Czech Republic) field emission scanning electron microscope (FE-SEM), the samples were coated with a thin layer of Au using a typical sputtering technique (Polaron SC502-Fison Instruments, Glasgow, UK). The samples’ UV–VIS diffuse reflection spectra (DRS) were recorded with a UV-3600 UV-VIS-NIR spectrophotometer (Shimadzu, Kyoto, Japan) in the visible spectral region and BaSO4 was used as the reflectance standard. Emission spectra were measured using the Ocean Optics (Orlando, FL, USA) FX UV-VIS Spectrometer with the excitation light source–405 nm Ocean Optics (Orlando, FL, USA) Insight LED module working in continuous mode and controlled by LDC-1. The temperature-dependent emission spectra were recorded over 300 K to 650 K with a 25 K step. The temperature of the samples was controlled by using a MicroOptik MHCS400 (Breskens, Netherlands) liquid nitrogen-cooled heating-cooling stage. Lifetime measurements were carried out at room temperature using the Rohde & Schwarz RTC1002 (Munich, Germany) two-channel oscilloscope (1 µs temporal resolution) paired with the Hamamatsu (Shizuoka, Japan) H10722-20 photomultiplier tube and by exciting the samples with a square wave modulated 405 nm Ocean Optics Insight fiber-coupled LED (LSM 405A, Orlando, FL, USA) controlled by Ocean Insight LDC-1 Single Channel LED Controller.

3. Results and Discussion

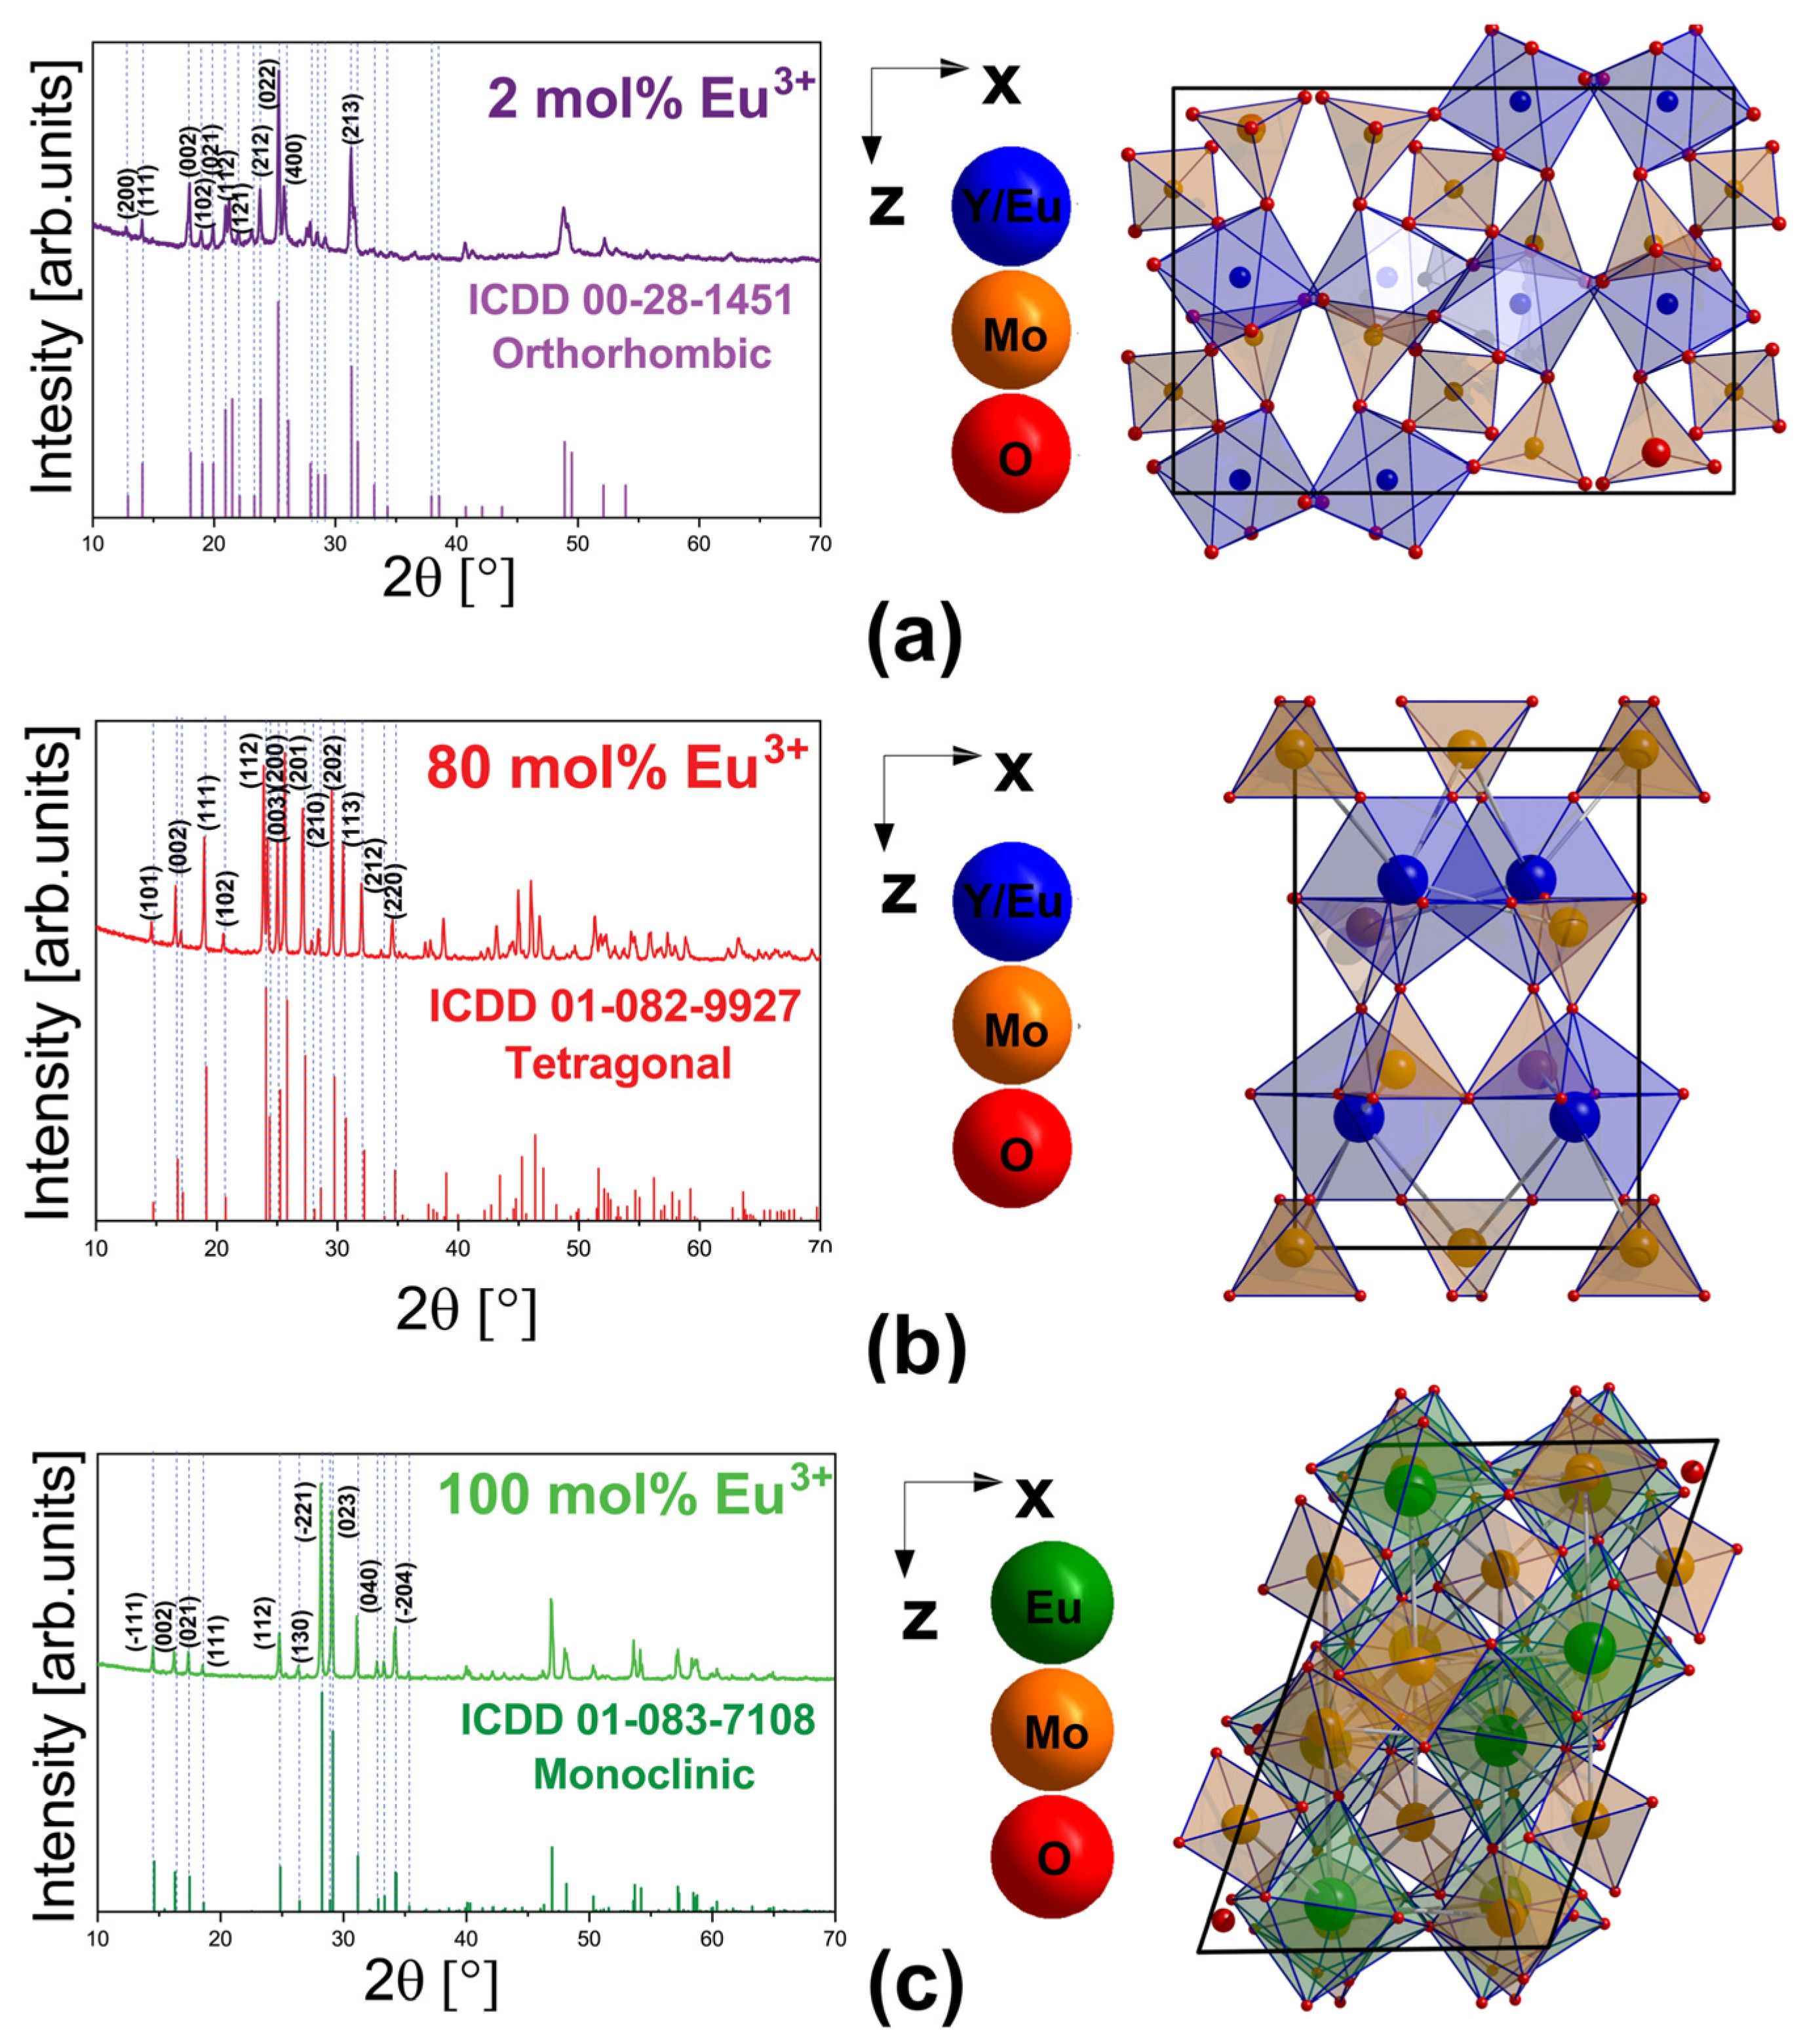
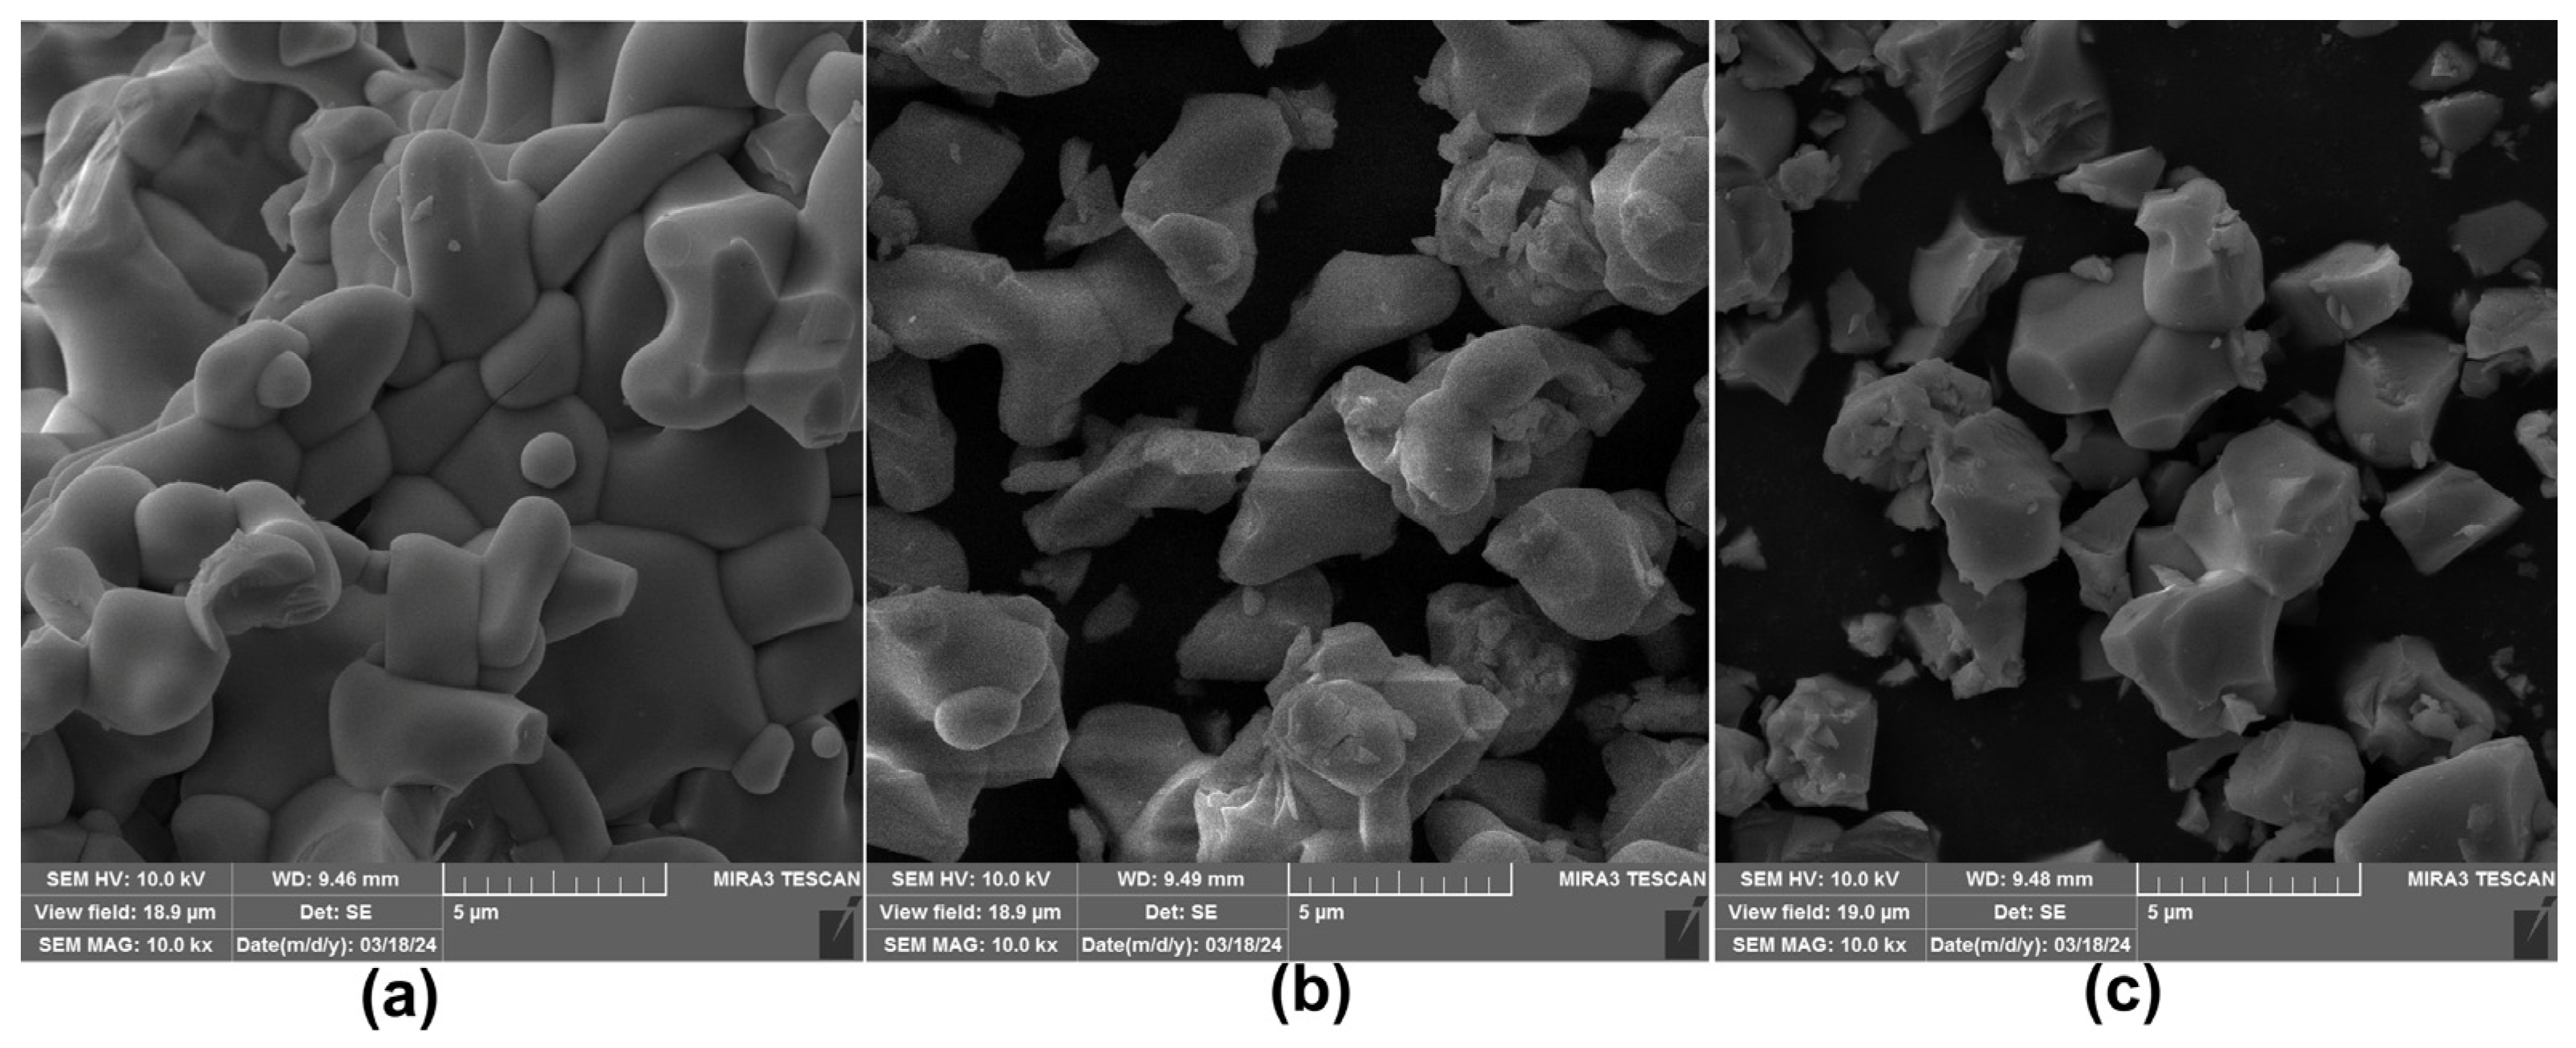
3.1. Structural and Morphological Properties

The effect of the Eu3+ ions doping concentration on the crystal structure of the synthesized Y2−xEuxMo3O12 phosphors was analyzed by X-ray diffraction measurements. In the samples with smaller Eu3+ doping concentrations (YMO2Eu and YMO8Eu) diffraction patterns correspond to the orthorhombic crystal structure with Pbcn (60) space group composed of corner-shared (MoO4) tetrahedrons and (YO6) octahedrons (Figure 1a and Figure S1a). Further increase of the Eu3+ ions concentration (YMO10Eu and YMO20Eu) leads to a mixture of two phases: orthorhombic and tetragonal as shown in the Supporting Information file (Figure S1b). An additional increase of Eu3+ ions concentration leads to a single-phase tetragonal crystal structure with space group P-421m (113) in YMO40Eu, YMO50Eu, and YMO80Eu samples (Figure 1b and Figure S1c). Y2Mo3O12 comprises corner-shared (MoO4) tetrahedrons and (YO7) heptahedrons in the tetragonal structure. Complete substitution of Y3+ with Eu3+ ions results in the formation of pure Eu2Mo3O12 whose crystal structure is monoclinic with space group C2/C (15) (Figure 1c) and is formed of (MoO4) tetrahedrons/(MoO5) pentahedrons and (EuO8) polyhedrons linked by corners.
Unique ranges of ionic radii of trivalent rare earth dictate the fact that the RE2M3O12 family adopts several crystal structures, resulting in different preferences for coordination environments. Smaller RE ions such as Er, Tm, Yb, and Lu usually form 6-coordinate structures, while the case of larger RE ions (such as La, Eu, Gd, Ho, Sm, and Tb) is that they generally have high coordination numbers (7 or 8) [8]. In addition, yttrium ion can be distinguished as a pseudo-lanthanide, as it has very similar properties to lanthanides. Y3+ ionic radius is borderline between the smaller lanthanides forming 6-coordinated structures, and those preferring structures with higher coordination numbers [8]. Therefore, the replacement of Y3+ with larger size Eu3+ ions results in the transformation from orthorhombic (for low doping concentrations) through tetragonal (for high doping concentrations) reaching monoclinic structure for full replacement in Eu2Mo3O12.
Crystallite size, as well as the unit cell parameters, and micro strains of the obtained materials, were calculated using the built-in program package PDXL2 (Table 2).
FE-SEM images of the representative orthorhombic, tetragonal, and monoclinic Eu³⁺-doped Y2Mo3O12 samples reveal agglomerated particles with irregular, elongated, quasi-spherical shape, as illustrated in Figure 2. A detailed examination of these images indicates that, despite the distinct crystal structures and varying concentrations of Eu3⁺ ions, the overall morphology and shape of the particles exhibit notable similarities across all three crystal phases. This uniformity suggests that the Eu3⁺ ion doping does not significantly alter the fundamental particle morphology. Furthermore, the particles appear to aggregate into clusters, with the size and distribution of these clusters remaining consistent regardless of the crystal phase or dopant concentration. This observation may imply a common growth mechanism or interaction between the particles during the synthesis process, highlighting the robustness of the material’s structural integrity across different doping levels and crystalline forms.

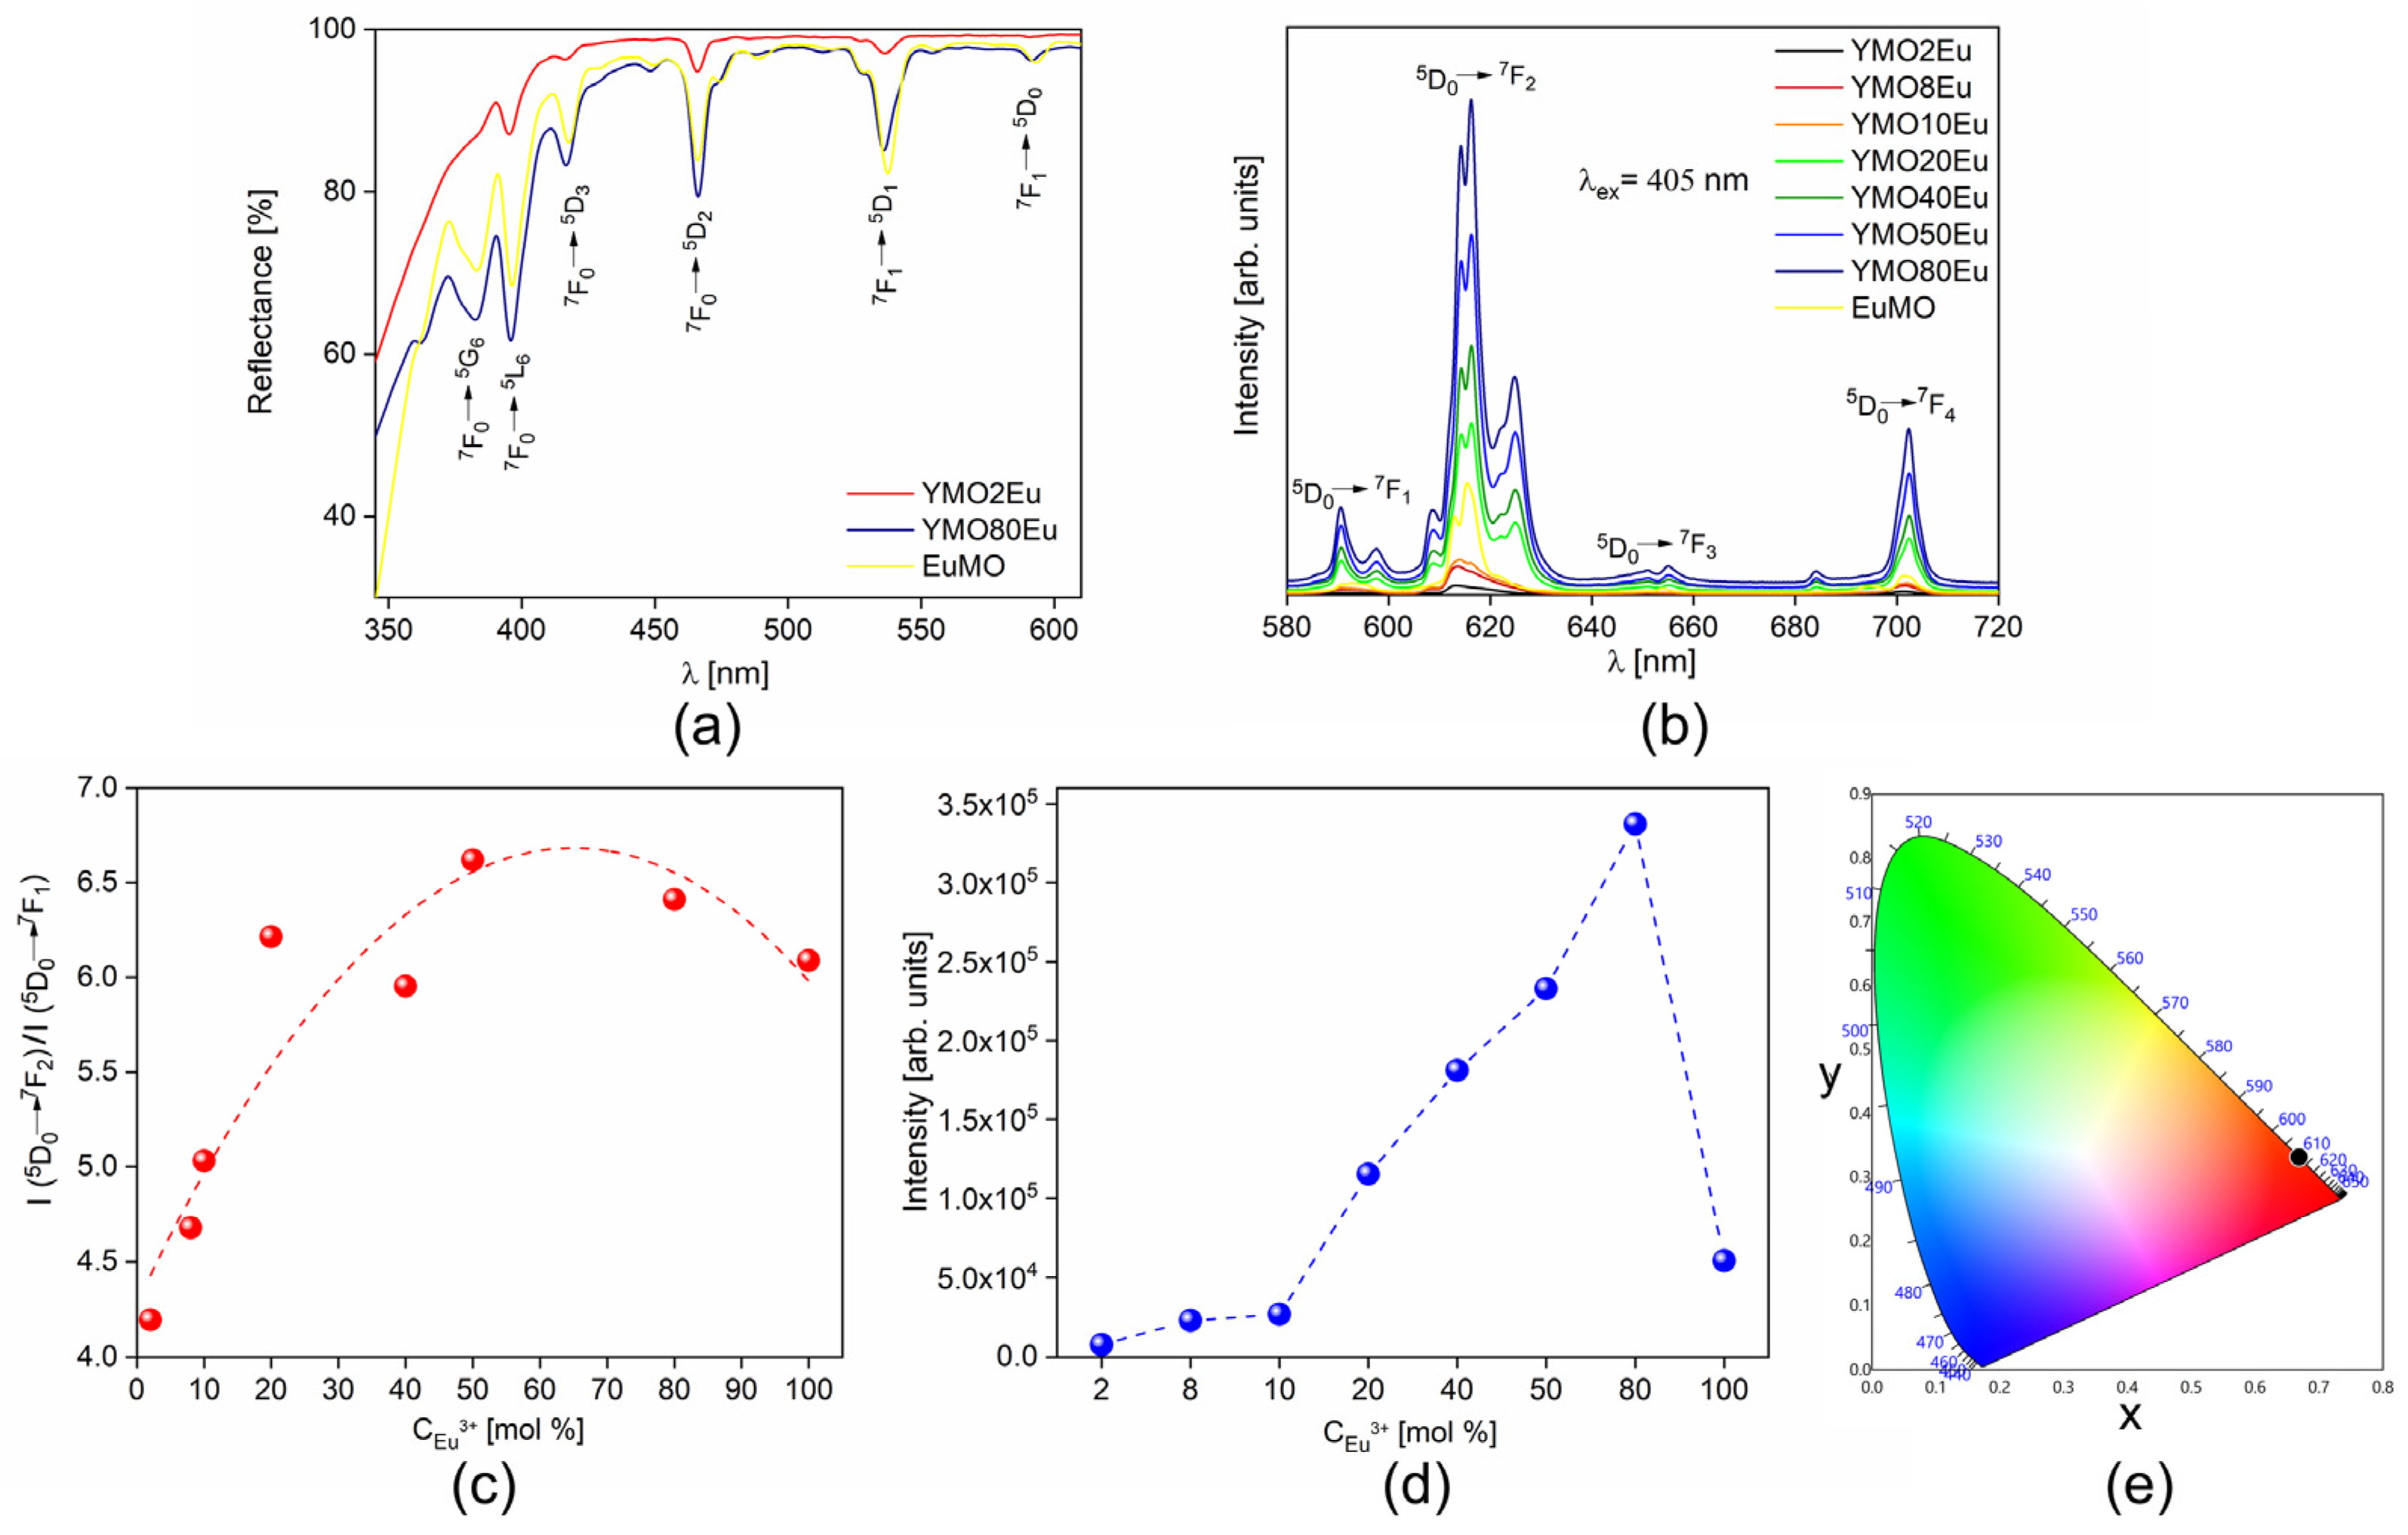
3.2. UV-VIS and Photoluminescent Properties

Figure 3a presents the diffuse reflectance spectra of representative YMO2Eu, YMO80Eu, and EuMO samples in the 345–610 nm spectral range where typical transitions originating from Eu3+ ions can be observed. The absorption peaks of Eu3+ ions, which are located at 381, 396, 416, 466, 537, and 593 nm correspond to the following electronic transitions 7F0 → 5G6, 7F0 → 5L6, 7F0 → 5D3, 7F0 → 5D2, 7F1 → 5D1, and 7F1 → 5D0, respectively, with the highest absorption placed at ~396 nm [23,24].
The room temperature photoluminescent emission spectra of the synthesized samples recorded upon 405 nm excitation are presented in Figure 4b. All materials show typical Eu3+ red emission, with the most intense peak placed at ~616 nm corresponding to 5D07F2 electric-dipole transition. Also, three others characteristic Eu3+ ion transitions can be noticed: magnetic dipole 5D07F1 placed at ~590 nm, as well as 5D07F3 placed at ~655 nm, and 5D07F4 transition placed at ~702 nm.
5D07F1 is a magnetic-dipole transition and does not depend on a local environment. However, the 5D07F2 electric-dipole transition is a hyper-sensitive one, and it is very dependent on the minor changes in the local environment of the Eu3+ ions. Therefore, theoretically, the ratio of the integrated intensity of the 5D07F2 and 5D07F1 transitions, known as the asymmetry ratio, can be considered indicative of the reduction of symmetry of the coordination environment around the Eu3+ ion and is given by Equation (1):
R = I ( D 0 5 F 2 7 ) I ( D 0 5 F 1 7 )
Figure 3c presents the asymmetry ratio as a function of Eu3+-dopant ion concentration. The ratio increases in the set of samples with orthorhombic structure (from YMO2Eu to YMO10Eu), followed by a further increase of the ratio in the samples with the tetragonal structure which among them have similar values (from YMO20Eu to YMO80Eu) The asymmetry ratio value for monoclinic EuMO is relatively similar to the samples with the tetragonal structure. The high value of the asymmetry ratio as a function of dopant ion concentration indicates low symmetry of the Eu3+ surroundings in the molybdate crystal.
Figure 3d shows integrated emission intensity as a function of Eu3+ dopant concentration. The emission intensity increases slightly in the orthorhombic structure for 2 mol% Eu3+ and 8 mol% Eu3+ concentrations. With a further increase in the Eu3+ ions concentration, there is a significant rise in the emission intensity having the highest value for the tetragonal YMO80Eu sample showing that the YMO host can be heavily doped without a decrease in the emission intensity. Complete substitution of the Y3+ ions with Eu3+ in the case of monoclinic EuMO leads to a clear decrease in the emission intensity.
CIE chromaticity coordinates (x, y) were derived from the photoluminescent spectra and shown in Figure 3e. For all the samples, CIE coordinates are practically identical (x = 0.669, y = 0.331) and placed in the red-orange fragment of the diagram. Color purity of 99% (dominant wavelength–611 nm) was also calculated using the Osram color calculator.
Figure 4a displays the photoluminescent lifetime decay curves of all samples recorded at room temperature under 405 nm excitation. To obtain the value of the lifetime (τ), acquired data were fitted to a simple single exponential function:
I ( t ) = I 0 e t τ + noise
where I(t) is the corresponding PL intensity at time t, I0 is the initial PL intensity, and τ is the photoluminescent lifetime; corresponding fitting parameters as well as goodness of fit values are presented in Table S1 (See Supporting Information). Figure 4b represents calculated lifetime values for all the Y2−xEuxMo3O12 samples, with the longest decay time observed in the case of the YMO20Eu sample showing τ = 0.61 ms value. Obtained decay times follow a similar trend as emission intensity. Values are lower in the orthorhombic structure for 2mol% Eu3+ and 8mol% Eu3+ concentration, reaching slightly higher values for tetragonal structure and showing a strong decrease for monoclinic Eu2Mo3O12.
The observed lifetime of an excited state is influenced by both radiative and nonradiative processes. The radiative rate AR represents the rate at which the excited state decays by emitting a photon. Nonradiative rates ANR represent all other decay pathways, such as vibrational relaxation, that do not involve photon emission. The observed lifetime is the reciprocal of the total decay rate, which is the sum of radiative and nonradiative rates:
1 τ = A R + A N R
A longer observed lifetime indicates a higher radiative rate relative to the nonradiative rate, while a shorter lifetime suggests more significant nonradiative processes. Thus, the relationship between these rates determines how efficiently luminescence occurs. The phase of the host material affects both radiative and non-radiative rates by influencing the interaction of the luminescent centers with their environment, impacting how efficiently energy is radiated or lost to non-radiative processes. At higher concentrations, cross-relaxation between activator ions becomes significant, further increasing non-radiative rate.
To determine the temperature stability of emission and the application potential of these materials in LEDs, temperature-dependent photoluminescence measurements were recorded for the YMO80Eu sample. Emission intensity shows high-temperature stability in the maximal operating temperature of LEDs which is, depending on the manufacturer, usually considered to be 100 °C [25,26]. For the YMO80Eu sample, the emission intensity at 100 °C remains at 98% of its initial value at room temperature.

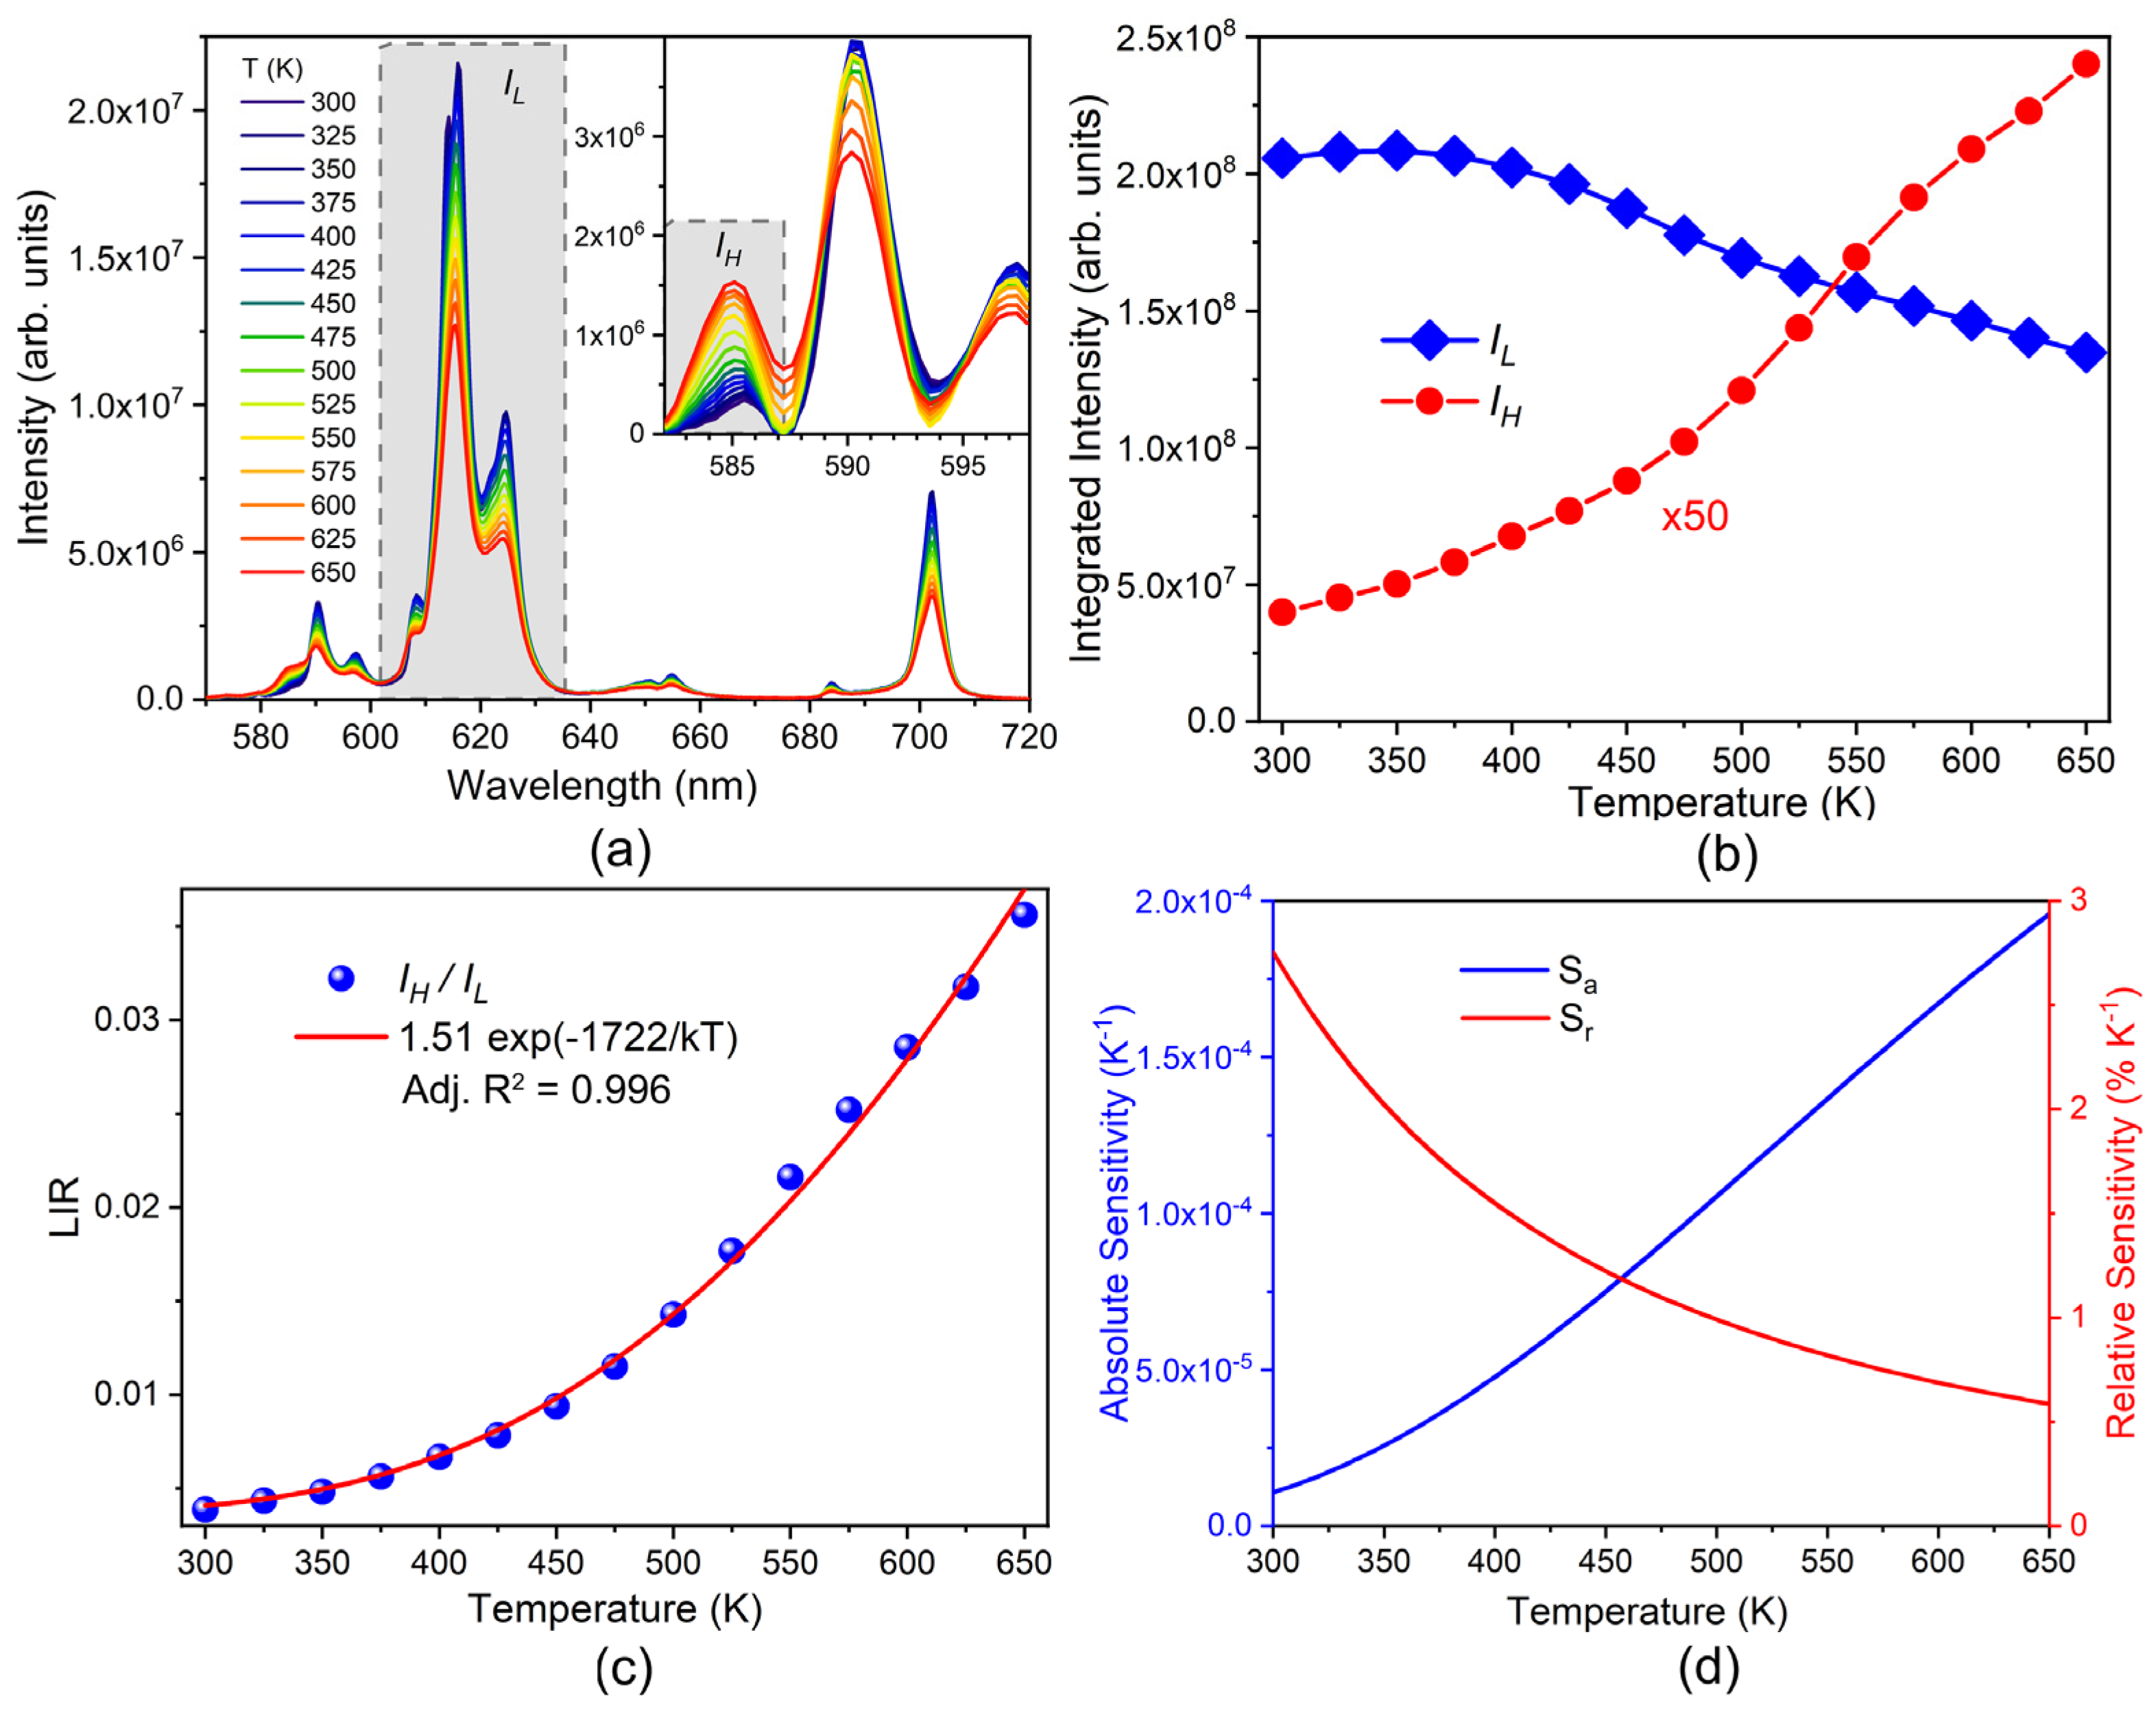
3.3. Temperature-Dependent Photoluminescent Properties

Temperature-dependent emission spectra of the sample with the highest emission intensity (YMO80Eu) are presented in Figure 5a. The emission intensities of 5D07F1,2,3,4 peaks slowly decrease with increasing temperature. However, at 585 nm [27], the peak originating from 5D17F3 emission increases with temperature due to the thermalization from the 5D0 level. As its position overlaps with the 5D07F1 transition and because of the thermal peak broadening, this peak is not distinctly resolved. Using spectral areas separated by wavelength in luminescence thermometry here would result in lowered sensitivity as there are contributions from other transitions with different temperature trends. In our previous paper, we demonstrated how peak deconvolution can be used for separating transitions of different origins and the staggering effect it has on the increase of sensitivities [22]. However, peak deconvolutions are difficult to properly conduct as they require multiple-peak fitting at every measured temperature. Here we propose an alternative in separating overlapping peaks (here 5D07F1 and 5D17F3) by the method called numerical resolution enhancement or peak sharpening [28,29], where the intensity is modified by:
i sharp ( λ ) = i ( λ ) w 1 d 2 i ( λ ) d λ 2 + w 2 d 4 i ( λ ) d λ 4
where w1 and w2 are the weighting factors. The result of the peak sharpening is given in Figure 5a inset, where the 5D1 emission is distinctly separated from the 5D07F1. Note that the peak sharpening method does not affect the peak positions or the integrated area.
The trends of integrated intensities of 5D07F2 (from Figure 5a) and 5D17F3 (from Figure 5a inset) with increasing temperature are given in Figure 5b. The energetically lower 5D0 emission (L) slowly decreases, while the energetically higher 5D1 (H) emission increases with temperature to the expense of the former level population. The luminescence intensity ratio (LIR) of those two emissions is given by the Boltzmann distribution [30]:
L I R = I H I L = B exp ( Δ E k T )
where B is the temperature invariant parameter, k = 0.695 cm−1 K−1 is the Boltzmann constant, T is the temperature in Kelvins, and ΔE is the energy separation between thermalized levels. The temperature invariant B parameter is related to the ratio of radiative transition probabilities from the 5D1,0 levels, respectively:
B A ( D 1 5 F 3 7 ) A ( D 0 5 F 2 7 )
The fit of Equation (5) to the ratios of integrated intensities in Figure 5b is presented in Figure 5c. Good fit quality proves the effectiveness of the thermalization from the 5D0 to the 5D1 level even at room temperature. The fitted ΔE corresponds to the energy difference of the 5D0 and 5D1 levels [31].
The relative and absolute sensitivity are calculated by, respectively:
S a = L I R Δ E k T 2 ,   S r = Δ E k T 2 · 100 %
and the results are given in Figure 5d. At room temperature, the relative sensitivity has a relatively high value of 2.8% K−1 compared to other single lanthanide-doped probes. Due to the high energy gap this Eu3+-doped sensor probe is best employed for higher temperatures [32]. The comparison of sensitivities with other Eu3+-doped hosts at elevated temperatures, by the LIR method, is given in Table 3. The LIR using peak sharpening is comparable to the LIR by 5D17F1 and 5D0 emissions, as conventionally performed [33].
Table 3. Hosts for Eu3+-doped luminescence thermometry probes, measured temperature ranges by the LIR method, and absolute and relative sensitivities at 500 K.
HostRange (K)Sa (K−1) @500 KSr (% K−1) @500 KRef.
YVO4300–7500.00070.6[34]
Ca7V4O17333–7730.010.98[35]
ZnO100–5000.021.2[36]
LiNbO3300–7500.141.18[37]
YAG300–8500.0331.01[38]
TiO2293–5330.1641.02[39]
SrZrO3300–5500.0050.8[40]
NaEuF4298–523/0.97[33]
Y2Mo3O12300–6500.0150.99This work
Figure 5. (a) Temperature-dependent YMO80Eu emission spectra. (Inset) separation of 5D17F3 transition by peak sharpening method. (b) Integrated intensities of 5D07F2 and 5D17F3 emissions, (c) their LIR and fit to the Boltzmann relation, and (d) corresponding absolute and relative sensitivities. LumThools performs the fits [41].
Materials 17 04267 g005

4. Conclusions

This study discussed changes in the crystal structure and photoluminescent properties of Y2Mo3O12 caused by Eu3+ doping. The findings can be summarized as:
  • Incorporation of Eu3+ ions affects the crystal structure of Y2Mo3O12; the existence of an orthorhombic via tetragonal to monoclinic phase transition, depending on the concentration of dopant Eu3+ ions is shown.
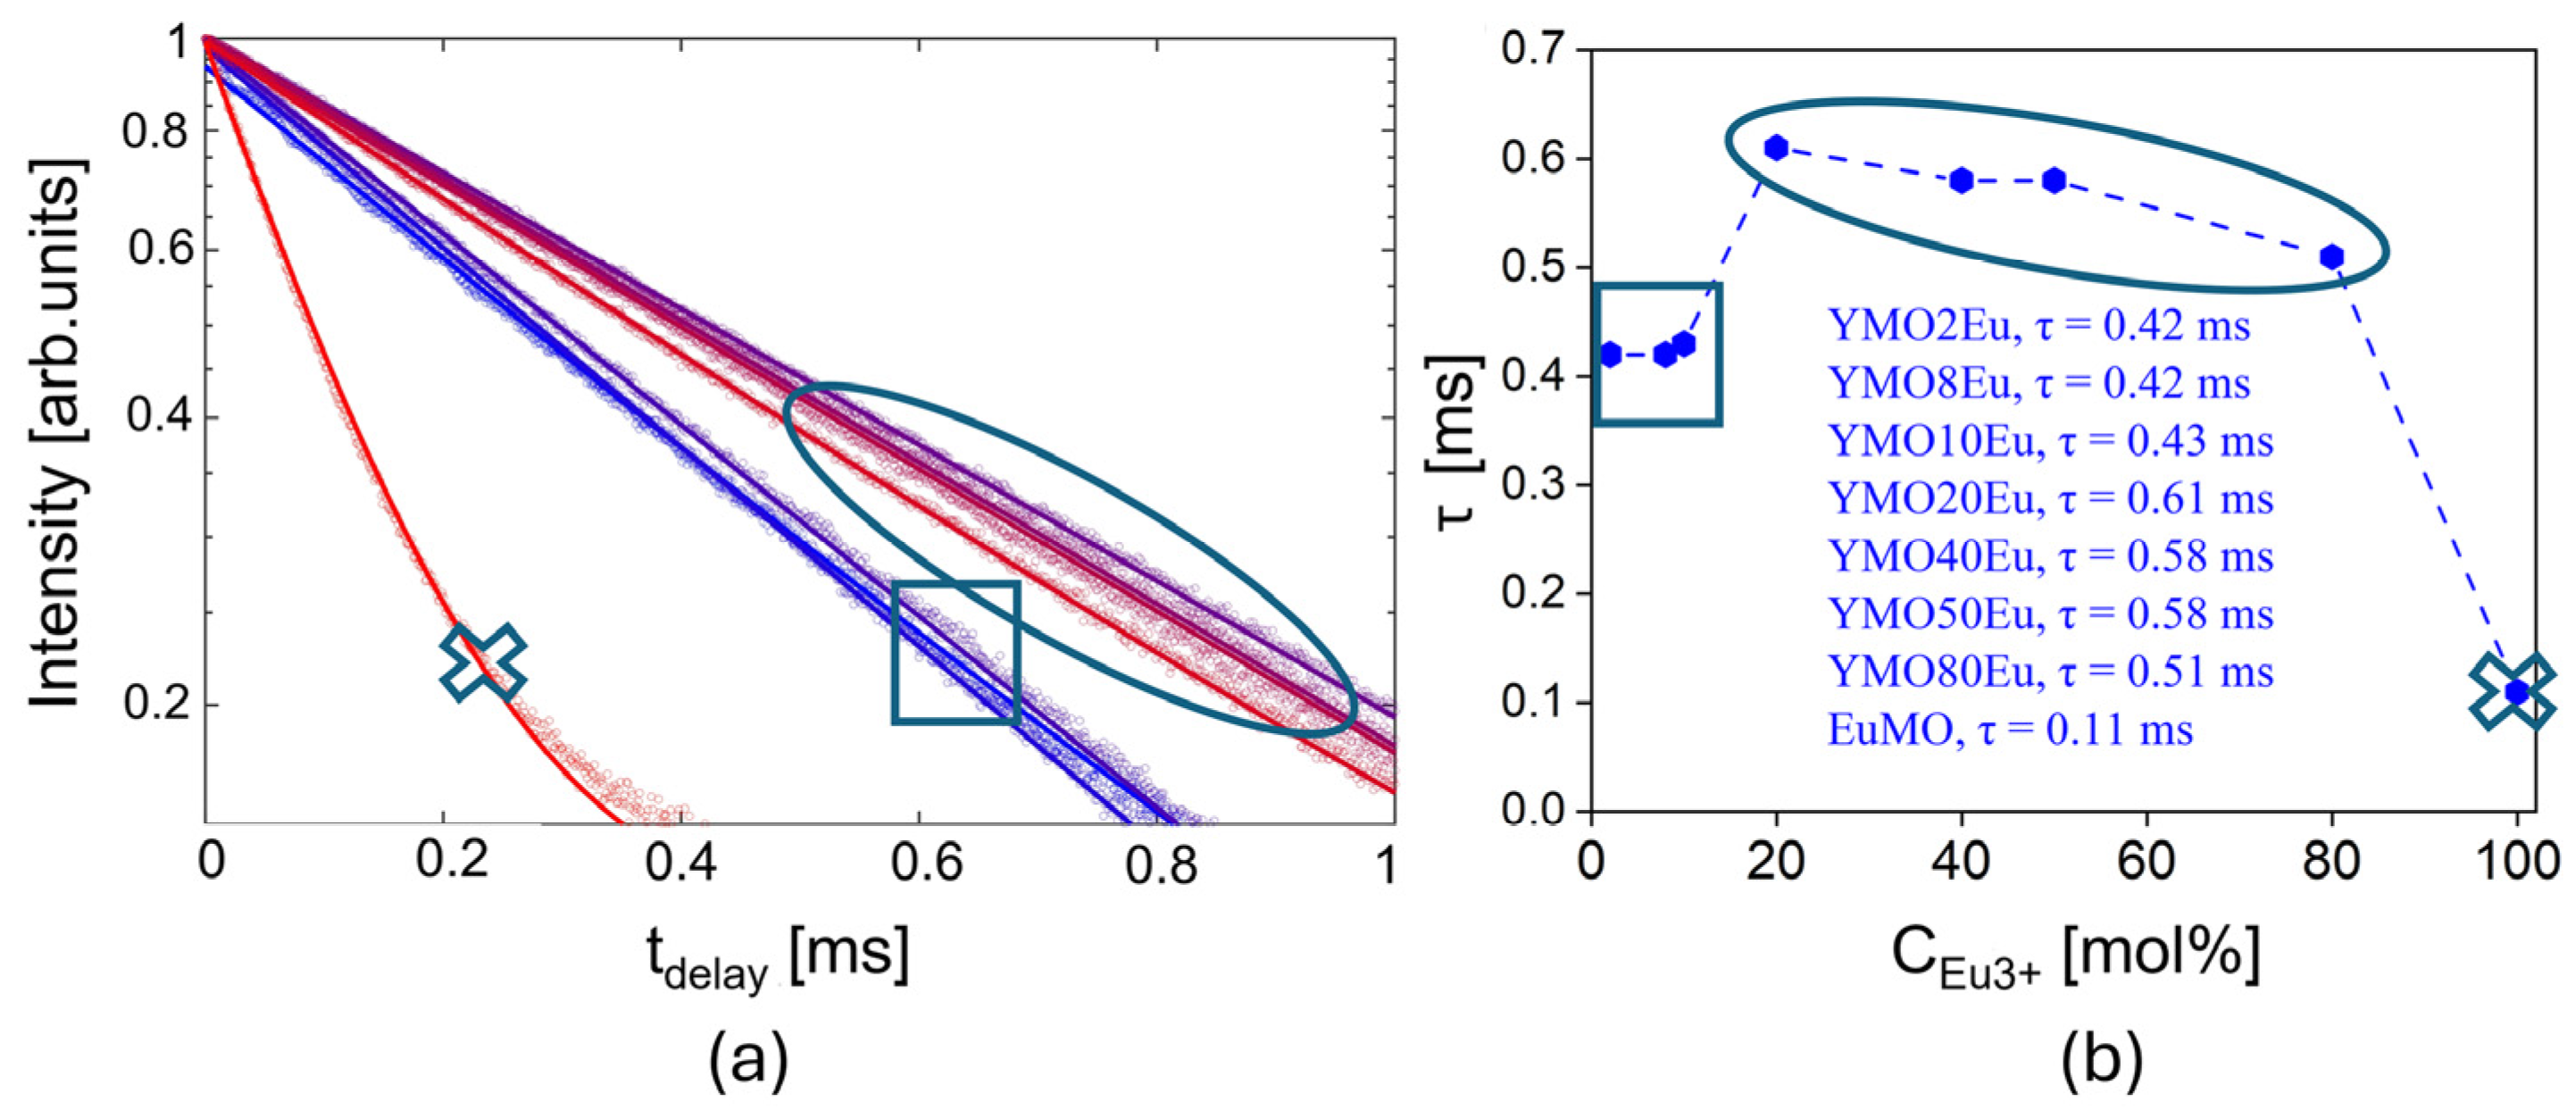
  • The luminescence intensity of Eu3+-doped Y2Mo3O12 samples was enhanced by increasing the Eu3+ dopant concentration up to optimum 80 mol% of Eu3+.
  • Emission intensity shows high-temperature stability in the maximal operating temperature of LEDs and the YMO80Eu sample remains at 98% of its initial value at 100 °C.
  • An optimized 80 mol% Eu3+-doped Y2Mo3O12 sample is proposed as a promising thermal probe with a relative sensitivity of 2.8% K−1 at room temperature.
  • The peak sharpening method is equally effective as the peak deconvolution method in the separation of overlapping peaks for the luminescence intensity ratio method.
To summarize, the red-emitting Eu3+-doped Y2Mo3O12 system can be heavily doped, showing high-temperature emission stability and a high value of relative sensitivity. Therefore, it shows potential in both lightning and luminescent thermometry fields.

Supplementary Materials

The following supporting information can be downloaded at: https://www.mdpi.com/article/10.3390/ma17174267/s1, Figure S1: XRD images of (a) orthorhombic YMO8Eu (b) mixed tetragonal and orthorhombic YMO10Eu, YMO20Eu, and (c) tetragonal YMO40Eu, YMO50Eu phosphors; Table S1: S1 Emission decay lifetimes parameters for single exponential fitting at peak emission wavelengths under 405 nm excitation and GOF values.

Author Contributions

Conceptualization, T.G., Ž.A. and M.D.D.; methodology, M.D.D.; formal analysis, T.G., M.M., Z.R. and J.P.; investigation, T.G., A.Ć., Z.R. and Ž.A.; writing—original draft preparation, T.G., A.Ć. and J.P.; writing—review and editing, A.Ć. and Ž.A.; visualization, T.G., A.Ć., Z.R., M.M., J.P. and Ž.A.; supervision, M.D.D. All authors have read and agreed to the published version of the manuscript.

Funding

This research was supported by the Science Fund of the Republic of Serbia, #GRANT No 7017, TECHNOLOGY FOR REMOTE TEMPERATURE MEASUREMENTS IN MICROFLUIDIC DEVICES-REMTES (Authors: T. Gavrilović, A. Ćirić, M. Medić, Z. Ristić, Ž. Antić, M. Dramićanin). The authors would like to acknowledge funding of the Ministry of Science, Technological Development, and Innovation of the Republic of Serbia under contract 451-03-66/2024-03/200017.

Institutional Review Board Statement

Not applicable.

Informed Consent Statement

Not applicable.

Data Availability Statement

The raw data supporting the conclusions of this article will be made available by the authors upon request.

Conflicts of Interest

The authors declare no conflicts of interest. The funders had no role in the design of the study; in the collection, analyses, or interpretation of data; in the writing of the manuscript; or in the decision to publish the results.

References

  1. Dramićanin, M. Luminescence Thermometry: Methods, Materials, and Applications; Woodhead publishing series in electronic and optical materials; Woodhead Publishing: Duxford, UK; Cambridge, MA, USA, 2018; ISBN 978-0-08-102029-6. [Google Scholar]
  2. Laufer, S.; Strobel, S.; Schleid, T.; Cybinska, J.; Mudring, A.-V.; Hartenbach, I. Yttrium(III) Oxomolybdates(VI) as Potential Host Materials for Luminescence Applications: An Investigation of Eu3+-Doped Y2[MoO4]3 and Y2[MoO4]2[Mo2O7]. New J. Chem. 2013, 37, 1919. [Google Scholar] [CrossRef]
  3. Wang, S.; Koteswara Rao, K.; Wang, Y.; Hsu, Y.; Chen, S.; Lu, Y. Structural Characterization and Luminescent Properties of a Red Phosphor Series: Y2−x Eux(MoO4)3 (X = 0.4–2.0). J. Am. Ceram. Soc. 2009, 92, 1732–1738. [Google Scholar] [CrossRef]
  4. Huang, Q.; Xu, J.; Li, W. Preparation of Tetragonal Defect Scheelite-Type RE2(MoO4)3 (RE=La TO Ho) by Precipitation Method. Solid State Ion. 1989, 32–33, 244–249. [Google Scholar] [CrossRef]
  5. Marinkovic, B.A.; Jardim, P.M.; De Avillez, R.R.; Rizzo, F. Negative Thermal Expansion in Y2Mo3O12. Solid State Sci. 2005, 7, 1377–1383. [Google Scholar] [CrossRef]
  6. Nassau, K.; Levinstein, H.J.; Loiacono, G.M. A Comprehensive Study of Trivalent Tungstates and Molybdates of the Type L2(MO4)3. J. Phys. Chem. Solids 1965, 26, 1805–1816. [Google Scholar] [CrossRef]
  7. Nassau, K.; Shiever, J.W.; Keve, E.T. Structural and Phase Relationships among Trivalent Tungstates and Molybdates. J. Solid State Chem. 1971, 3, 411–419. [Google Scholar] [CrossRef]
  8. Dmitriev, V.; Sinitsyn, V.; Dilanian, R.; Machon, D.; Kuznetsov, A.; Ponyatovsky, E.; Lucazeau, G.; Weber, H.P. In Situ Pressure-Induced Solid-State Amorphization in Sm2(MoO4)3, Eu2(MoO4)3 and Gd2(MoO4)3 Crystals: Chemical Decomposition Scenario. J. Phys. Chem. Solids 2003, 64, 307–312. [Google Scholar] [CrossRef]
  9. Lucazeau, G.; Bouvier, P.; Pasturel, A.; Le Bacq, O.; Pagnier, T. High-Pressure Study of Gd2(MoO4)3 by Raman Scattering and Ab Initio Calculations. Acta Phys. Pol. A 2009, 116, 25–31. [Google Scholar] [CrossRef]
  10. Young, L.; Gadient, J.; Lind, C. High Pressure Behavior of Chromium and Yttrium Molybdate (Cr2Mo3O12, Y2Mo3O12). Front. Chem. 2018, 6, 478. [Google Scholar] [CrossRef]
  11. Gates, S.D.; Lind, C. Polymorphism in Yttrium Molybdate Y2Mo3O12. J. Solid State Chem. 2007, 180, 3510–3514. [Google Scholar] [CrossRef]
  12. Zhang, X.; Wu, J.; Wang, P.; Gao, J.; Gao, F.; Gao, D. Enhancing the static green up-conversion luminescence of NaY(MoO4)2:Yb/Er microcrystals via an annealing strategy for anti-counterfeiting applications. Dalton Trans. 2021, 50, 7826–7834. [Google Scholar] [CrossRef]
  13. Atuchin, V.V.; Aleksandrovsky, A.S.; Chimitova, O.D.; Gavrilova, T.A.; Krylov, A.S.; Molokeev, M.S.; Oreshonkov, A.S.; Bazarov, B.G.; Bazarova, J.G. Synthesis and Spectroscopic Properties of Monoclinic α-Eu2(MoO4)3. J. Phys. Chem. C 2014, 118, 15404–15411. [Google Scholar] [CrossRef]
  14. Gou, H.; Wu, Q.; Luo, L.; Li, W.; Du, P. Reengineering the Thermometric Behaviors of Er3+/Yb3+-Codoped Gd2Mo3O12 Microparticles via Dual-Mode Luminescence Manipulation. Ceram. Int. 2023, 49, 38297–38304. [Google Scholar] [CrossRef]
  15. Zou, H.; Chen, B.; Hu, Y.; Zhang, Q.; Wang, X.; Wang, F. Simultaneous Enhancement and Modulation of Upconversion by Thermal Stimulation in Sc2Mo3O12 Crystals. J. Phys. Chem. Lett. 2020, 11, 3020–3024. [Google Scholar] [CrossRef]
  16. Liu, W.; Xu, S.; Lei, L. Enhancing Upconversion of Sc2Mo3O12:Yb/Ln (Ln = Er, Ho) Phosphors by Doping Ca2+ Ions. Opt. Mater. 2023, 143, 114166. [Google Scholar] [CrossRef]
  17. Liao, J.; Wang, M.; Lin, F.; Han, Z.; Fu, B.; Tu, D.; Chen, X.; Qiu, B.; Wen, H.-R. Thermally Boosted Upconversion and Downshifting Luminescence in Sc2(MoO4)3:Yb/Er with Two-Dimensional Negative Thermal Expansion. Nat. Commun. 2022, 13, 2090. [Google Scholar] [CrossRef]
  18. Du, P.; Luo, L.; Hou, Y.; Li, W. Energy Transfer-Triggered Multicolor Emissions in Tb3+/Eu3+-Coactivated Y2Mo3O12 Negative Thermal Expansion Microparticles for Dual-Channel Tunable Luminescent Thermometers. Mater. Adv. 2021, 2, 4824–4831. [Google Scholar] [CrossRef]
  19. Kumari, A.; Mukhopadhyay, L.; Rai, V.K. Er3+/Yb3+/Li+/Zn2+: Gd2(MoO4)3 Upconverting Nanophosphors in Optical Thermometry. J. Rare Earths 2019, 37, 242–247. [Google Scholar] [CrossRef]
  20. Lv, H.; Du, P.; Luo, L.; Li, W. Negative Thermal Expansion Triggered Anomalous Thermal Upconversion Luminescence Behaviors in Er3+/Yb3+-Codoped Y2Mo3O12 Microparticles for Highly Sensitive Thermometry. Mater. Adv. 2021, 2, 2642–2648. [Google Scholar] [CrossRef]
  21. Yang, Y.; Lin, L.; Lu, P.; Feng, Z.; Li, Z.; Cai, J.; Mei, Z.; Huang, Y.; Guo, W.; Wang, Z.; et al. A Linear Calibrated High Temperature Sensor Based on Up-Conversion Fluorescence of Y2Mo3O12:Er3+, Yb3+ Enhanced by Negative Thermal Expansion. J. Lumin. 2021, 240, 118410. [Google Scholar] [CrossRef]
  22. Ćirić, A.; Ristić, Z.; Antić, Ž.; Dramićanin, M.D. An Approximate Deconvolution Method for the Luminescence Intensity Ratio Calculations from Overlapping Emissions. Phys. B Condens. Matter 2022, 624, 413454. [Google Scholar] [CrossRef]
  23. Dang, P.; Li, G.; Yun, X.; Zhang, Q.; Liu, D.; Lian, H.; Shang, M.; Lin, J. Thermally Stable and Highly Efficient Red-Emitting Eu3+-Doped Cs3GdGe3O9 Phosphors for WLEDs: Non-Concentration Quenching and Negative Thermal Expansion. Light: Sci. Appl. 2021, 10, 29. [Google Scholar] [CrossRef] [PubMed]
  24. Ga, D.; Zhang, X.; Zhang, J. The effects of structural characterization on the luminescence of Eu3+-doped fluoride nano/microcrystals. CrystEngComm 2014, 16, 11115–11121. [Google Scholar] [CrossRef]
  25. OSRAM. LB QH9G Chip LED 0402 Datasheet n.d. Available online: https://look.ams-osram.com/m/3184c82bafe7f3ef/original/lb-qh9g.pdf (accessed on 20 March 2024).
  26. XLamp. XLAMP® WHITE LEDs n.d. Available online: https://downloads.cree-led.com/files/fs/XLamp-Discrete-Directional-Feature-Sheet.pdf (accessed on 20 March 2024).
  27. Dejneka, M.; Snitzer, E.; Riman, R.E. Blue, Green and Red Fluorescence and Energy Transfer of Eu3+ in Fluoride Glasses. J. Lumin. 1995, 65, 227–245. [Google Scholar] [CrossRef]
  28. Anderssen, R.S.; Hegland, M. Derivative Spectroscopy An Enhanced Role for Numerical Differentiation. J. Integral Equ. Appl. 2010, 22, 355–367. [Google Scholar] [CrossRef]
  29. Hegland, M.; Anderssen, R.S. Resolution Enhancement of Spectra Using Differentiation. Inverse Probl. 2005, 21, 915–934. [Google Scholar] [CrossRef]
  30. Wade, S.A.; Collins, S.F.; Baxter, G.W. Fluorescence Intensity Ratio Technique for Optical Fiber Point Temperature Sensing. J. Appl. Phys. 2003, 94, 4743–4756. [Google Scholar] [CrossRef]
  31. Carnall, W.T.; Crosswhite, H.; Crosswhite, H.M. Energy Level Structure and Transition Probabilities in the Spectra of the Trivalent Lanthanides in LaF3; Argonne National Lab. (ANL): Argonne, IL, USA, 1978; ANL-78-XX-95, 6417825. [Google Scholar]
  32. Suta, M. Performance of Boltzmann and Crossover Single-Emitter Luminescent Thermometers and Their Recommended Operation Modes. Opt. Mater. X 2022, 16, 100195. [Google Scholar] [CrossRef]
  33. Tian, Y.; Tian, B.; Cui, C.; Huang, P.; Wang, L.; Chen, B. Excellent Optical Thermometry Based on Single-Color Fluorescence in Spherical NaEuF4 Phosphor. Opt. Lett. 2014, 39, 4164. [Google Scholar] [CrossRef]
  34. Ćirić, A.; Stojadinović, S.; Dramićanin, M.D. Time-Integrated Luminescence Thermometry of Eu3+ and Dy3+ Doped YVO4. Sens. Actuators A Phys. 2019, 295, 450–455. [Google Scholar] [CrossRef]
  35. Bu, Y.; Yan, X. Temperature Dependent Photoluminescence of Eu3+-Doped Ca7V4O17. J. Lumin. 2017, 190, 50–55. [Google Scholar] [CrossRef]
  36. Senapati, S.; Nanda, K.K. Red Emitting Eu:ZnO Nanorods for Highly Sensitive Fluorescence Intensity Ratio Based Optical Thermometry. J. Mater. Chem. C 2017, 5, 1074–1082. [Google Scholar] [CrossRef]
  37. Liang, Z.; Qin, F.; Zheng, Y.; Zhang, Z.; Cao, W. Noncontact Thermometry Based on Downconversion Luminescence from Eu3+ Doped LiNbO3 Single Crystal. Sens. Actuators A Phys. 2016, 238, 215–219. [Google Scholar] [CrossRef]
  38. Ćirić, A.; Marciniak, Ł.; Dramićanin, M.D. Luminescence Intensity Ratio Squared—A New Luminescence Thermometry Method for Enhanced Sensitivity. J. Appl. Phys. 2022, 131, 114501. [Google Scholar] [CrossRef]
  39. Ćirić, A.; Stojadinović, S.; Dramićanin, M.D. Luminescence Intensity Ratio Thermometry and Judd-Ofelt Analysis of TiO2:Eu3+. Opt. Mater. 2018, 85, 261–266. [Google Scholar] [CrossRef]
  40. Das, S.; Som, S.; Yang, C.-Y.; Chavhan, S.; Lu, C.-H. Structural Evaluations and Temperature Dependent Photoluminescence Characterizations of Eu3+-Activated SrZrO3 Hollow Spheres for Luminescence Thermometry Applications. Sci. Rep. 2016, 6, 25787. [Google Scholar] [CrossRef]
  41. Ćirić, A.; Dramićanin, M.D. LumTHools—Software for Fitting the Temperature Dependence of Luminescence Emission Intensity, Lifetime, Bandshift, and Bandwidth and Luminescence Thermometry and Review of the Theoretical Models. J. Lumin. 2022, 252, 119413. [Google Scholar] [CrossRef]
Figure 1. XRD patterns and schematic presentation of crystal structure in (a) orthorhombic YMO2Eu with corresponding ICDD Card No. 00-028-1451; (b) tetragonal YMO80Eu with corresponding ICDD Card No. 01-082-9927; and (c) monoclinic EuMO with corresponding ICDD Card No. 01-083-7108. Schematic presentations of crystal structures were built in Diamond Crystal and Molecular Structure Visualization software v5.0.
Materials 17 04267 g001
Figure 2. Representative FE-SEM images under 10.0 kx magnification of (a) orthorhombic YMO2Eu (b) tetragonal YMO80Eu, and (c) monoclinic EuMO samples.
Materials 17 04267 g002
Figure 3. (a) Room temperature diffuse reflectance spectra of representative orthorhombic YMO2Eu, tetragonal YMO80Eu, and monoclinic EuMO samples; (b) room temperature photoluminescent emission spectra of all Eu3+-doped Y2Mo3O12 samples (λex = 405 nm); (c) asymmetry ratio as a function of Eu3+-dopant ion concentration; (d) integrated emission intensity of all Eu3+-doped Y2Mo3O12 samples as a function of Eu3+ concentrations. The integrated emission intensity was calculated for the whole emission area, in the 580 to 720 nm range for each sample; (e) CIE chromaticity diagram.
Materials 17 04267 g003
Figure 4. (a) Recorded lifetime decay curves for samples YMO2Eu-YMO10Eu with orthorhombic structure (square shape), YMO20Eu-YMO80Eu samples (round shape), and monoclinic EuMO (x shape) and (b) calculated luminescence decay times as a function of dopant Eu3+ concentration.
Materials 17 04267 g004
Table 1. Chemical formulas of the synthesized Y2−xEuxMo3O12 samples.
Eu3+ Concentration
(mol %)
Sample Formula
Y2−xEuxMo3O12
Abbreviated Sample Name
2Y1.96Eu0.04Mo3O12YMO2Eu
8Y1.84Eu0.16Mo3O12YMO8Eu
10Y1.8Eu0.2Mo3O12YMO10Eu
20Y1.6Eu0.4Mo3O12YMO20Eu
40Y1.2Eu0.8Mo3O12YMO40Eu
50Y1Eu1Mo3O12YMO50Eu
80Y0.4Eu1.6Mo3O12YMO80Eu
100Eu2Mo3O12EuMO
Table 2. Calculated structural parameters for the synthesized single-phase Y2−xMo3O12:xEu3+ (x = 0.04; 0.16; 0.8; 1; 1.6, 2) phosphors.
SampleYMO2EuYMO8EuYMO40EuYMO50EuYMO80EuEuMO
orthorhombicorthorhombictetragonaltetragonaltetragonalmonoclinic
No.01-075-543001-075-543001-082-992701-082-992701-082-992701-083-7108
Rwp (%)12.4310.216.147.355.677.85
Rp (%)8.166.774.625.294.295.06
Re (%)3.173.233.043.263.352.78
GOF3.92633.16382.01812.25231.69412.8204
CS (Å)165(5)288(50)455(12)366(9)299(8)418(9)
Strain0.13(2)0.83(19)0.06600.12(17)0.13(6)0.11(5)
a13.755(2)13.7340(14)7.3230(4)7.3357(2)7.3625(9)7.591(3)
b9.909(3)9.9237(14)7.3230(4)7.3357(2)7.3625(9)11.4651(5)
c9.906(2)9.9370(11)10.6292(6)10.6551(4)10.6979(9)11.5021(5)
CS—crystallite size; Rwp—the weighted profile factor; Rp—the profile factor; Re—the expected weighted profile factor; GOF—the goodness of fit.
Disclaimer/Publisher’s Note: The statements, opinions and data contained in all publications are solely those of the individual author(s) and contributor(s) and not of MDPI and/or the editor(s). MDPI and/or the editor(s) disclaim responsibility for any injury to people or property resulting from any ideas, methods, instructions or products referred to in the content.

