
The Influence of Retreated Lithium Slag with a High Content of Alkali, Sulfate and Fluoride on the Composition and the Microstructure of Autoclaved Aerated Concrete

 ,
,
Abstract
1. Introduction
2. Materials and Experimental Methods
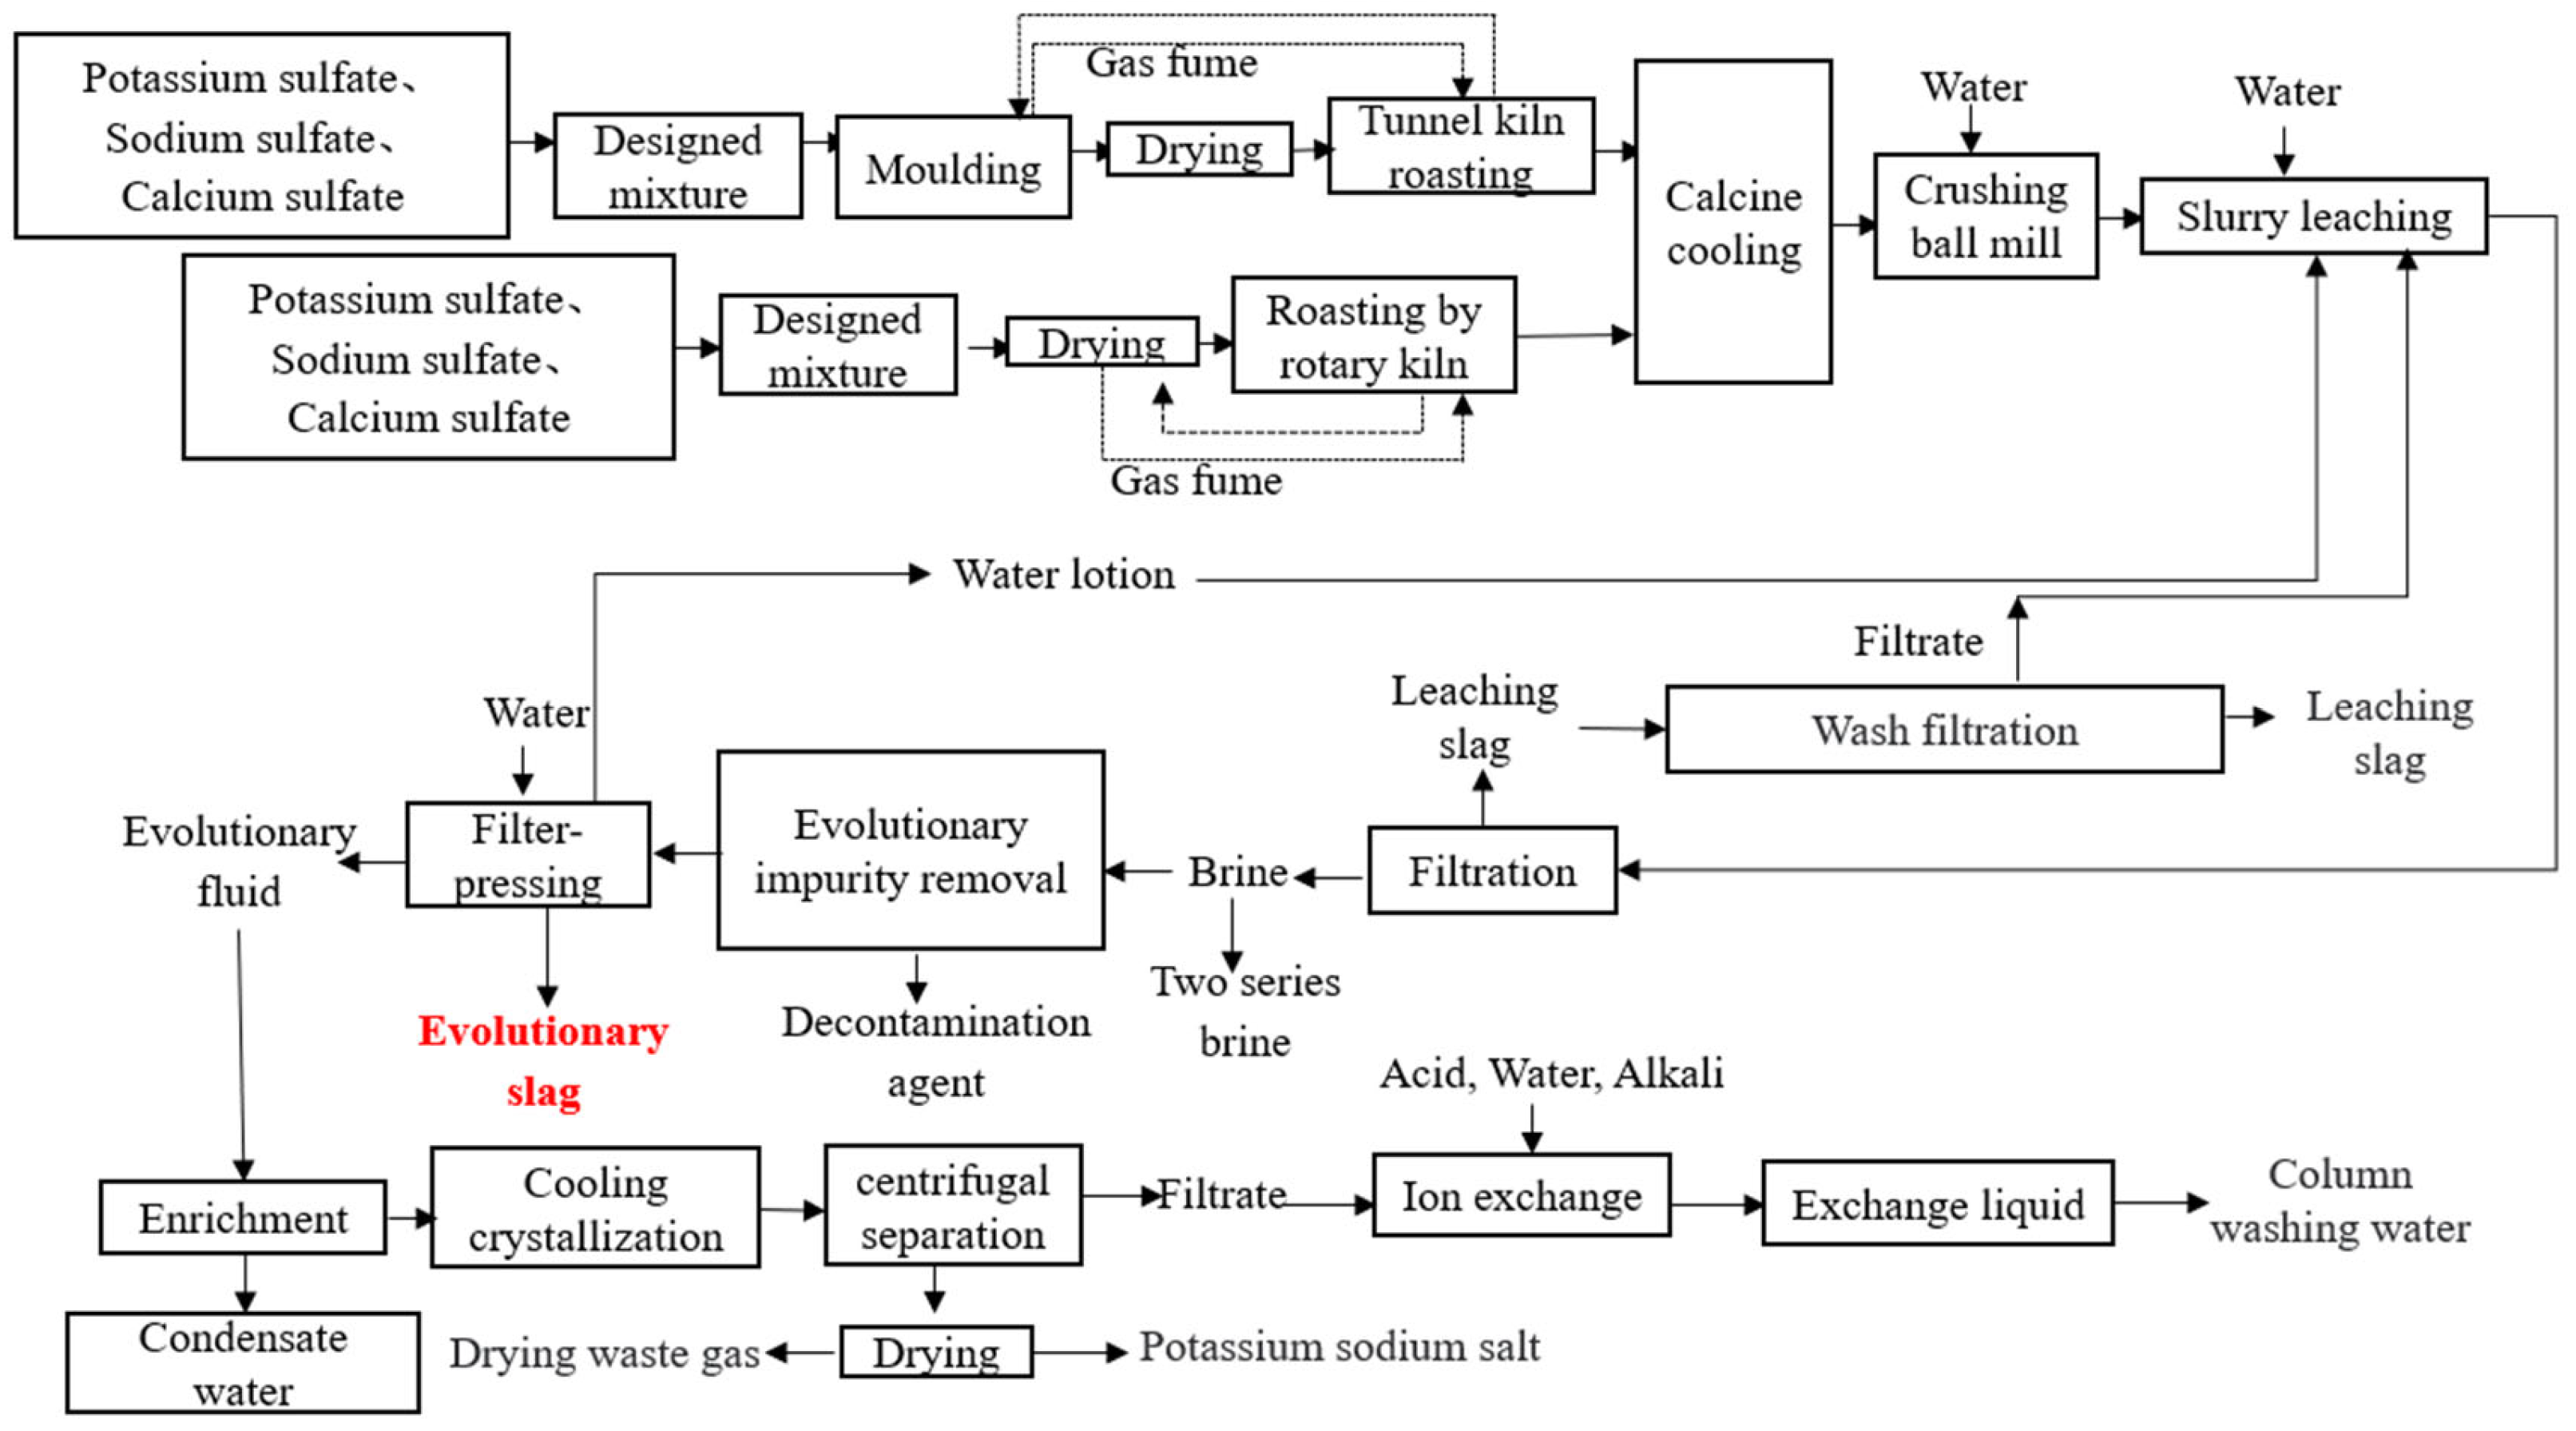
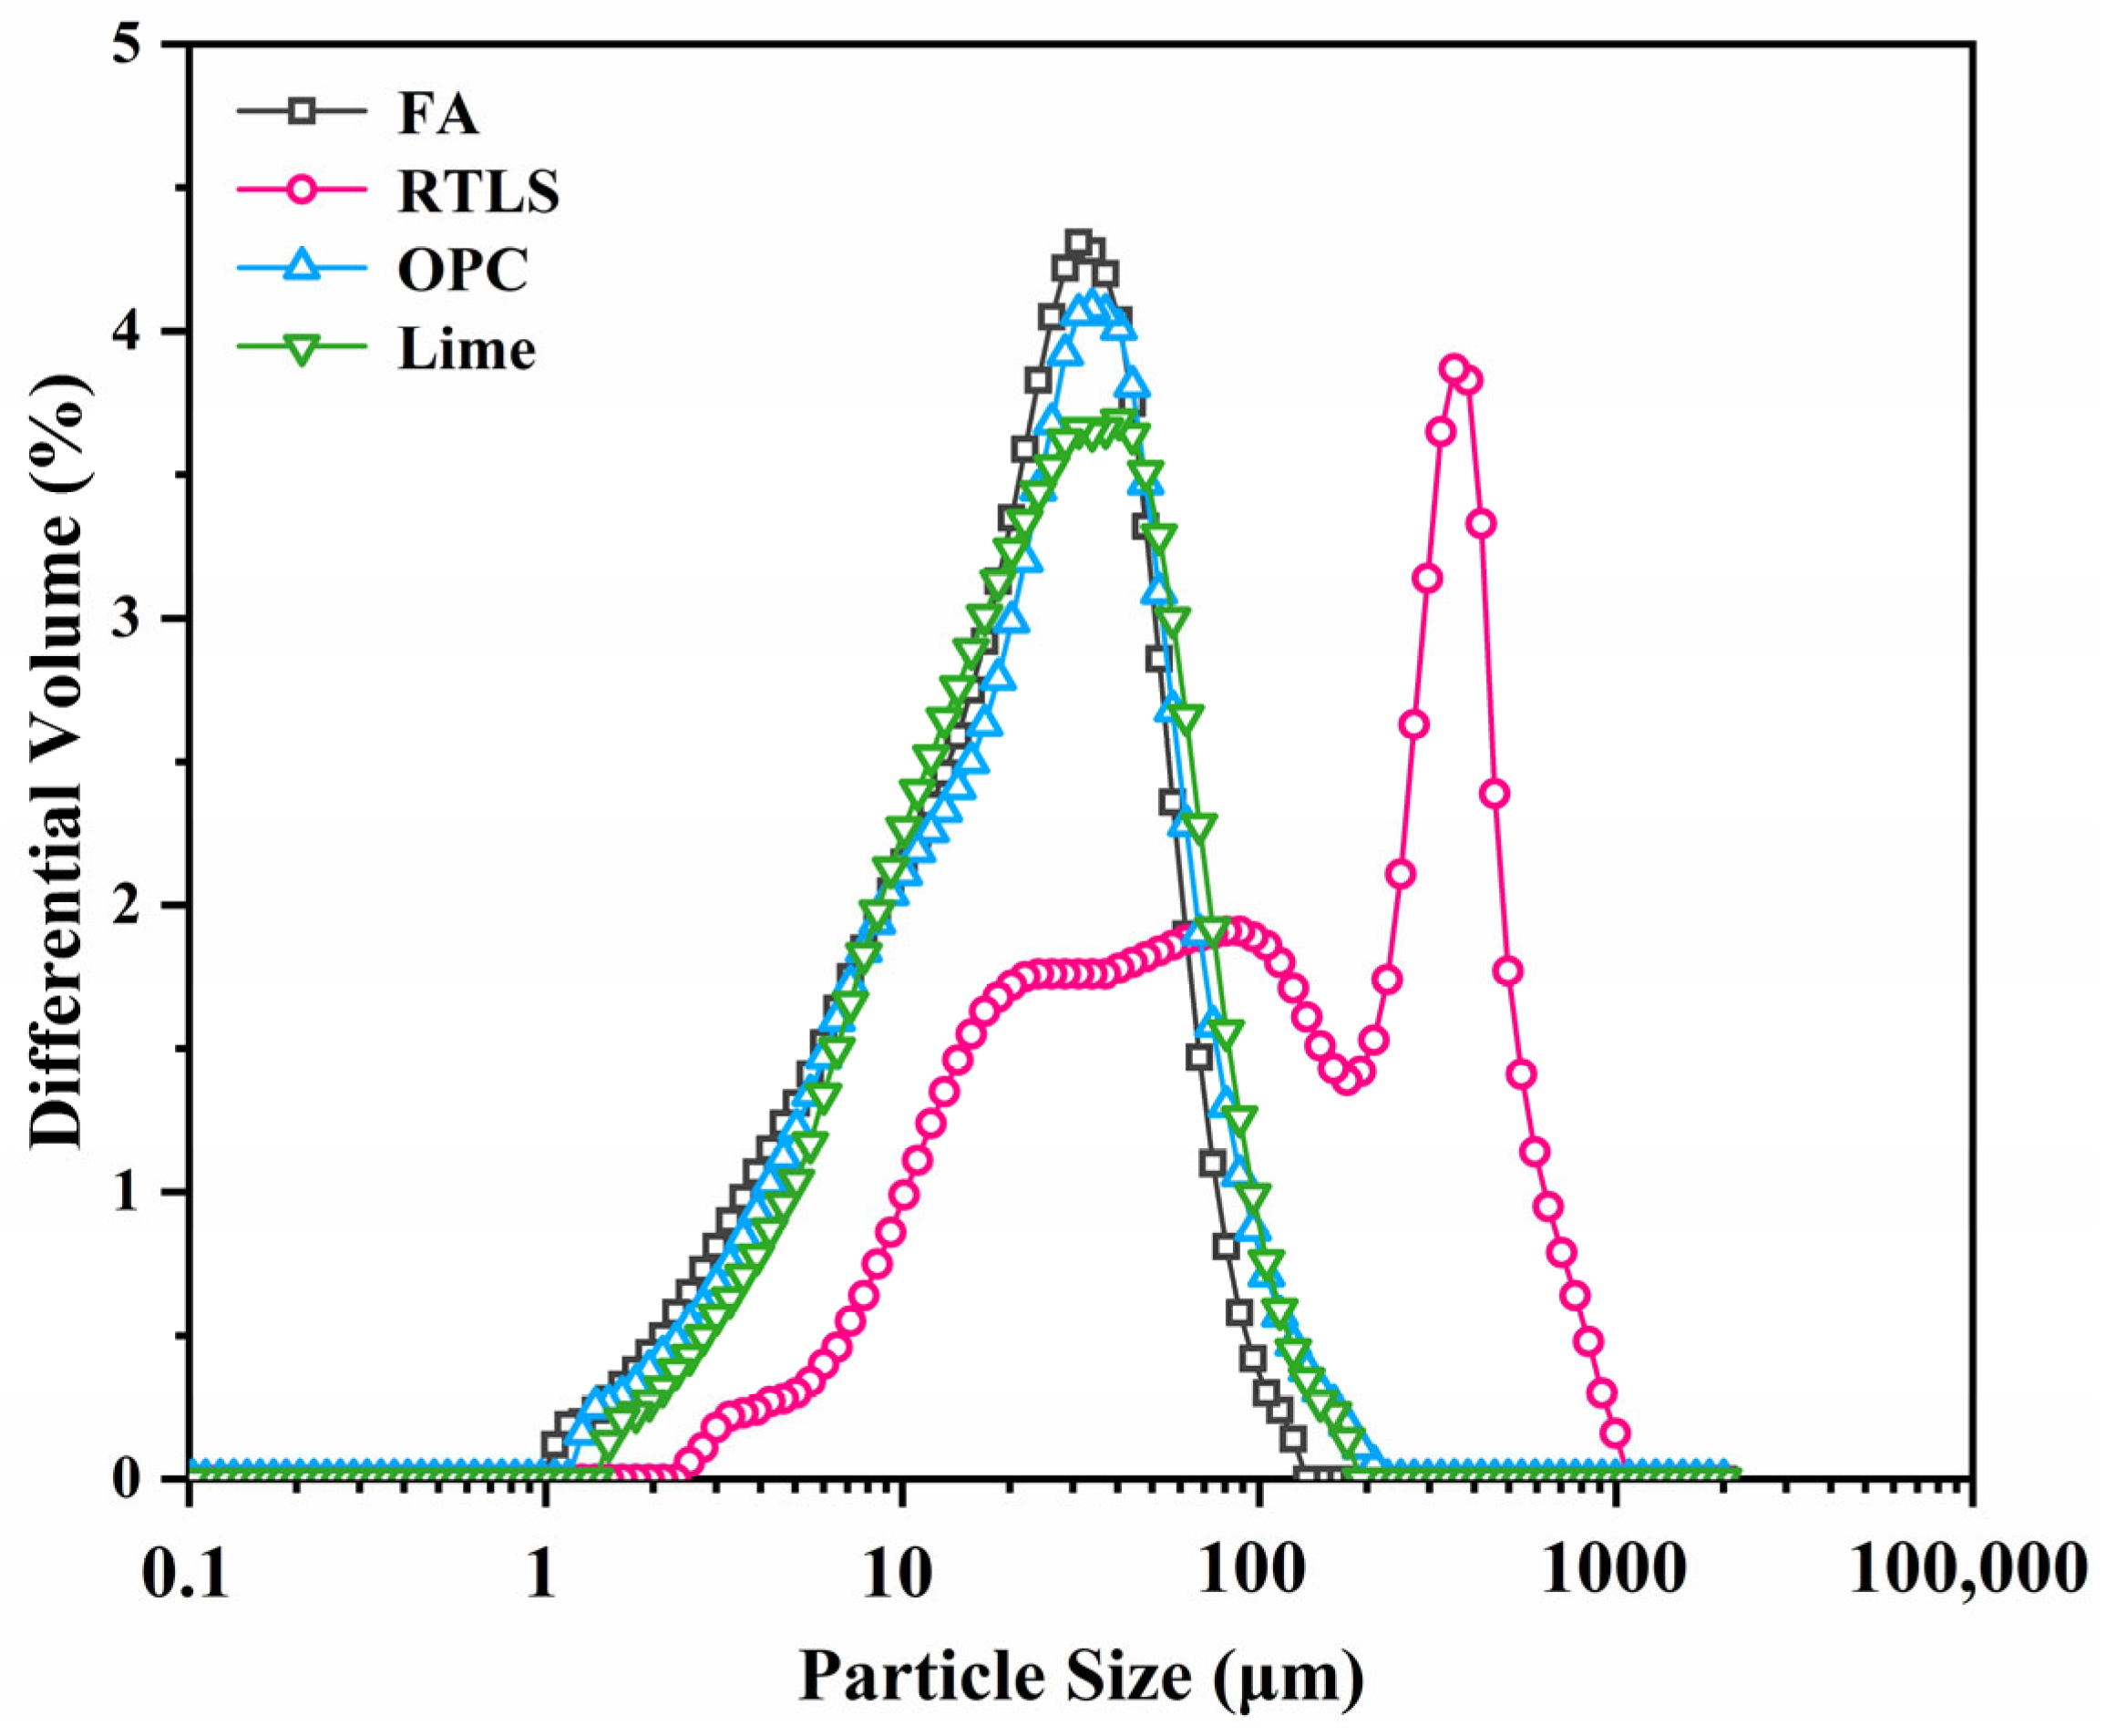
2.1. Materials
2.2. Sample Preparation
2.3. Tests and Methods
3. Results and Discussion
3.1. The Influence of Alkali, Sulfate and Fluoride on the Performance of Glass in FA with the Coexistence of Lime
3.2. Viscosity and Foaming Performance of Slurry
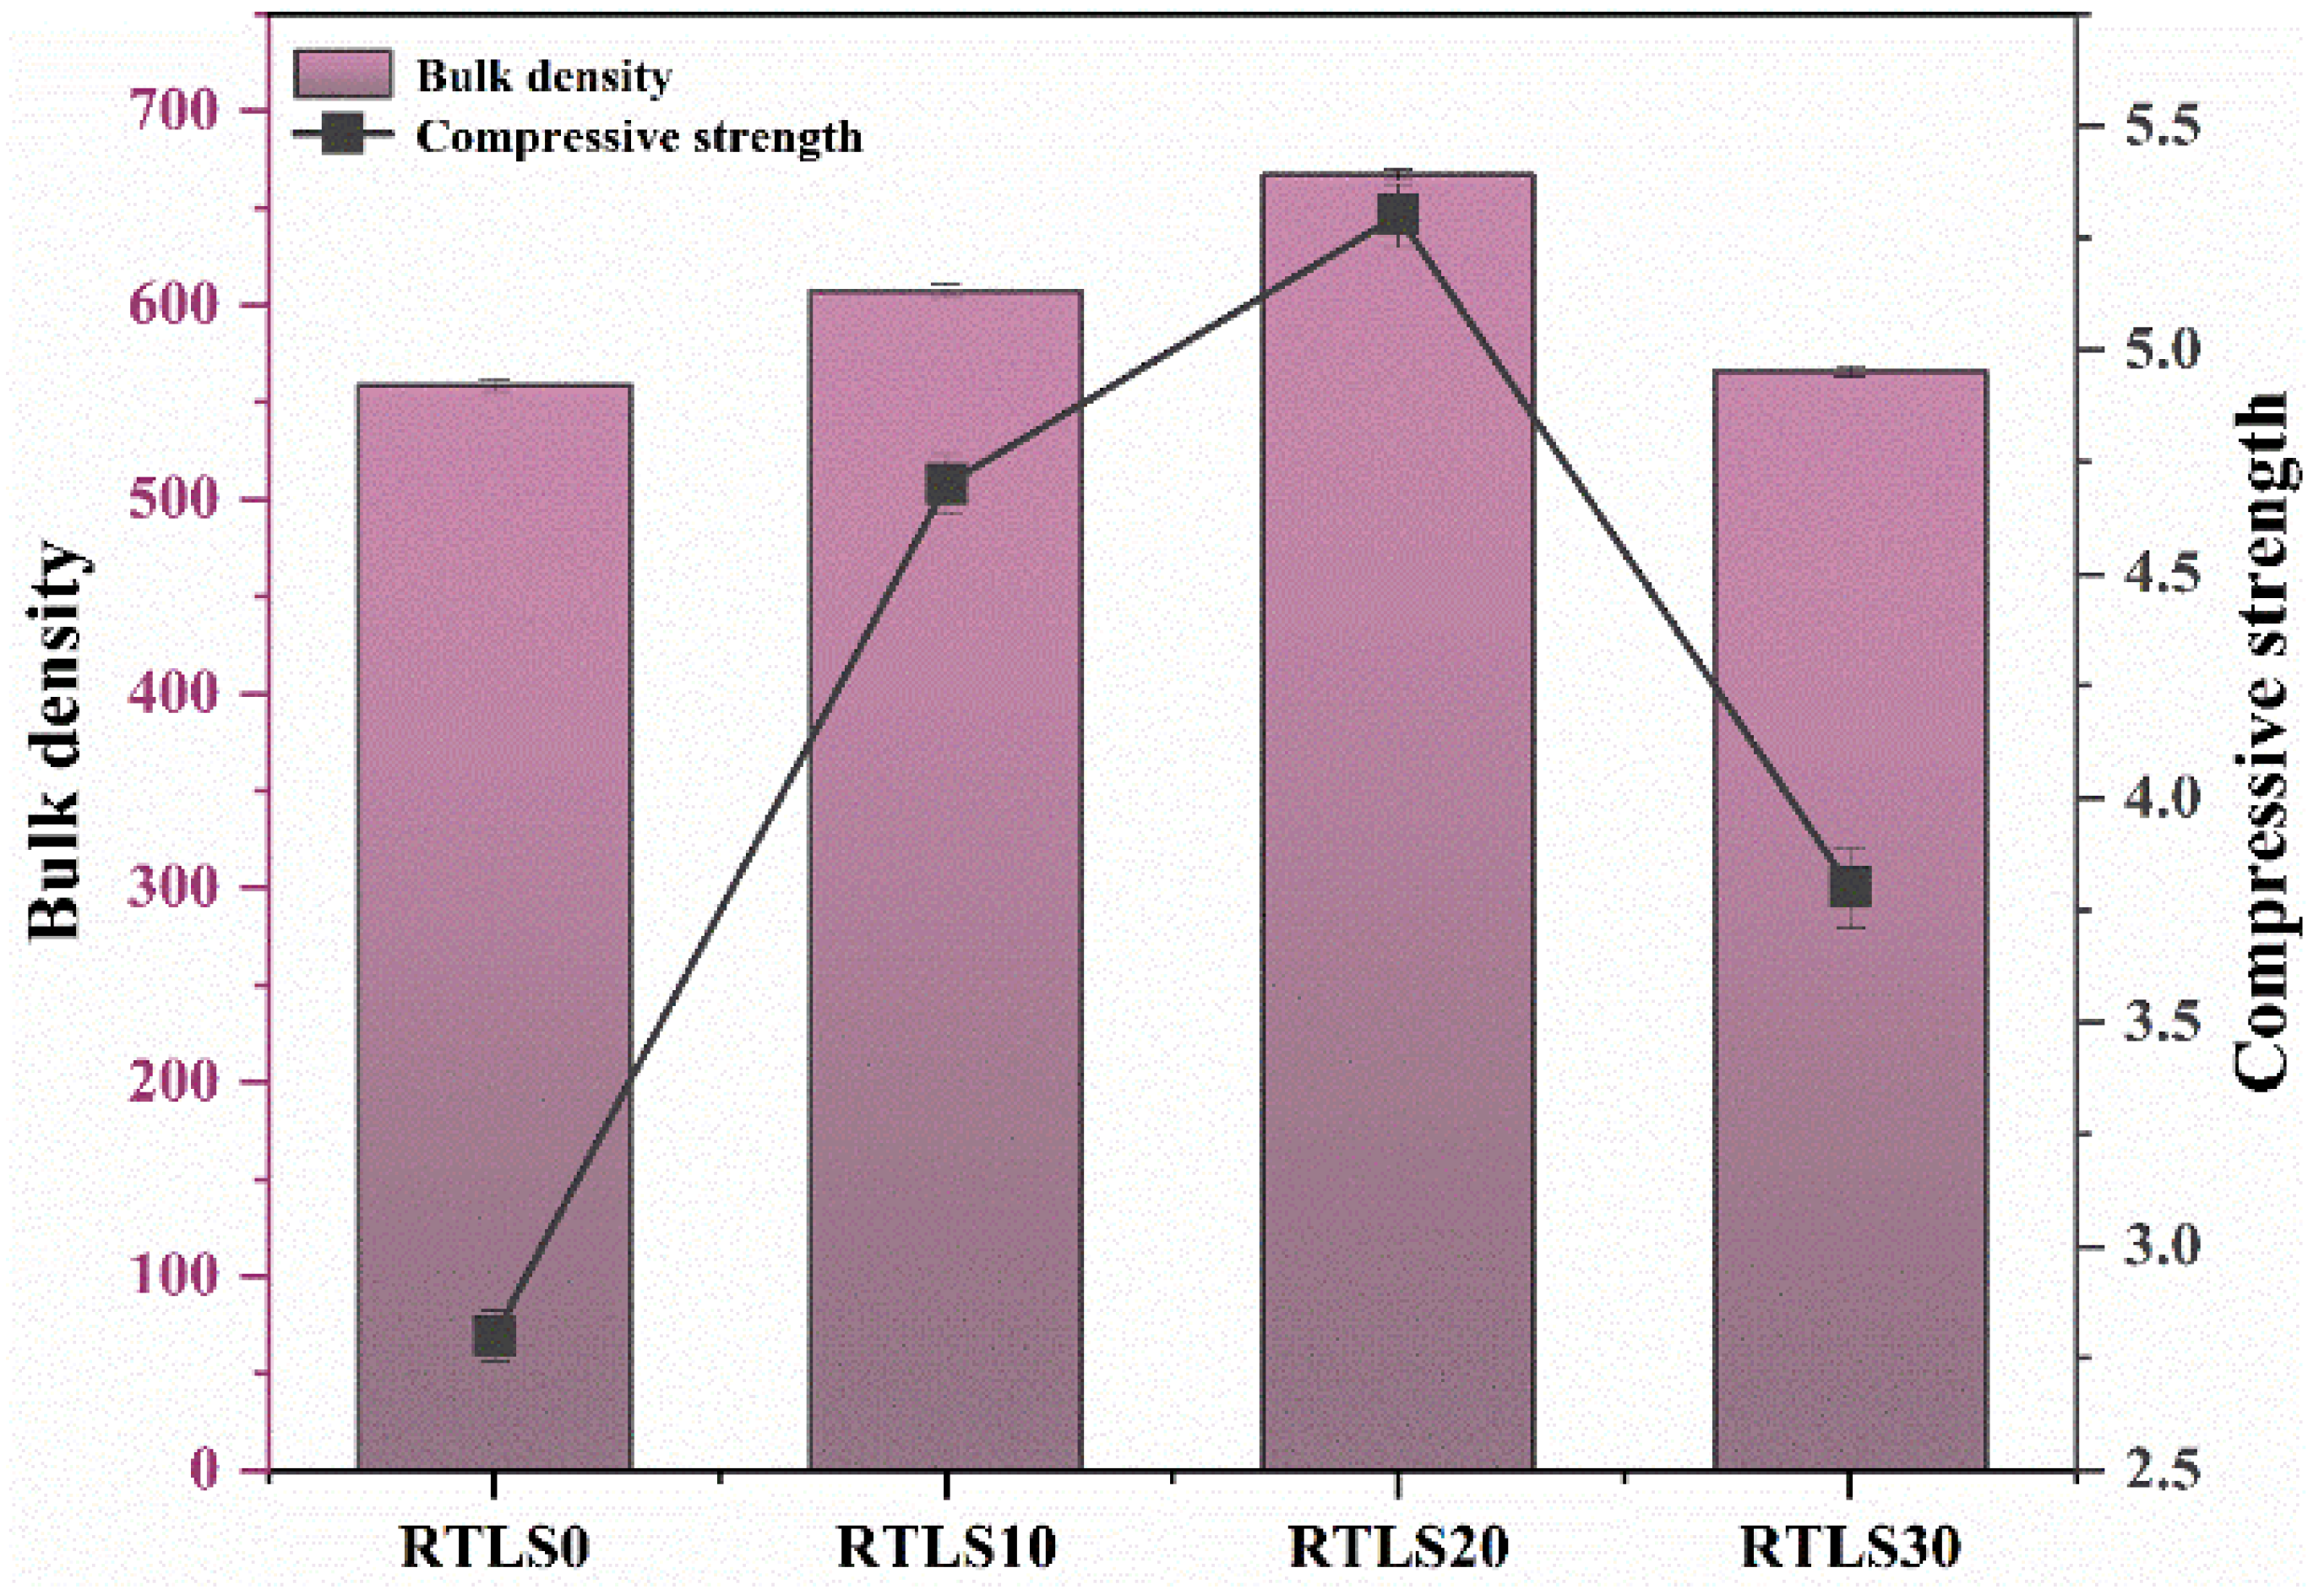
3.3. Compressive Strength
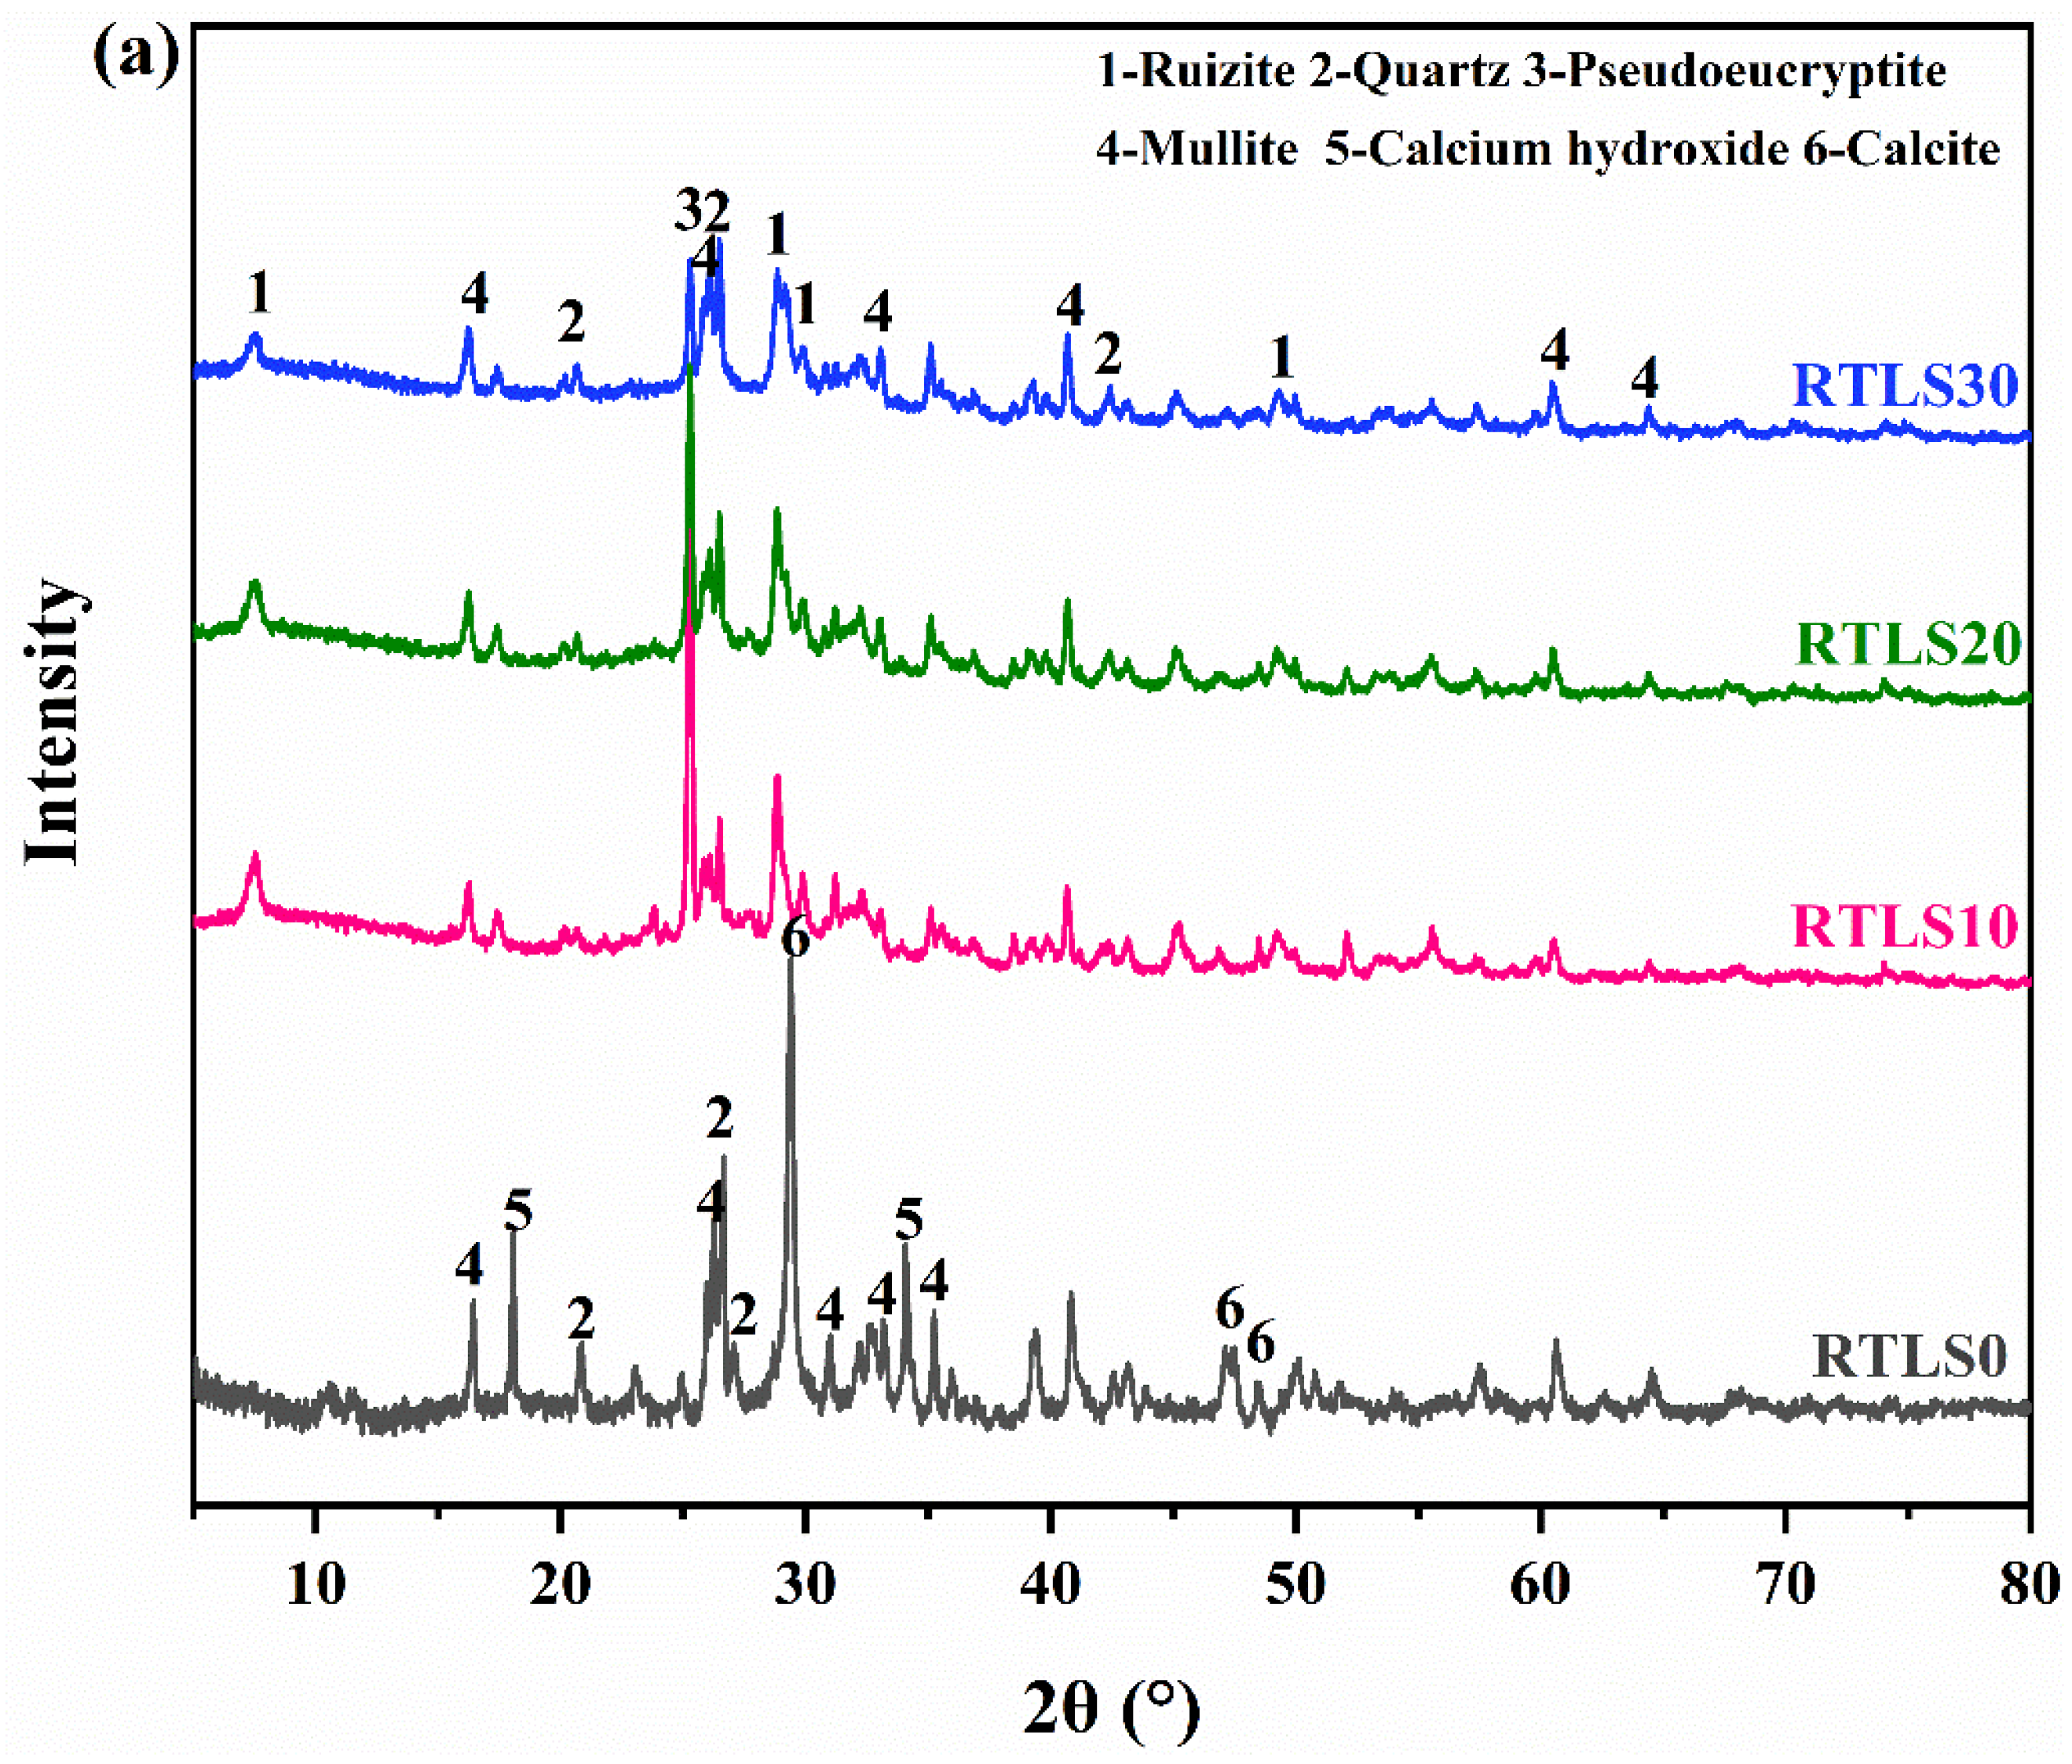
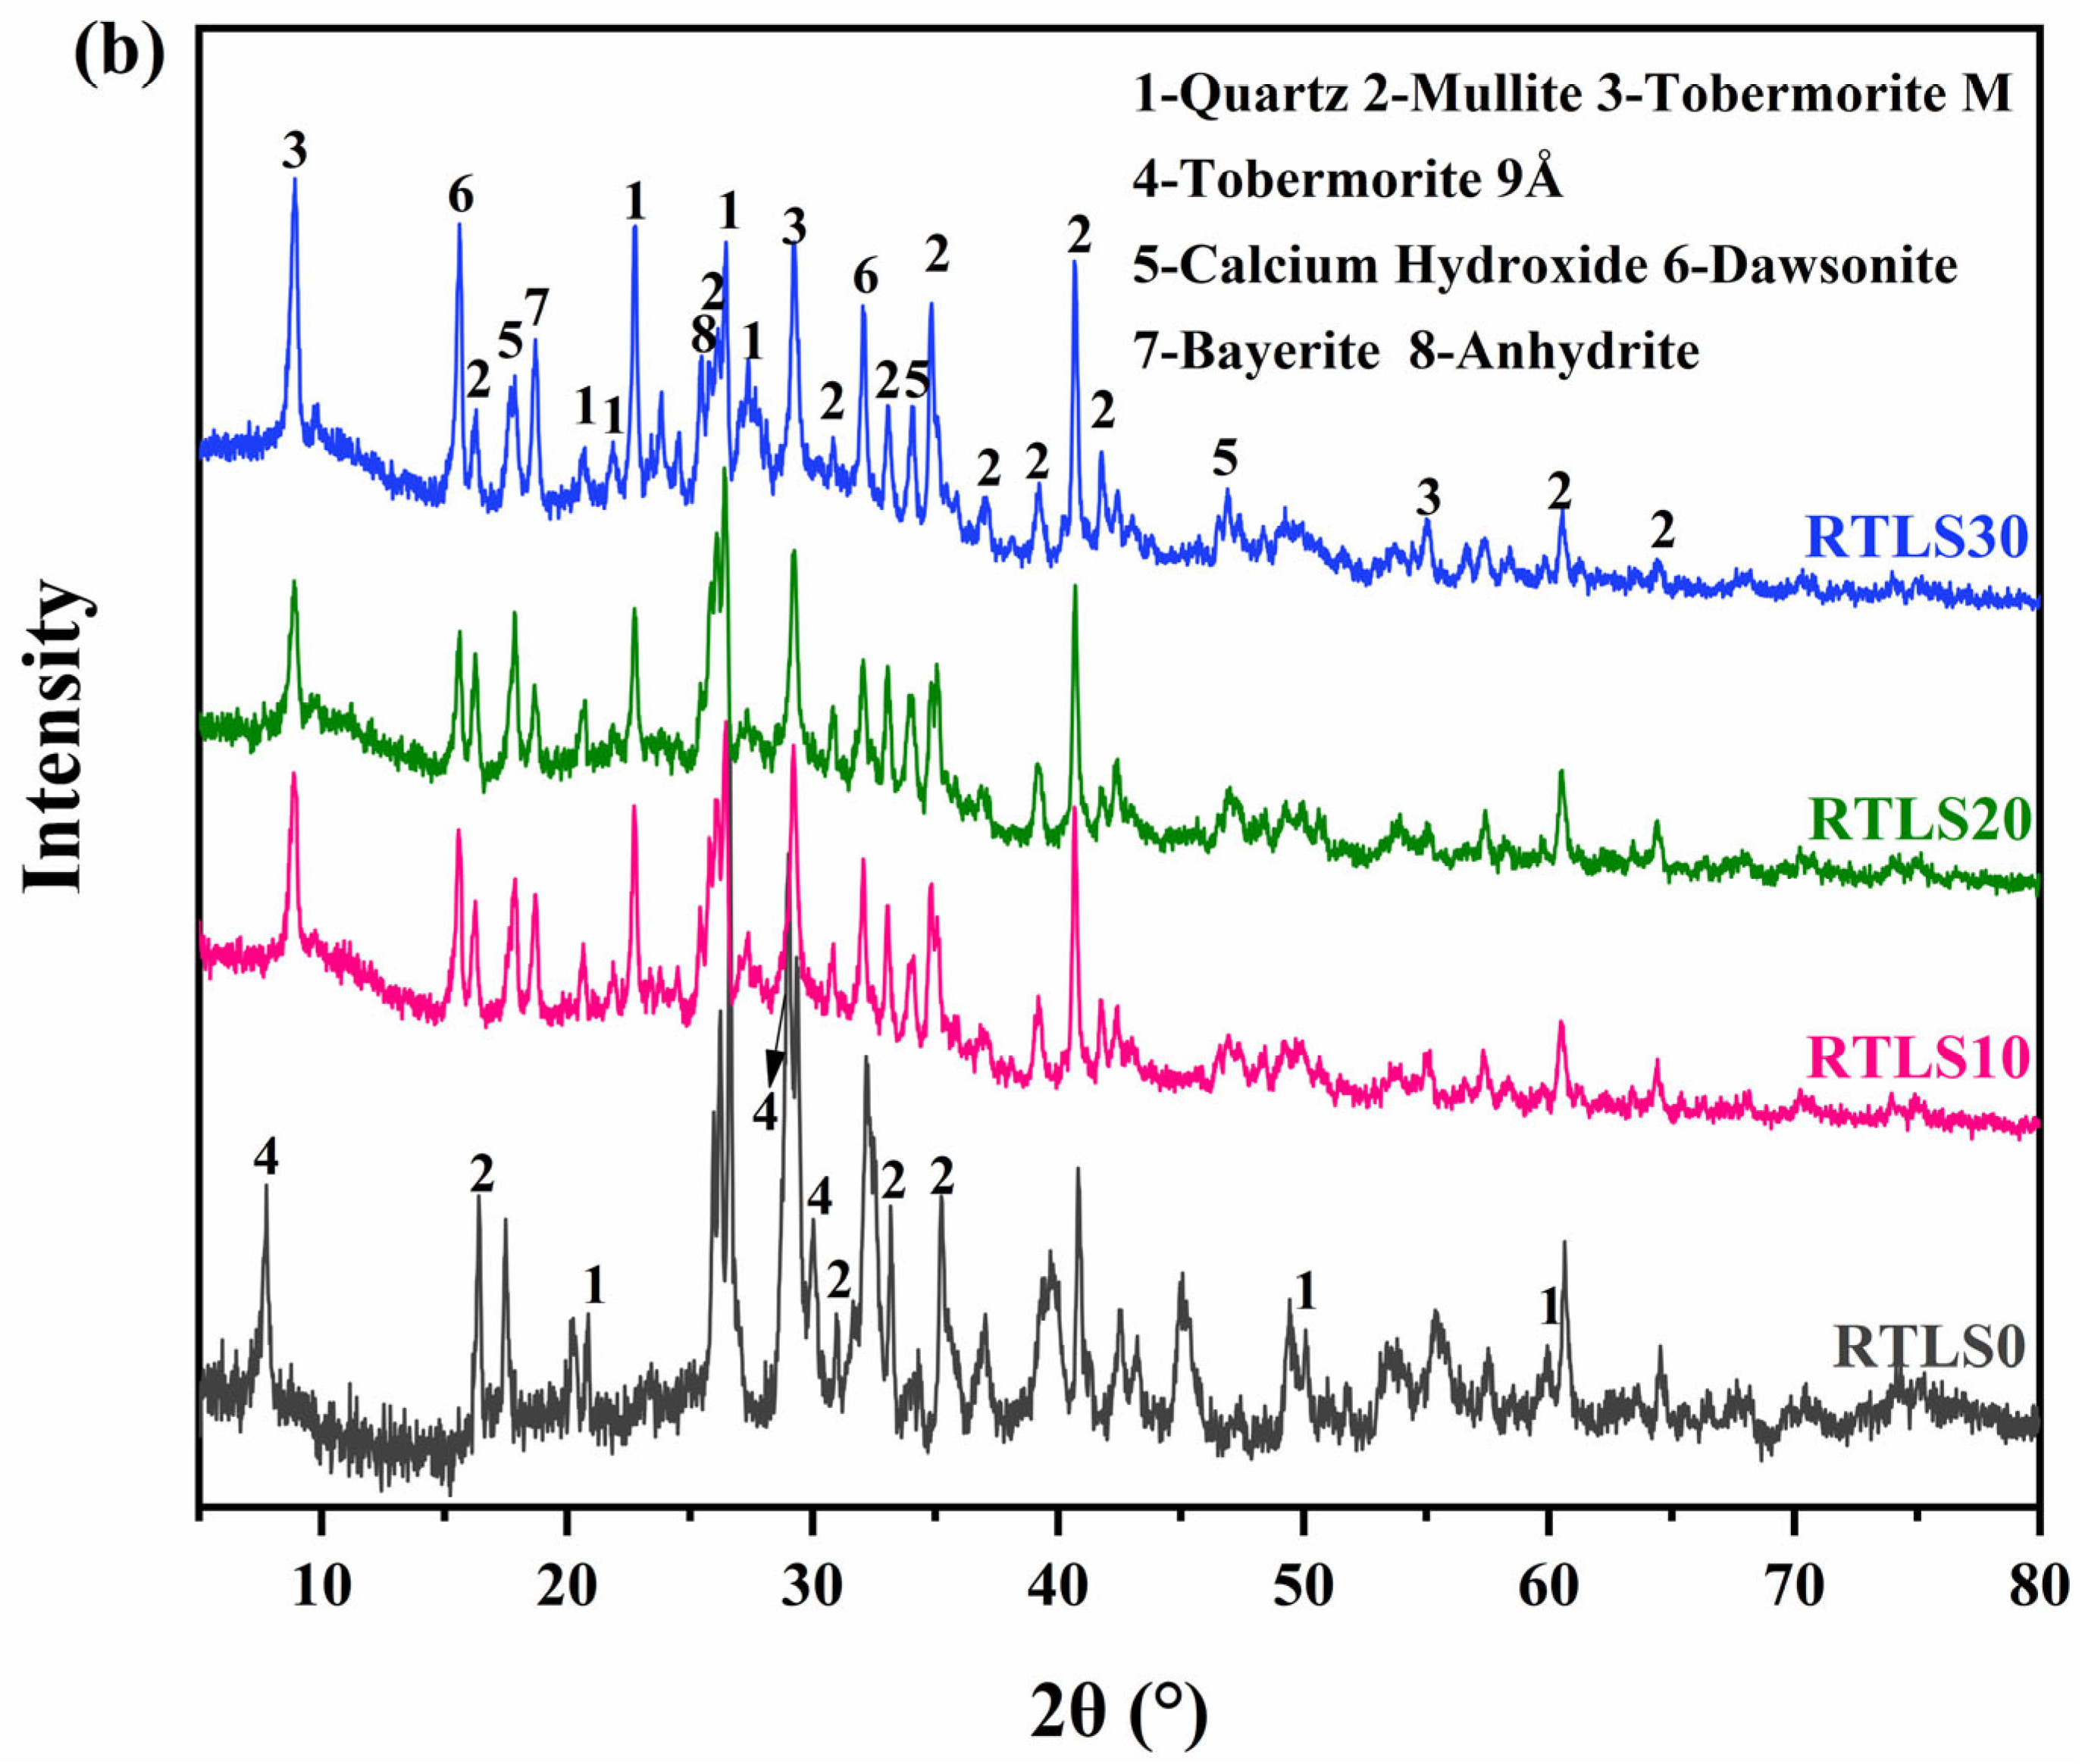
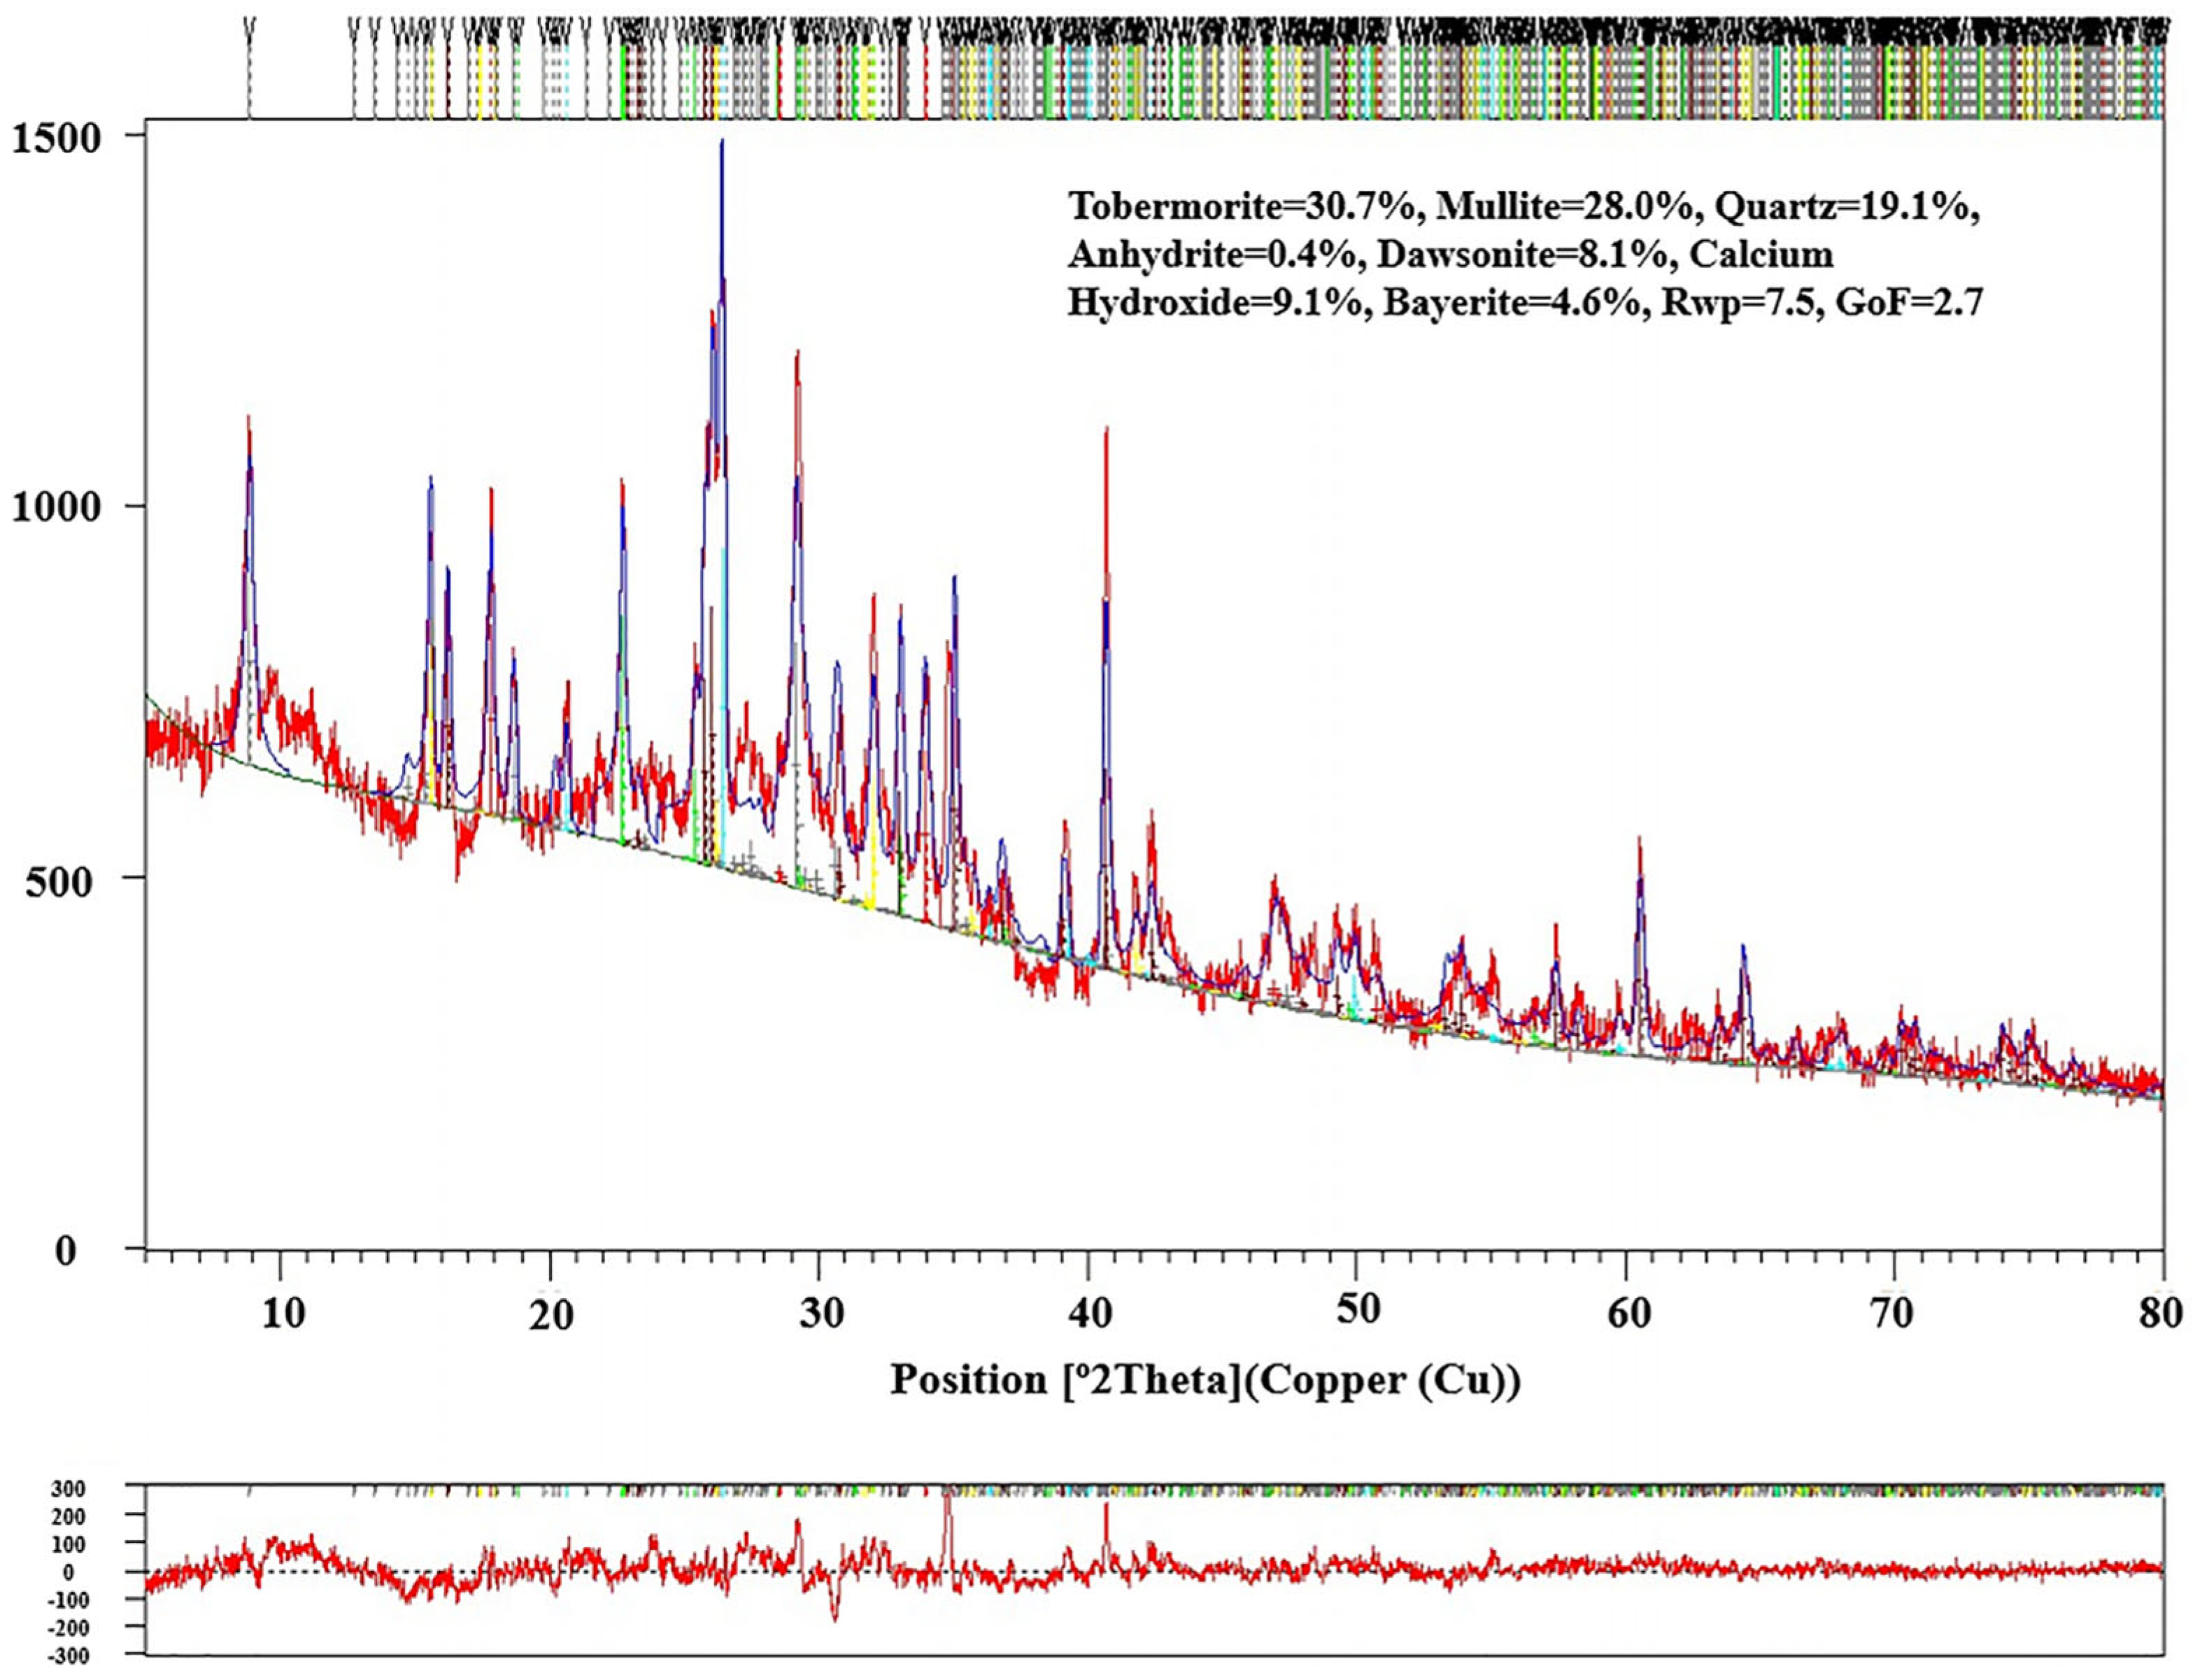
3.4. XRD Results
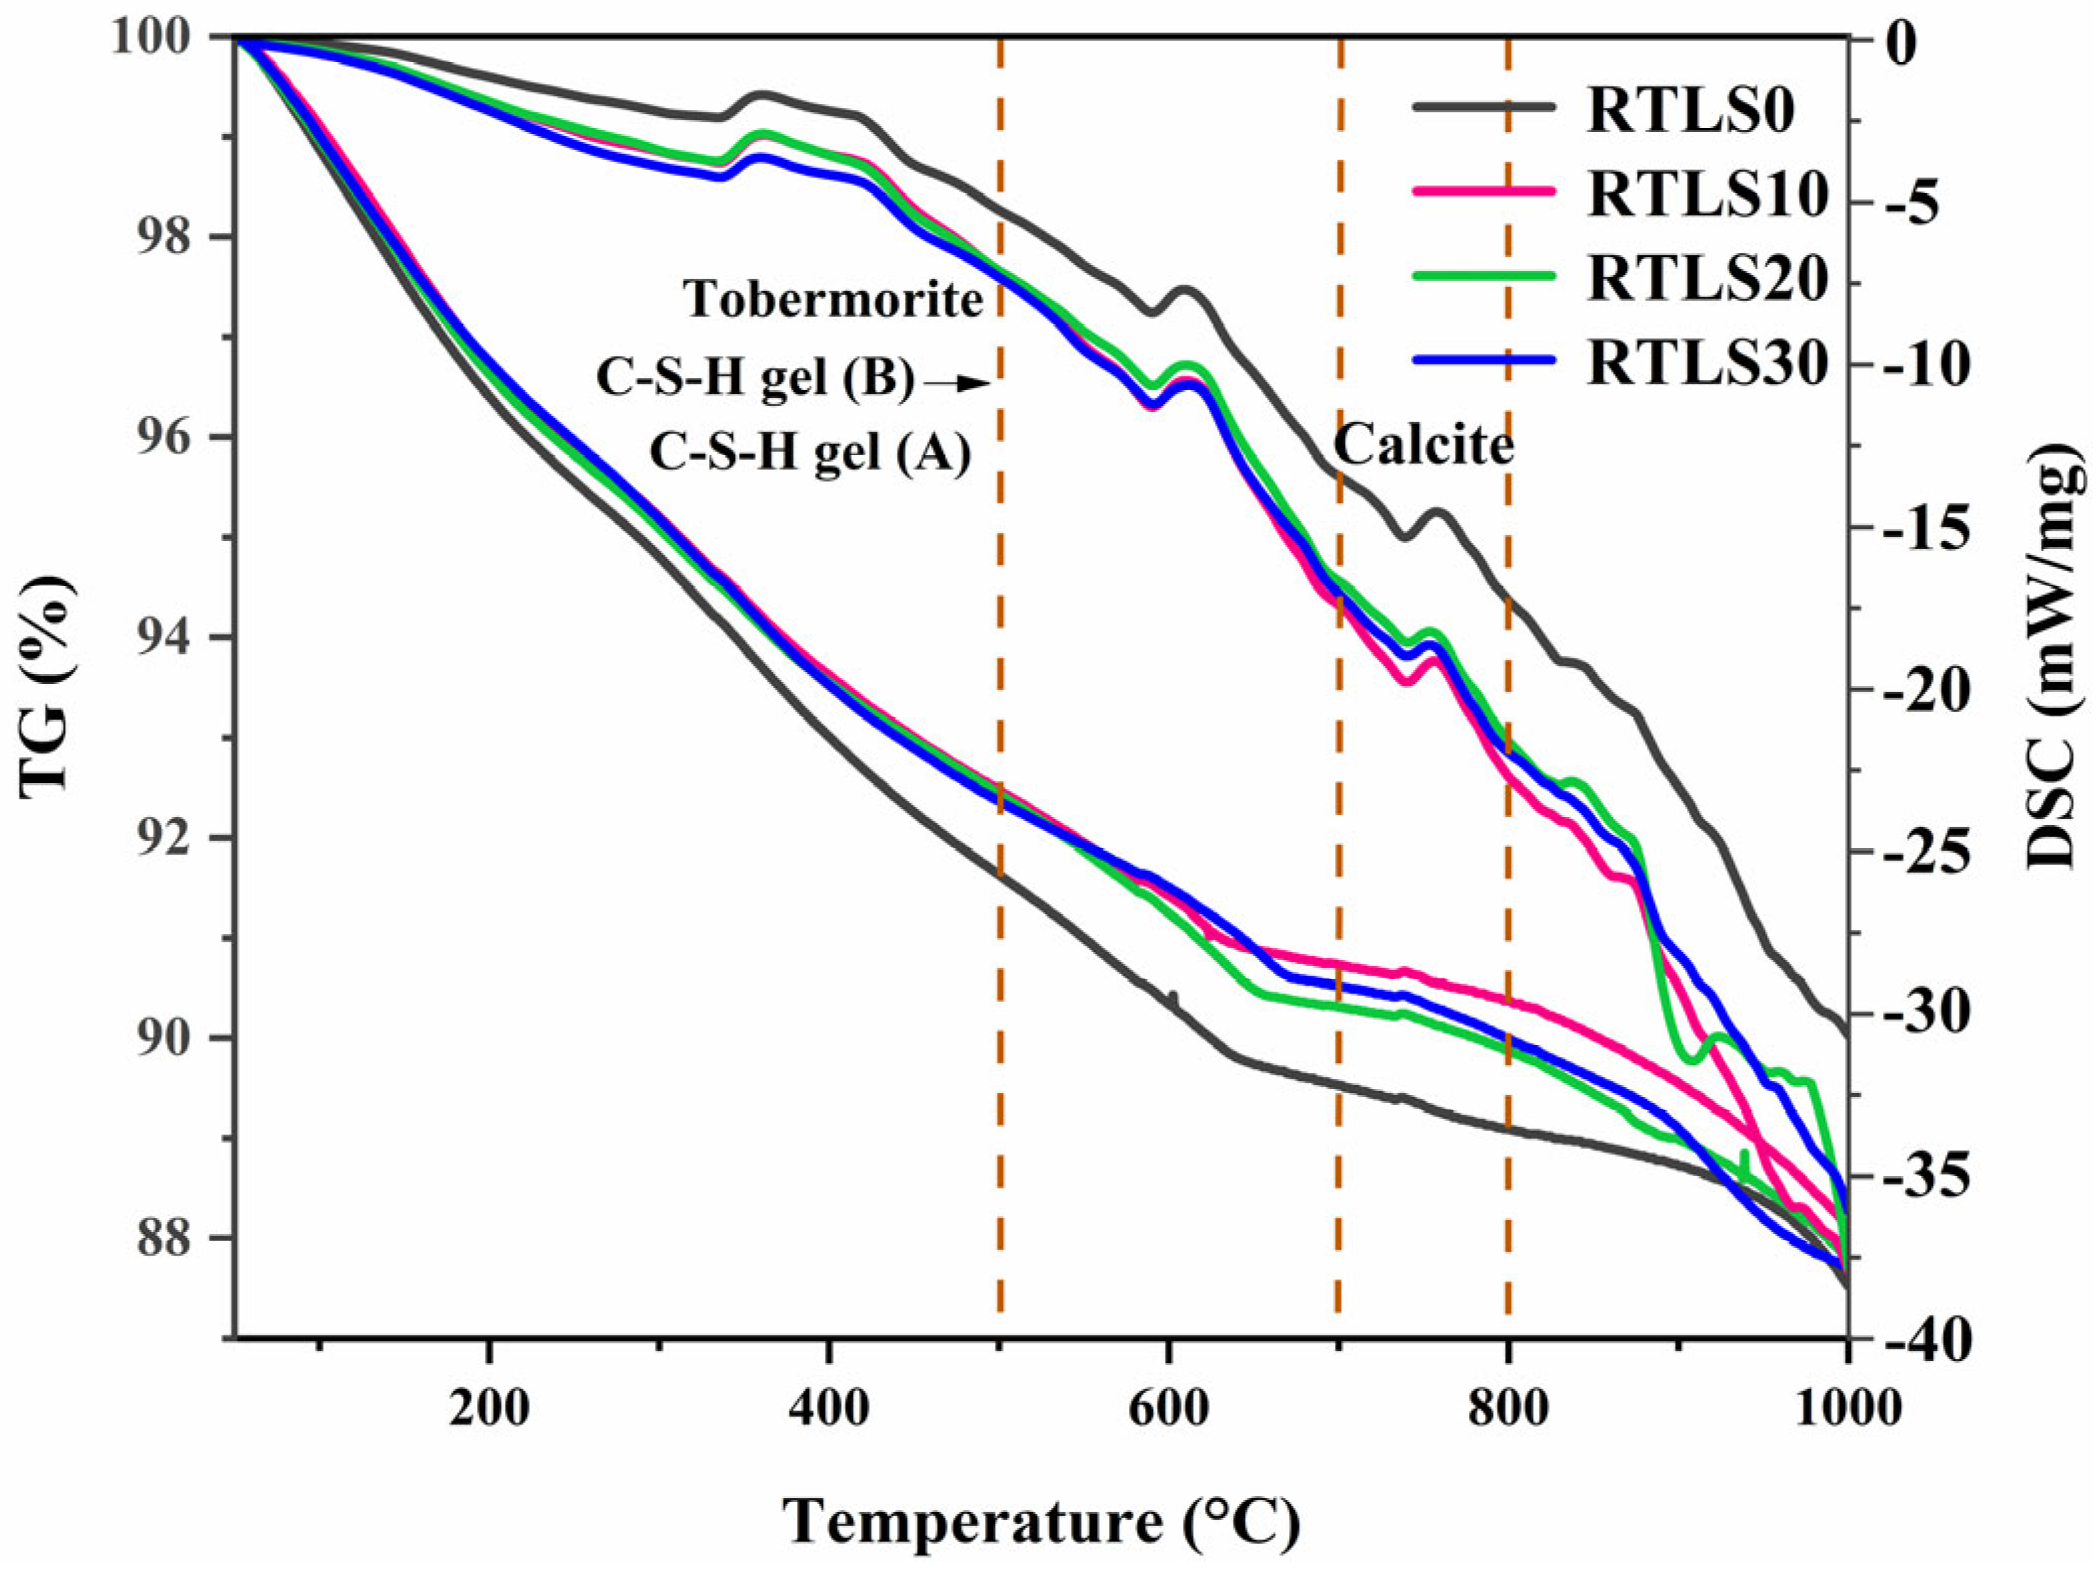
3.5. TG/DSC
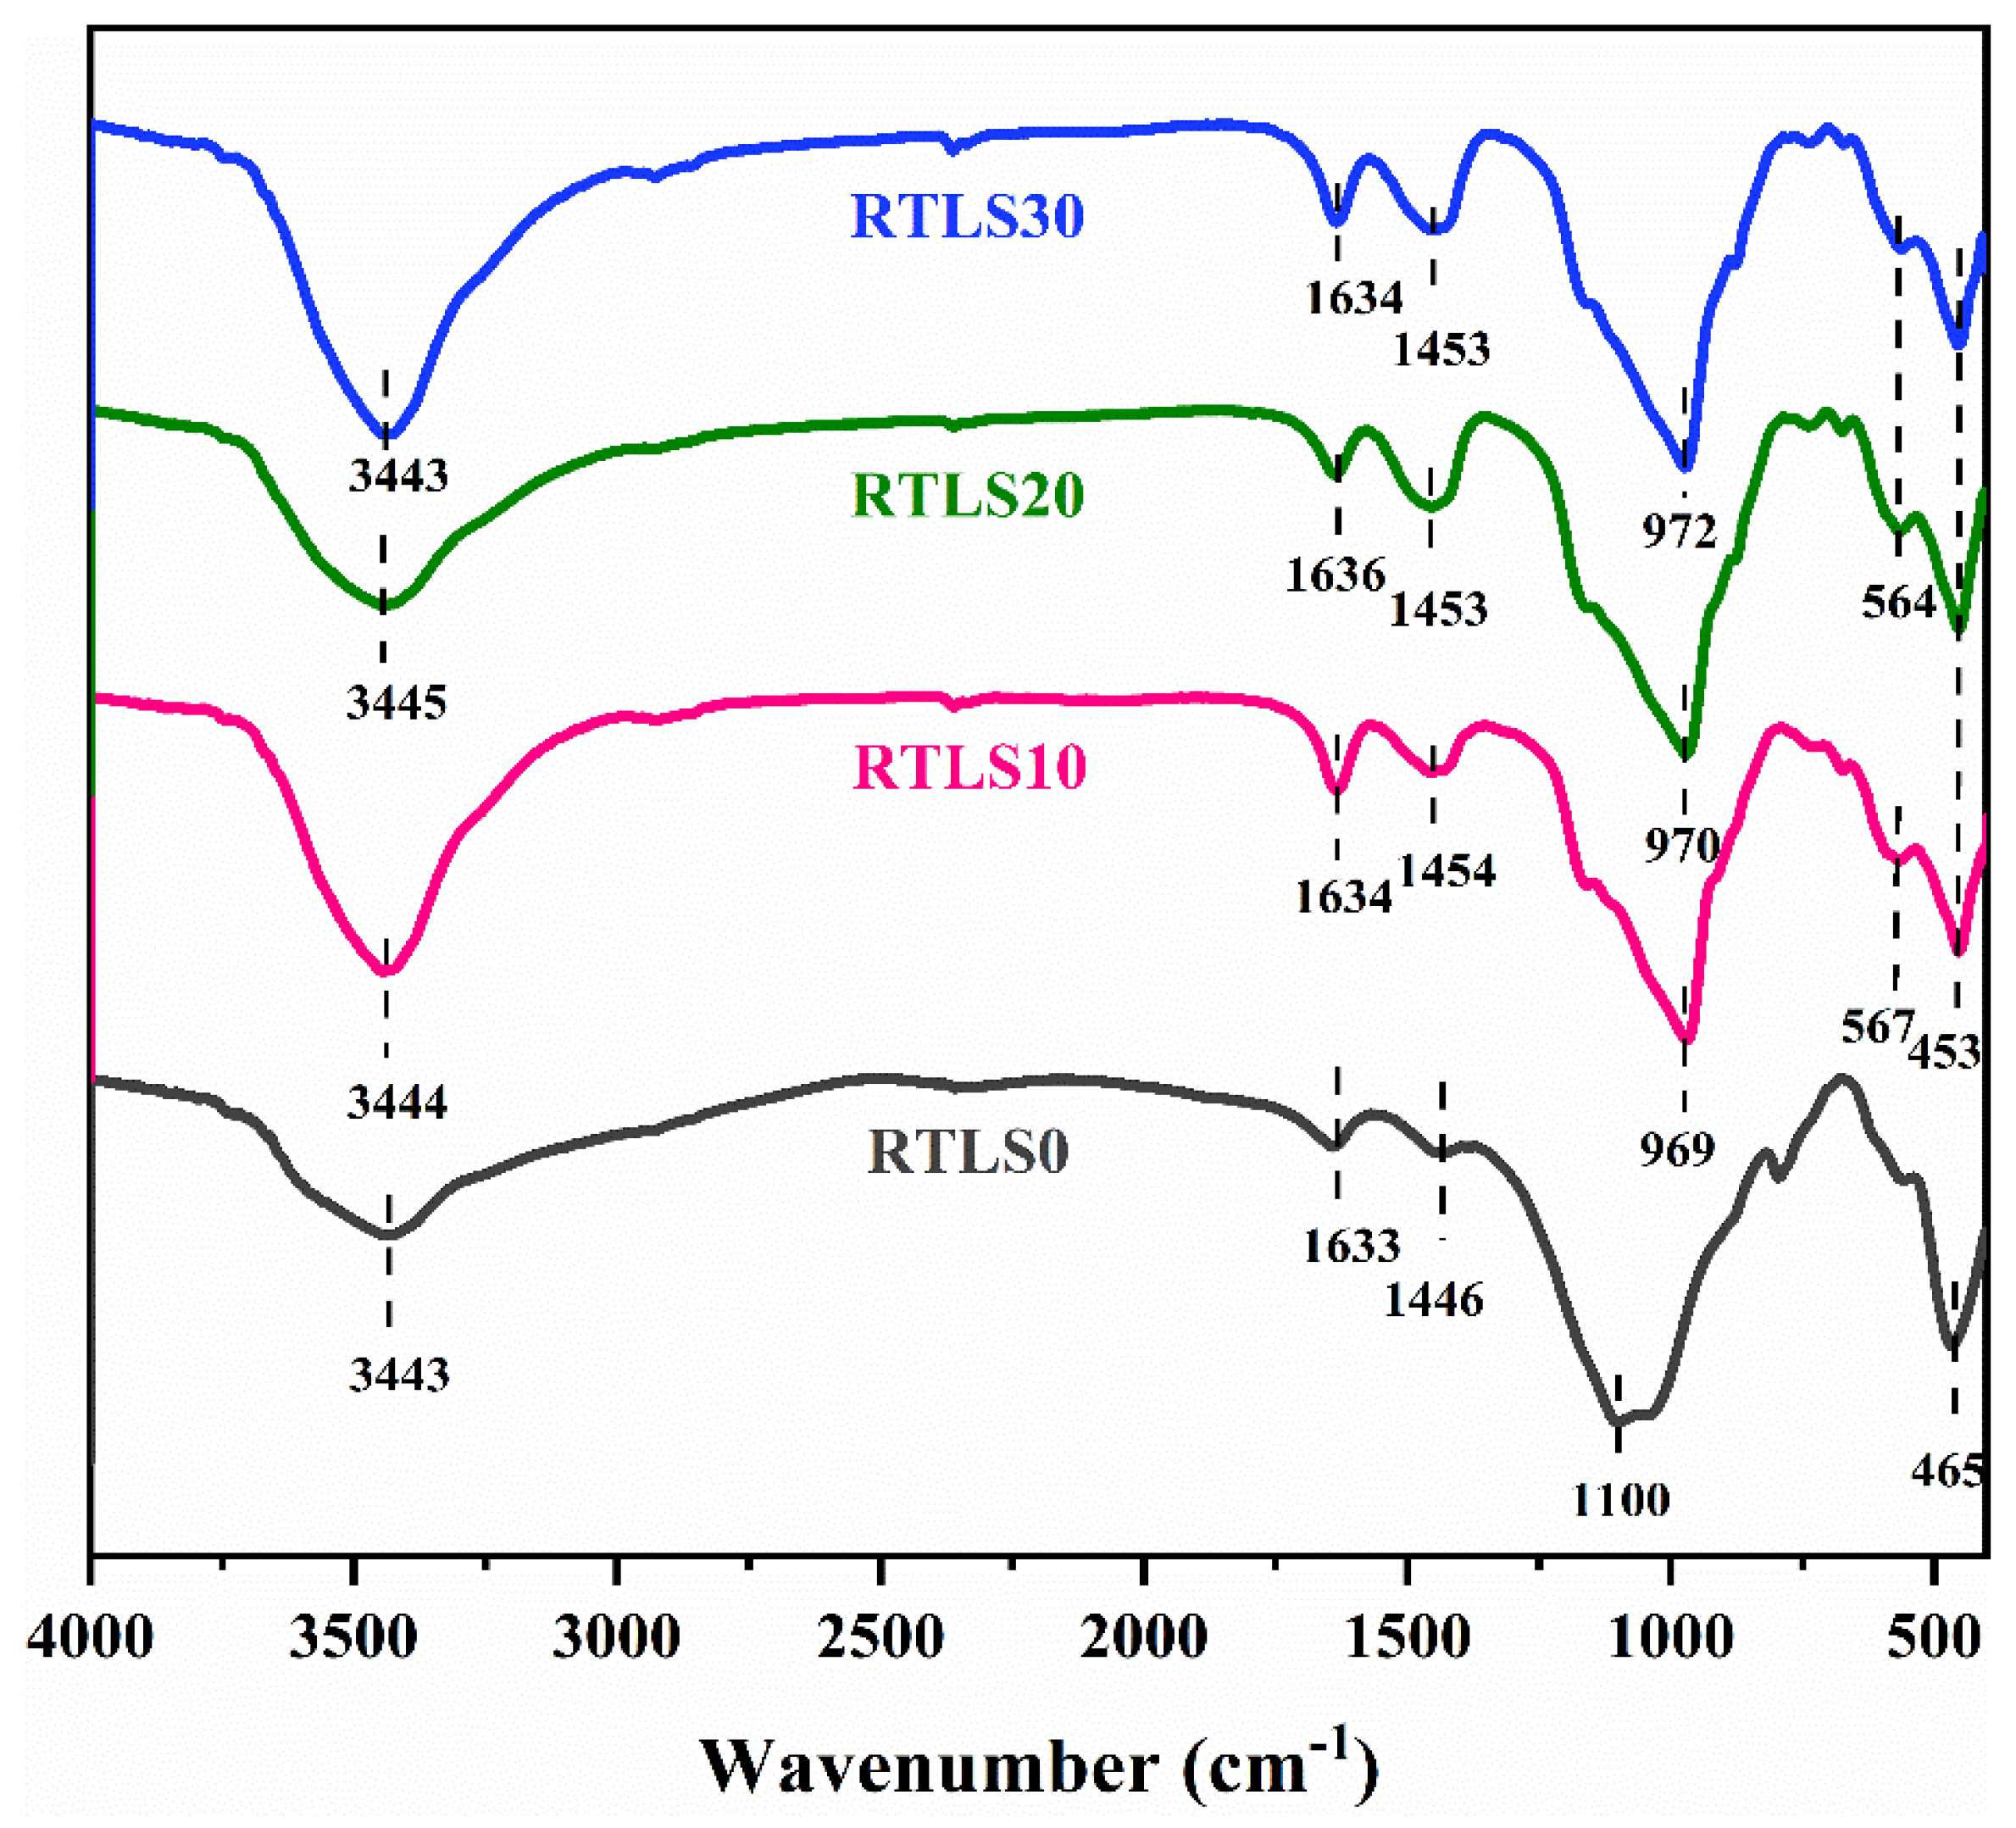
3.6. FTIR
3.7. SEM and EDS Analysis
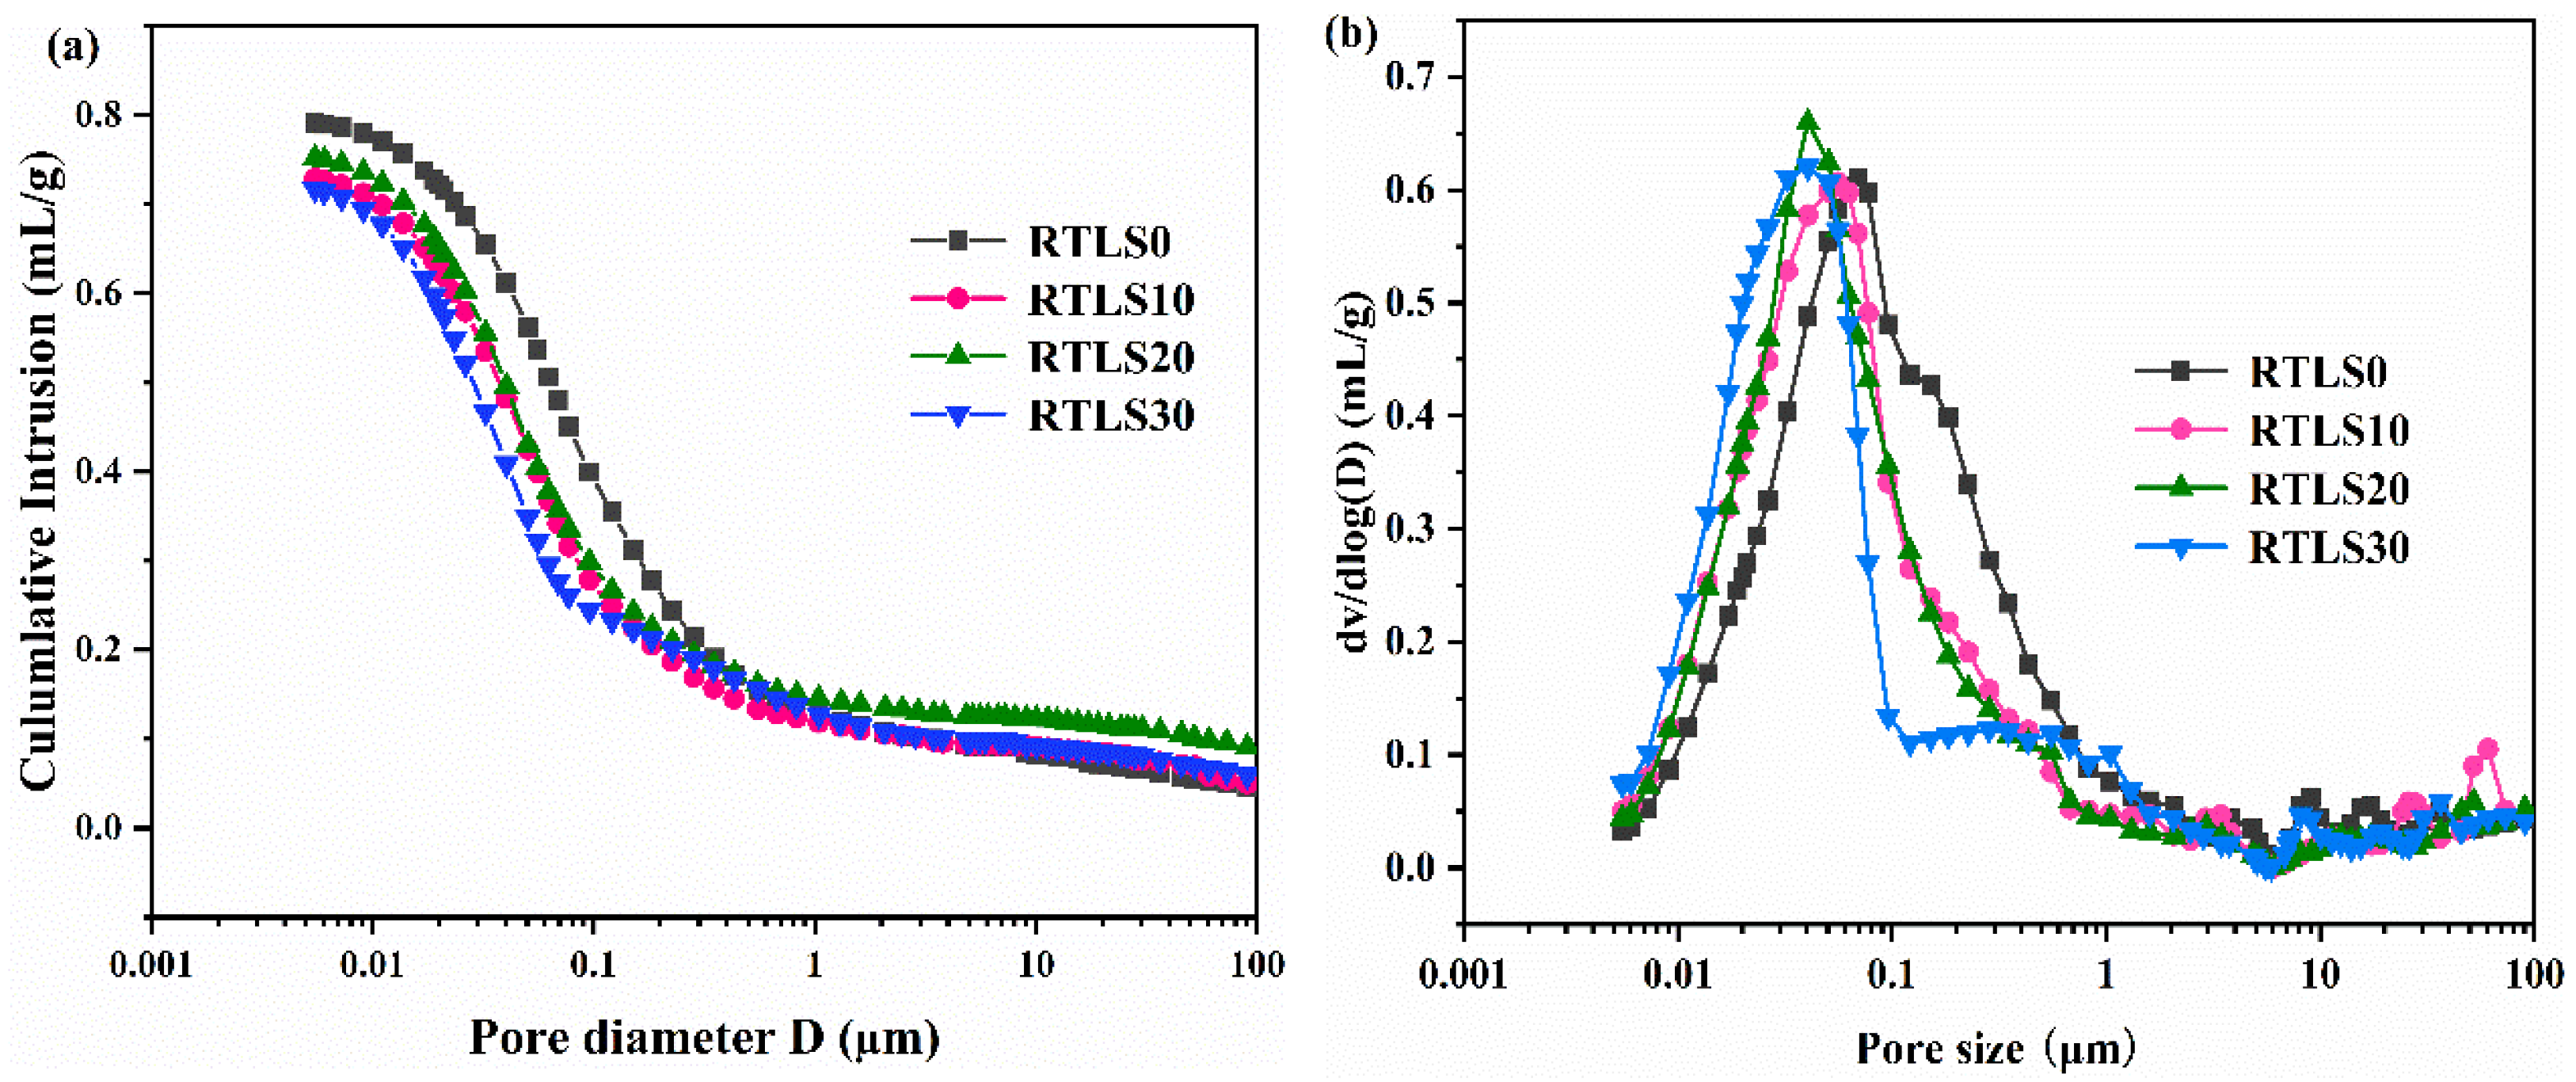
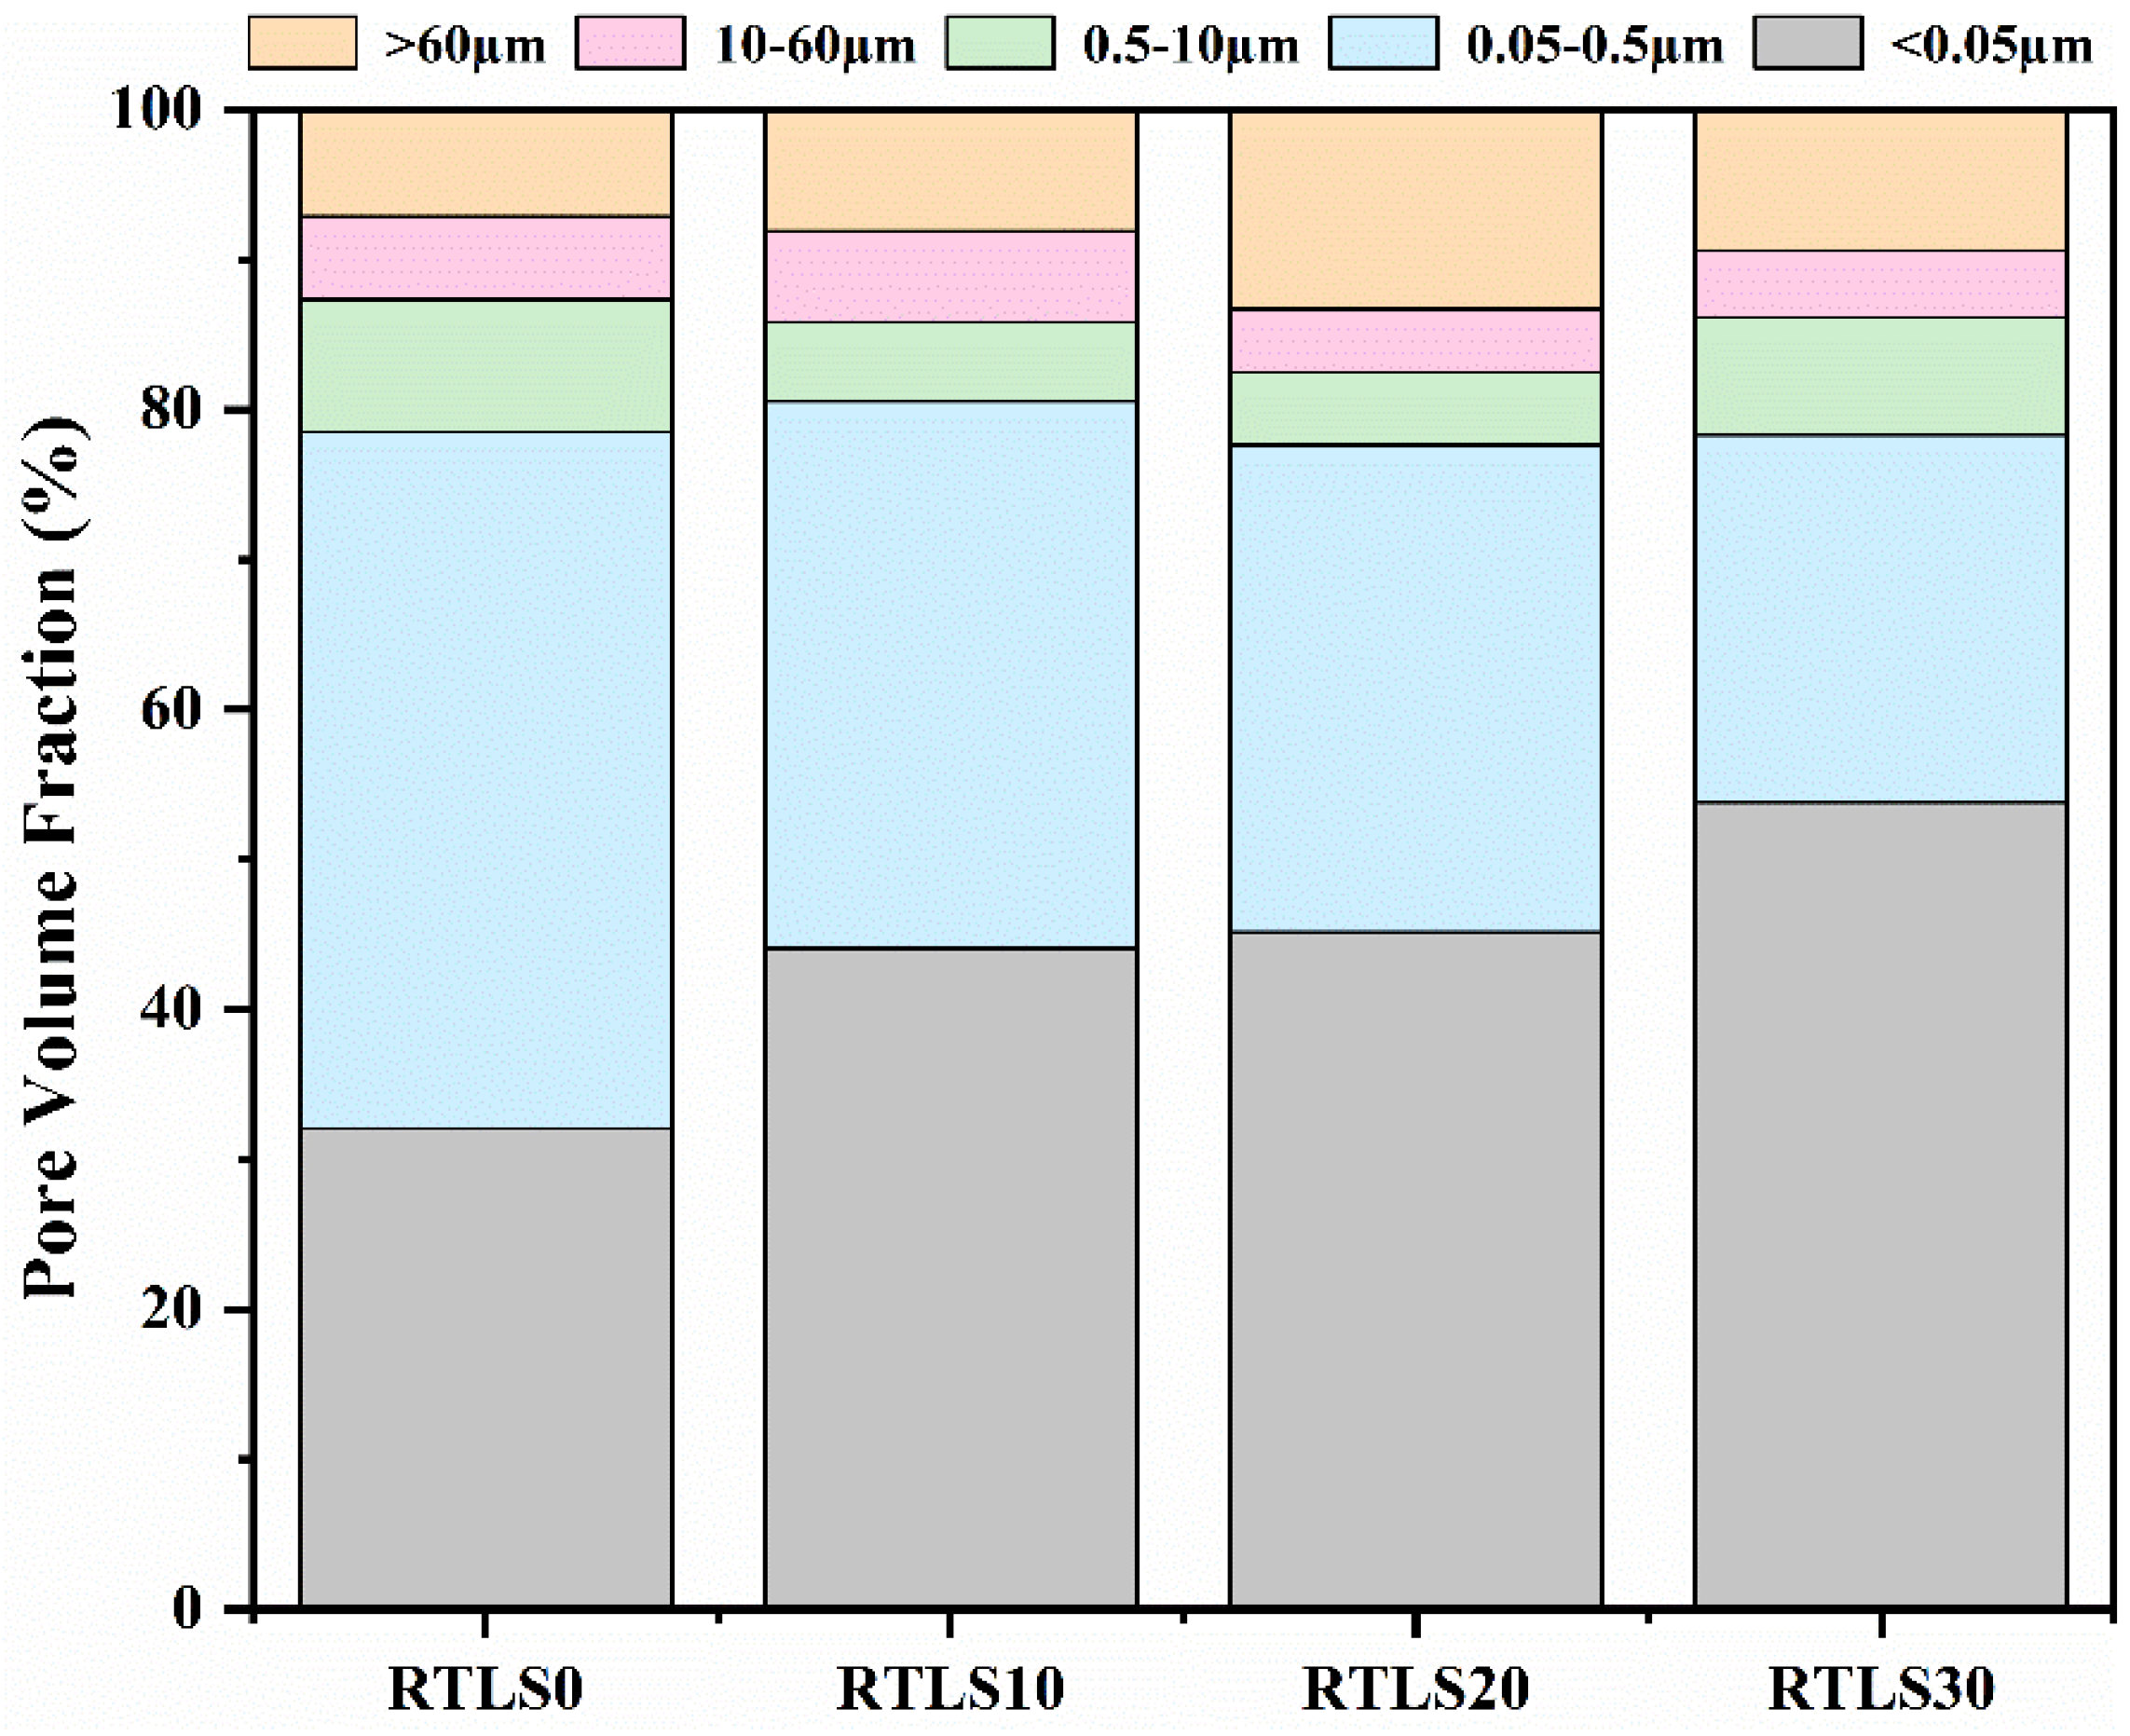
3.8. MIP Analysis of the Samples
4. Discussion
5. Conclusions
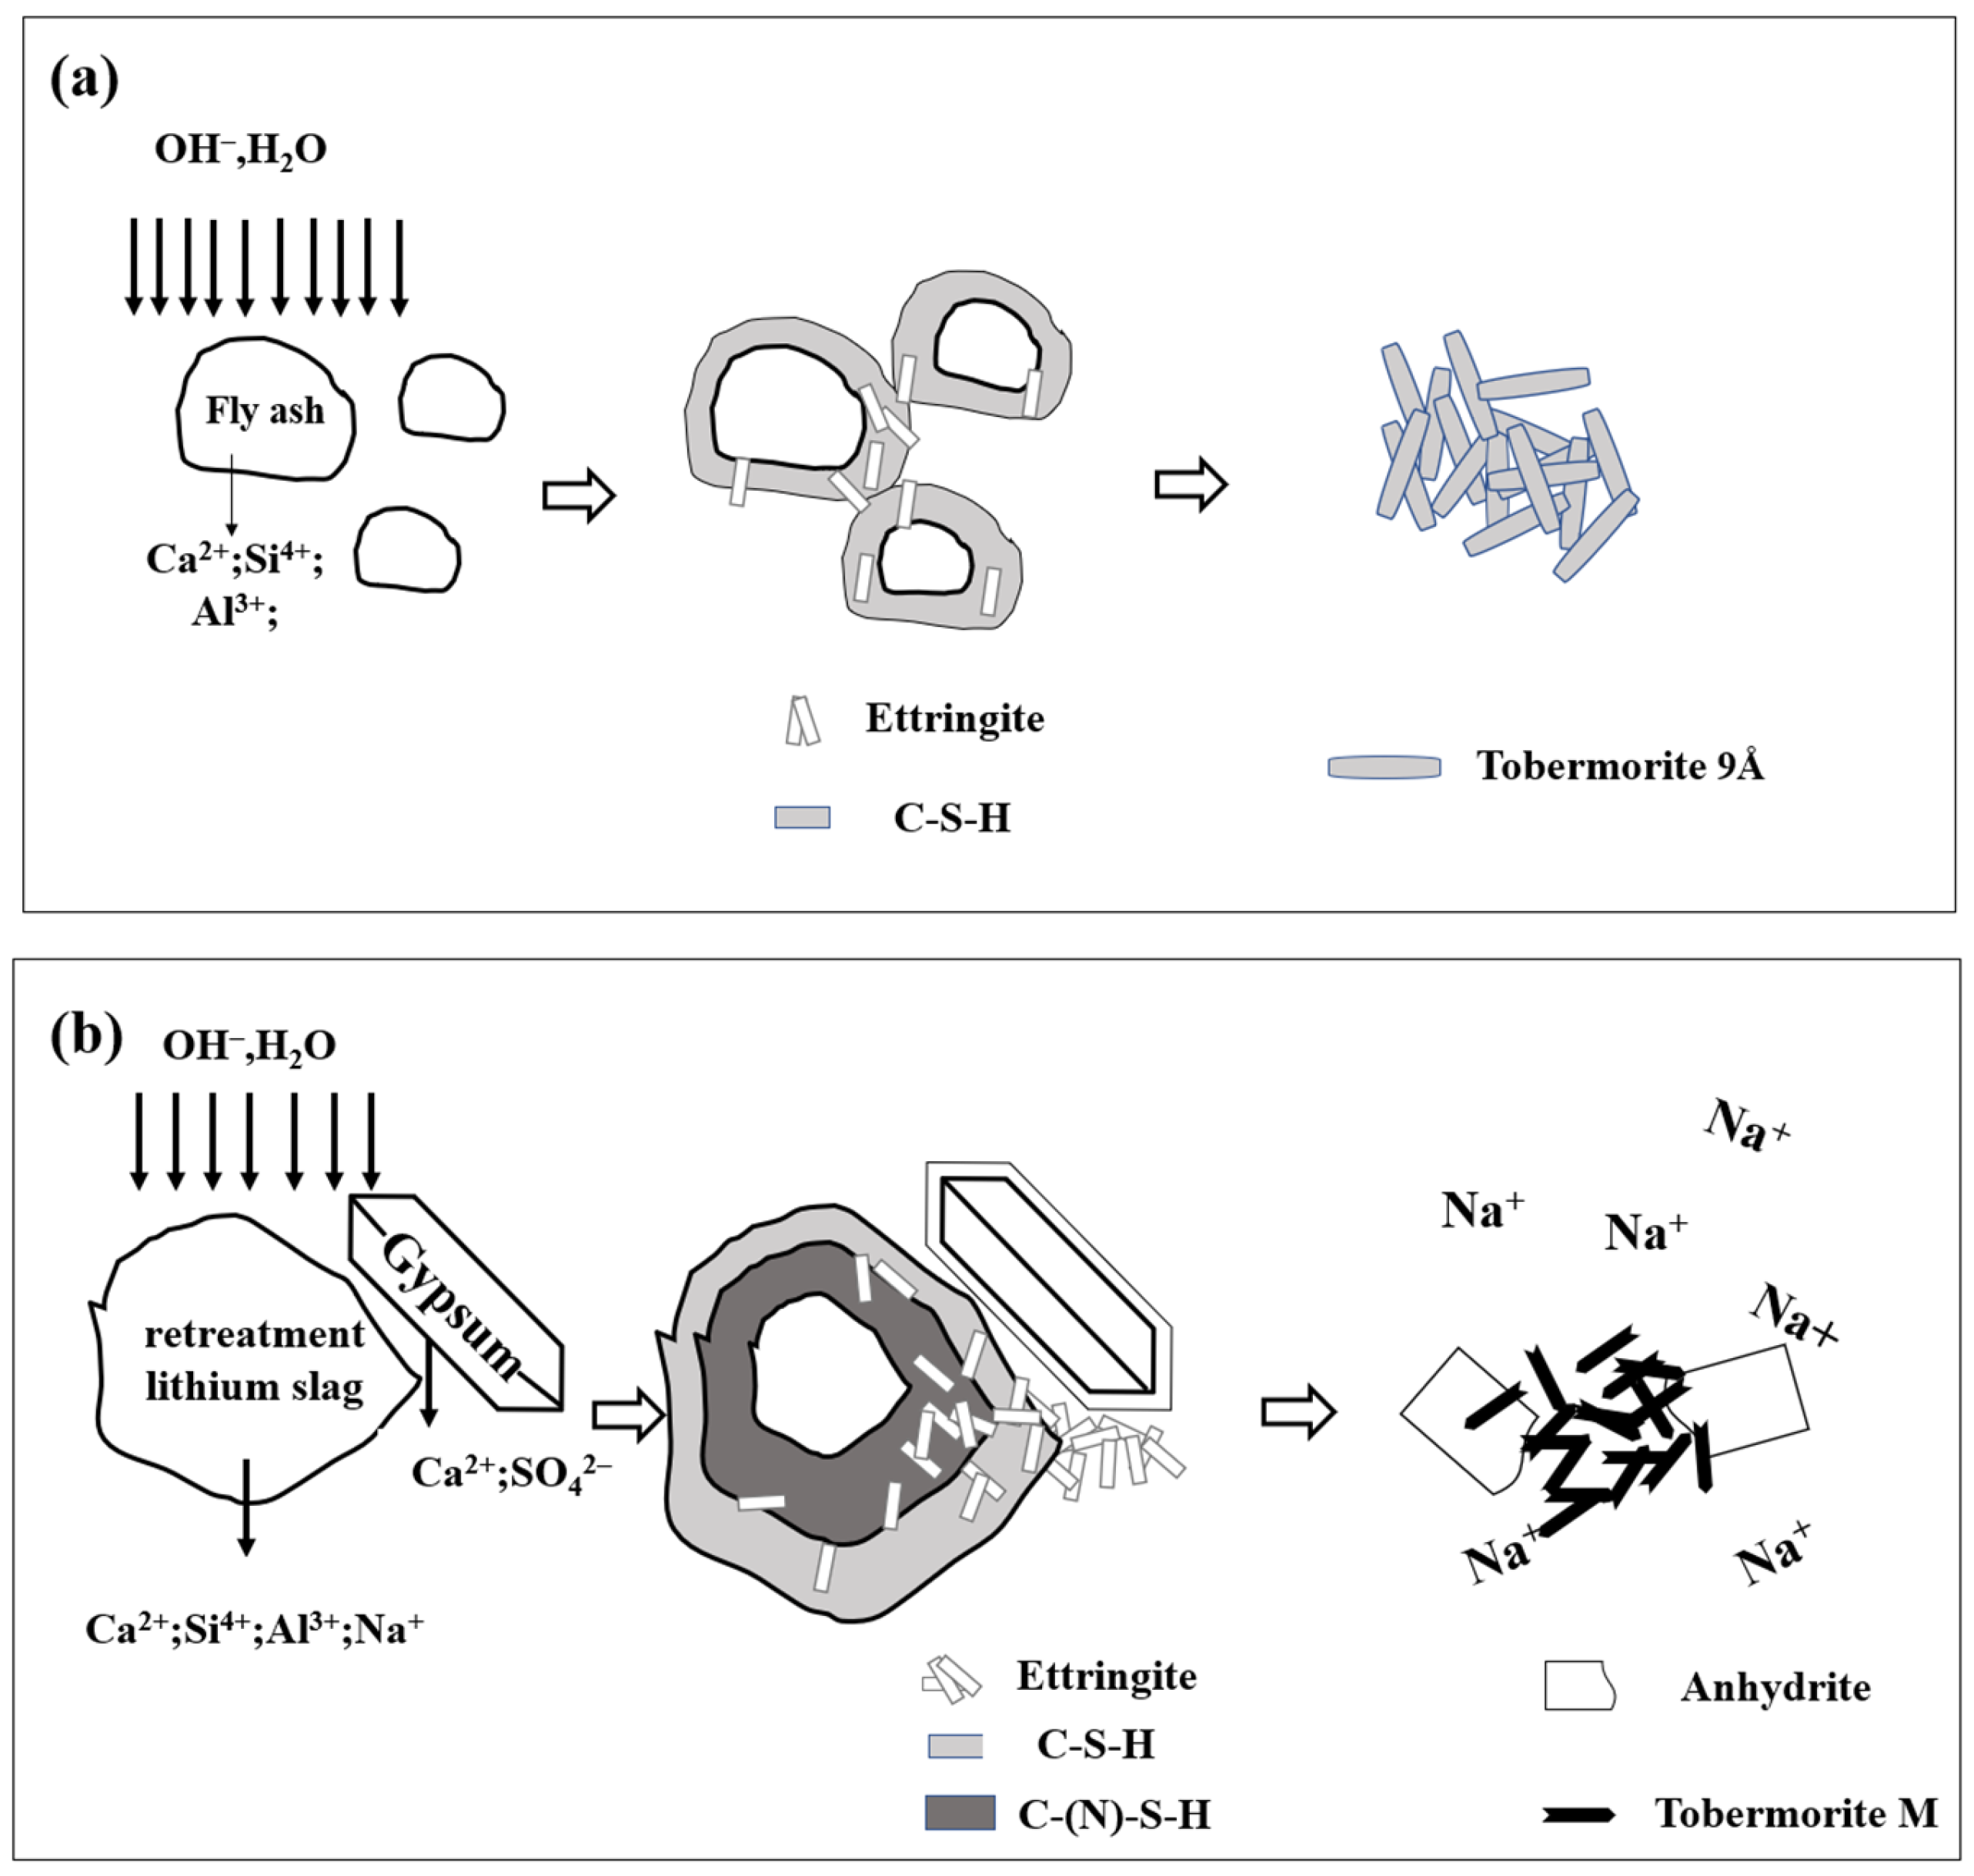
- The addition of RTLS can change the mineral composition of the AAC. The formation of tobermorite in the RTLS-FA system is different from that in the FA system.
- The addition of RTLS changed the microstructure of the tobermorite. As the content of the RTLS increased, the microstructure changed from grass-like tobermorite to network-like tobermorite.
- The addition of RTLS can improve the AAC performance, which is attributed to the synergistic effect of tobermorite and anhydrite. Compared with the RTLS0, the compressive strength of the RTLS30 was enhanced by 10 MPa.
Author Contributions
Funding
Institutional Review Board Statement
Informed Consent Statement
Data Availability Statement
Conflicts of Interest
References
- He, Z.H.; Li, L.Y.; Du, S.G. Mechanical properties, drying shrinkage, and creep of concrete containing lithium slag. Constr. Build. Mater. 2017, 147, 296–304. [Google Scholar] [CrossRef]
- Tan, H.; Li, X.; He, C.; Ma, B.; Bai, Y.; Luo, Z. Utilization of lithium slag as an admixture in blended cements: Physico-mechanical and hydration characteristics. J. Wuhan Univ. Technol. Mater. Sci. Ed. 2015, 30, 129–133. [Google Scholar] [CrossRef]
- Tan, H.; Zhang, X.; He, X.; Guo, Y.; Deng, X.; Su, Y.; Yang, J.; Wang, Y. Utilization of lithium slag by wet-grinding process to improve the early strength of sulphoaluminate cement paste. J. Clean. Prod. 2018, 205, 536–551. [Google Scholar] [CrossRef]
- Song, Y.; Guo, C.; Qian, J.; Ding, T. Effect of the Ca-to-Si ratio on the properties of autoclaved aerated concrete containing coal fly ash from circulating fluidized bed combustion boiler. Constr. Build. Mater. 2015, 83, 136–142. [Google Scholar] [CrossRef]
- Peng, Y.; Liu, Y.; Zhan, B.; Xu, G. Preparation of autoclaved aerated concrete by using graphite tailings as an alternative silica source. Constr. Build. Mater. 2021, 267, 121792. [Google Scholar] [CrossRef]
- Ma, B.; Cai, L.; Li, X.; Jian, S. Utilization of iron tailings as substitute in autoclaved aerated concrete: Physico-mechanical and microstructure of hydration products. J. Clean. Prod. 2016, 127, 162–171. [Google Scholar] [CrossRef]
- Jiang, J.; Ma, B.; Cai, Q.; Shao, Z.; Hu, Y.; Qian, B.; Wang, J.; Ma, F.; Wang, L. Utilization of ZSM-5 waste for the preparation of autoclaved aerated concrete (AAC): Mechanical properties and reaction products. Constr. Build. Mater. 2021, 297, 123821. [Google Scholar] [CrossRef]
- Cai, L.; Ma, B.; Li, X.; Lv, Y.; Liu, Z.; Jian, S. Mechanical and hydration characteristics of autoclaved aerated concrete (AAC) containing iron-tailings: Effect of content and fineness. Constr. Build. Mater. 2016, 128, 361–372. [Google Scholar] [CrossRef]
- Chen, Y.; Chang, J.; Lai, Y.; Ko, M.; Chen, Y. Recycling of steel slag fines for the production of autoclaved aerated concrete (AAC). Ce/Papers 2018, 2, 445–449. [Google Scholar] [CrossRef]
- Luo, Y.; Ma, B.; Liang, F.; Xue, Z.; Qian, B.; Wang, J.; Zhou, L.; Zang, J.; Liang, R.; Li, Y.; et al. Use of untreated phosphogypsum as a raw material for autoclaved aerated concrete preparation. J. Build. Eng. 2023, 64, 105607. [Google Scholar] [CrossRef]
- Cai, Q.; Ma, B.; Jiang, J.; Wang, J.; Shao, Z.; Hu, Y.; Qian, B.; Wang, L. Utilization of waste red gypsum in autoclaved aerated concrete preparation. Constr. Build. Mater. 2021, 291, 123376. [Google Scholar] [CrossRef]
- GB/T 11969-2022; Test Methods of Autoclaved Aerated Concrete. National Standardization Technical Committee Cement Products: Beijing, China, 2022.
- Frederick, F.M.; Lea, M. Lea’s Chemistry of Cement and Concrete; Hewlett, P., Liska, M., Eds.; Elsevier: Amsterdam, The Netherlands, 2019. [Google Scholar]
- Taylor, H.F.W. Cement Chemistry; Thomas Telford Publishing: London, UK, 1997. [Google Scholar] [CrossRef]
- Marchand, J.; Odler, I.; Skalny, J.P. Sulfate Attack on Concrete; CRC Press: Boca Raton, FL, USA, 2001. [Google Scholar] [CrossRef]
- Said, A.M.; Zeidan, M.S.; Bassuoni, M.T.; Tian, Y. Properties of concrete incorporating nano-silica. Constr. Build Mater. 2012, 36, 838–844. [Google Scholar] [CrossRef]
- Irbe, L.; Beddoe, R.E.; Heinz, D. The role of aluminium in C-A-S-H during sulfate attack on concrete. Cem. Concr. Res. 2019, 116, 71–80. [Google Scholar] [CrossRef]
- Hu, Y.; Shao, Z.; Wang, J.; Zang, J.; Tang, L.; Ma, F.; Qian, B.; Ma, B.; Wang, L. Investigation into the influence of calcium compounds on the properties of micropore-foamed geopolymer. J. Build. Eng. 2022, 45, 103521. [Google Scholar] [CrossRef]
- Ma, B.; Luo, Y.; Zhou, L.; Shao, Z.; Liang, R.; Fu, J.; Wang, J.; Zang, J.; Hu, Y.; Wang, L. The influence of calcium hydroxide on the performance of MK-based geopolymer. Constr. Build. Mater. 2022, 329, 127224. [Google Scholar] [CrossRef]
- Qian, B.; Liu, C.; Lu, J.; Jian, M.; Hu, X.; Zhou, S.; Hosseini, T.; Etschmann, B.; Zhang, X.; Wang, H.; et al. Synthesis of in-situ Al3+-defected iron oxide nanoflakes from coal ash: A detailed study on the structure, evolution mechanism and application to water remediation. J. Hazard. Mater. 2020, 395, 122696. [Google Scholar] [CrossRef] [PubMed]
- Ghanbari, M.; Hadian, A.M.; Nourbakhsh, A.A.; MacKenzie, K.J.D. Modeling and optimization of compressive strength and bulk density of metakaolin-based geopolymer using central composite design: A numerical and experimental study. Ceram. Int. 2017, 43, 324–335. [Google Scholar] [CrossRef]
- Wang, S.-D.; Pu, X.-C.; Scrivener, K.L.; Pratt, P.L. Alkali-activated slag cement and concrete: A review of properties and problems. Adv. Cem. Res. 1995, 7, 93–102. [Google Scholar] [CrossRef]
- Provis, J.L. Alkali-activated materials. Cem. Concr. Res. 2018, 114, 40–48. [Google Scholar] [CrossRef]
- Ríos, C.A.; Williams, C.D.; Fullen, M.A. Hydrothermal synthesis of hydrogarnet and tobermorite at 175 °C from kaolinite and metakaolinite in the CaO–Al2O3–SiO2–H2O system: A comparative study. Appl. Clay Sci. 2009, 43, 228–237. [Google Scholar] [CrossRef]
- Scrivener, K.; Snellings, R.; Lothenbach, B. A Practical Guide to Microstructural Analysis of Cementitious Materials; CRC Press: Boca Raton, FL, USA, 2016. [Google Scholar]
- Shao, Z.; Wang, J.; Jiang, Y.; Zang, J.; Wu, T.; Ma, F.; Qian, B.; Wang, L.; Hu, Y.; Ma, B. The performance of micropore-foamed geopolymers produced from industrial wastes. Constr. Build. Mater. 2021, 304, 124636. [Google Scholar] [CrossRef]
- Bernal, S.A. Microstructural Changes Induced by CO2 Exposure in Alkali-Activated Slag/Metakaolin Pastes. Front. Mater. 2016, 3, 43. [Google Scholar] [CrossRef]
- Wu, Q.; Guang, J.; Li, S.; Wang, S.; Zou, X.; Zhu, H.; Zhang, C. Development of Autoclaved Aerated Concrete from Mechanically Activated Magnesium-Rich Nickel Slag. J. Mater. Civ. Eng. 2018, 30, 04018134. [Google Scholar] [CrossRef]
- Li, N.; Shi, C.; Zhang, Z.; Zhu, D.; Hwang, H.-J.; Zhu, Y.; Sun, T. A mixture proportioning method for the development of performance-based alkali-activated slag-based concrete. Cem. Concr. Compos. 2018, 93, 163–174. [Google Scholar] [CrossRef]
- Gao, K.; Lin, K.-L.; Wang, D.; Hwang, C.-L.; Shiu, H.-S.; Chang, Y.-M.; Cheng, T.-W. Effects SiO2/Na2O molar ratio on mechanical properties and the microstructure of nano-SiO2 metakaolin-based geopolymers. Constr. Build. Mater. 2014, 53, 503–510. [Google Scholar] [CrossRef]
- Chen, G.; Li, F.; Geng, J.; Jing, P.; Si, Z. Identification, generation of autoclaved aerated concrete pore structure and simulation of its influence on thermal conductivity. Constr. Build. Mater. 2021, 294, 123572. [Google Scholar] [CrossRef]
- Cai, L.; Tang, T.; Liu, M.; Xie, D. Comparative study of carbide slag autoclaved aerated concrete (AAC) manufactured under thermal oven and microwave pre-curing process: Foaming course, rough body strength and physic-mechanical properties. Constr. Build. Mater. 2020, 236, 117550. [Google Scholar] [CrossRef]
- Yang, J.; Zeng, J.; He, X.; Zhang, Y.; Su, Y.; Tan, H. Sustainable clinker-free solid waste binder produced from wet-ground granulated blast-furnace slag, phosphogypsum and carbide slag. Constr. Build. Mater. 2022, 330, 127218. [Google Scholar] [CrossRef]
- Huang, X.; Wei, J.; Zhang, Y.; Qian, B.; Jia, Q.; Liu, J.; Zhao, X.; Shao, G. Ultralight Magnetic and Dielectric Aerogels Achieved by Metal–Organic Framework Initiated Gelation of Graphene Oxide for Enhanced Microwave Absorption. Nano-Micro Lett. 2022, 14, 107. [Google Scholar] [CrossRef]
- Amran, M.; Murali, G.; Khalid, N.H.A.; Fediuk, R.; Ozbakkaloglu, T.; Lee, Y.H.; Haruna, S.; Lee, Y.Y. Slag uses in making an ecofriendly and sustainable concrete: A review. Constr. Build. Mater. 2021, 272, 121942. [Google Scholar] [CrossRef]


| Component | SiO2 | Al2O3 | CaO | MgO | Fe2O3 | SO3 | Na2O | K2O | TiO2 | Loss of Ignition |
|---|---|---|---|---|---|---|---|---|---|---|
| RTLS | 32.44 | 19.09 | 12.21 | 0.62 | 2.67 | 12.48 | 5.05 | 6.45 | 0.07 | 5.89 |
| FA | 46.21 | 27.23 | 9.52 | 4.73 | 3.56 | 0.39 | 0.51 | 0.70 | - | 5.60 |
| Lime | 1.22 | 1.04 | 95.5 | - | 1.23 | - | - | - | - | 1.01 |
| OPC | 22.26 | 5.89 | 60.17 | 2.35 | 2.96 | 2.49 | 0.29 | 0.71 | - | 2.88 |
| Phase (RTLS) | Phase Composition (g/100g) |
|---|---|
| Gypsum (ICSD: 27,221) | 44.04 |
| Quartz (ICSD: 174) | 2.02 |
| Hauyne (ICSD: 24,441) | 12.82 |
| Albite (ICSD: 9287) | 38.80 |
| Fluorite (ICSD: 28,730) | 2.32 |
| Total | 100 |
| Phase (FA) | Phase Composition (g/100g) |
|---|---|
| Mullite (ICSD: 89,721) | 25.45 |
| Quartz (ICSD: 174) | 35.76 |
| Amorphous | 38.79 |
| Total | 100 |
| Sample | RTLS | OPC | FA | Lime | Al Powder | Gypsum | Ca/Si |
|---|---|---|---|---|---|---|---|
| RTLS0 | 0% | 17% | 70% | 10% | 0.225% | 3% | 0.78 |
| RTLS10 | 10% | 17% | 60% | 10% | 0.225% | 3% | 0.82 |
| RTLS20 | 20% | 17% | 50% | 10% | 0.225% | 3% | 0.85 |
| RTLS30 | 30% | 17% | 40% | 10% | 0.225% | 3% | 0.90 |
| Samples | RTLS0 | RTLS10 | RTLS20 | RTLS30 |
|---|---|---|---|---|
| Viscosity (mPa·s) | 1120 | 1254 | 1380 | 1144 |
| Phase | RTLS0 | RTLS10 | RTLS20 | RTLS30 |
|---|---|---|---|---|
| Tobermorite 9Å (ICSD: 87,689) | 46.8% | - | - | - |
| Tobermorite M (ICSD: 40,048) | - | 30.7% | 32.2% | 39.3% |
| Mullite (ICSD: 89,721) | 25.5% | 28.0% | 26.5% | 18.0% |
| Quartz (ICSD: 89,280) | 27.7% | 19.1% | 15.1% | 18.2% |
| Anhydrite (ICSD: 1956) | - | 0.4% | 4.9% | 1.6% |
| Dawsonite (ICSD: 17,000) | - | 8.1% | 11.0% | 13.0% |
| Calcium Hydroxide (ICSD: 15,471) | - | 9.1% | 7.2% | 4.4% |
| Bayerite (ICSD: 26,830) | - | 4.6% | 3.1% | 5.5% |
| Total | 100% | 100% | 100% | 100% |
| Specimen No. | Porosity (%) |
|---|---|
| RTLS0 | 61.76 |
| RTLS10 | 62.97 |
| RTLS20 | 62.30 |
| RTLS30 | 62.15 |
Disclaimer/Publisher’s Note: The statements, opinions and data contained in all publications are solely those of the individual author(s) and contributor(s) and not of MDPI and/or the editor(s). MDPI and/or the editor(s) disclaim responsibility for any injury to people or property resulting from any ideas, methods, instructions or products referred to in the content. |
© 2024 by the authors. Licensee MDPI, Basel, Switzerland. This article is an open access article distributed under the terms and conditions of the Creative Commons Attribution (CC BY) license (https://creativecommons.org/licenses/by/4.0/).
Share and Cite
Zhong, D.; Wei, S.; Zhou, H.; He, X.; Qian, B.; Ma, B.; Hu, Y.; Ren, X. The Influence of Retreated Lithium Slag with a High Content of Alkali, Sulfate and Fluoride on the Composition and the Microstructure of Autoclaved Aerated Concrete. Materials 2024, 17, 2569. https://doi.org/10.3390/ma17112569
Zhong D, Wei S, Zhou H, He X, Qian B, Ma B, Hu Y, Ren X. The Influence of Retreated Lithium Slag with a High Content of Alkali, Sulfate and Fluoride on the Composition and the Microstructure of Autoclaved Aerated Concrete. Materials. 2024; 17(11):2569. https://doi.org/10.3390/ma17112569
Chicago/Turabian StyleZhong, Dongqing, Shihong Wei, Hao Zhou, Xiaohang He, Binbin Qian, Bing Ma, Yueyang Hu, and Xuehong Ren. 2024. "The Influence of Retreated Lithium Slag with a High Content of Alkali, Sulfate and Fluoride on the Composition and the Microstructure of Autoclaved Aerated Concrete" Materials 17, no. 11: 2569. https://doi.org/10.3390/ma17112569
APA StyleZhong, D., Wei, S., Zhou, H., He, X., Qian, B., Ma, B., Hu, Y., & Ren, X. (2024). The Influence of Retreated Lithium Slag with a High Content of Alkali, Sulfate and Fluoride on the Composition and the Microstructure of Autoclaved Aerated Concrete. Materials, 17(11), 2569. https://doi.org/10.3390/ma17112569