
Effect of Mineral Composition and Particle Size on the Failure Characteristics and Mechanisms of Marble in the China Jinping Underground Laboratory


Abstract
1. Introduction
2. Materials and Methods
2.1. Test Materials
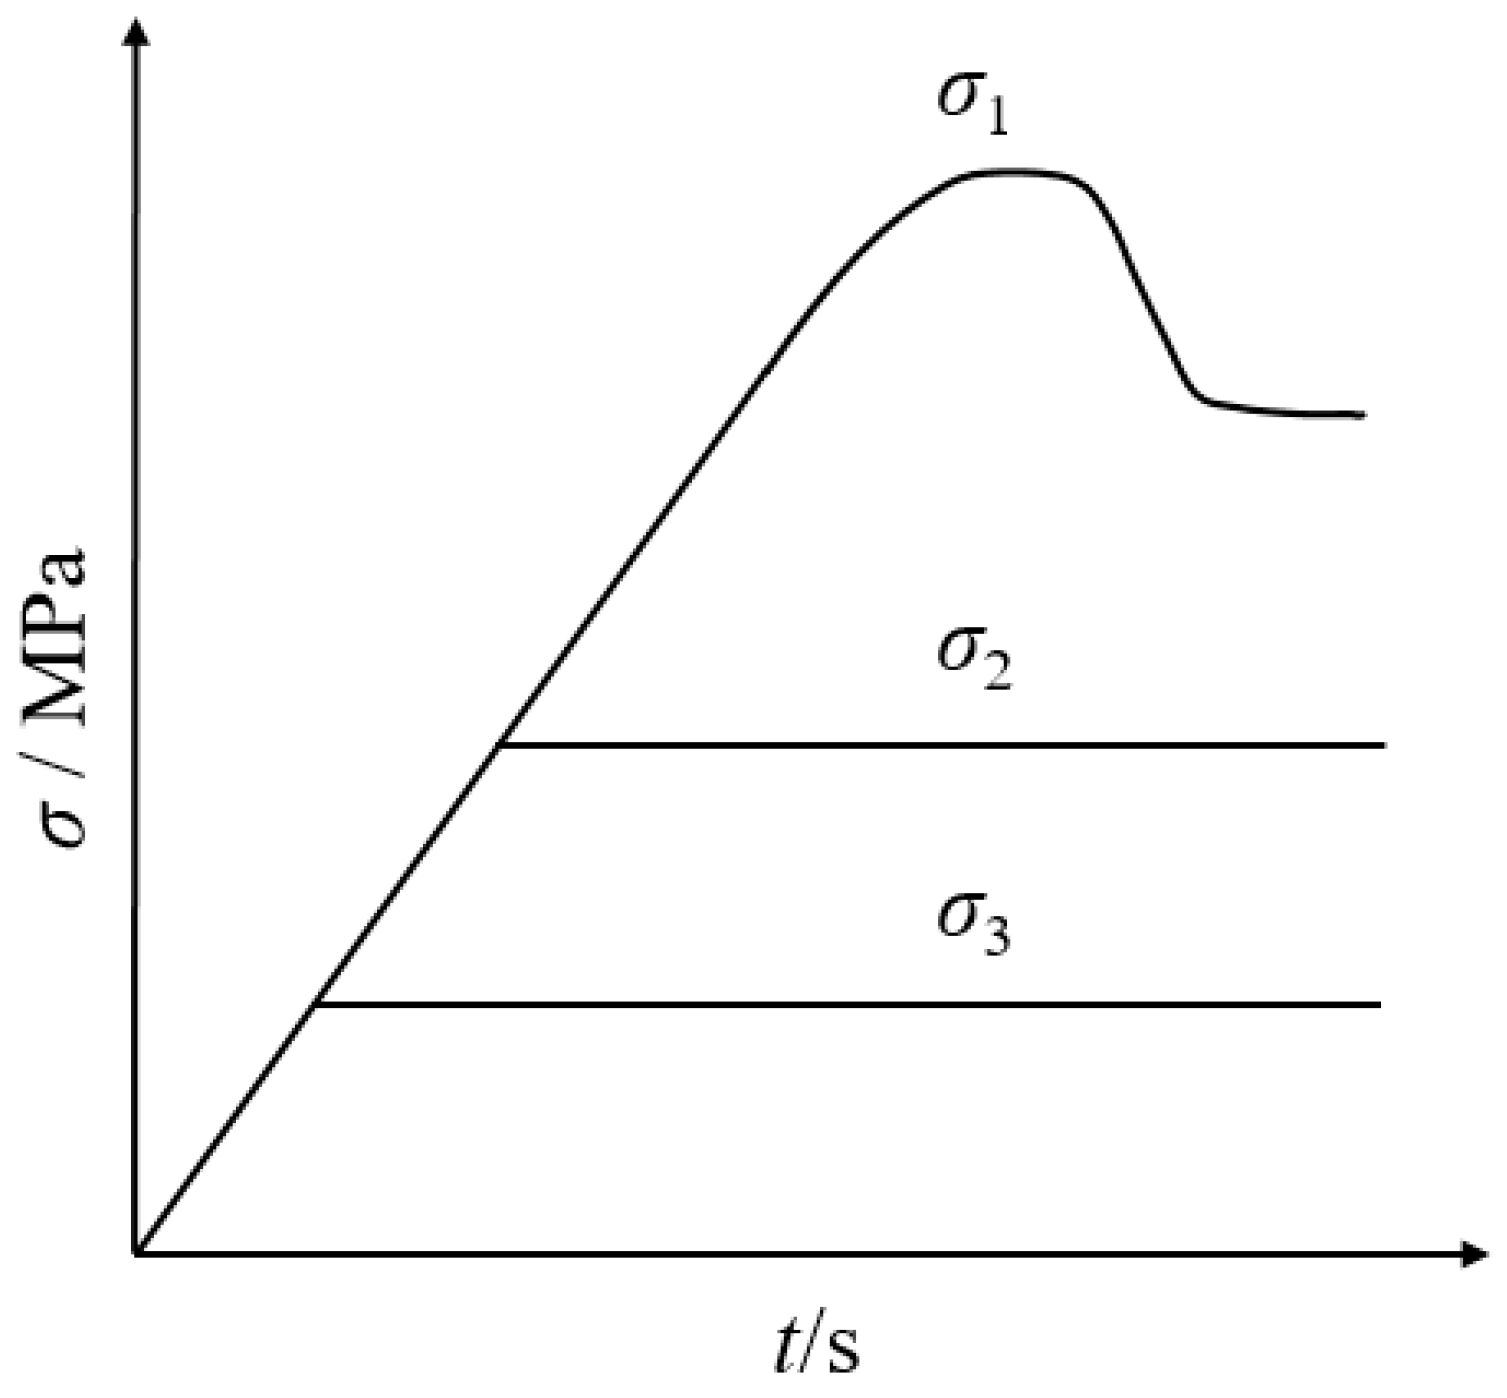
2.2. Test Methods
2.3. Test Schemes
3. Analysis of Results
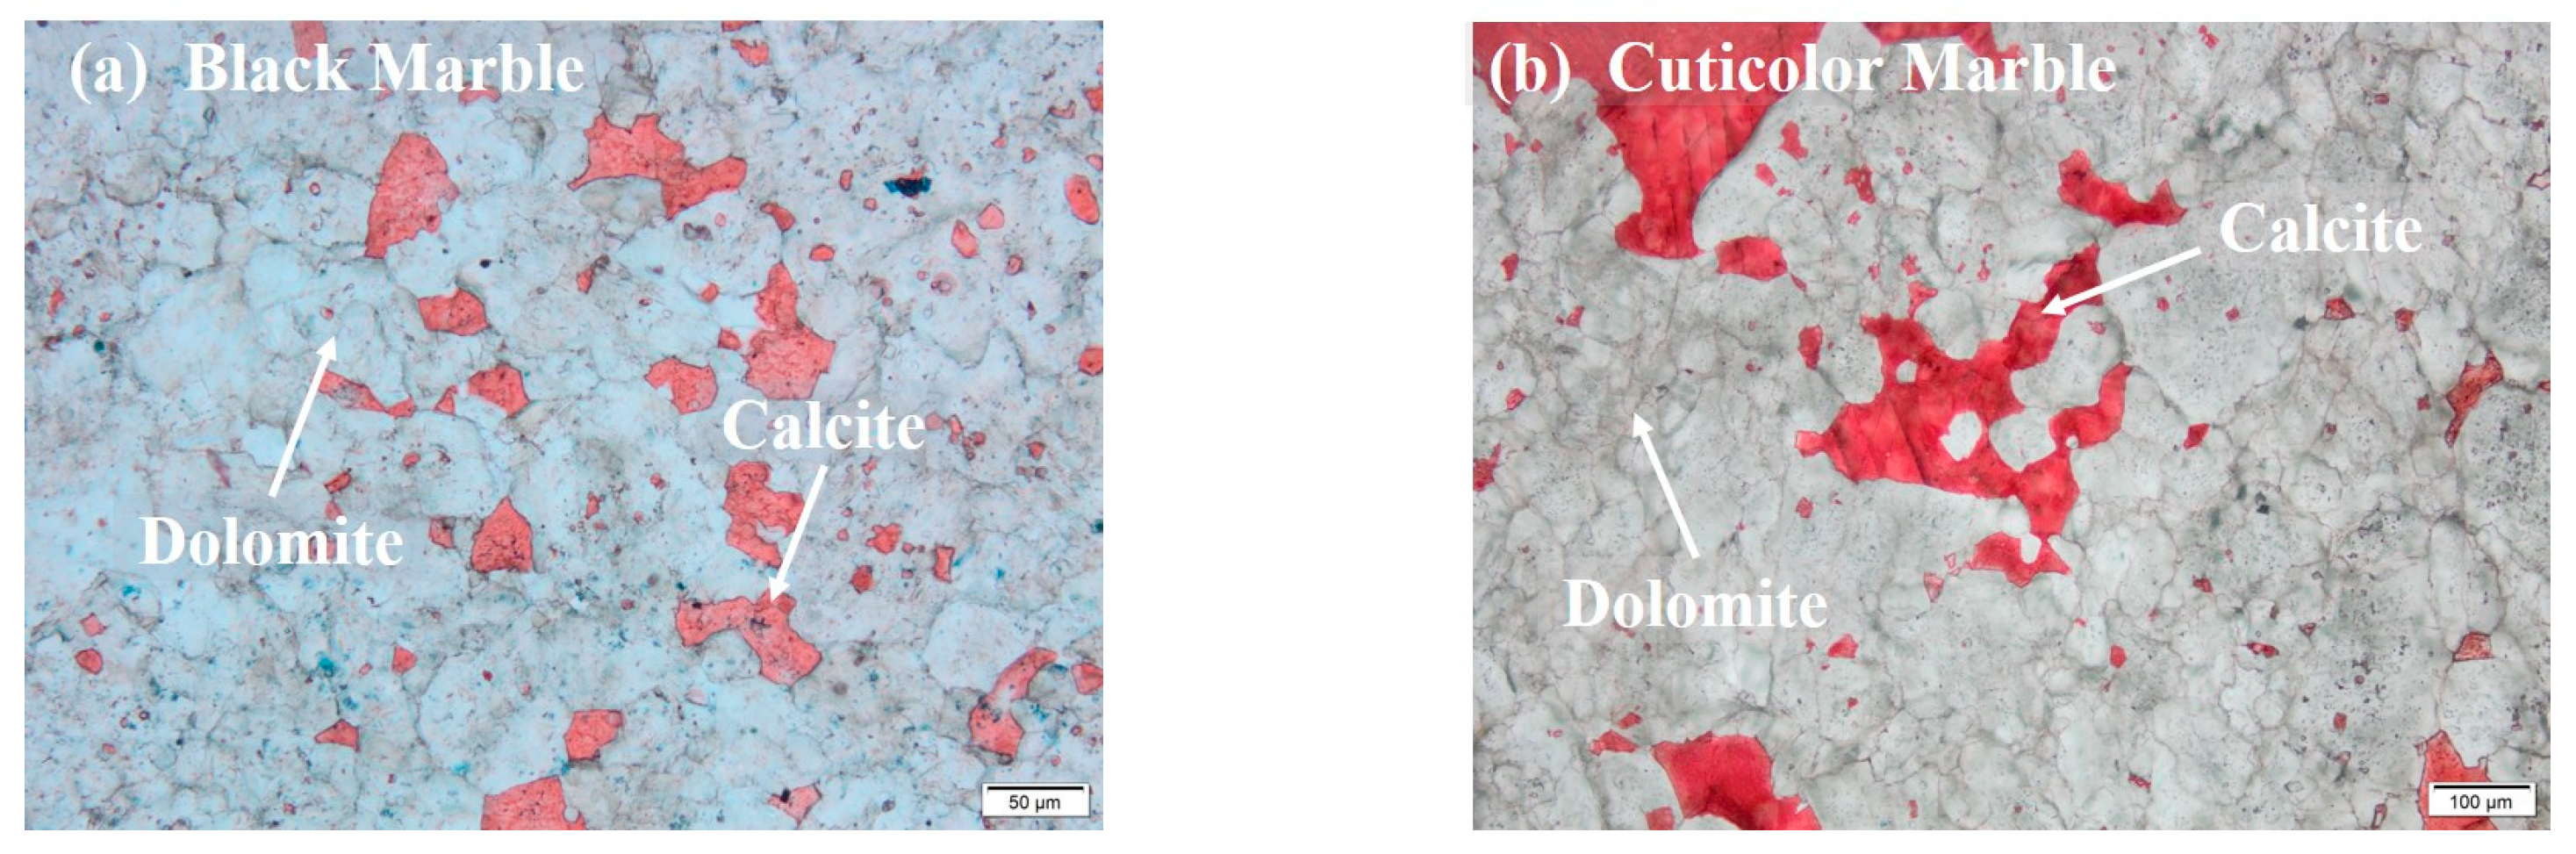
3.1. Microscopic Feature
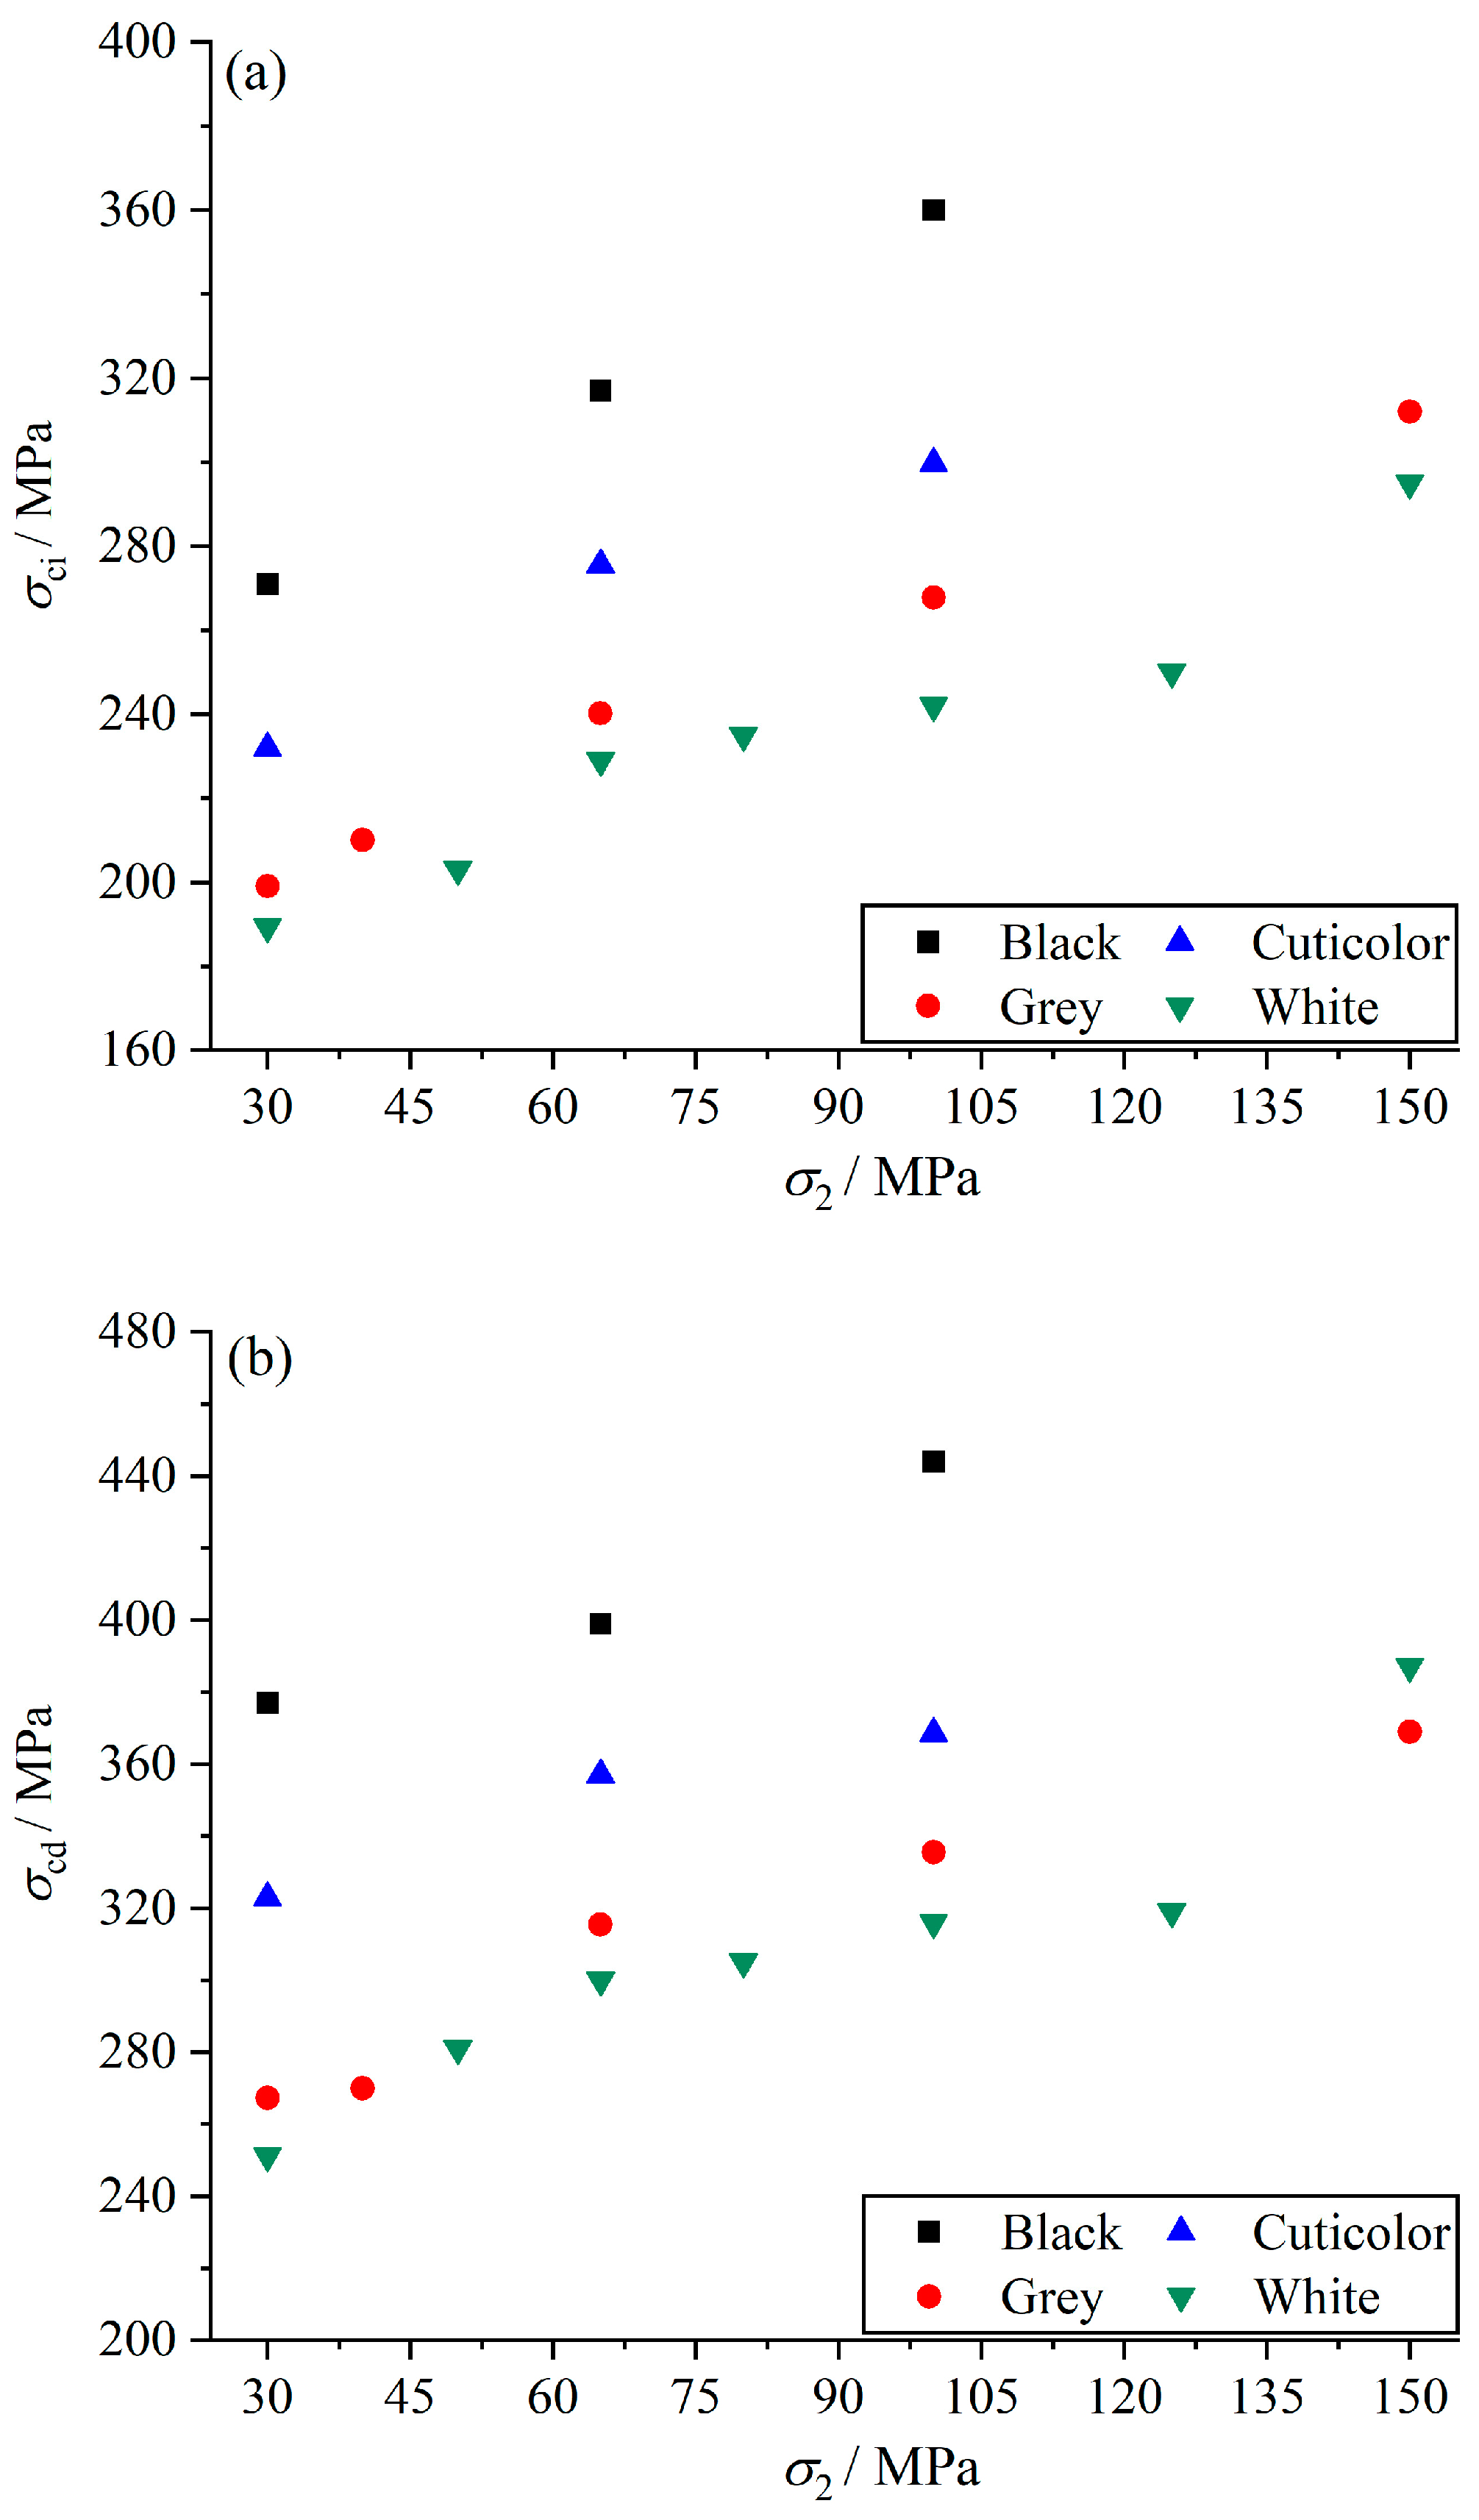
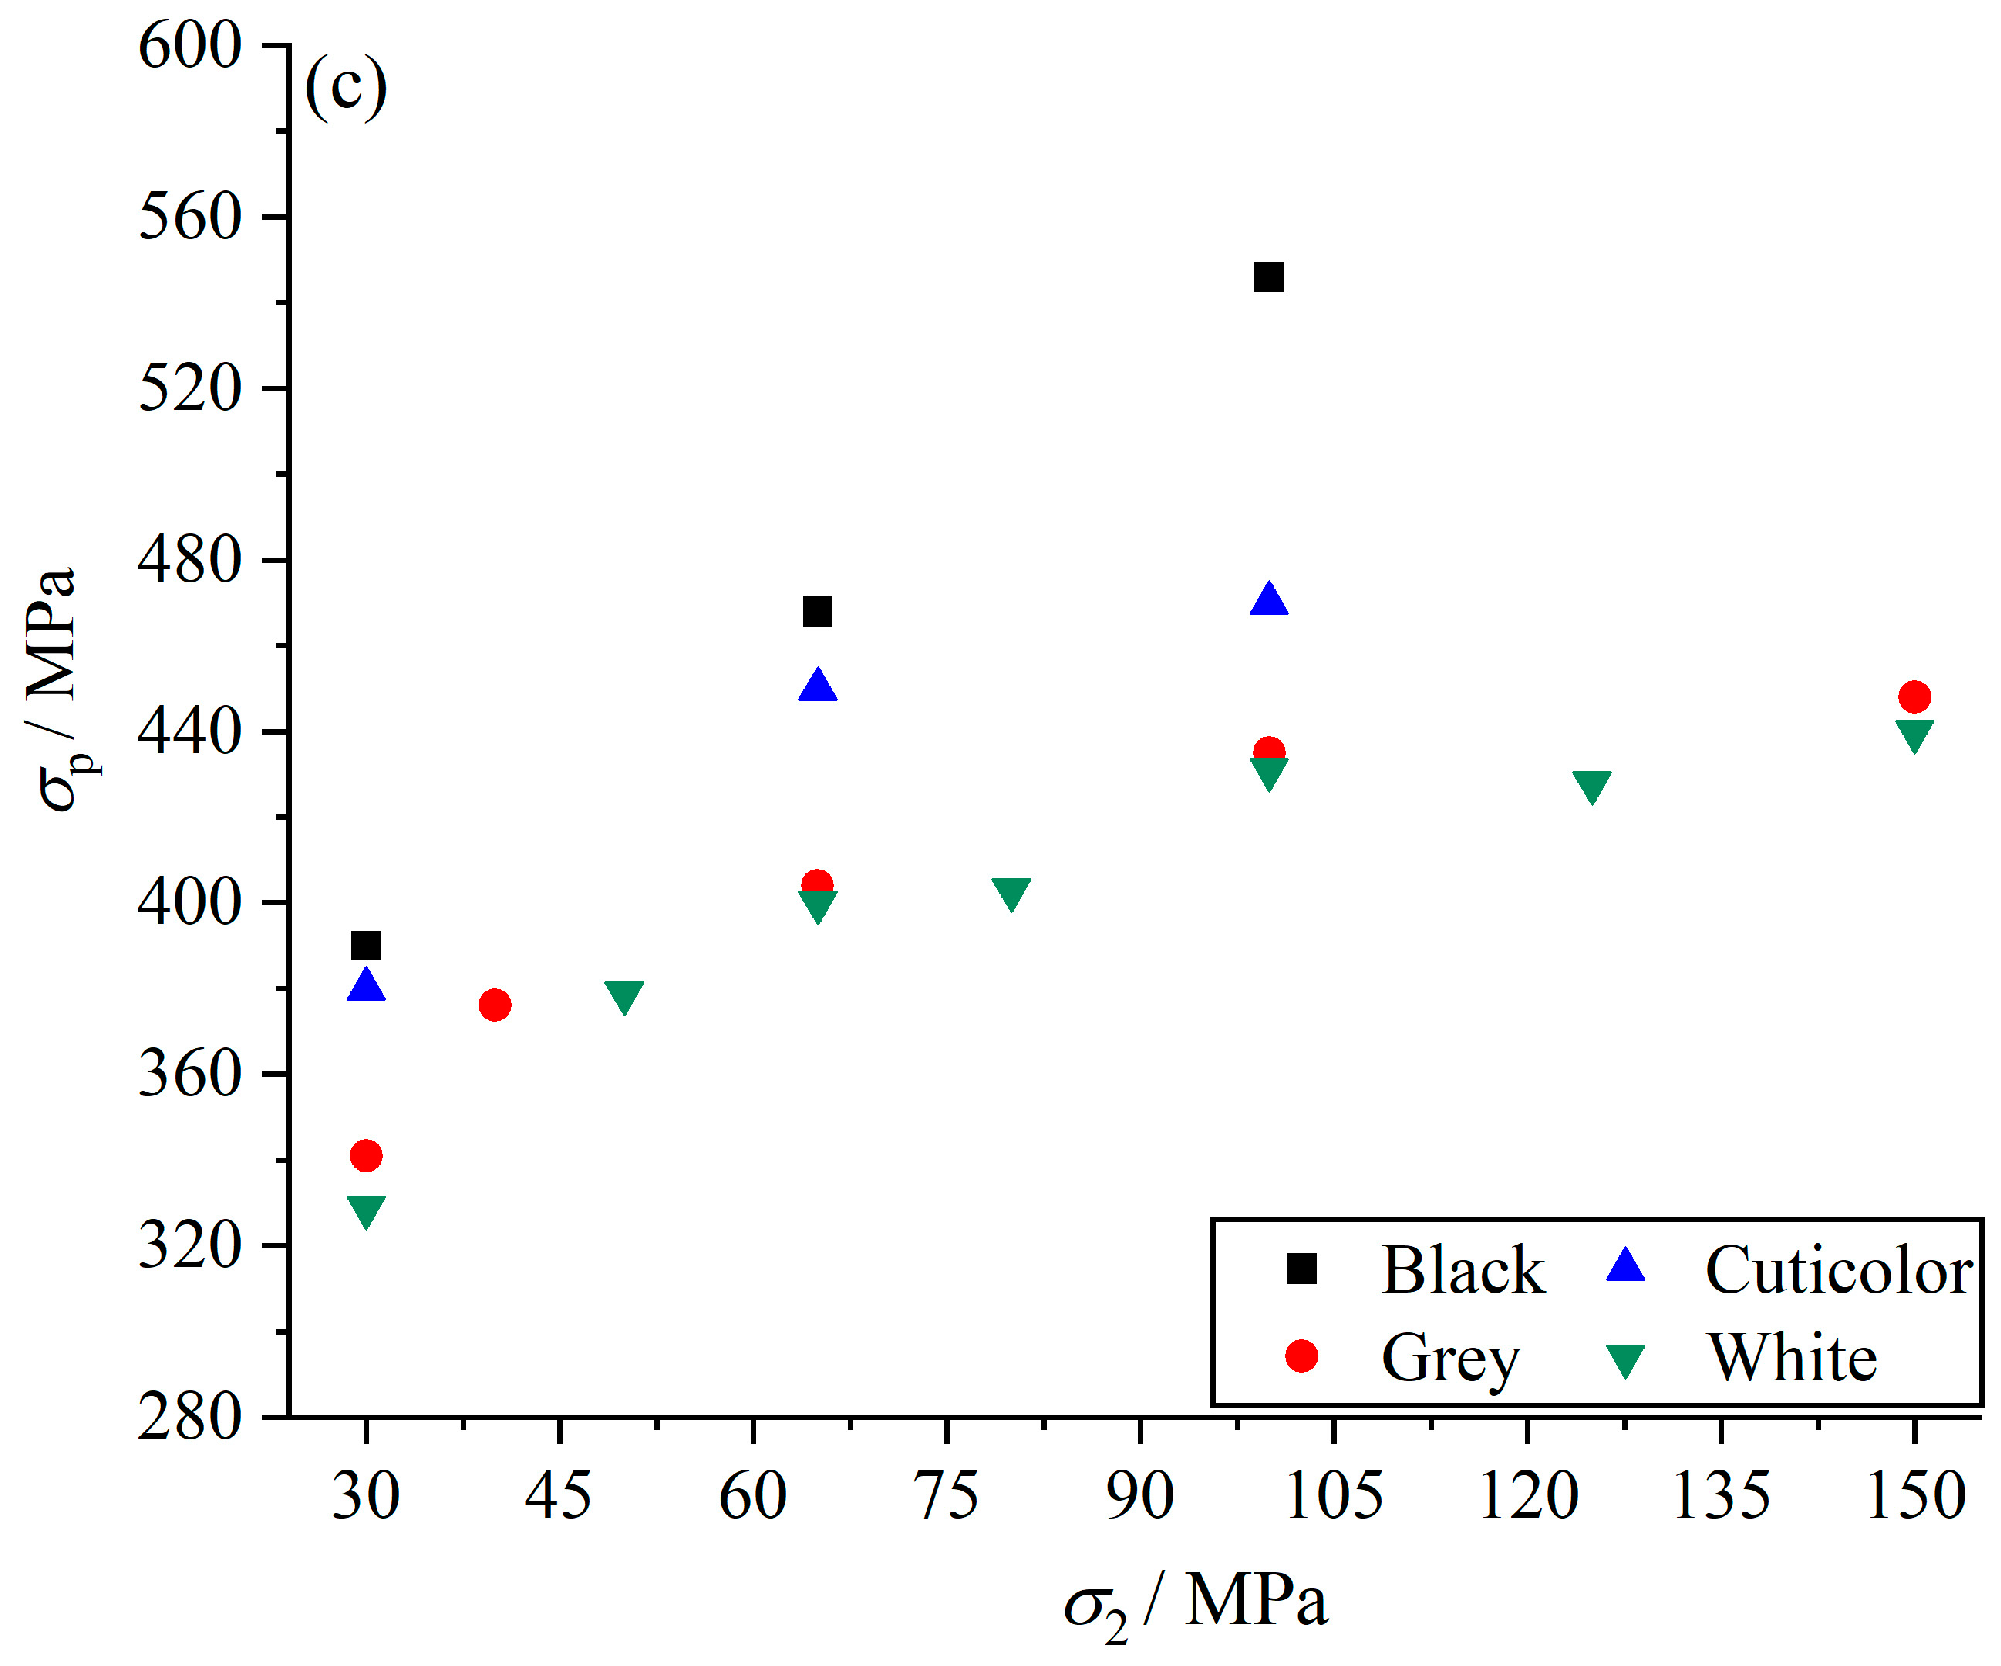
3.2. Strength Characteristic
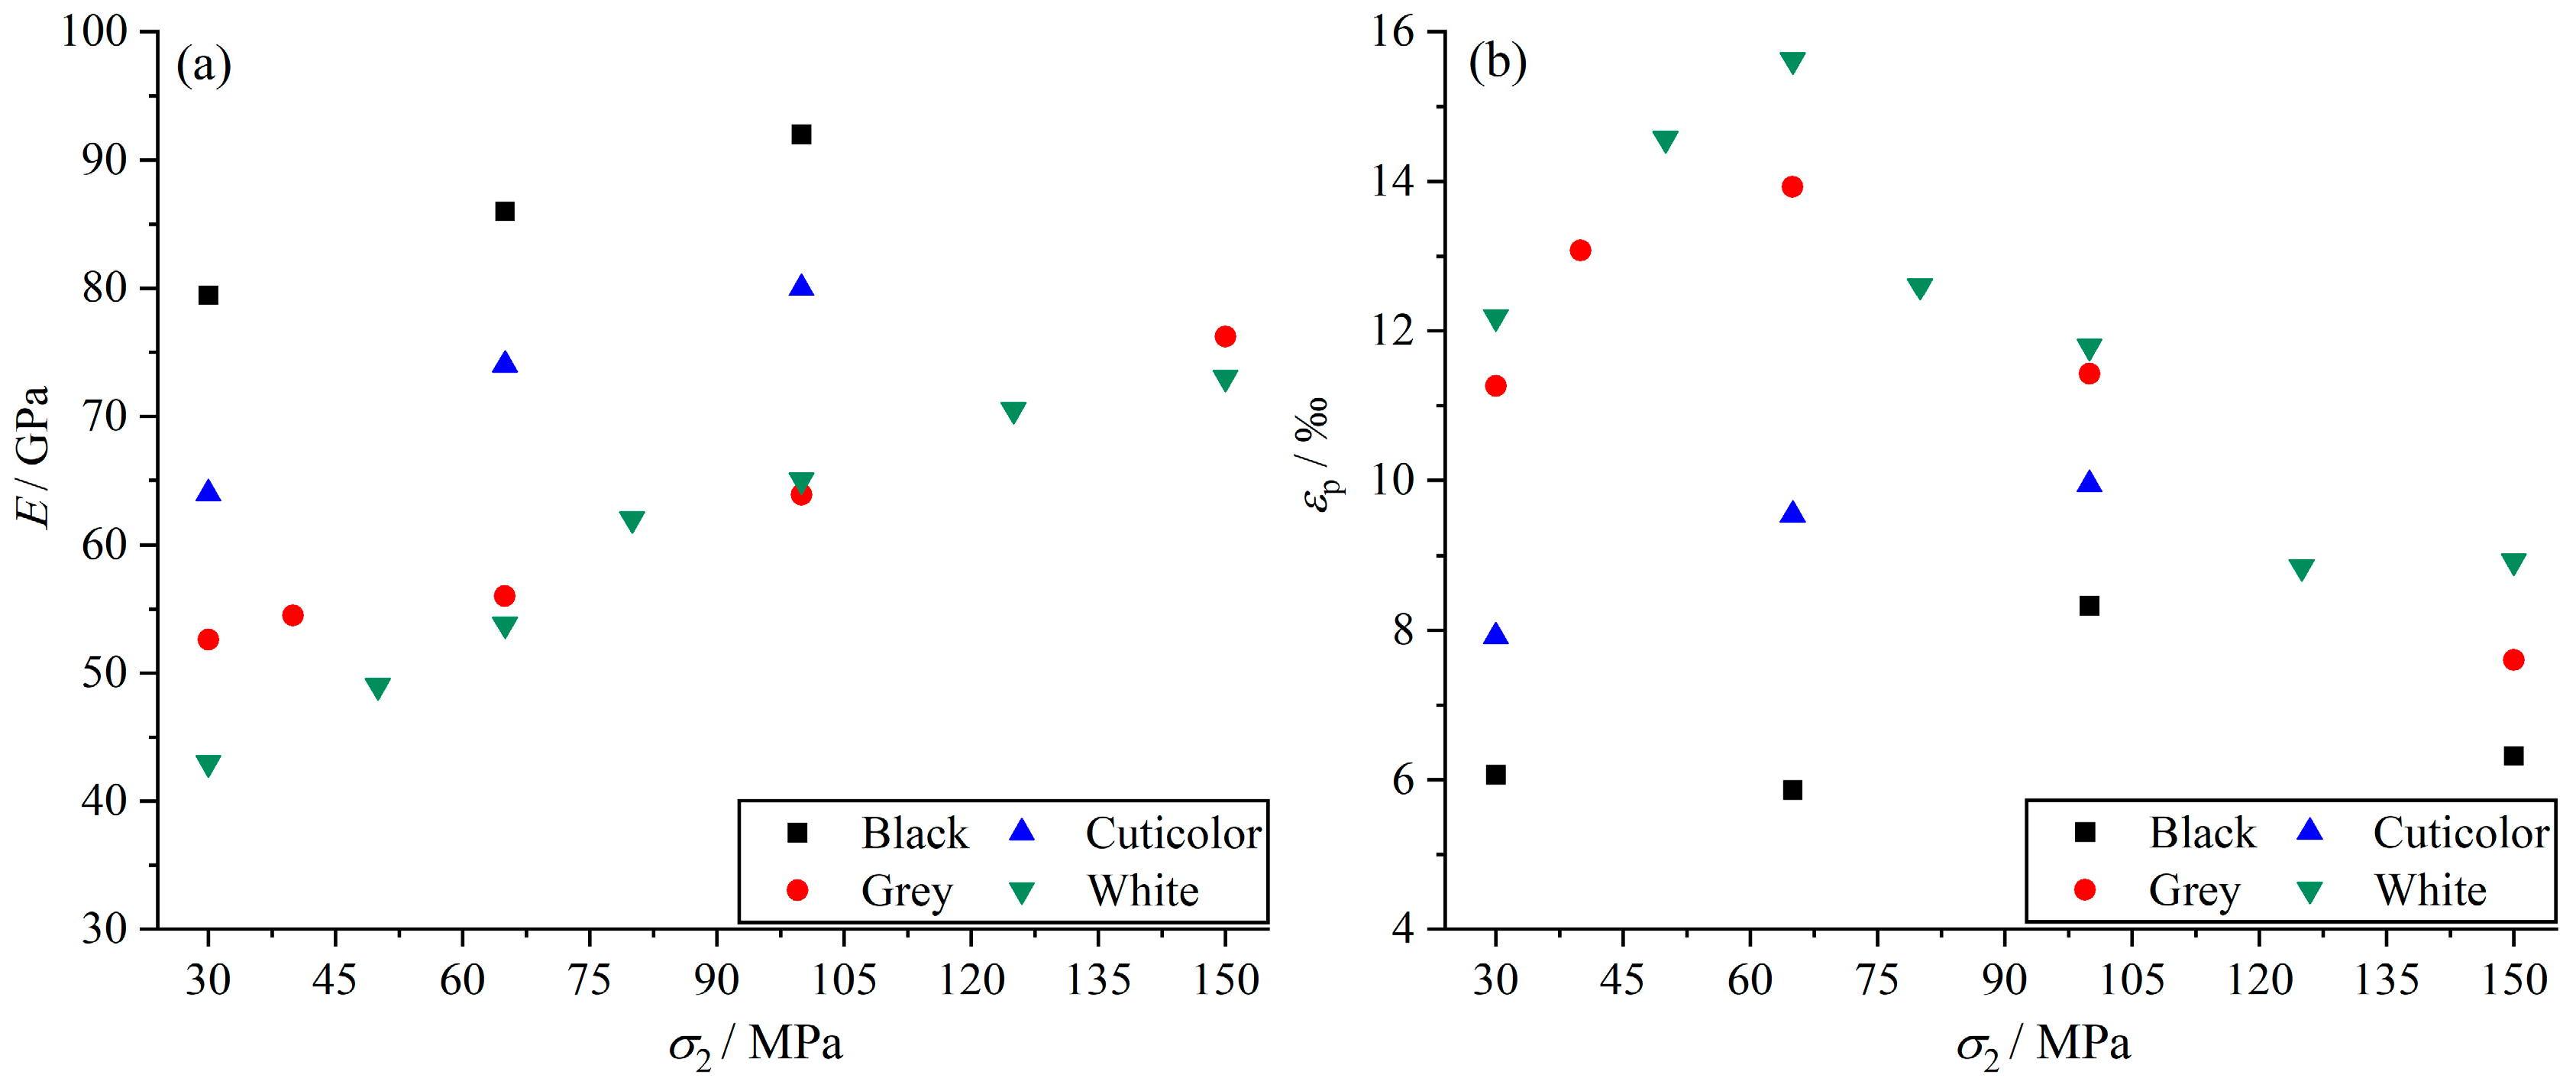
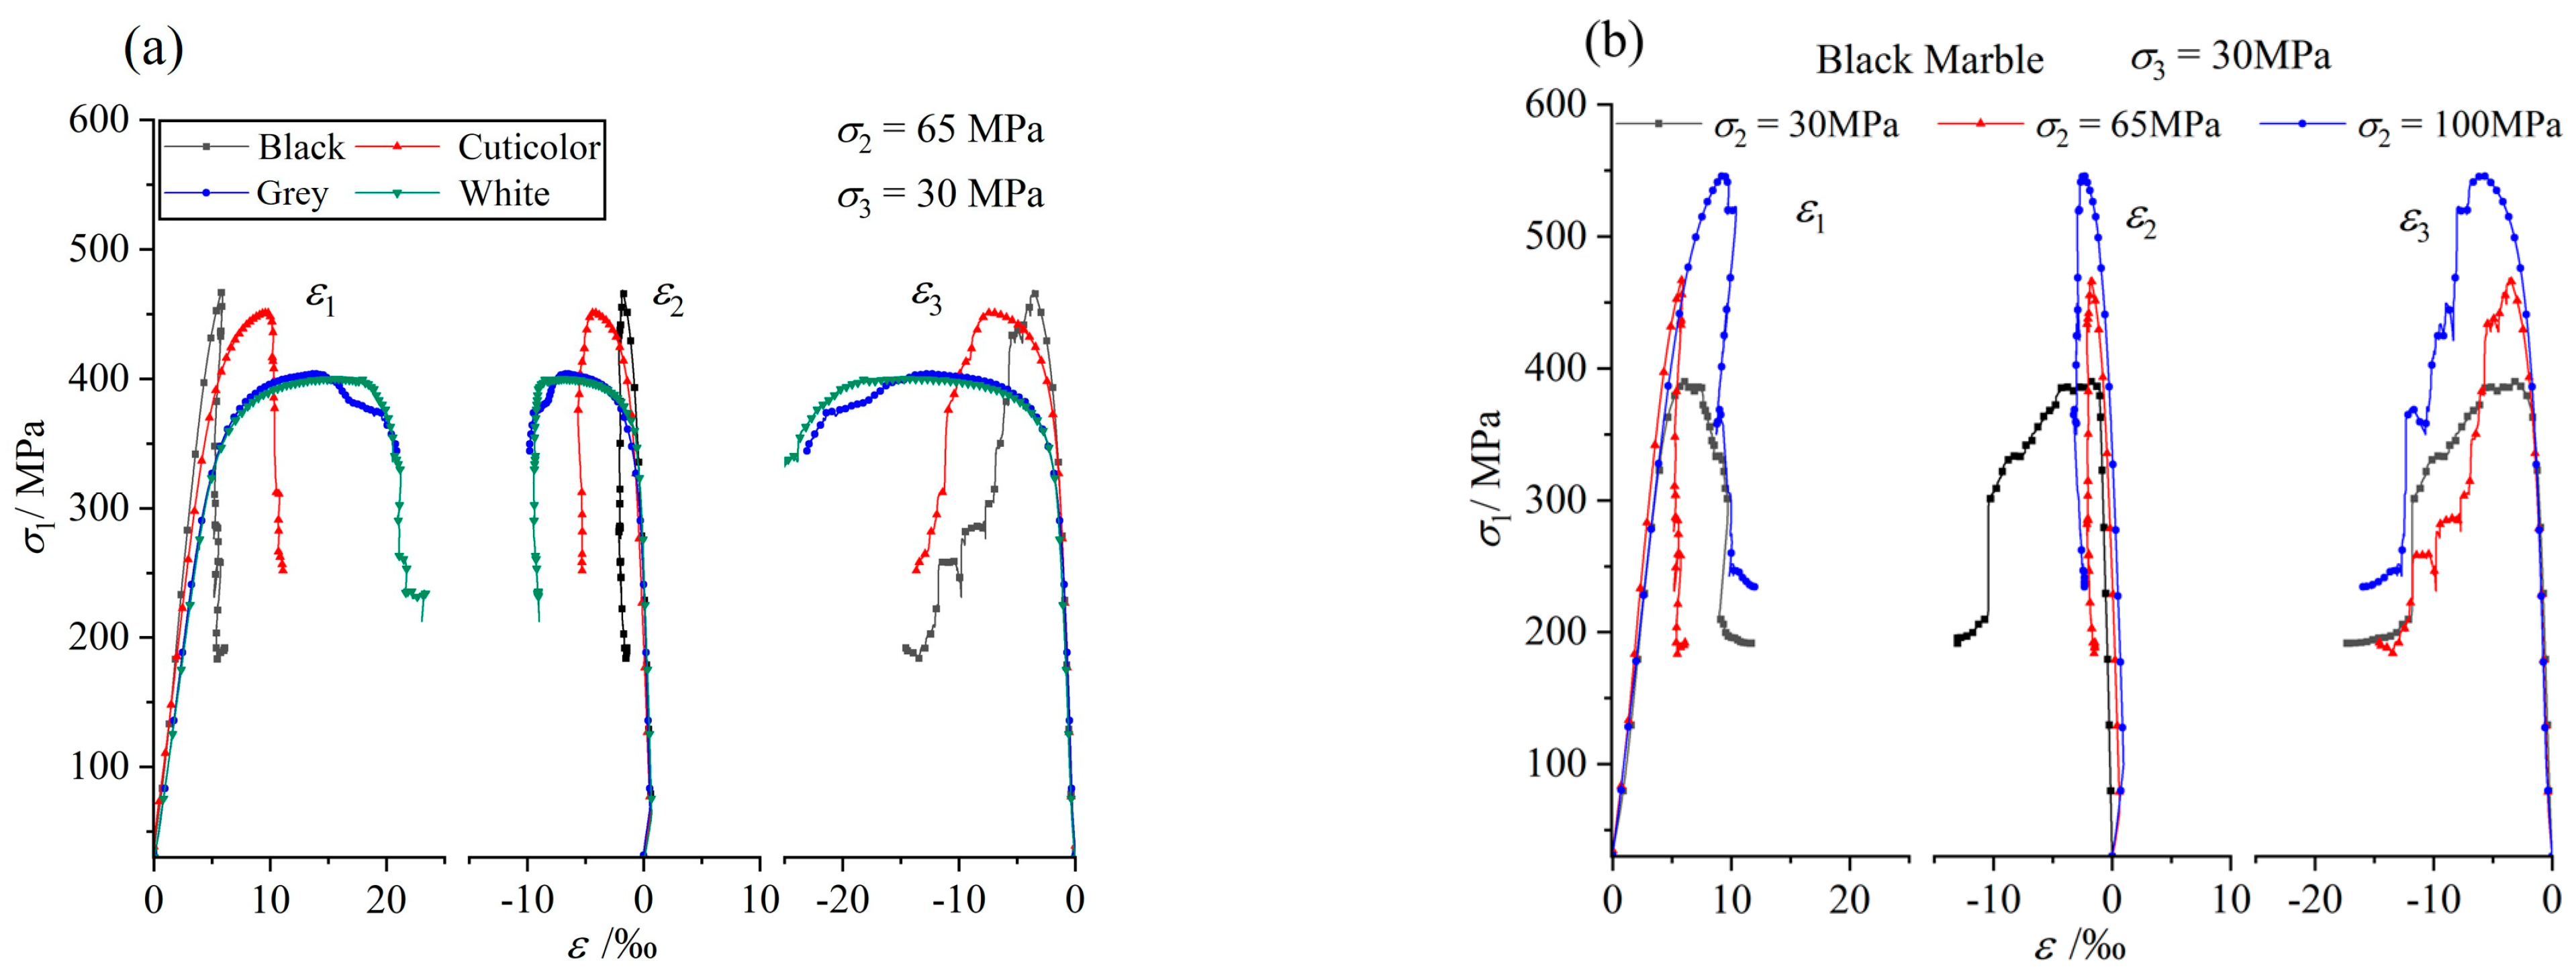
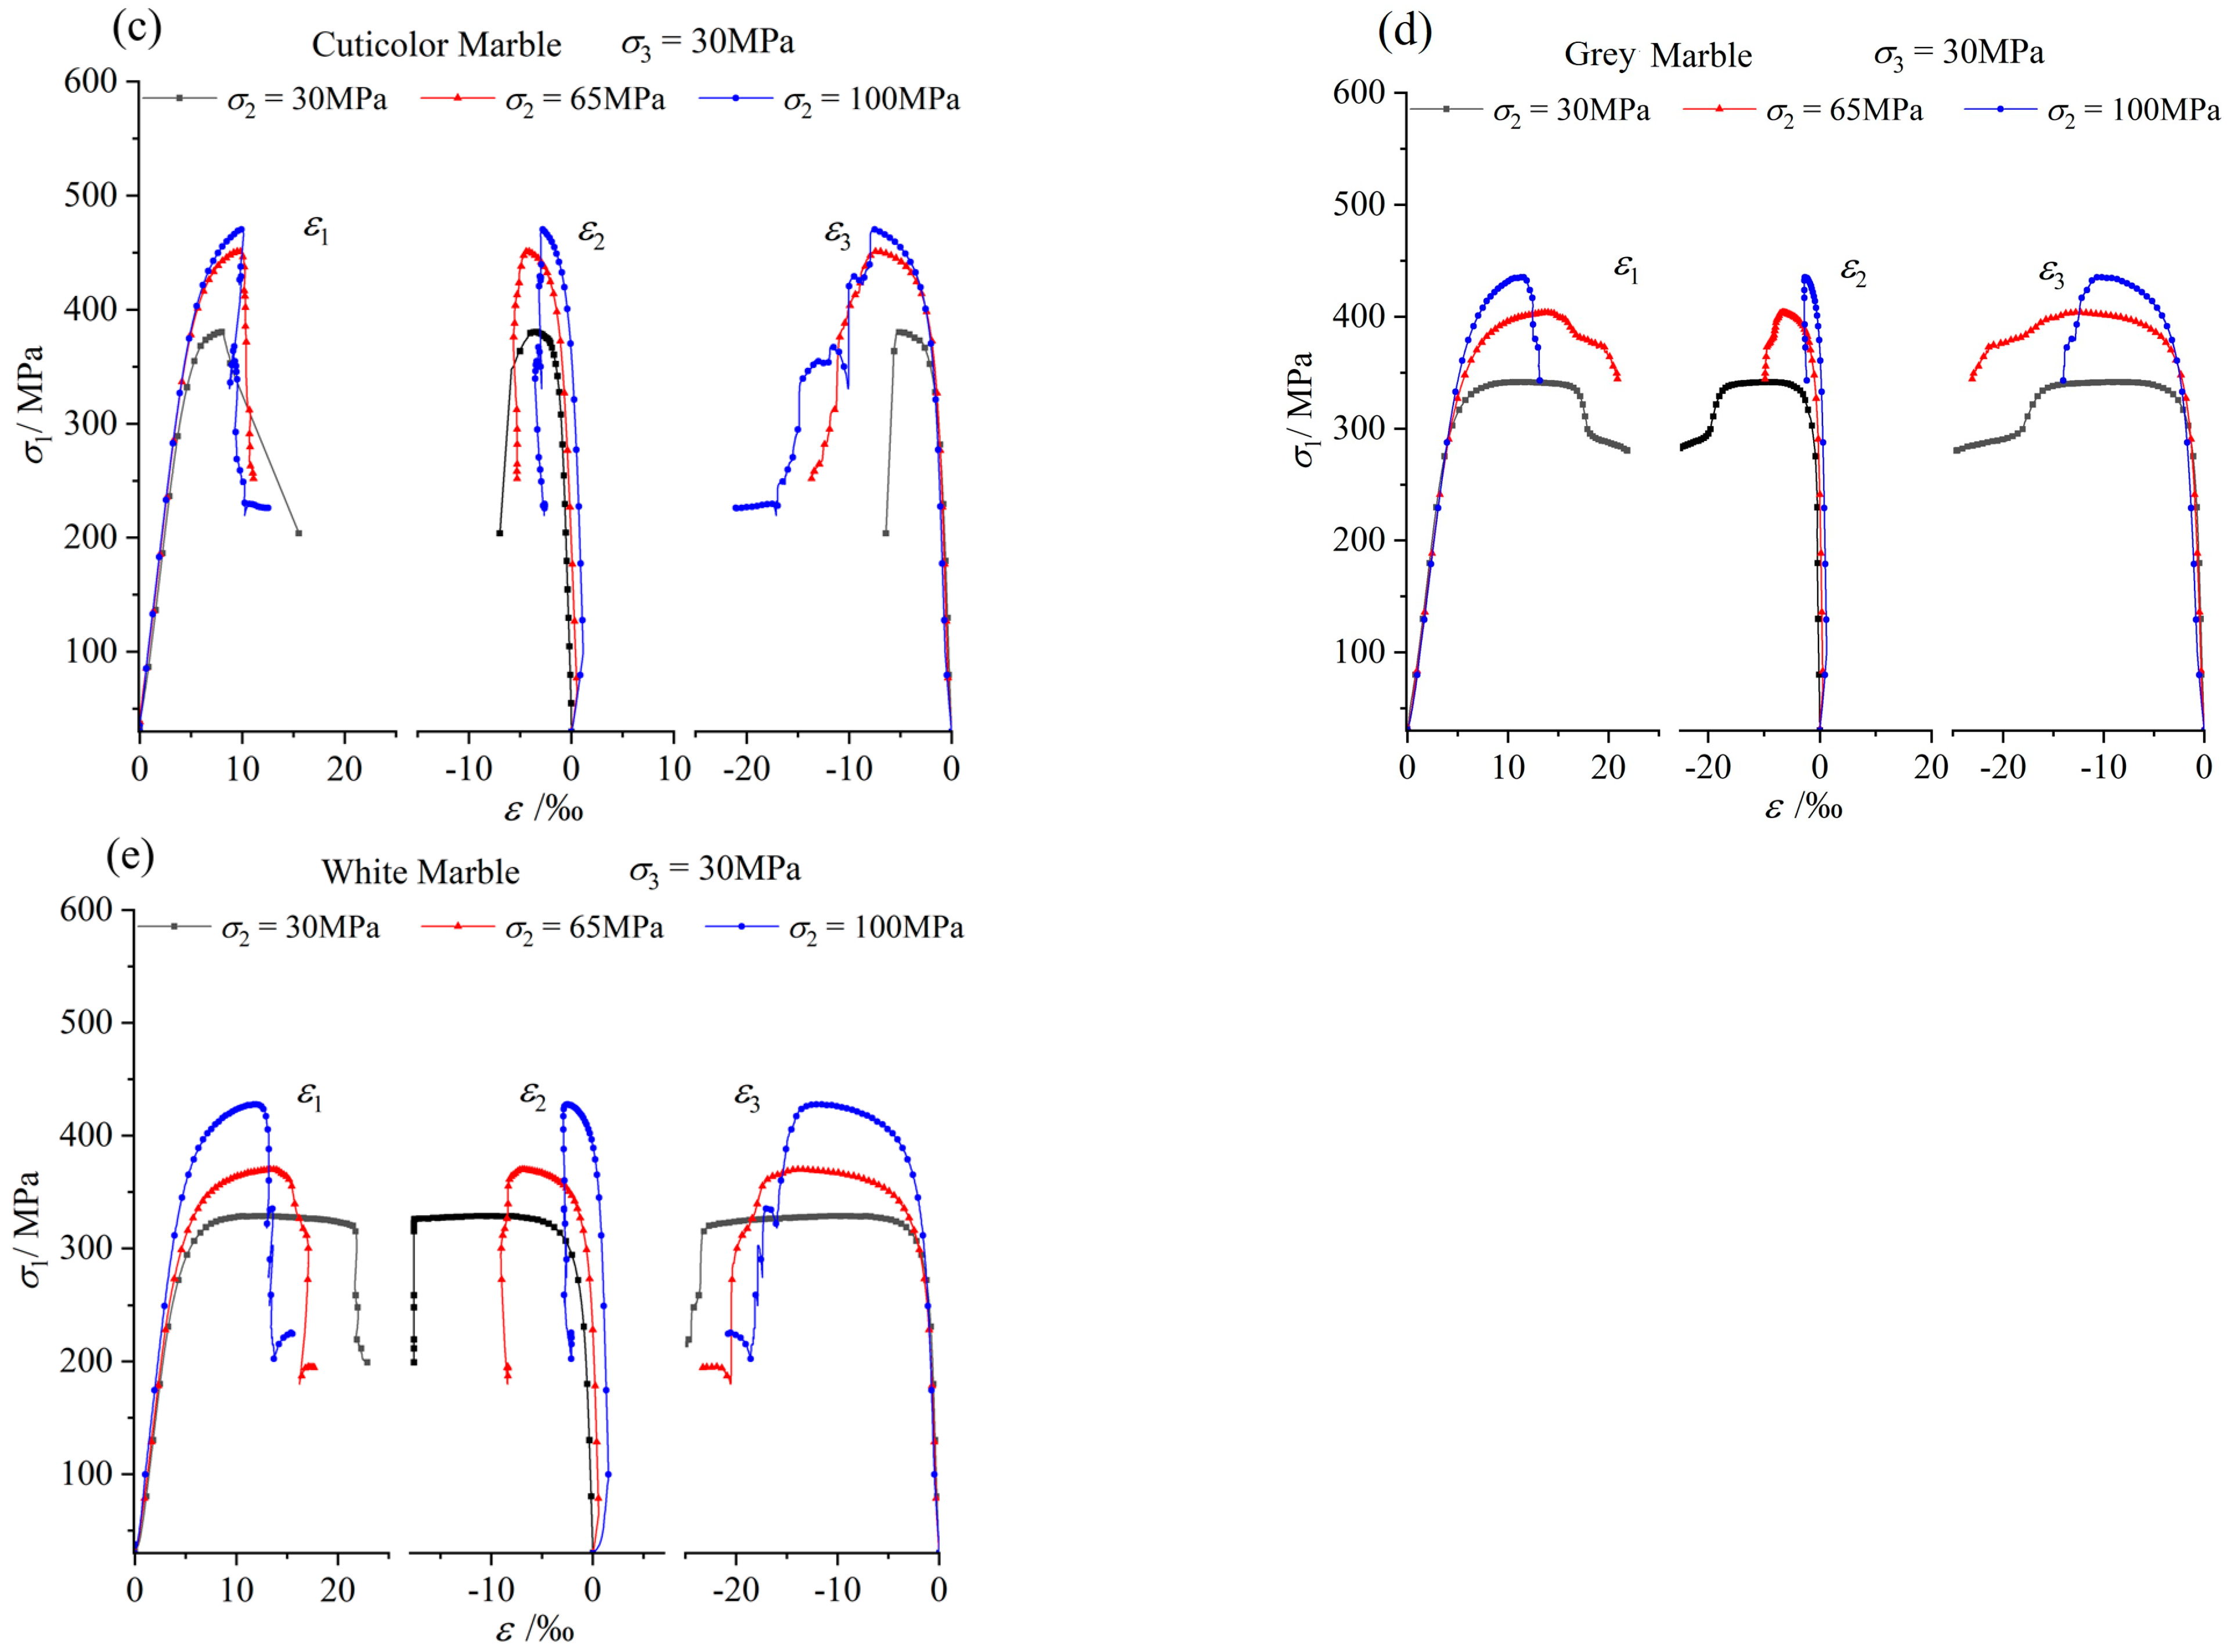
3.3. Deformation Characteristics
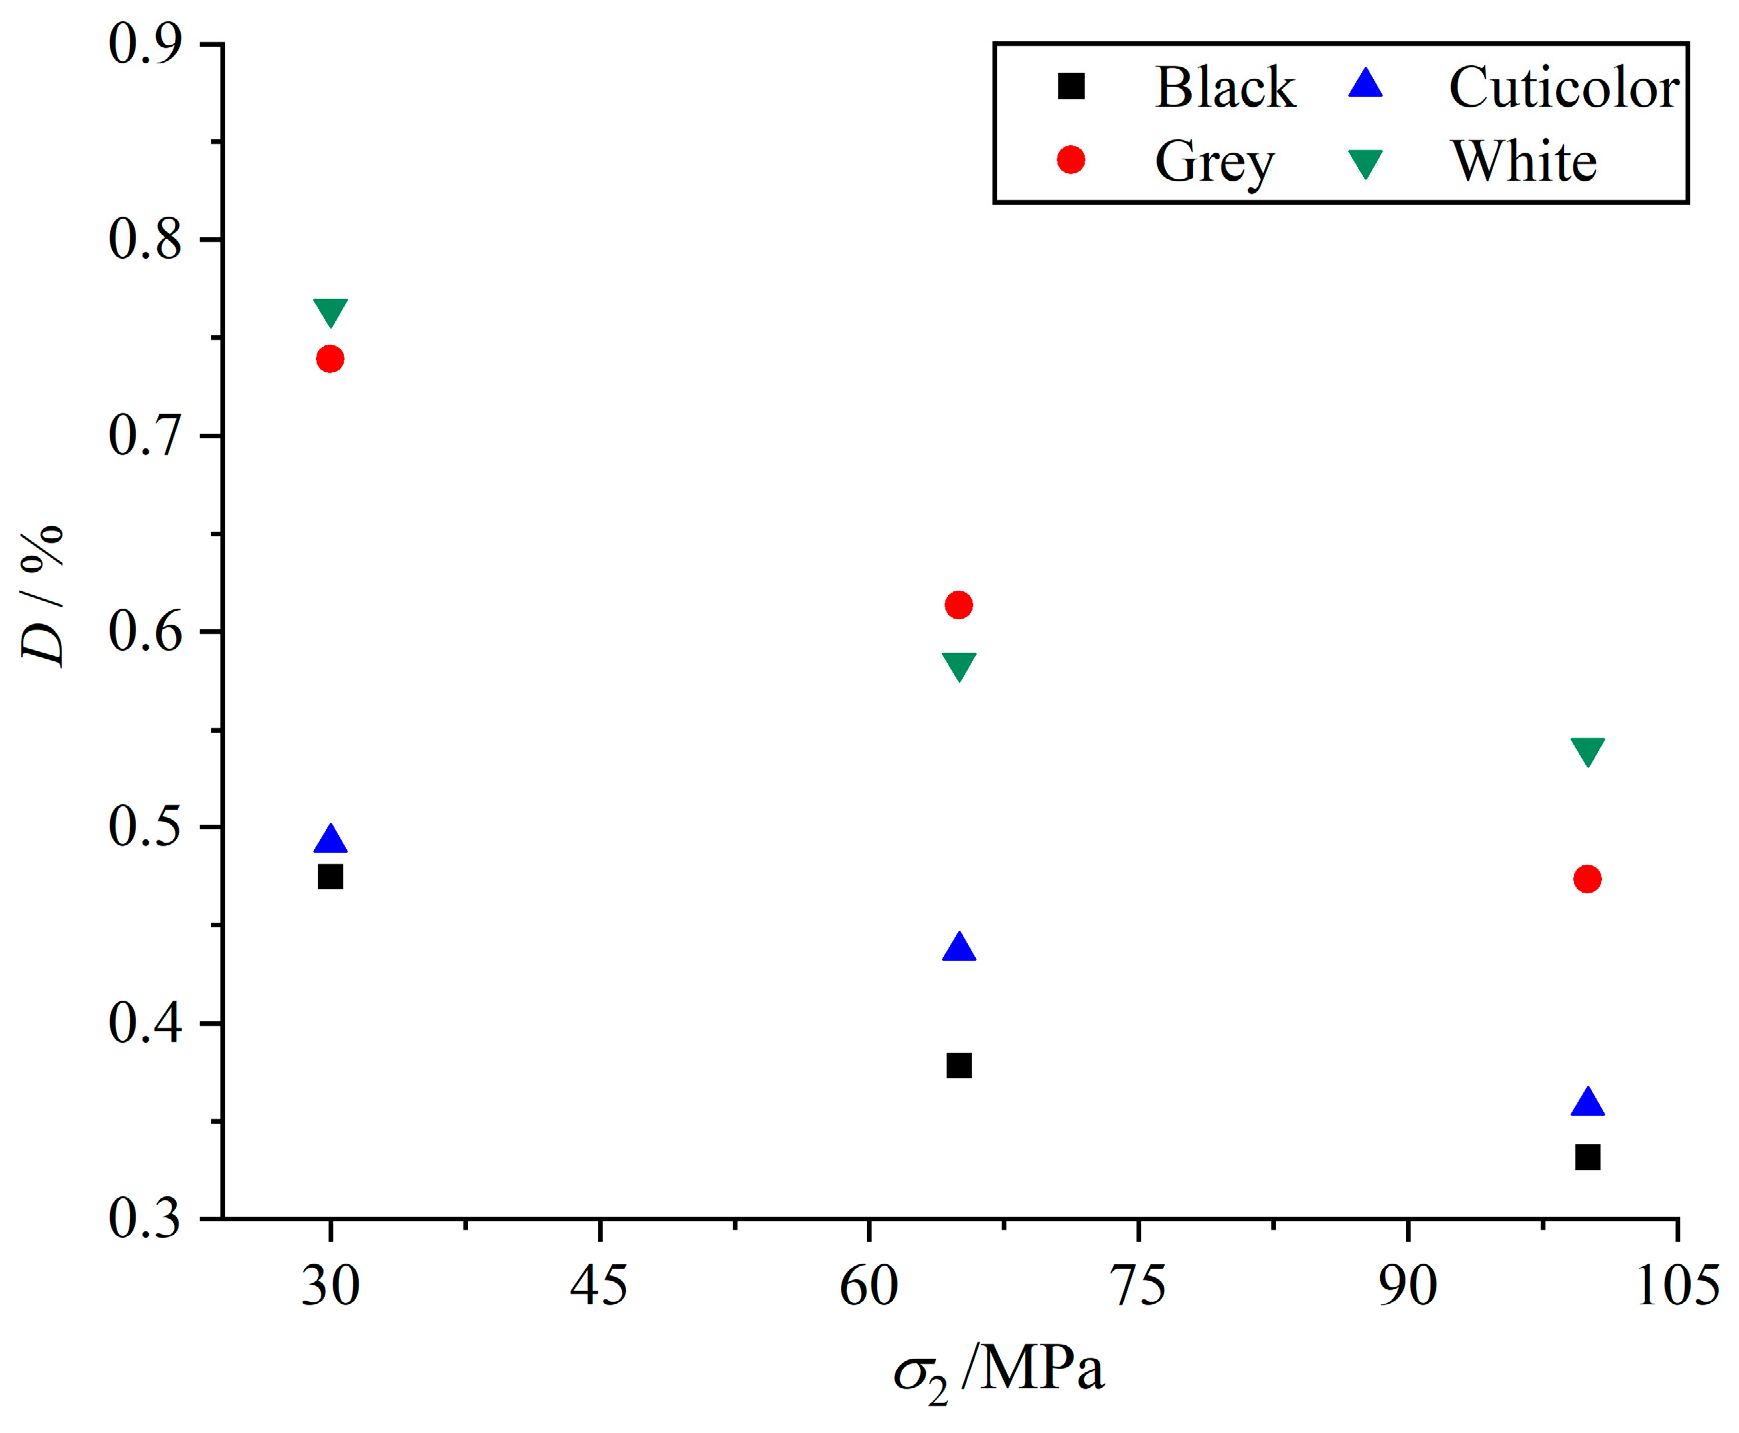
3.4. Brittle Ductility Characteristics
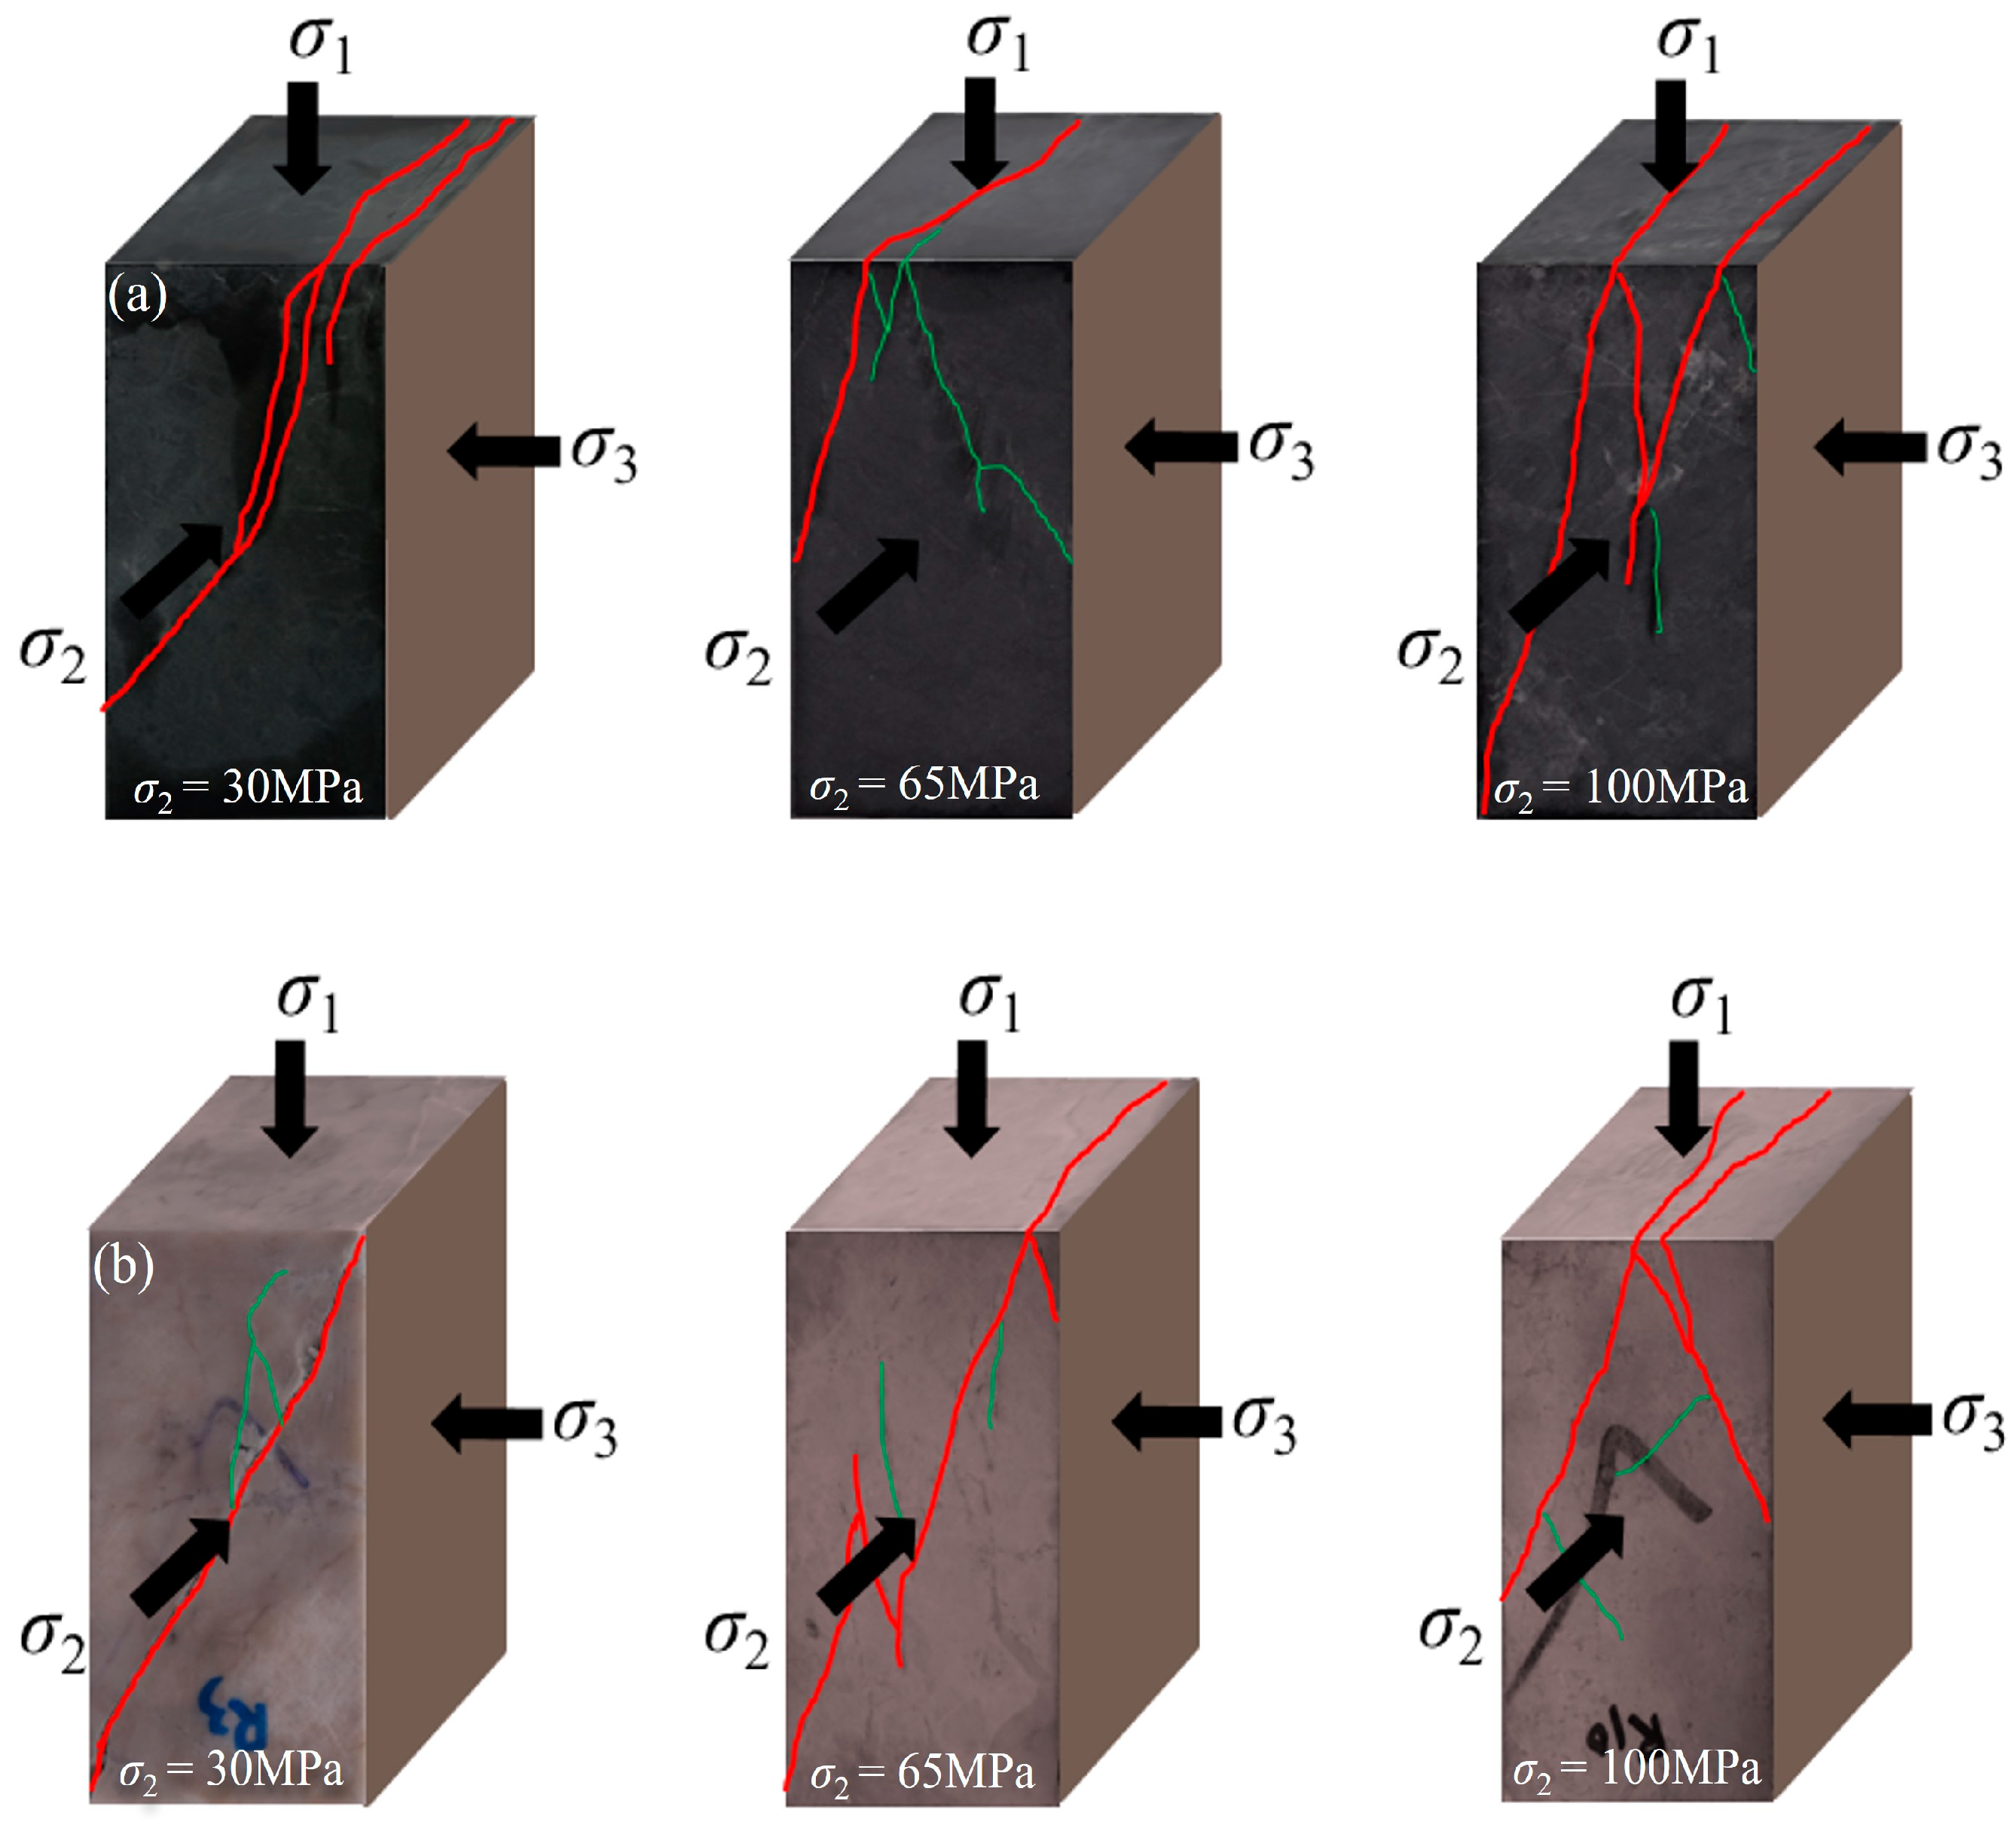
3.5. Failure Characteristics
4. Failure Mechanisms
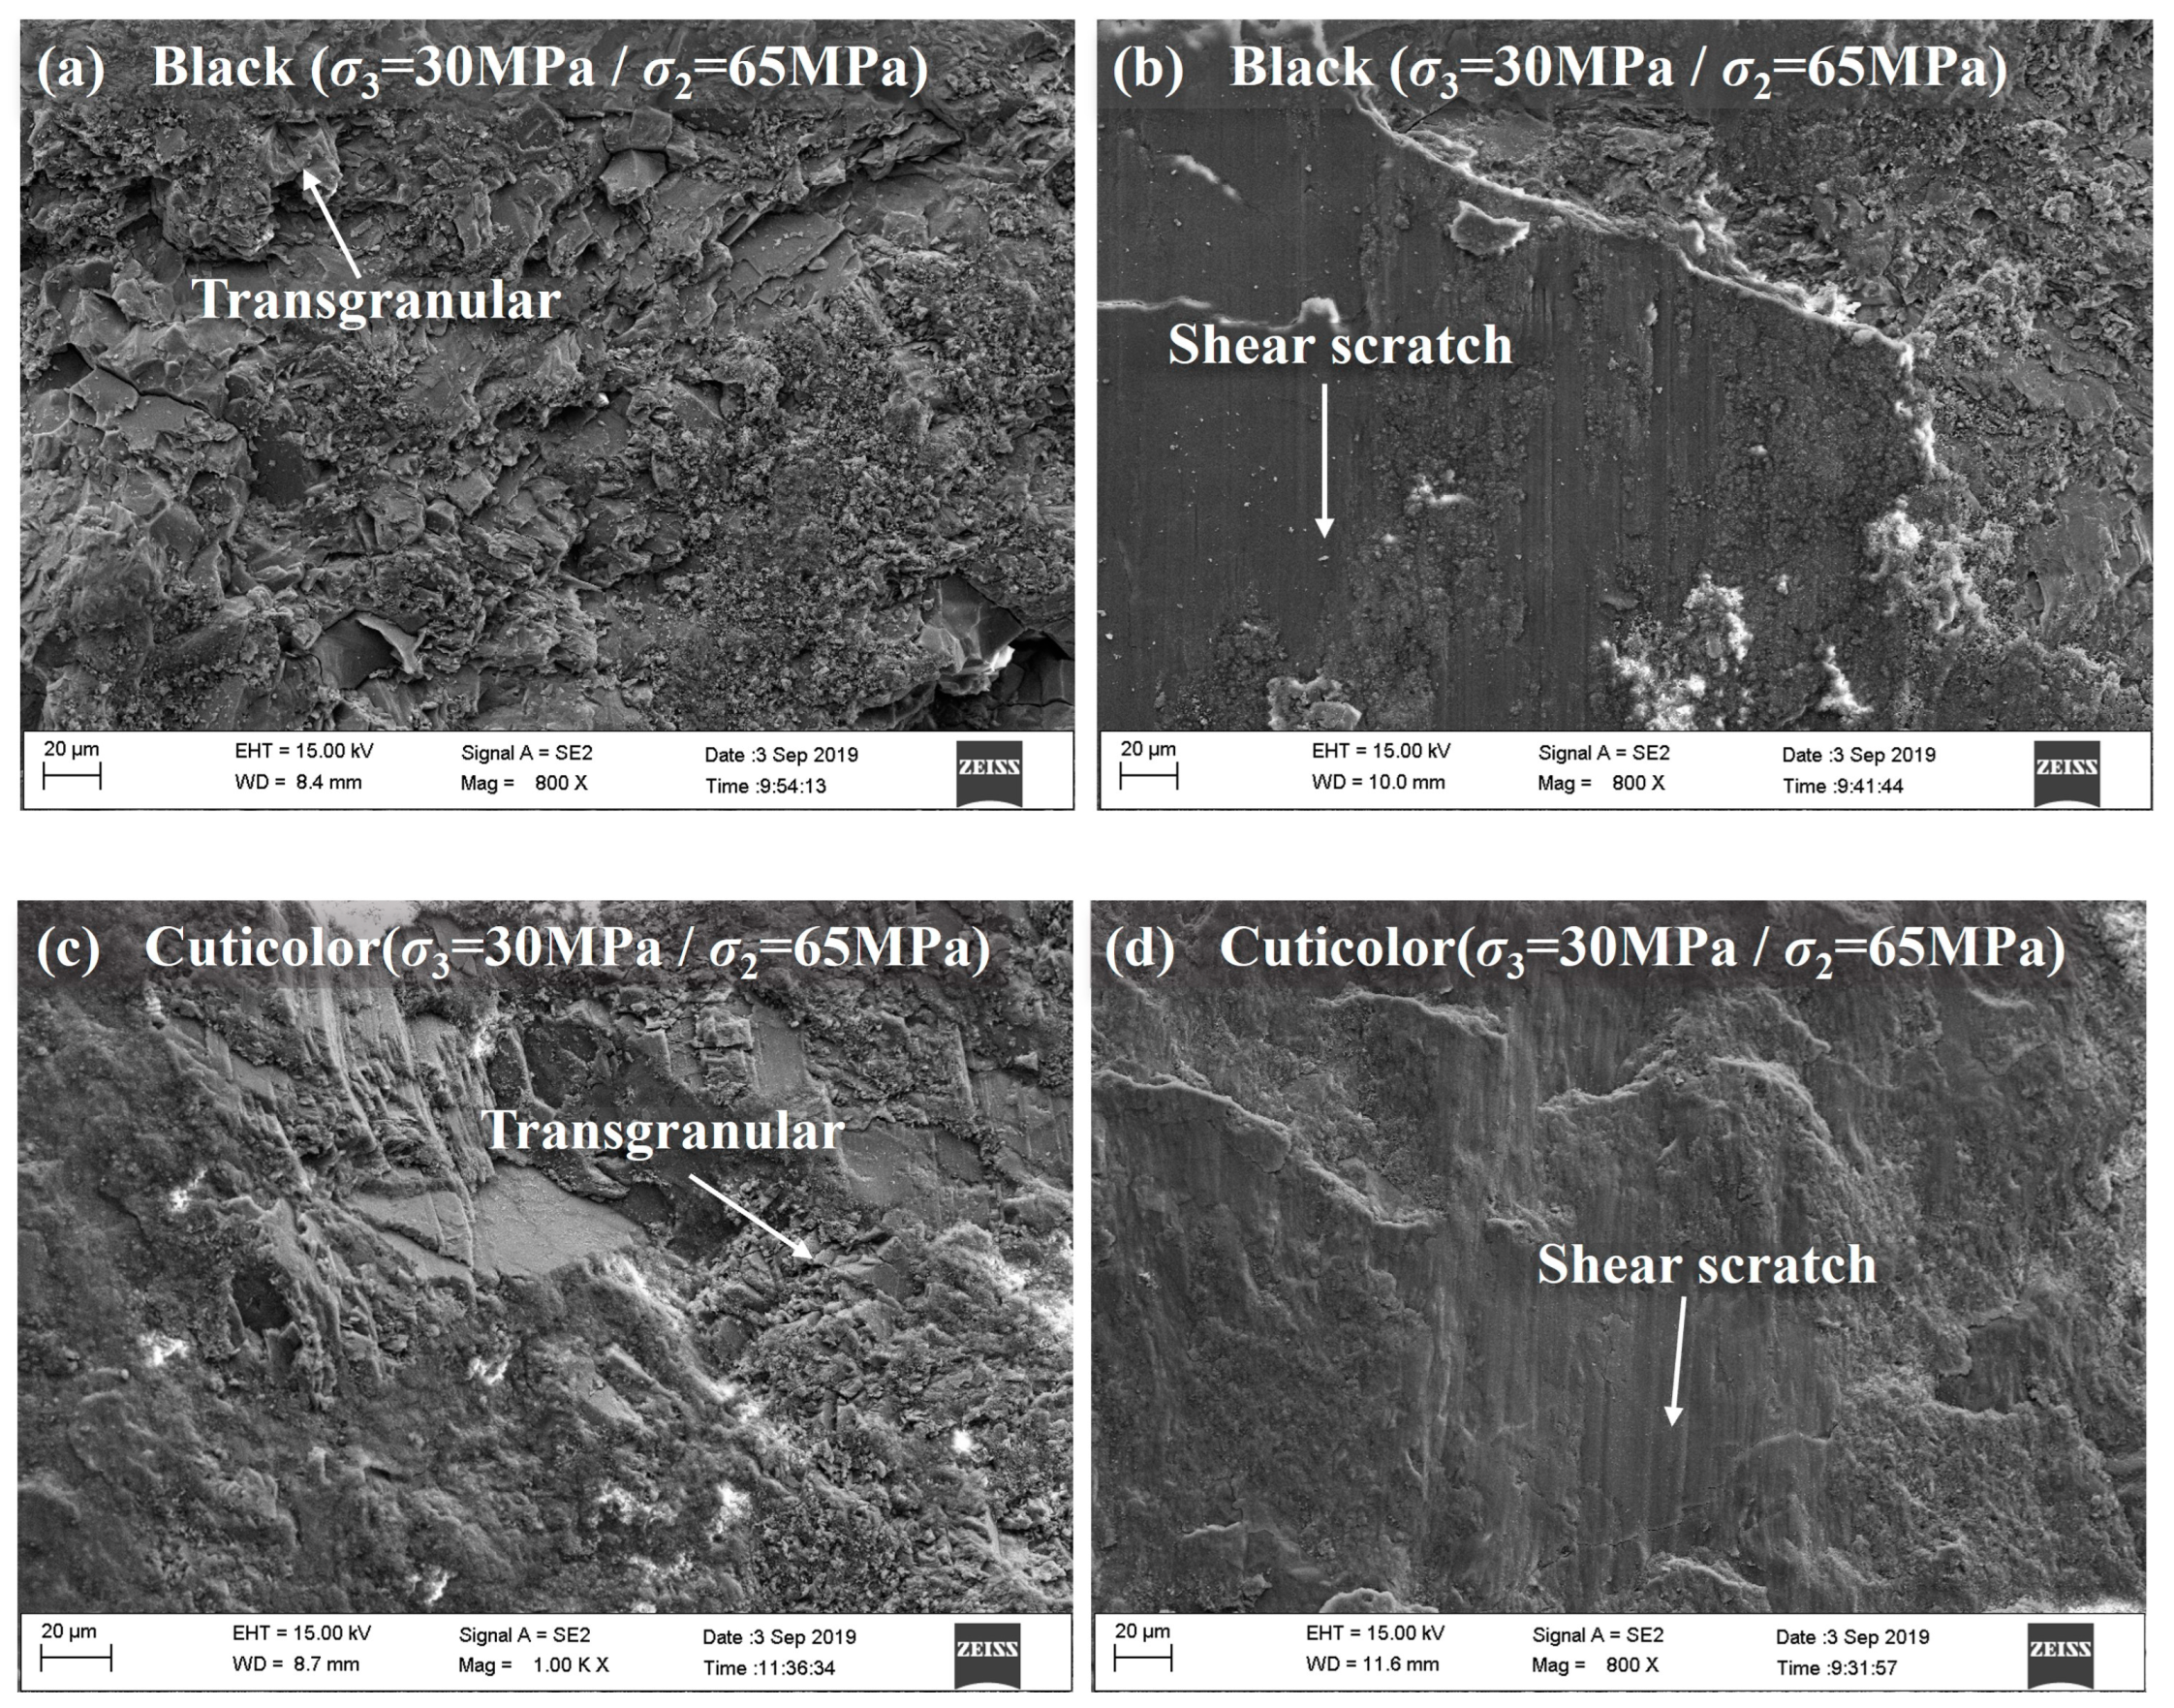
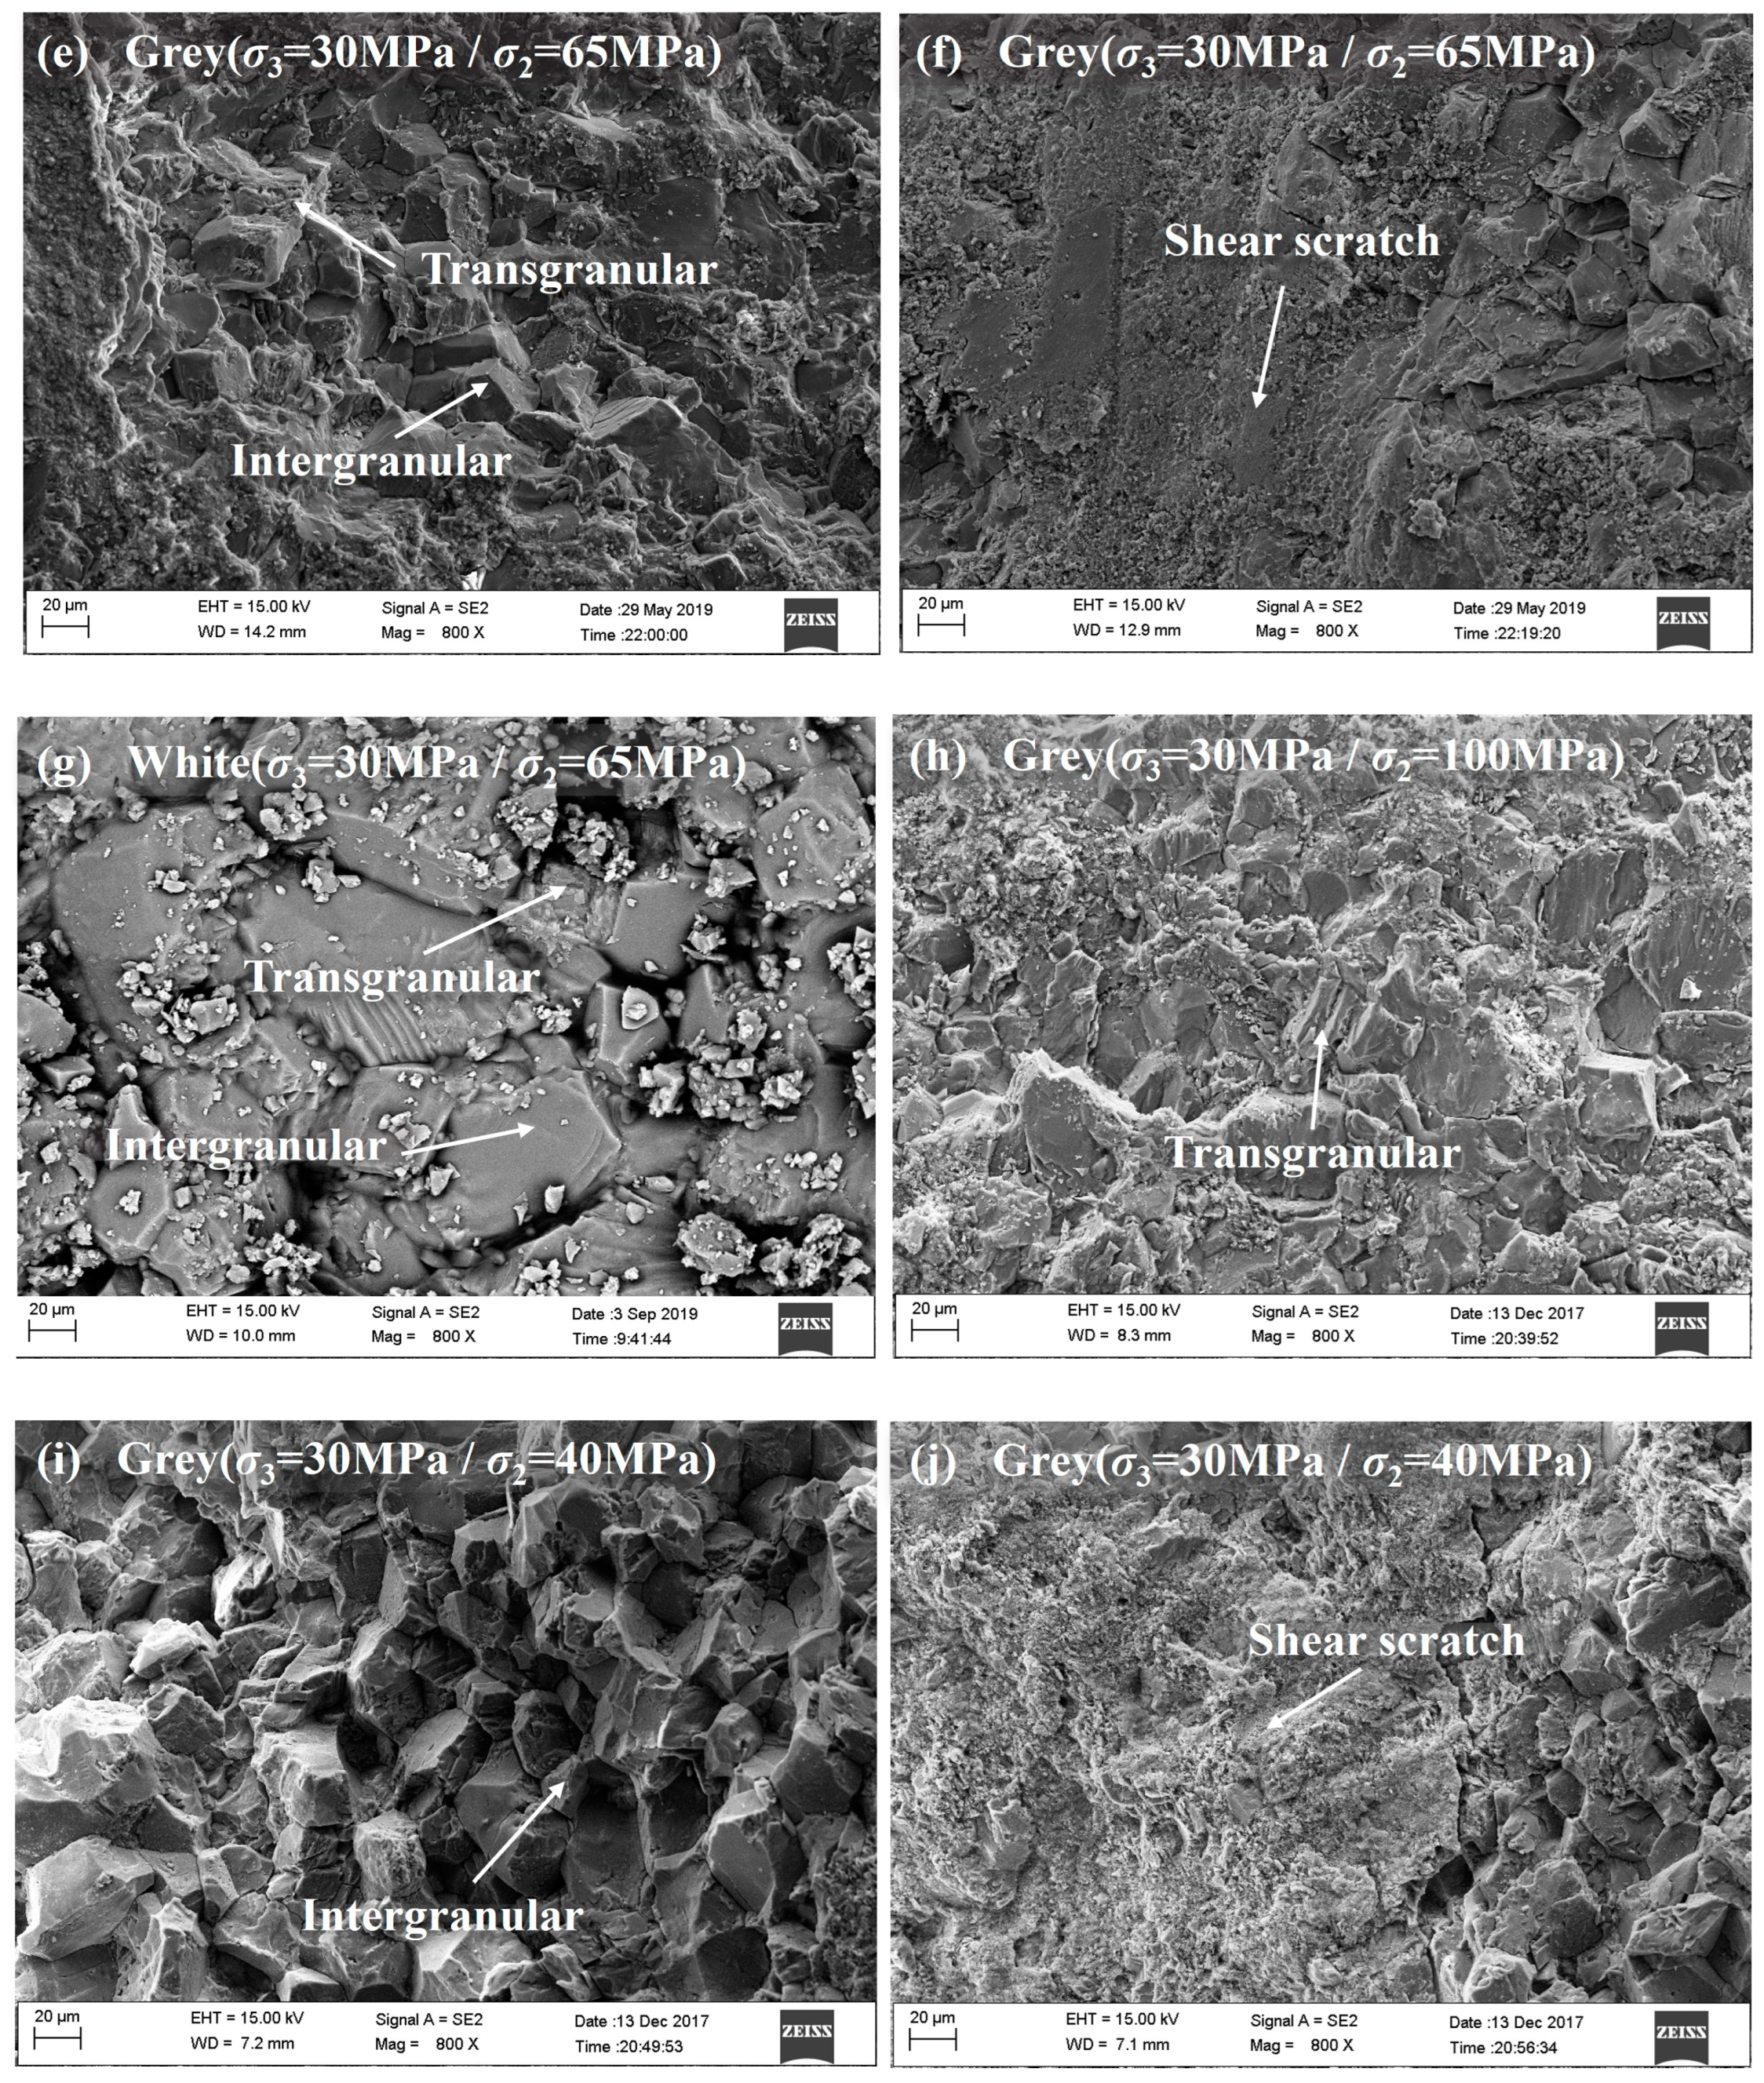
4.1. SEM Tests
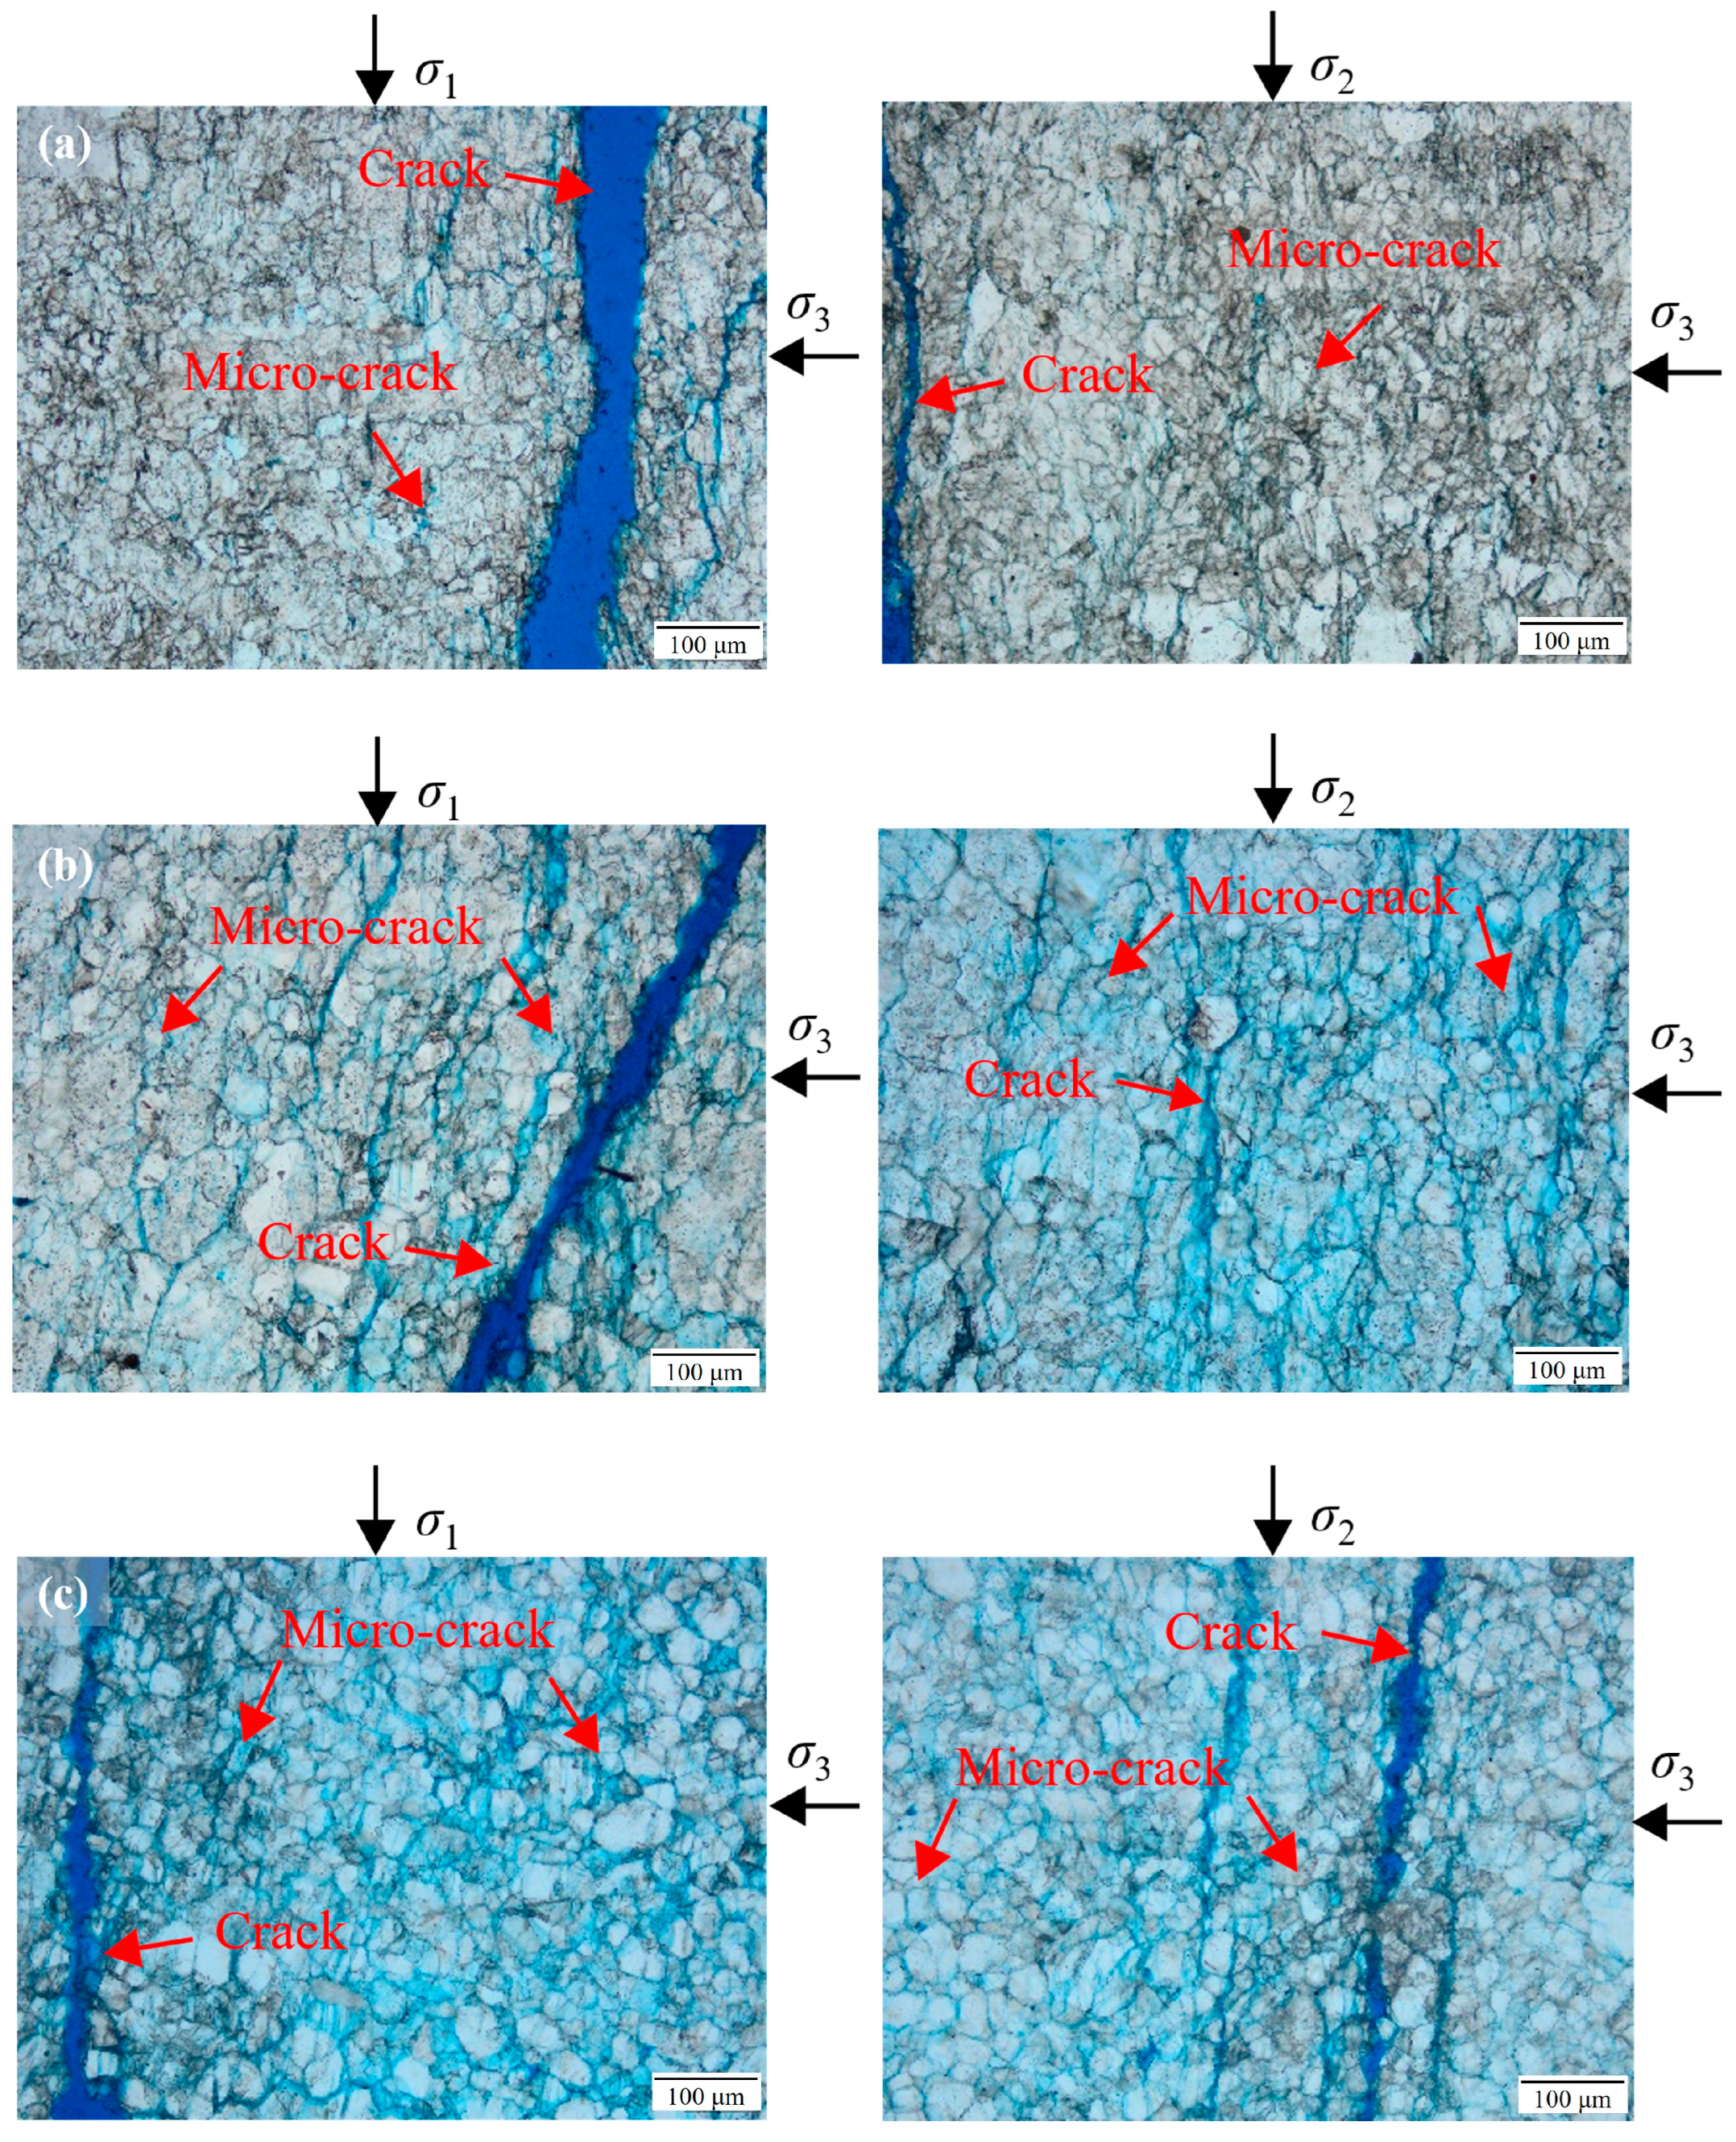
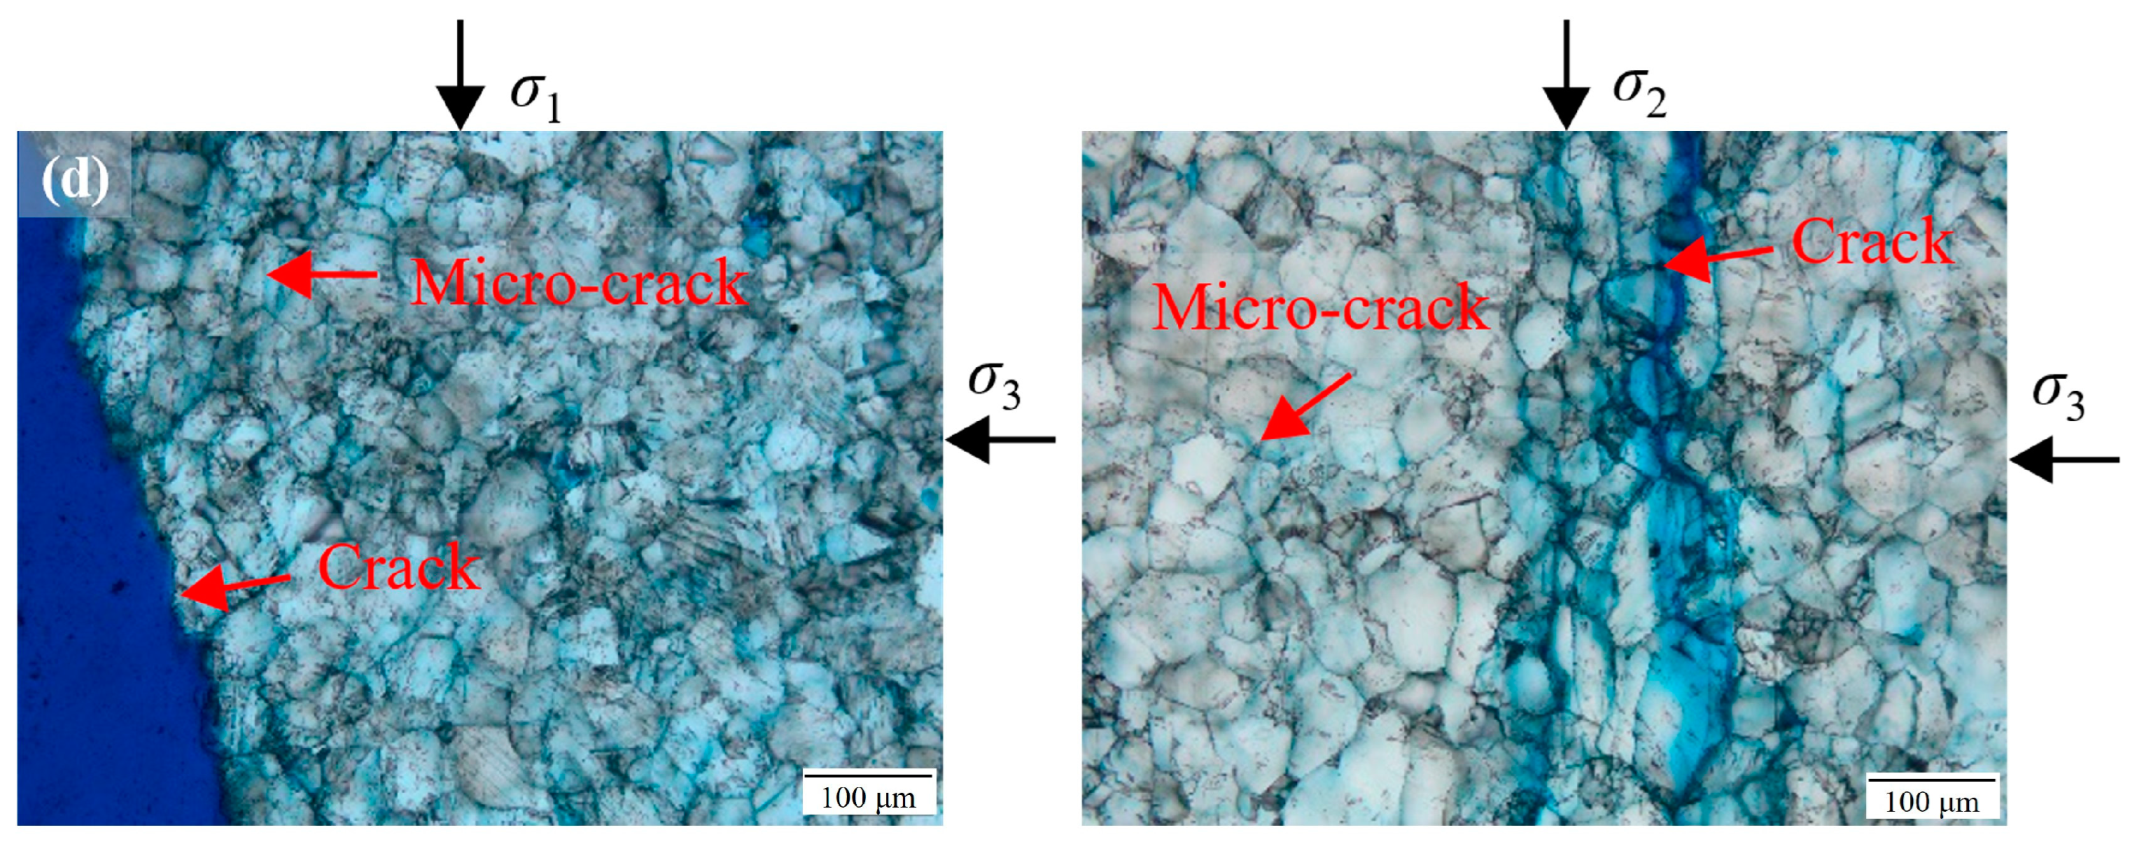
4.2. Microfracture Analysis
5. Discussion and Conclusions
5.1. Discussion
5.2. Conclusions
- (1)
- The crack initiation strength, damage strength, peak strength, and modulus of elasticity of the Jinping marble in various colors increase with an increase in the intermediate principal stress, while the peak strain shows a tendency of increasing and then decreasing with an increase in the intermediate principal stress.
- (2)
- Under the same stress conditions, Jinping marble exhibits increased strength with decreasing grain size, increasing quartz, and sodium feldspar content, following the pattern σB > σC > σG > σW, while the peak strain decreases with decreasing grain size and increasing quartz and sodium feldspar content.
- (3)
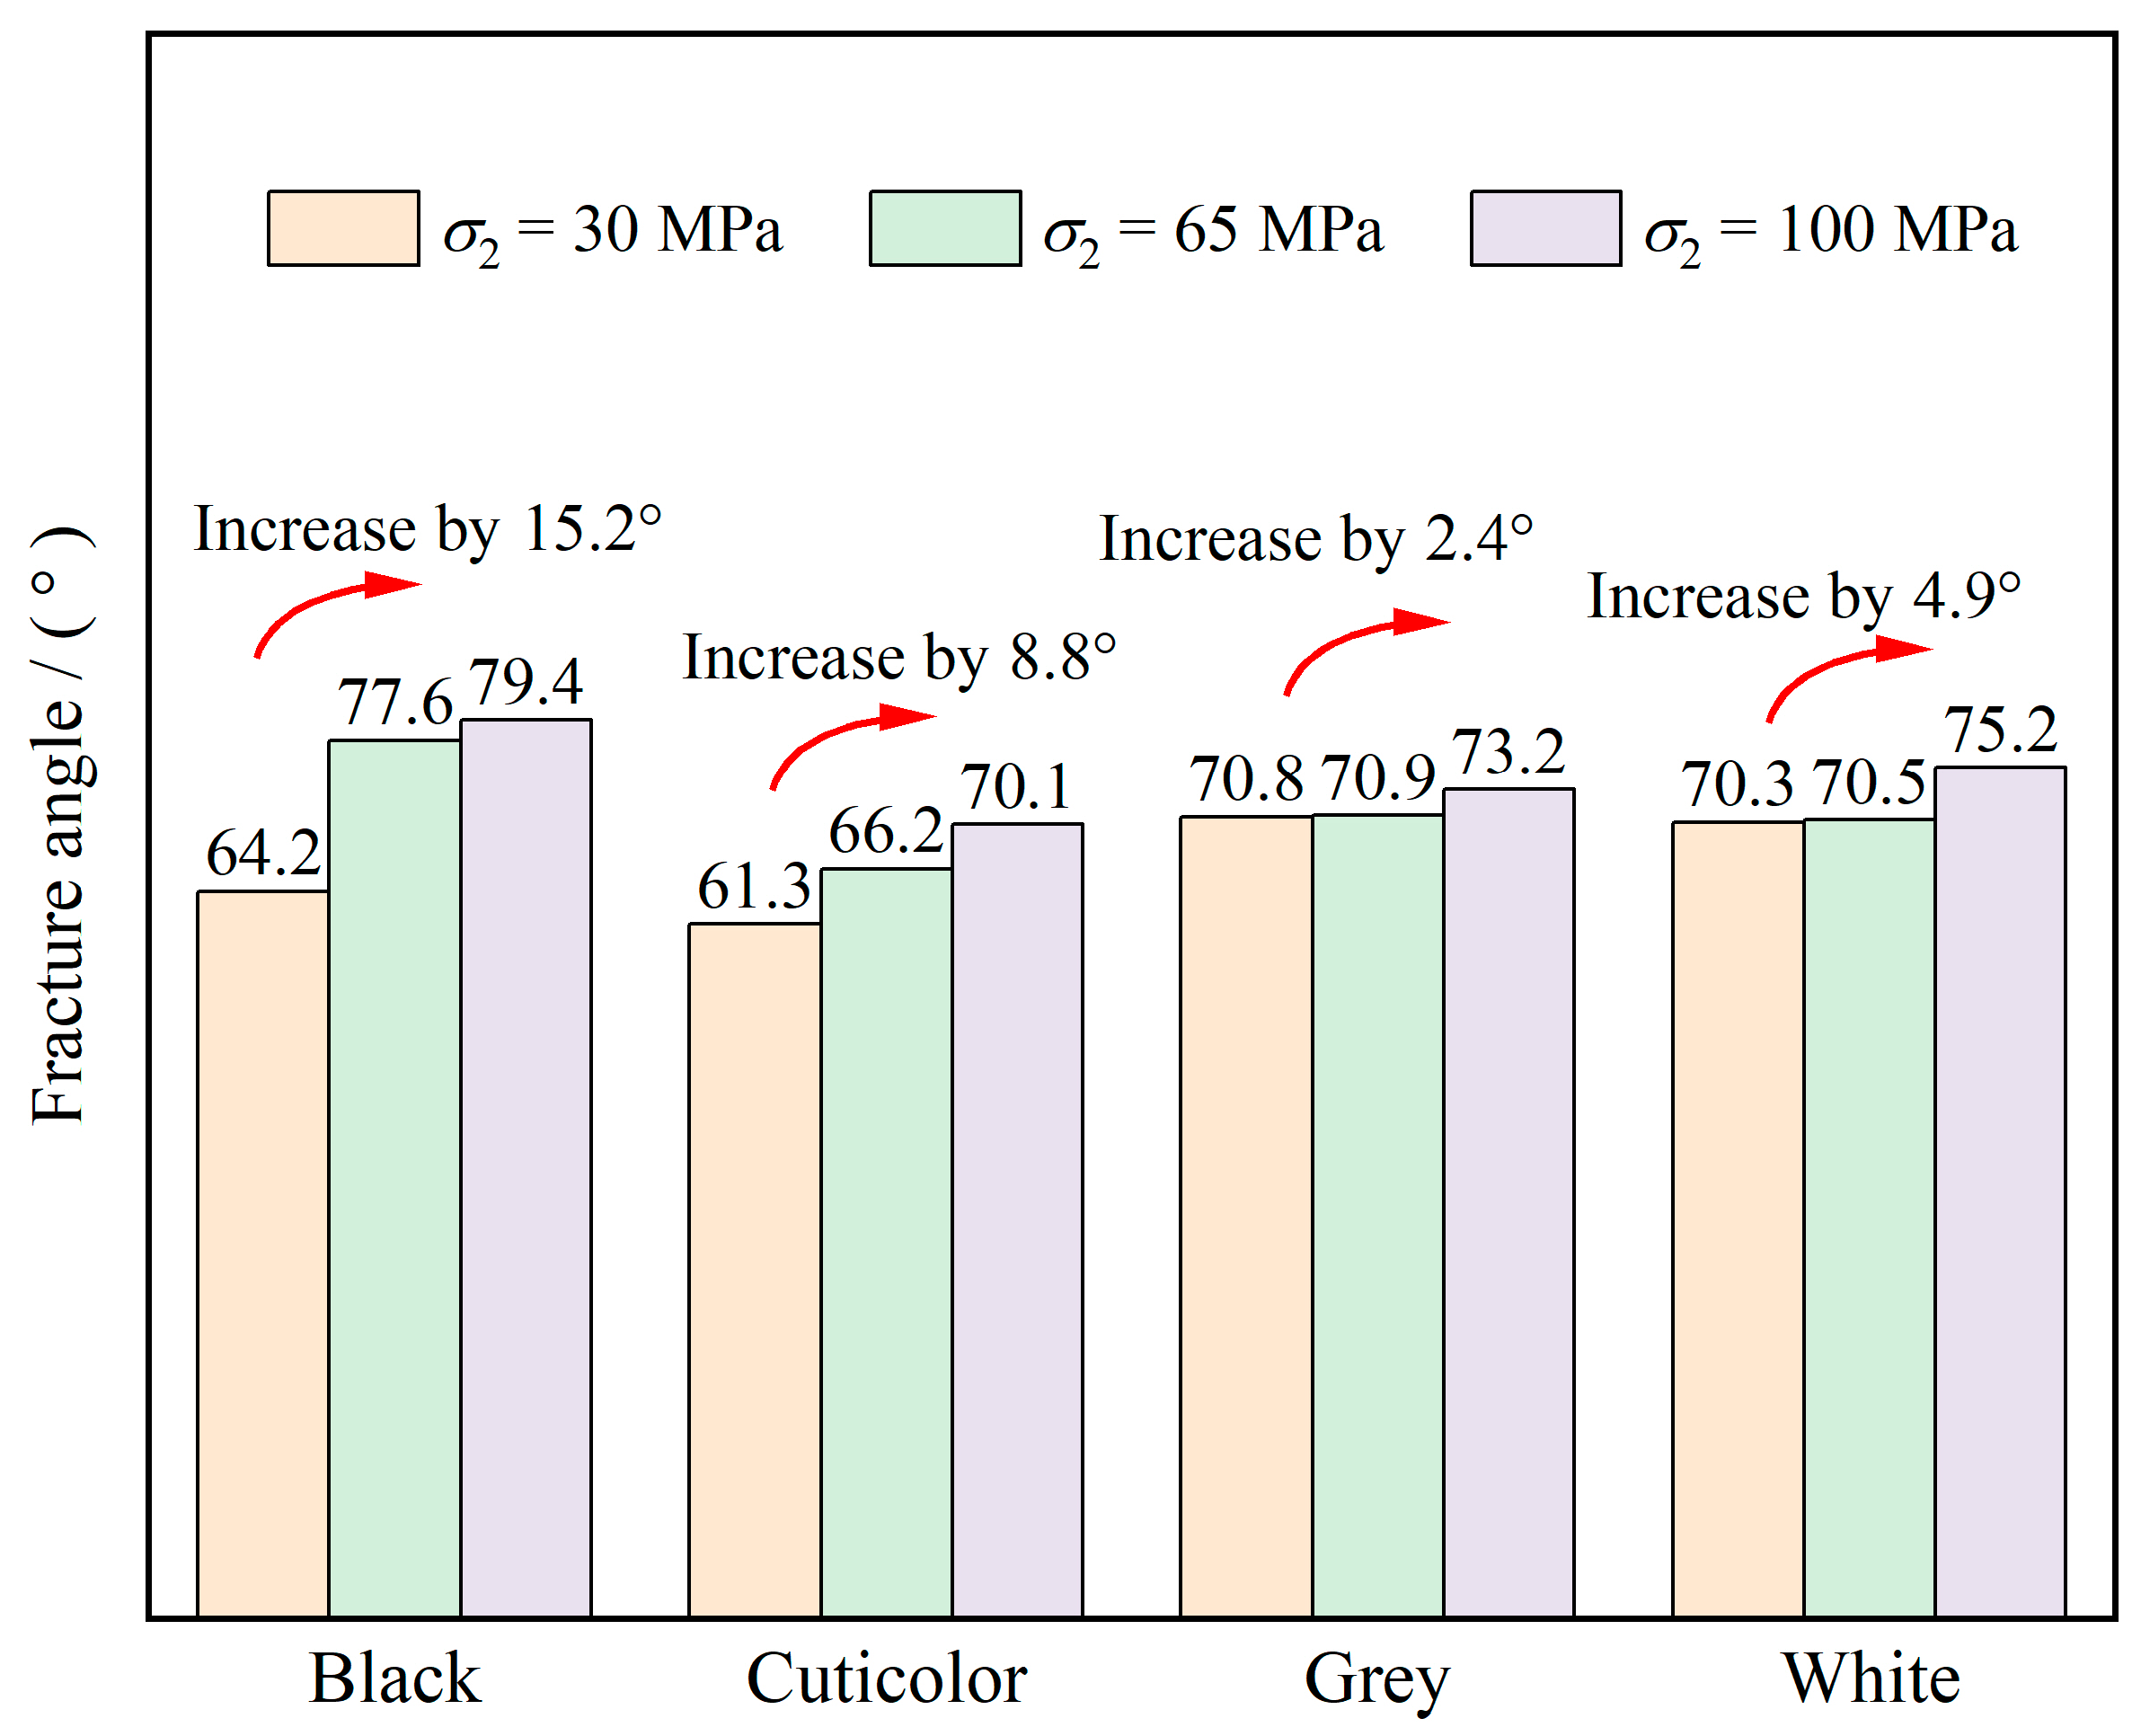
- The brittleness index B and ductility index D are defined. The brittleness characteristics and failure angle of Jinping marble are positively correlated with the intermediate principal stress, the content of brittle minerals, such as quartz and sodium feldspar, and negatively correlated with the grain size, while the ductility characteristics are the opposite.
- (4)
- As the intermediate principal stress increases and the grain size decreases, the more pronounced the transgranular tensile failure is and the more violent the failure is in Jinping marble. The number of microcracks increases with increasing grain size and decreases with increasing quartz and sodium feldspar content and intermediate principal stresses.
- (5)
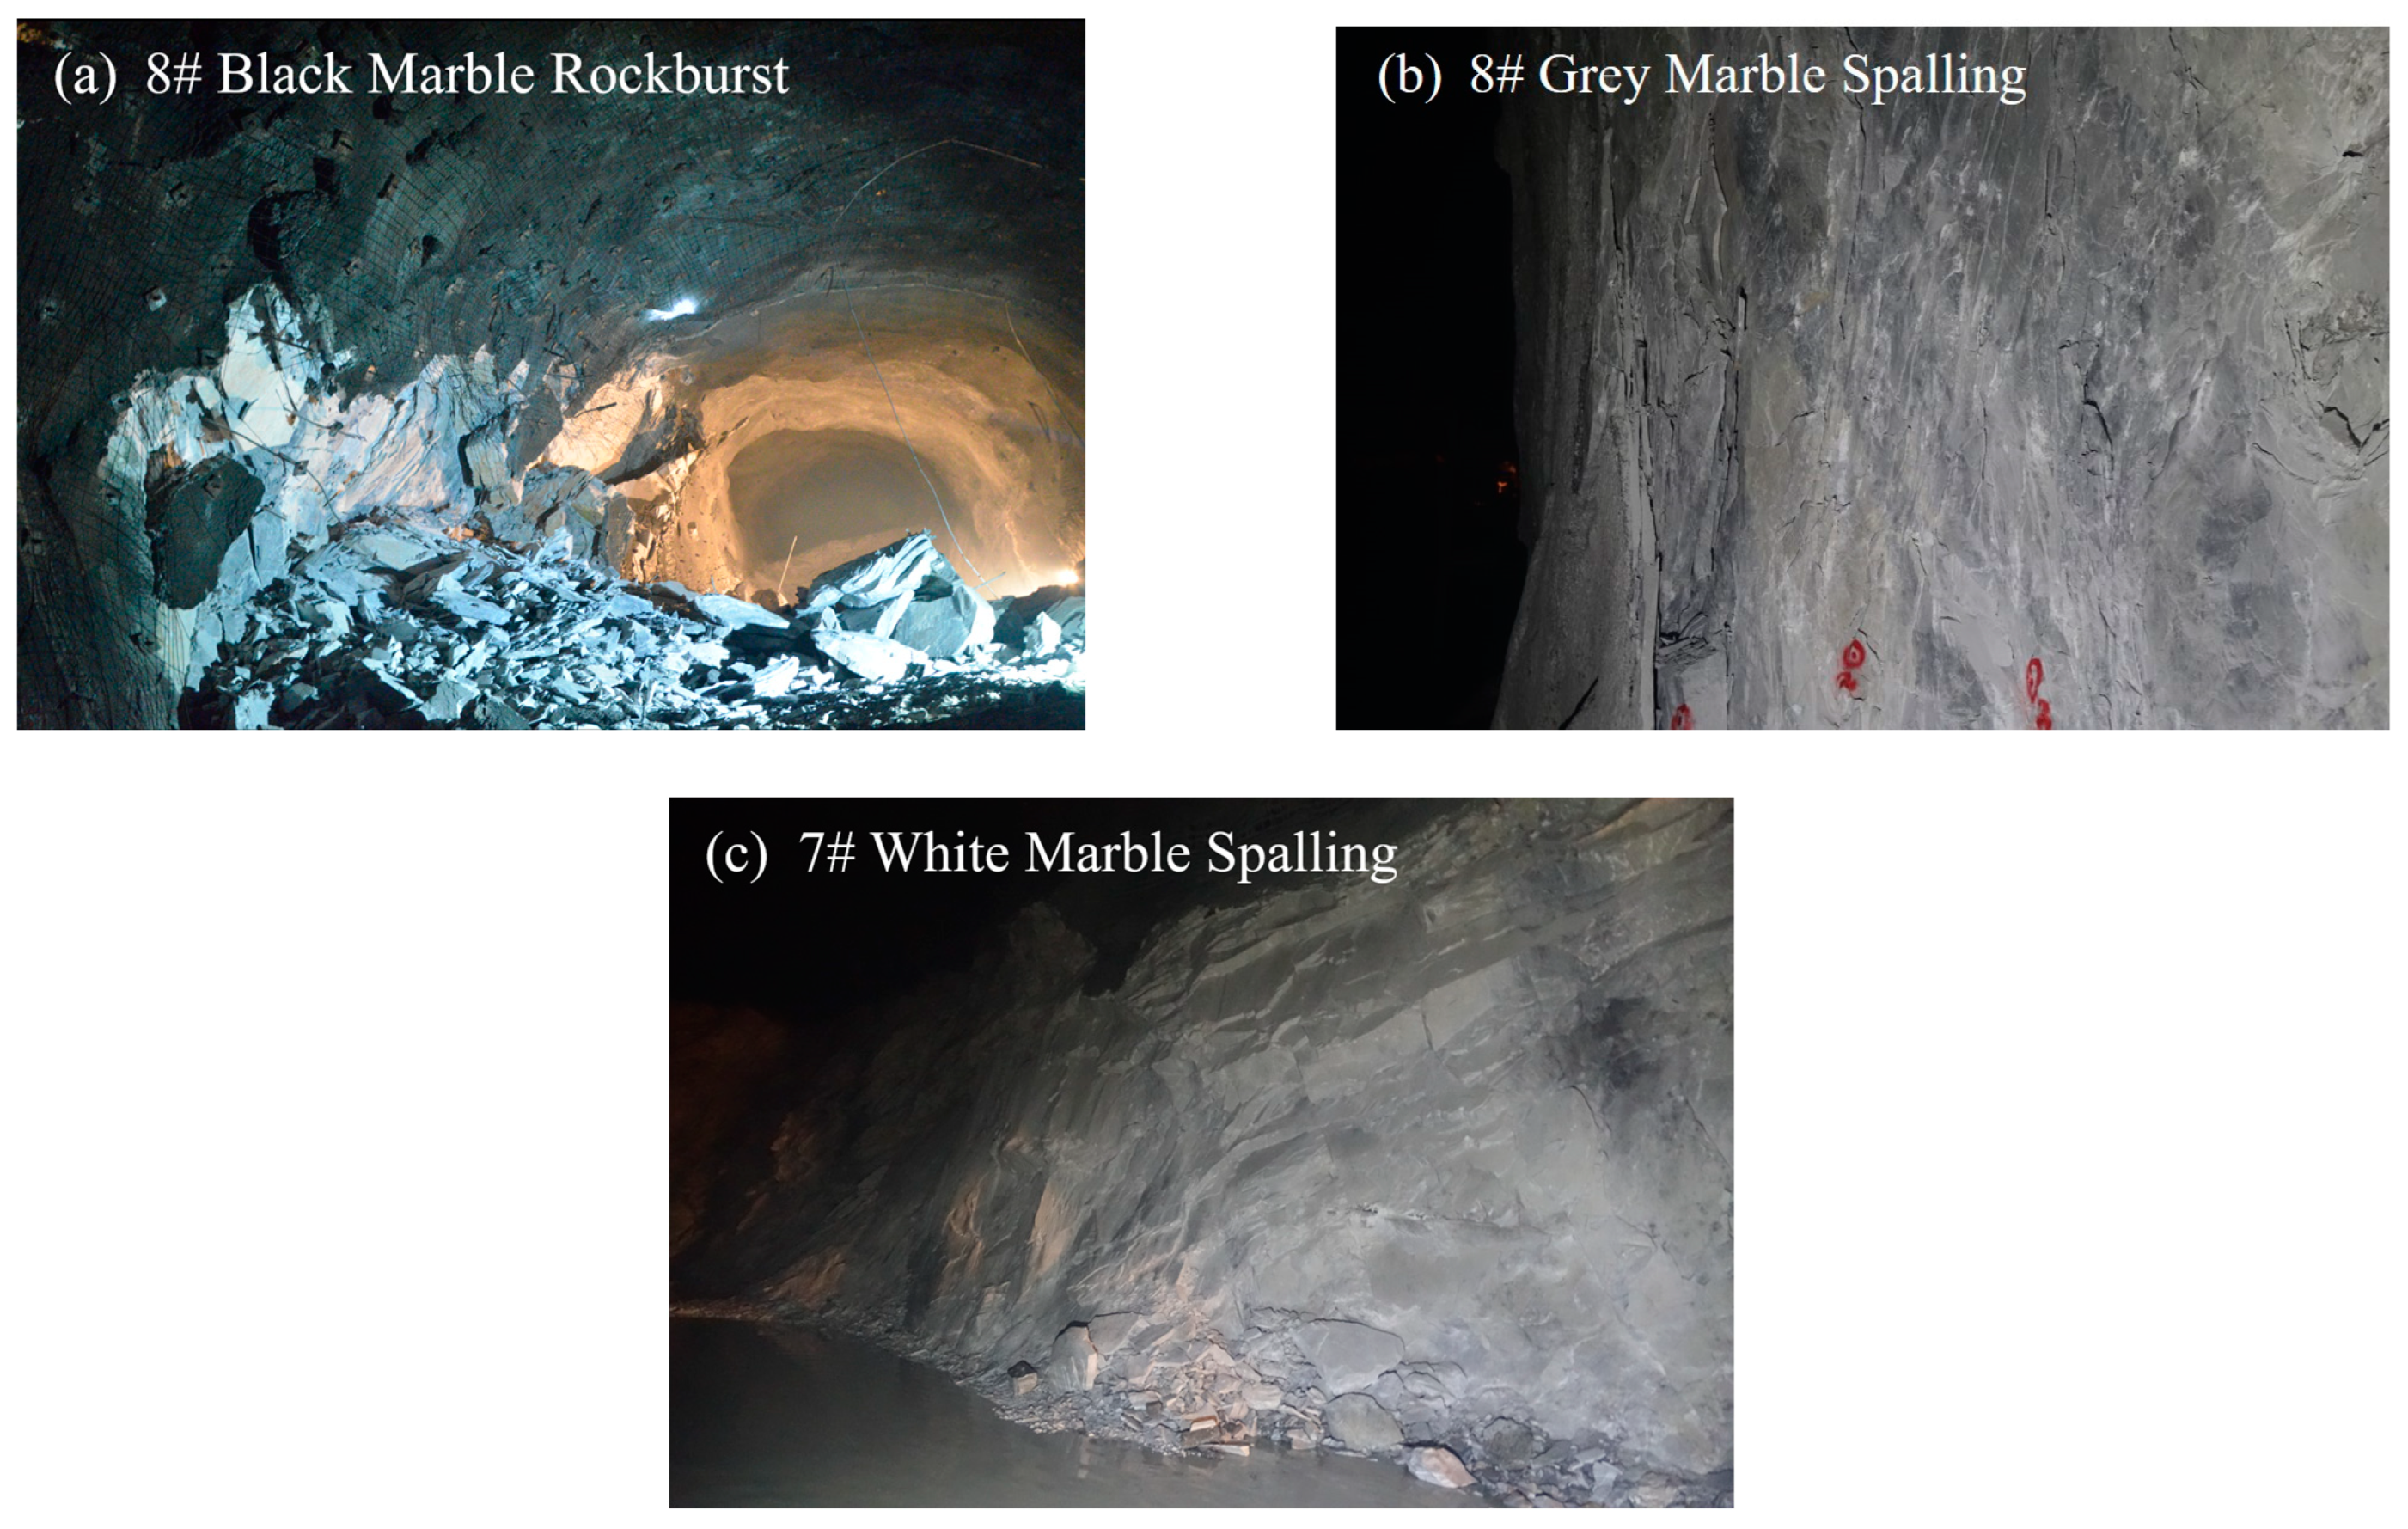
- Under the same geostress conditions, the spalling failure depth in the rock site is positively correlated with the grain size and negatively correlated with the content of brittle minerals, and the spalling failure degree is negatively correlated with the grain size and positively correlated with the content of brittle minerals.
Author Contributions
Funding
Data Availability Statement
Acknowledgments
Conflicts of Interest
References
- Haimson, B.; Chang, C. A new true triaxial cell for testing mechanical properties of rock, and its use to determine rock strength and deformability of Westerly granite. Int. J. Rock Mech. Min. Sci. 2000, 37, 285–296. [Google Scholar] [CrossRef]
- Xie, H.P.; Lu, J.; Li, C.B.; Li, M.H.; Gao, M.Z. Experimental study on the mechanical and failure behaviors of deep rock subjected to true triaxial stress: A review. Int. J. Min. Sci. Technol. 2022, 32, 915–950. [Google Scholar] [CrossRef]
- Xu, H.; Zhang, Z.; Zhang, Y.J.; Jiang, Q.; Qiu, S.L.; Zhou, Y.Y.; Feng, G.L. Effects of natural stiff discontinuities on the deformation and failure mechanisms of deep hard rock under true triaxial conditions. Eng. Fail. Anal. 2024, 158, 108034. [Google Scholar] [CrossRef]
- Feng, X.T.; Xu, H.; Yang, C.; Zhang, X.; Gao, Y. Influence of Loading and Unloading Stress Paths on the Deformation and Failure Features of Jinping Marble under True Triaxial Compression. Rock Mech. Rock Eng. 2020, 53, 3287–3301. [Google Scholar] [CrossRef]
- Xu, H.; Feng, X.T.; Yang, C.; Zhang, X.; Zhou, Y.; Wang, Z. Influence of initial stresses and unloading rates on the deformation and failure mechanism of Jinping marble under true triaxial compression. Int. J. Rock Mech. Min. Sci. 2019, 117, 90–104. [Google Scholar] [CrossRef]
- Feng, G.; Ma, Q.; He, Z.; Su, G.; Chen, B.; Xu, D.; He, J. Time-delayed failure process of granite and its energy evolution and acoustic emission characteristics. Eng. Fail. Anal. 2024, 157, 107854. [Google Scholar] [CrossRef]
- Si, X.F.; Huang, L.Q.; Gong, F.Q.; Liu, X.L.; Li, X.B. Experimental investigation on influence of loading rate on rockburst in deep circular tunnel under true-triaxial stress condition. J. Cent. S. Univ. 2020, 27, 2914–2929. [Google Scholar] [CrossRef]
- Feng, G.L.; Ma, J.G.; Chen, B.R.; Xiao, Y.X.; Jiang, Q.; Li, P.X.; Lin, M.Q. Microseismic energy and intensity criterion of rockburst in deep TBM tunnels: A case study of the Neelum-Jhelum hydropower project. J. Cent. South Univ. 2023, 30, 1695–1709. [Google Scholar] [CrossRef]
- Feng, X.T. Rockburst: Mechanisms, Monitoring, Warning, and Mitigation; Butterworth-Heinemann: Oxford, UK, 2017. [Google Scholar]
- Feng, G.L.; Feng, X.T.; Chen, B.R.; Xiao, Y.X.; Yu, Y. A Microseismic Method for Dynamic Warning of Rockburst Development Processes in Tunnels. Rock Mech. Rock Eng. 2015, 48, 2061–2076. [Google Scholar] [CrossRef]
- Feng, G.L.; Feng, X.T.; Chen, B.R.; Xiao, Y.X.; Zhao, Z.N. Effects of structural planes on the microseismicity associated with rockburst development processes in deep tunnels of the Jinping-II Hydropower Station, China. Tunn. Undergr. Space Technol. 2019, 84, 273–280. [Google Scholar] [CrossRef]
- Read, R.S. 20 years of excavation response studies at AECL’s Underground Research Laboratory. Int. J. Rock Mech. Min. Sci. 2004, 41, 1251–1275. [Google Scholar] [CrossRef]
- Feng, X.T.; Xu, H.; Qiu, S.L.; Li, S.J.; Yang, C.X.; Guo, H.S.; Cheng, Y.; Gao, Y.H. In situ observation of rock spalling in the deep tunnels of the China Jinping Underground Laboratory (2400 m depth). Rock Mech. Rock Eng. 2018, 51, 1193–1213. [Google Scholar] [CrossRef]
- Mercier-Langevin, F.; Hadjigeorgiou, J. Towards a better understanding of squeezing potential in hard rock mines. Min. Technol. 2011, 120, 36–44. [Google Scholar] [CrossRef]
- Potyondy, D.O.; Cundall, P.A. A bonded-particle model for rock. Int. J. Rock Mech. Min. Sci. 2004, 41, 1329–1364. [Google Scholar] [CrossRef]
- Robertson, E.C. Experimental study of the strength of rocks. GSA Bull. 1955, 66, 1275–1314. [Google Scholar] [CrossRef]
- Hugman, R.H.H.; Friedman, M. Effects of texture and composition on mechanical behavior of experimentally deformed carbonate rocks. AAPG Bull. 1979, 63, 1478–1489. [Google Scholar] [CrossRef]
- Wong, R.H.; Chau, K.T.; Wang, P. Microcracking and grain size effect in Yuen Long marbles. Int. J. Rock Mech. Min. Sci. 1996, 33, 479–485. [Google Scholar] [CrossRef]
- Hatzor, Y.H.; Palchik, V. The influence of grain size and porosity on crack initiation stress and critical flaw length in dolomites. Int. J. Rock Mech. Min. Sci. 1997, 34, 805–816. [Google Scholar] [CrossRef]
- Yılmaz, N.G.; Goktan, R.M.; Kibici, Y. Relations between some quantitative petrographic characteristics and mechanical strength properties of granitic building stones. Int. J. Rock Mech. Min. Sci. 2011, 48, 506–513. [Google Scholar] [CrossRef]
- Olsson, W.A. Grain size dependence of yield stress in marble. J. Geophys. Res. 1974, 79, 4859–4862. [Google Scholar] [CrossRef]
- Du, K.; Sun, Y.; Zhou, J.; Khandelwal, M.; Gong, F. Mineral composition and grain size effects on the fracture and acoustic emission (AE) characteristics of rocks under compressive and tensile stress. Rock Mech. Rock Eng. 2022, 55, 6445–6474. [Google Scholar] [CrossRef]
- Yu, Q.; Zhu, W.; Ranjith, P.G.; Shao, S. Numerical simulation and interpretation of the grain size effect on rock strength. Geomech. Geophys. Geo-Energy Geo-Resour. 2018, 4, 157–173. [Google Scholar] [CrossRef]
- Gunsallus, K.L.; Kulhawy, F.H. A comparative evaluation of rock strength measures. Int. J. Rock Mech. Min. Sci. 1984, 21, 233–248. [Google Scholar] [CrossRef]
- Zorlu, K.; Ulusay, R.E.; Ocakoglu, F.; Gokceoglu, C.A.; Sonmez, H. Predicting intact rock properties of selected sandstones using petrographic thin-section data. Int. J. Rock Mech. Min. Sci. 2004, 41, 93–98. [Google Scholar] [CrossRef]
- Bell, F.G. The physical and mechanical properties of the fell sandstones, Northumberland, England. Eng. Geol. 1978, 12, 1–29. [Google Scholar] [CrossRef]
- Ulusay, R.; Türeli, K.; Ider, M.H. Prediction of engineering properties of a selected litharenite sandstone from its petrographic characteristics using correlation and multivariate statistical techniques. Eng. Geol. 1994, 38, 135–157. [Google Scholar] [CrossRef]
- Tandon, R.S.; Gupta, V. The control of mineral constituents and textural characteristics on the petrophysical & mechanical (PM) properties of different rocks of the Himalaya. Eng. Geol. 2013, 153, 125–143. [Google Scholar] [CrossRef]
- Zorlu, K.; Gokceoglu, C.; Ocakoglu, F.; Nefeslioglu, H.A.; Acikalin, S.J. Prediction of uniaxial compressive strength of sandstones using petrography-based models. Eng. Geol. 2008, 96, 141–158. [Google Scholar] [CrossRef]
- Yesiloglu-Gultekin, N.U.; Sezer, E.A.; Gokceoglu, C.; Bayhan, H. An application of adaptive neuro fuzzy inference system for estimating the uniaxial compressive strength of certain granitic rocks from their mineral contents. Expert Syst. Appl. 2013, 40, 921–928. [Google Scholar] [CrossRef]
- Zhao, J.; Feng, X.T.; Zhang, X.W.; Zhang, Y.; Zhou, Y.Y.; Yang, C.X. Brittle-ductile transition and failure mechanism of Jinping marble under true triaxial compression. Eng. Geol. 2018, 232, 160–170. [Google Scholar] [CrossRef]
- Feng, X.T.; Kong, R.; Zhang, X.; Yang, C. Experimental study of failure differences in hard rock under true triaxial compression. Rock Mech. Rock Eng. 2019, 52, 2109–2122. [Google Scholar] [CrossRef]
- He, M.; Ren, F.; Liu, D.; Zhang, S. Experimental Study on Strain Burst Characteristics of Sandstone Under True Triaxial Loading and Double Faces Unloading in One Direction. Rock Mech. Rock Eng. 2021, 54, 149–171. [Google Scholar] [CrossRef]
- Zhang, Q.; Zhu, H.H.; Zhang, L.Y. Studying the effect of non-spherical micro-particles on Hoek-Brown strength parameter mi using numerical true triaxial compressive tests. Int. J. Numer. Anal. Met. 2015, 39, 96–114. [Google Scholar] [CrossRef]
- Xie, Y.H.; Yang, Z.X.; Barreto, D.; Jiang, M.D. The influence of particle geometry and the intermediate stress ratio on the shear behavior of granular materials. Granul. Matter 2017, 19, 35. [Google Scholar] [CrossRef]
- Bai, Q.S.; Young, R.P. Numerical Investigation of the Mechanical and Damage Behaviors of Veined Gneiss During True-Triaxial Stress Path Loading by Simulation of In Situ Conditions. Rock Mech. Rock Eng. 2020, 53, 133–151. [Google Scholar] [CrossRef]
- Zheng, Z.; Tang, H.; Zhang, Q.; Pan, P.; Zhang, X.; Mei, G.; Liu, Z.; Wang, W. True triaxial test and PFC3D-GBM simulation study on mechanical properties and fracture evolution mechanisms of rock under high stresses. Comput. Geotech. 2023, 154, 105136. [Google Scholar] [CrossRef]
- Feng, X.T.; Haimson, B.; Li, X.; Chang, C.; Ma, X.; Zhang, X.; Ingraham, M.; Suzuki, K. ISRM suggested method: Determining deformation and failure characteristics of rocks subjected to true triaxial compression. Rock Mech. Rock Eng. 2019, 52, 2011–2020. [Google Scholar] [CrossRef]
- GB/T 50266-2013; Standard for Test Methods Engineering of Rock Mass. China Planning Press: Beijing, China, 2013.
- Feng, X.T.; Zhang, X.; Kong, R.; Wang, G. A Novel Mogi Type True Triaxial Testing Apparatus and Its Use to Obtain Complete Stress–Strain Curves of Hard Rocks. Rock Mech. Rock Eng. 2016, 49, 1649–1662. [Google Scholar] [CrossRef]
- Fairhurst, C.; Hudson, J. Draft ISRM suggested method for the complete stress-strain curve for intact rock in uniaxial compression. Int. J. Rock Mech. Min. Sci. 1999, 36, 279–289. [Google Scholar]
- Nicksiar, M.; Martin, C.D. Evaluation of methods for determining crack initiation in compression tests on low-porosity rocks. Rock Mech. Rock Eng. 2012, 45, 607–617. [Google Scholar] [CrossRef]
- Qiu, S.L.; Feng, X.T.; Xiao, J.Q.; Zhang, C.Q. An Experimental Study on the Pre-Peak Unloading Damage Evolution of Marble. Rock Mech. Rock Eng. 2014, 47, 401–419. [Google Scholar] [CrossRef]
- He, Z.; Li, G.; Tian, S.; Wang, H.; Shen, Z.; Li, J. SEM analysis on rock failure mechanism by supercritical CO2 jet impingement. J. Pet. Sci. Eng. 2016, 146, 111–120. [Google Scholar] [CrossRef]
- Feng, X.T.; Yang, C.X. Hard Rock Mechanics in Deep Engineering; Science Press: Beijing, China, 2023. [Google Scholar]


| Color | Density (g/cm3) | Wave Velocity (m/s) | Mineral Composition (%) | Grain Size | |||
|---|---|---|---|---|---|---|---|
| Dolomite | Calcite | Quartz | Sodium Feldspar | μm | |||
| Black | 2.82 | 5300 | 79 | 14 | 7 | — | 35–50 |
| Cuticolor | 2.82 | 4670 | 82 | 17 | — | 1 | 35–125 |
| Grey | 2.82 | 4170 | 80 | 20 | — | — | 35–65 |
| White | 2.83 | 4240 | 85 | 15 | — | — | 35–75 |
| Marble | No. | σ3 (MPa) | σ2 (MPa) | σci (MPa) | σcd (MPa) | σp (MPa) | εp (‰) | E (GPa) | σci/σp (MPa) | σcd/σp (MPa) |
|---|---|---|---|---|---|---|---|---|---|---|
| Black | B1 | 30 | 30 | 271.44 | 377.03 | 390.34 | 6.06 | 79.46 | 0.70 | 0.97 |
| B2 | 30 | 65 | 317.53 | 399.15 | 468.49 | 5.86 | 86.21 | 0.68 | 0.85 | |
| B3 | 30 | 100 | 360.62 | 444.70 | 546.94 | 8.33 | 92.14 | 0.66 | 0.81 | |
| Cuti-color | C1 | 30 | 30 | 232.09 | 322.93 | 380.62 | 7.91 | 64.75 | 0.61 | 0.85 |
| C2 | 30 | 65 | 275.52 | 357.95 | 451.06 | 9.54 | 74.26 | 0.61 | 0.79 | |
| C3 | 30 | 100 | 299.71 | 368.65 | 470.76 | 9.95 | 80.19 | 0.64 | 0.78 | |
| Grey | G1 | 30 | 30 | 199.13 | 267.29 | 341.70 | 11.26 | 52.59 | 0.58 | 0.78 |
| G2 | 30 | 40 | 210.70 | 270.09 | 376.03 | 13.08 | 54.57 | 0.56 | 0.72 | |
| G3 | 30 | 65 | 240.19 | 315.39 | 404.02 | 13.93 | 56.03 | 0.59 | 0.78 | |
| G4 | 30 | 100 | 267.76 | 335.66 | 435.54 | 11.43 | 63.88 | 0.61 | 0.77 | |
| G5 | 30 | 150 | 312.51 | 369.47 | 448.24 | 7.61 | 76.24 | 0.70 | 0.82 | |
| White | W1 | 30 | 30 | 189.32 | 251.24 | 328.94 | 12.18 | 42.95 | 0.61 | 0.76 |
| W2 | 30 | 50 | 203.18 | 281.84 | 378.97 | 14.57 | 49.23 | 0.54 | 0.74 | |
| W3 | 30 | 65 | 230.46 | 303.58 | 400.45 | 15.62 | 53.79 | 0.58 | 0.76 | |
| W4 | 30 | 80 | 235.01 | 305.97 | 403.30 | 12.61 | 62.14 | 0.58 | 0.76 | |
| W5 | 30 | 100 | 242.18 | 316.83 | 428.21 | 11.79 | 65.27 | 0.57 | 0.74 | |
| W6 | 30 | 125 | 250.74 | 319.12 | 428.52 | 8.85 | 70.59 | 0.59 | 0.74 | |
| W7 | 30 | 150 | 295.34 | 387.37 | 440.88 | 8.92 | 73.20 | 0.67 | 0.88 |
Disclaimer/Publisher’s Note: The statements, opinions and data contained in all publications are solely those of the individual author(s) and contributor(s) and not of MDPI and/or the editor(s). MDPI and/or the editor(s) disclaim responsibility for any injury to people or property resulting from any ideas, methods, instructions or products referred to in the content. |
© 2024 by the authors. Licensee MDPI, Basel, Switzerland. This article is an open access article distributed under the terms and conditions of the Creative Commons Attribution (CC BY) license (https://creativecommons.org/licenses/by/4.0/).
Share and Cite
Xu, H.; Jing, P.; Feng, G.; Zhang, Z.; Jiang, Q.; Yan, J. Effect of Mineral Composition and Particle Size on the Failure Characteristics and Mechanisms of Marble in the China Jinping Underground Laboratory. Materials 2024, 17, 2290. https://doi.org/10.3390/ma17102290
Xu H, Jing P, Feng G, Zhang Z, Jiang Q, Yan J. Effect of Mineral Composition and Particle Size on the Failure Characteristics and Mechanisms of Marble in the China Jinping Underground Laboratory. Materials. 2024; 17(10):2290. https://doi.org/10.3390/ma17102290
Chicago/Turabian StyleXu, Hong, Peiqi Jing, Guangliang Feng, Zhen Zhang, Quan Jiang, and Jie Yan. 2024. "Effect of Mineral Composition and Particle Size on the Failure Characteristics and Mechanisms of Marble in the China Jinping Underground Laboratory" Materials 17, no. 10: 2290. https://doi.org/10.3390/ma17102290
APA StyleXu, H., Jing, P., Feng, G., Zhang, Z., Jiang, Q., & Yan, J. (2024). Effect of Mineral Composition and Particle Size on the Failure Characteristics and Mechanisms of Marble in the China Jinping Underground Laboratory. Materials, 17(10), 2290. https://doi.org/10.3390/ma17102290