Abstract
Primary dendrite arm spacing (PDAS) is a crucial microstructural feature in nickel-based superalloys produced by laser cladding. In order to investigate the effects of process parameters on PDAS, a multi-scale model that integrates a 3D transient heat and mass transfer model with a quantitative phase-field model was proposed to simulate the dendritic growth behavior in the molten pool for laser cladding Inconel 718. The values of temperature gradient (G) and solidification rate (R) at the S/L interface of the molten pool under different process conditions were obtained by multi-scale simulation and used as input for the quantitative phase field model. The influence of process parameters on microstructure morphology in the deposition layer was analyzed. The result shows that the dendrite morphology is in good agreement with the experimental result under varying laser power (P) and scanning velocity (V). PDAS was found to be more sensitive to changes in laser scanning velocity, and as the scanning velocity decreased from 12 mm/s to 4 mm/s, the PDAS increased by 197% when the laser power was 1500 W. Furthermore, smaller PDAS can be achieved by combining higher scanning velocity with lower laser power.
1. Introduction
Nickel-based superalloys are widely used as a key material in aircraft structures due to their high fracture resistance and excellent corrosion resistance at a high temperature [1]. However, repairing or replacing damaged superalloy components using conventional production processes can be expensive. Laser cladding technology offers a cost-effective alternative for component repair or rapid manufacturing [2]. Laser cladding technology involves complex physical processes, including solid–liquid phase change, fluid flow and latent heat of melting, and is influenced by various process parameters such as laser power, scanning velocity, powder feeding rate and laser beam diameter. The choice of parameters significantly impacts the final microstructure morphology and mechanical properties [3]. Among them, primary dendrite arm spacing (PDAS) is an important parameter for characterizing microstructure, and can influence the performance of components, especially in laser processing. Due to the high temperature gradient and rapid cooling in laser cladding, the microstructure of the alloy produced by this process differs from that produced by conventional directional solidification. Additionally, PDAS size can effectively control microsegregation, which is directly related to the formation of delta phase in nickel-based superalloys. During both forging and cladding processes, excessive phase aggregation is a major cause of cracking [4,5]. Therefore, it is helpful to understand the relationship between process parameters and PDAS.
The microstructure of the laser cladding layer is a topic of ongoing interest in the field of laser cladding [6,7,8]. Numerous studies have shown that the microstructure and mechanical properties of laser cladding parts are primarily controlled by the real-time thermal characteristics of molten pool and the corresponding solidification parameters (temperature gradient G and solidification rate R) [9]. Microstructure characteristics can be effectively predicted by associating process parameters with the real-time thermal characteristics and solidification parameters [10]. Conventional theoretical methods estimate PDAS using solidification parameters: λ1 = AGmRn [11], where A is the alloy constant and m and n are the model correlation indices. However, due to the complexity of the diffusion field around dendrites at high solidification rates, these approximate methods have large errors when applied to laser cladding [12].
Currently, high-temperature thermography and high-speed camera systems are used to monitor the solidification process of the molten pool [13,14,15] and measure the solidification parameters such as surface temperature and cooling rate. This allows analysis of the influence of solidification parameters on solidification structure size. However, on-site measurement of solidification conditions is challenging due to the high melt temperature and small size of the molten pool. Measured solidification parameters (such as temperature and fluid flow) are limited to the surface of the molten pool or thin melt layer, and experiment results are easily influenced by the working conditions [16,17,18].
Advances in computational ability and numerical methods have made computer simulation a popular tool for studying solidification problems. Many researchers have developed numerical models to analyze the evolution of solidification conditions in additive manufacturing processes and their impact on solidification microstructure characteristics [19,20]. The distribution of the macro-scale temperature field caused by the moving heat source is the key to determining solidification parameters. From this, solidification parameters such as the temperature gradient G and the solidification rate R at the S/L interface of the molten pool can be calculated. For micro-scale simulation, the cellular automata (CA) method and phase field (PF) method are commonly used to predict the solidification microstructure [21,22]. The phase-field method, in particular, is based on the thermodynamics of partial differential equations and explicitly tracks the interface, allowing the effective simulation of a complex S/L interface [23,24,25].
Currently, most multi-scale simulations of laser cladding use the finite element method with birth-death elements. However, this approach does not account for changes in the free surface or fluid flow in the molten pool and latent heat of melting. As a result, simulated solidification parameters may be inaccurate, leading to errors in predicting primary dendrite arm spacing in microscopic simulations [26].
The aim of this study is to link laser cladding process parameters with transient local thermal characteristics and solidification parameters to rapidly predict the solidification microstructure. Regarding Inconel 718 as the research object, a 3D transient laser cladding heat and mass transfer model was adopted to calculate the temperature gradient G and solidification rate R at the S/L interface of the laser cladding molten pool under different process parameters. Then, this was combined with a quantitative phase field model to further calculate the PDAS at the top of the molten pool. To validate the model, laser cladding experiments were carried out to analyze the integrated influence of process parameters on microstructure.
2. Mathematical Model
2.1. Macroscopic Heat and Mass Transfer Model
During the laser cladding process, the laser beam moves continuously and the solidification front keeps pace with the heat source, as shown in Figure 1. The macroscopic temperature distribution caused by the moving heat source is the key to determining the solidification parameters. A 3D macroscopic heat and mass transfer model is established to simulate the temperature field, velocity field and molten pool morphology. The temperature gradient G and solidification rate R along the normal line of the S/L interface are further calculated. As the interface for the solid phase grows, each point at the solidification front grows in a direction perpendicular to the S/L interface at the corresponding R rate. R = Vcosθ, where θ is the angle between the laser scanning direction and the normal solidification interface direction of the solidification interface in terms of molten pool geometry.
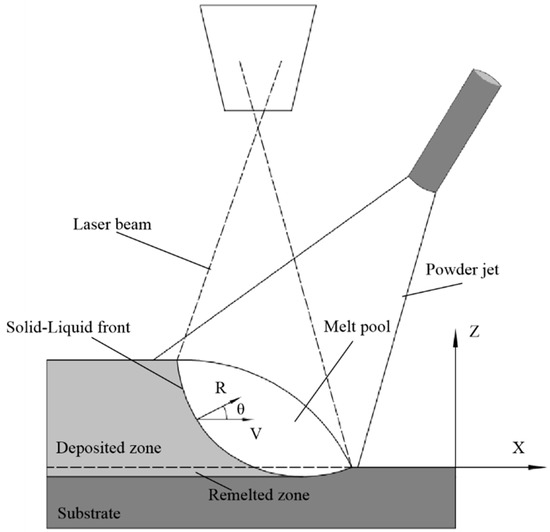
Figure 1.
Schematic diagram of laser cladding.
The simplified assumptions are as follows [27,28]:
- (1)
- Liquid fluid flow in the molten pool is Newtonian, laminar and incompressible;
- (2)
- The mushy region is assumed as a porous medium with isotropic permeability;
- (3)
- Heat flux from heated powder and heat loss due to evaporation are neglected;
- (4)
- The effect of shielding gas, powder feeding gas and powder on the surface of the molten pool is ignored.
The continuity equation is:
Due to the existence of S/L phase change in the laser cladding, the influence of latent heat on melting should be considered in the heat transport equation; the energy equation is [29]:
In the above equation, the second and third terms on the right side represent unsteady terms of phase change enthalpy and the phase change enthalpy due to convection, respectively.
Where ρ is density, cp is specific heat, T is temperature, t is time, k is heat conduction dilution, ∆H is melting latent enthalpy capacity, and ∆H = LFl, L is latent heat of melting. The liquid mass fraction Fl is defined as,
The incompressible Navier–Stokes equation describes the liquid metal in the molten pool. Since velocity in the solid phase region is 0, a source term in the momentum equation is introduced to suppress velocity field in the solid phase region. In this study, the time source term in the liquid phase region is set to 0, leaving the momentum equation unchanged. In the solid phase region, however, the source term is infinite, and the remaining terms of the momentum equation become infinitesimally small. In the transition region, the equation degenerates to Darcy’s law relating porosity and pressure. Only pressure and source terms remain in the equation, while other terms become infinitesimally small.
where μ is the viscosity, p is the pressure, and the third term on the right side of the Equation (4) represents the momentum dissipation term in the mushy region, which is based on the Carman–Kozeny Equation [30], K0 is a constant related to the mushy region, and B is a very small number to prevent the denominator from being zero. Linear interpolation is used to interpolate the thermophysical parameters of the mushy region.
The laser heat flow input at the liquid/gas interface is as follows:
where P is the laser power, X(t) and Y(t) are the x and y coordinate values of the laser center with time, ηl is the absorption rate of the laser energy, rl is the radius of the laser source, hc is the heat transfer coefficient, σb is the Stefan–Boltzmann constant, ε is the emissivity, and T0 is the ambient temperature.
The boundary condition of the momentum equation of the gas–liquid interface is [29],
The two terms in Equation (6) represent capillary force and thermal capillary force, respectively. σ is the surface tension, n* is the surface normal, and κ is the surface curvature.
The description of the surface geometry of the molten pool is achieved through the moving mesh of the Lagrangian–Euler method (ALE). Two velocities are considered at the liquid/gas interface: fluid flow velocity and boundary movement velocity, caused by powder addition. They can be expressed as [31]:
where u is the flow velocity of the fluid of the liquid–gas interface, Vp represents the moving velocity of the liquid–gas interface, and the calculation formula of Vp is
In the above formula, mf is powder feeding rate, ηm is powder capture rate, ρm is powder density, rp is the radius of the laser source, X(t) and Y(t) are the moving track of the laser head with time, respectively.
2.2. Microscopic Phase-Field Model
The phase field model adopts the quantitative alloy phase field model proposed by Echebarria et al. [32], which is established under the thin interface limit to eliminate the dependence of the interface thickness, so as to describe the (non-conserved) phase field ϕ and (conserved) the solute field c during the solidification of dilute binary alloys. An inverse solute diffusion term is introduced into the model to avoid the solute diffusion effect at the diffusion interface at lower solidification rates. Inconel 718 is simplified as a Ni-Nb binary system containing only FCC γ phase and liquid phase with a mass fraction of 5% Nb. The scalar phase field parameter ϕ indicates whether a point in the two-dimensional field is liquid (ϕ = −1), solid (ϕ = 1), or a solid–liquid interface (−1 < ϕ < 1).
Ignoring the influence of latent heat effect, the freezing temperature approximation is adopted.
where T0 (z = 0, t = 0) is a reference temperature, G is the temperature gradient along the Z direction, and R is the pulling velocity.
T = T0 + G (z − Rt)
The governing equations of phase field and supersaturated concentration field in a two-dimensional system,
where , which is the temperature-dependent relaxation time. , which represents the two-dimensional fourfold anisotropy in the system, δ is strength of the surface tension anisotropy. is the thermal length, where c∞ ≡ c (z = +∞) is an initial alloy concentration (wt.%) far from the solidification front, m is liquid line coefficient, k is equilibrium partition coefficient, Dl is the diffusivity of solute in liquid, , which is the unit vector normal to the interface. , generalized supersaturation field. , anti-solute interception term. The anti-trapping current is given by Karma [33]. W0 is the value of setting interface thickness. λ is used as a parameter for the numerical convergence of the control model. τ0 stands for relaxation time. The interface thickness W0 = d0λ/a1 and the relaxation time τ0 = (d02/D)a2λ3/a12 are interrelated from a thin interface analysis, where a1 = 0.8839, a2 = 0.6267, and λ is treated as a parameter to control the numerical convergence of the model.
2.3. Model Parameters
The high-temperature physical properties of the Inconel 718 were calculated using J-mat pro and are presented in Table 1. A continuous laser with a radius of 1.1 mm was used. The powder mass flow rate is 10 g/min, with a capture efficiency of 0.9 and a flow density of 8.19 g/cm3.The powder flow radius was set to 2.3 mm. The values of these parameters are listed in Table 2.

Table 1.
Physical parameters of Inconel 718.
Table 2.
Macro simulation parameters.
The simulation model is a 10 mm × 20 mm × 5 mm cuboid with the cladding surface on the upper surface, serving as the input boundary for both the energy and mass transfer equations and the lifting surface for the ALE dynamic mesh. Mesh displacement is determined by the rise of the free surface due to powder addition and the influence of molten pool flow velocity on liquid surface advancement.
The phase field and concentration equations are solved on uniform meshes with a width of 50 µm in the x direction, and phase field parameters are listed in Table 3. The phase field governing equation ϕ is solved using a finite difference separation dispersion scheme, while the saturation concentration field U is solved using a finite-volume method with zero flux boundary conditions on both boundaries. The mesh spacing Δx = Δy = 0.005 µm, and the time step Δt = 0.02τ0, while the value of W0 is about 10 times smaller than the dendrite tip radius calculated by the sharp interface model.
Table 3.
Phase field parameters.
The maximum phase field interface thickness W0 = 0.01 µm, λ = 1.377 initializes the simulation along the bottom domain (at y = 0), and the S/L interface is randomly perturbed by small amplitude.
3. Experimental Materials and Scheme
Inconel 718 powder with a particle size of 45–105 µm and good flow characteristics was used in the experiment. The powder was dried at 100 ℃ for 2 h in a blast dryer prior to use. The elemental composition of powder elements is shown in Table 4:
Table 4.
Inconel 718 powder element content (wt.%).
A CO2 laser with a maximum power output of 4000 W was utilized in our experiment. Our team’s previous research indicated that laser power below 1500 W resulted in partial melting of the track due to powder deposition. Conversely, laser power above 2300 W caused powder vaporization and substrate melting due to splashing. Energy accumulation led to powder vaporization and substrate melting at scanning speeds below 4 mm/s. At higher scanning speeds (12 mm/s), partial melting of the trajectory was observed due to insufficient energy to melt the powder. So, laser power (1500 W, 1900 W, 2300 W) and scanning velocity (4 mm/s, 8 mm/s, and 12 mm/s) were selected for the orthogonal experiment, with a shielding gas flow rate of 10 L/min. The substrate was a 20 × 10 × 5 mm forging.
After wire cutting, surface oxide layers and stains were removed using an iron brush to prevent interference with cladding. Three cross sections perpendicular to the scanning direction were taken, and samples were ground and polished (using sandpaper grits of 240#, 600#, 800#, 1200#, and 2000# followed by polishing with W3.5 and W2.5 pastes). Samples were etched for 25 s using a solution of HCL, H2SO4 and CuSO4.Geometrical morphology was observed using an optical metallographic microscope and analyzed.
This study focused on dendrite growth in the deposited zone rather than the remelting zone. To ensure consistency in point positions across different process parameters, dendrite arm spacing was measured in an area below 0.2 mm from the top and near the centerline. The statistical method is to select three random-shaped ranges in the target area, and the area of the shape as S, and the number of dendrites is N. (Regions with less than 50% coverage at the boundary were marked as 0 and those with more than 50% coverage were marked as 1).
Three sections were taken from each sample and three positions were randomly selected within the target area for each cross-section. The cladding process was found to be quasi-steady-state, with G and R remaining unchanged for different x-coordinate values as long as y and z positions were consistent. Data from different cross-sections under the same process parameters were used to increase accuracy.
4. Results and Discussion
4.1. Solidification Characteristics of Molten Pool
Nine cladding processes were simulated according to the orthogonal test. As energy is continuously input, the temperature in the molten pool increased until it exceeded the solidus temperature and a molten pool formed due to solid–liquid phase change. Figure 2a shows the temperature field at 0.5 s for a scanning velocity of V = 8 mm/s and laser power of P = 1900 W.

Figure 2.
(a) The cross-section temperature field at 0.5 s, (b) Liquid phase temperature isotherm.
A quasi-steady-state is achieved after 0.5 s with an essentially unchanged isotherm shape. The back edge of the melt pool represented the solidification front and, after reaching quasi-steady-state, solidification parameters remained constant for all positions along the front. The longitudinal section of the molten pool (t = 1593 K) is taken as contour lines in Figure 2b, with the left part representing the solidification front.
As the laser source moves, a 3D solidification front surface also moves. Solidification parameters for all positions along the front are projected onto the cross-section of the deposition track to analyze molten pool characteristics (Figure 3).
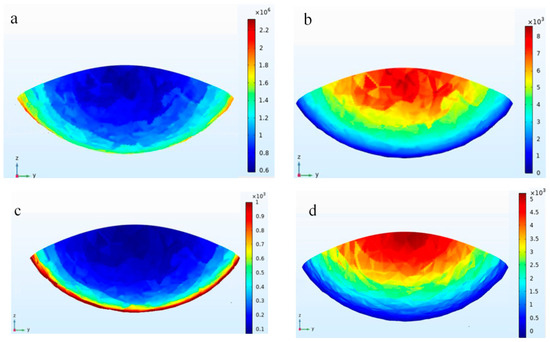
Figure 3.
Computed contours of solidification characteristics: (a) temperature gradient G, (b) solidification growth rate R, (c) G/R, and (d) G × R.
As shown in Figure 3a, G increases from 1.6 × 10³ K/m along the periphery to 2.2 × 10³ K/m at the center of the cross-section, before decreasing sharply in the middle of the molten pool, and the temperature gradient G is smallest at the top of the pool.
The R value is shown in Figure 3b, and it is 8 mm/s at the top of the molten pool, which is the same as the scanning velocity, and decreases gradually to 0.2 mm/s at the surface of the deposited track.
Figure 3c,d show the contour of G/R and G × R over the projective plane, respectively. Higher G/R and lower G × R are observed at the bottom of the solidification front, while lower G/R and higher G × R are observed at the top. The G/R ratio governs the solidification mode, while G × R controls the scale of the solidification microstructure. In this study, microstructure scale is coarser at the bottom of the deposited track, and finer at the top. Solidification mode may transform from planar to cellular, columnar dendritic, and equiaxed dendritic as G/R decreases.
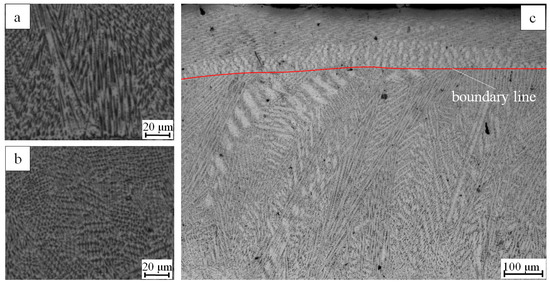
The values of G were calculated for each direction, and compared with the cladding layer obtained by the microstructure experimentally. As shown in Figure 4, G[001] in the direction of [001] and R[001] are dominant in region A, while G[100] in the direction of [100] is dominant in region B, and G[010] in the direction of [010] is dominant in region C.

Figure 4.
Comparison of dendrite growth direction between test and simulation; (A) G[001] dominant region; (B) G[100] dominant region; (C) G[010] dominant region.
The simulation results agree well with the experimental results. Columnar crystals grew vertically from the bottom of the molten pool and the dendrites deflected at positions where G[001] is less than G[100],forming a cross shape in the cross-section.
Dendrite deflection is shown in Figure 5, with Figure 5a,b showing enlarged views of regions A and B in Figure 4, respectively, and Figure 5c showing a longitudinal section. A clear boundary line for dendrite growth direction can be observed in Figure 5c, with the dendrite growth direction at the top of the deposition area above the boundary differing from that at the bottom. Dendrites at the bottom of the deposition layer were thicker columnar crystals, while the microstructure at the top was more refined and smaller in size than dendrites at the bottom of the molten pool.
In this study, the microstructure of nine process parameters is considered, and G and R values are calculated as the comparative data in Table 5.
Table 5.
Nine process parameters and G, R values.
4.2. Simulation of Microstructure
G and R values for each process parameter were obtained and input into the phase field model. After the initial transients, Mullins–Sekerka instability rapidly developed at the solid–liquid interfaces, resulting in cellular structures that merged or split during growth. As solidification continue, the number of dendrites in the simulation region remain constant after a certain stage, with dendrite tips growing at a constant rate equal to the solidification rate, and average distance between neighboring γ-cells tips remaining constant. Steady-state dendrite morphology for various processes is shown in Figure 6. Mean PDAS is estimated from simulated cellular patterns by counting the number of cells along the system width (perpendicular to growth direction) and dividing by system width. The mean steady-state PDAS is between 5 µm to 12 µm in this case.
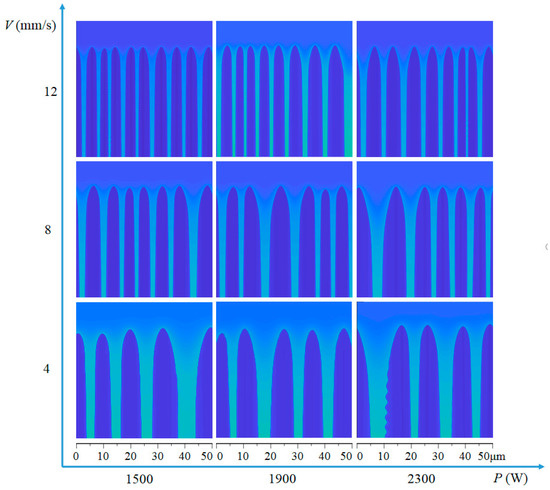
Figure 6.
Steady-state cellular growth fronts for nine different solidification conditions.
Figure 6 illustrates significant variations in Nb composition in the liquid ahead of tips, between cells, and across solid cells. Growing cells reject niobium into the liquid, enriching intercellular regions. Solidification of Inconel 718 consistently results in the formation of an Nb-rich phase. Related test results indicate that niobium is concentrated in the delta phase region, which is relatively brittle and prone to cracking [5]. Thus, simplification as a Ni-Nb binary alloy is plausible for describing major solidification behavior.
4.3. Influence of the Processing Parameters on the PDAS
A comparison of the PDAS test and simulation results for Inconel 718 with nine process parameters is shown in Figure 7. Data comparison revealed a maximum error of 9.58% for process parameters 2300 W and 8 mm/s. Little difference is observed between PDAS values measured by simulation and experiment. The PF simulation was two-dimensional and solidification geometry may change slightly under solidification conditions in reality. However, the trend of simulation and experiment changing with scanning velocity and laser power was generally consistent, verifying model accuracy. Primary dendrite spacing decreased significantly with increasing laser scanning velocity and increased gently with increasing laser power.

Figure 7.
Variation trends of the PDAS with P at different V, OM image showing the transverse section of the laser track processed for nine different solidification conditions.
To analyze the trend of PDAS with process parameters, it is necessary to reveal the relationship between solidification conditions and process parameters as PDAS is directly determined by specific alloy solidification conditions. Higher cooling rates resulted in smaller dendrite spacing, consistent with simulation results showing that G decreased with increasing P for a given V. This trend is similar to previous studies and is due to decreased heat flux from larger pools produced by higher P. The effect of process parameters on solidification rate R is more complex, with R increasing with increasing P at lower power and higher scanning velocity but P having no significant effect at higher scanning velocity. These comparisons show that the selection of characteristic solidification conditions primarily affects PDAS size but does not significantly change PDAS evolution trends. As long as suitable solidification characteristic conditions are selected, PDAS does not change during solidification.
It can be seen from Figure 8 that when laser power increases from 1500 W to 2300 W at a scanning velocity of 4 mm/s, PDAS increases from 5.79 μm to 6.51 μm. Increasing laser power increased molten pool energy input and heat accumulation, decreasing the molten pool cooling rate and leading to dendrite structure coarsening.
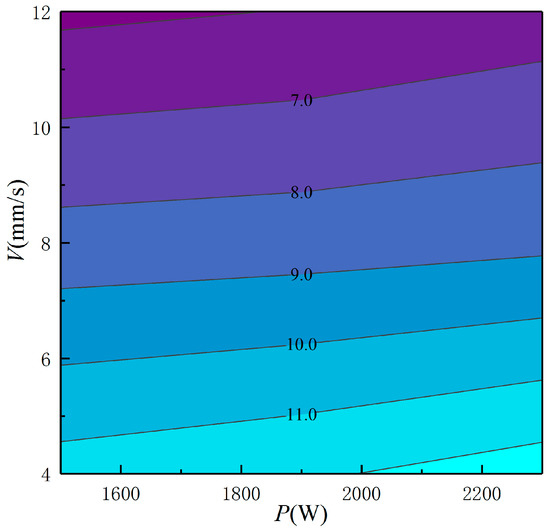
Figure 8.
Combined effects of P, V on the PDAS (in μm).
Scanning velocity (V) had a greater influence on PDAS than power. At constant power, PDAS increases significantly with decreased scanning velocity. At 1500 W power, increasing the scanning velocity from 12 mm/s to 4 mm/s increases PDAS by 197%. Scanning velocity changes affect both laser-molten pool interaction time and molten pool energy input. Increasing the scanning velocity decreases laser energy input and interaction time, reducing molten pool heat accumulation and increasing the substrate quenching effect. This significantly increases the molten pool cooling rate and refines the dendrite structure. Scanning speed is the most readily controllable process parameter and can be adjusted in real-time to achieve a desired microstructure.
It is generally accepted that low-energy input refines the solidification microstructure. Decreasing the laser power or increasing the scanning velocity directly decreases line energy input, increasing the molten pool cooling rate and refining the dendrite structure. Scanning velocity plays a leading role in the molten pool cooling rate and solidification structure, consistent with results reported by Muvvala [15].
5. Conclusions
In this study, a numerical model for predicting the PDAS of Inconel 718 laser cladding was established by combining a macroscopic transient 3D heat and mass transfer model with a quantitative phase field model. Solidification behavior in the molten pool under different process parameters was simulated, and the calculated results agreed well with the experimental values.
Simulated laser cladding showed that different positions within the cladding layer experienced different temperature histories and generated different dendrite morphologies. Finer equiaxed grains were obtained at the top of the cladding layer.
PDAS increased with increasing power and scanning velocity. Increased canning velocity resulted in an increase in monotonic PDAS with increasing power. Scanning velocity had a more pronounced effect on PDAS than power, with PDAS increasing significantly with increased scanning velocity. At 1500 W power, increasing the scanning speed from 12 mm/s to 4 mm/s increased PDAS by 197%. A finer microstructure could be obtained by combining a higher scanning speed with lower laser power.
The results showed that the multi-scale model provided better PDAS prediction for different processes, aiding the control and optimization of the laser cladding dendrite structure.
Author Contributions
Conceptualization, X.K.; Methodology, X.K.; Software, Z.J.; Validation, Z.J.; Formal analysis, L.M.; Data curation, J.D. and X.L.; Writing—original draft, Z.J.; Project administration, X.K. All authors have read and agreed to the published version of the manuscript.
Funding
This research was funded by the National Key Research and Development Program of China grant number SQ2019YFB1704500; the National Science and Technology Major Project grant number J2019-V-0009-0103; the State Ministry of Science and Technology Innovation Fund of China grant number 2018IM030200.
Conflicts of Interest
The authors declare no conflict of interest.
References
- Babu, S.S.; Raghavan, N.; Raplee, J.; Foster, S.J.; Frederick, C.; Haines, M.; Dinwiddie, R.; Kirka, M.K.; Plotkowski, A.; Lee, Y.; et al. Additive manufacturing of nickel superalloys: Opportunities for innovation and challenges related to qualification. Metall. Mater. Trans. A 2018, 49, 3764–3780. [Google Scholar] [CrossRef]
- Laeng, J.; Stewart, J.G.; Liou, F.W. Laser metal forming processes for rapid prototyping—A review. Int. J. Prod. Res. 2000, 38, 3973–3996. [Google Scholar] [CrossRef]
- Wang, L.; Felicelli, S. Analysis of thermal phenomena in LENS™ deposition. Mater. Sci. Eng. A 2006, 435, 625–631. [Google Scholar] [CrossRef]
- Azadian, S.; Wei, L.Y.; Warren, R. Delta phase precipitation in Inconel 718. Mater. Charact. 2004, 53, 7–16. [Google Scholar] [CrossRef]
- Moshtaghi, M.; Safyari, M.; Mori, G. Combined thermal desorption spectroscopy, hydrogen visualization, HRTEM and EBSD investigation of a Ni–Fe–Cr alloy: The role of hydrogen trapping behavior in hydrogen-assisted fracture. Mater. Sci. Eng. A 2022, 848, 143428. [Google Scholar] [CrossRef]
- Thijs, L.; Verhaeghe, F.; Craeghs, T.; Van Humbeeck, J.; Kruth, J.-P. A study of the microstructural evolution during selective laser melting of Ti–6Al–4V. Acta Mater. 2010, 58, 3303–3312. [Google Scholar] [CrossRef]
- Kurz, W.; Trivedi, R. Rapid solidification processing and microstructure formation. Mater. Sci. Eng. A 1994, 179, 46–51. [Google Scholar] [CrossRef]
- Amato, K.N.; Gaytan, S.M.; Murr, L.E.; Martinez, E.; Shindo, P.W.; Hernandez, J.; Collins, S.; Medina, F. Microstructures and mechanical behavior of Inconel 718 fabricated by selective laser melting. Acta Mater. 2012, 60, 2229–2239. [Google Scholar] [CrossRef]
- Sames, W.J.; List, F.A.; Pannala, S.; Dehoff, R.R.; Babu, S.S. The metallurgy and processing science of metal additive manufacturing. Int. Mater. Rev. 2016, 61, 315–360. [Google Scholar] [CrossRef]
- Collins, P.C.; Brice, D.A.; Samimi, P.; Ghamarian, I.; Fraser, H.L. Microstructural control of additively manufactured metallic materials. Annu. Rev. Mater. Res. 2016, 46, 63–91. [Google Scholar] [CrossRef]
- Hunt, J.D. Solidification and Casting of Metals; The Metal Society: London, UK, 1979. [Google Scholar]
- Ghosh, S.; Ma, L.; Ofori-Opoku, N.; Guyer, J.E. On the primary spacing and microsegregation of cellular dendrites in laser deposited Ni–Nb alloys. Model. Simul. Mater. Sci. Eng. 2017, 25, 065002. [Google Scholar] [CrossRef]
- Khanzadeh, M.; Chowdhury, S.; Marufuzzaman, M.; Tschopp, M.A.; Bian, L. Porosity prediction: Supervised-learning of thermal history for direct laser deposition. J. Manuf. Syst. 2018, 47, 69–82. [Google Scholar] [CrossRef]
- Xiao, H.; Li, S.; Han, X.; Mazumder, J.; Song, L. Laves phase control of Inconel 718 alloy using quasi-continuous-wave laser additive manufacturing. Mater. Des. 2017, 122, 330–339. [Google Scholar] [CrossRef]
- Muvvala, G.; Karmakar, D.P.; Nath, A.K. Online monitoring of thermo-cycles and its correlation with microstructure in laser cladding of nickel based super alloy. Opt. Lasers Eng. 2017, 88, 139–152. [Google Scholar] [CrossRef]
- Hofmeister, W.; Griffith, M. Solidification in direct metal deposition by LENS processing. JOM 2001, 53, 30–34. [Google Scholar] [CrossRef]
- Xia, M.; Gu, D.; Yu, G.; Dai, D.; Chen, H.; Shi, Q. Influence of hatch spacing on heat and mass transfer, thermodynamics and laser processability during additive manufacturing of Inconel 718 alloy. Int. J. Mach. Tools Manuf. 2016, 109, 147–157. [Google Scholar] [CrossRef]
- Liang, Y.J.; Wang, H.M. Origin of stray-grain formation and epitaxy loss at substrate during laser surface remelting of single-crystal nickel-base superalloys. Mater. Des. 2016, 102, 297–302. [Google Scholar] [CrossRef]
- Gäumann, M.; Bezencon, C.; Canalis, P.; Kurz, W. Single-crystal laser deposition of superalloys: Processing–microstructure maps. Acta Mater. 2001, 49, 1051–1062. [Google Scholar] [CrossRef]
- Acharya, R.; Sharon, J.A.; Staroselsky, A. Prediction of microstructure in laser powder bed fusion process. Acta Mater. 2017, 124, 360–371. [Google Scholar] [CrossRef]
- Knapp, G.L.; Mukherjee, T.; Zuback, J.S.; Wei, H.L.; Palmer, T.A.; De, A.; DebRoy, T. Building blocks for a digital twin of additive manufacturing. Acta Mater. 2017, 135, 390–399. [Google Scholar] [CrossRef]
- Boettinger, W.J.; Warren, J.A.; Beckermann, C.; Karma, A. Phase-field simulation of solidification. Annu. Rev. Mater. Res. 2002, 32, 163–194. [Google Scholar] [CrossRef]
- Steinbach, I. Phase-field models in materials science. Model. Simul. Mater. Sci. Eng. 2009, 17, 073001. [Google Scholar] [CrossRef]
- Moelans, N.; Blanpain, B.; Wollants, P. An introduction to phase-field modeling of microstructure evolution. Calphad 2008, 32, 268–294. [Google Scholar] [CrossRef]
- Nie, P.; Ojo, O.A.; Li, Z. Numerical modeling of microstructure evolution during laser additive manufacturing of a nickel-based superalloy. Acta Mater. 2014, 77, 85–95. [Google Scholar] [CrossRef]
- Keller, T.; Lindwall, G.; Ghosh, S.; Ma, L.; Lane, B.M.; Zhang, F.; Kattner, U.R.; Lass, E.A.; Heigel, J.C.; Idell, Y.; et al. Application of finite element, phase-field, and CALPHAD-based methods to additive manufacturing of Ni-based superalloys. Acta Mater. 2017, 139, 244–253. [Google Scholar] [CrossRef]
- Qi, H.; Mazumder, J.; Ki, H. Numerical simulation of heat transfer and fluid flow in coaxial laser cladding process for direct metal deposition. J. Appl. Phys. 2006, 100, 024903. [Google Scholar] [CrossRef]
- He, X.; Song, L.; Yu, G.; Mazumder, J. Solute transport and composition profile during direct metal deposition with coaxial powder injection. Appl. Surf. Sci. 2011, 258, 898–907. [Google Scholar] [CrossRef]
- He, X.; Fuerschbach, P.W.; DebRoy, T. Heat transfer and fluid flow during laser spot welding of 304 stainless steel. J. Phys. D Appl. Phys. 2003, 36, 1388. [Google Scholar] [CrossRef]
- Asai, S.; Muchi, I. Theoretical analysis and model experiments on the formation mechanism of channel-type segregation. Trans. Iron Steel Inst. Jpn. 1978, 18, 90–98. [Google Scholar] [CrossRef]
- Morville, S.; Carin, M.; Peyre, P.; Gharbi, M.; Carron, D.; Le Masson, P.; Fabbro, R. 2D longitudinal modeling of heat transfer and fluid flow during multilayered direct laser metal deposition process. J. Laser Appl. 2012, 24, 032008. [Google Scholar] [CrossRef]
- Echebarria, B.; Folch, R.; Karma, A.; Plapp, M. Quantitative phase-field model of alloy solidification. Phys. Rev. E 2004, 70, 061604. [Google Scholar] [CrossRef] [PubMed]
- Karma, A. Phase-field formulation for quantitative modeling of alloy solidification. Phys. Rev. Lett. 2001, 87, 115701. [Google Scholar] [CrossRef] [PubMed]
Disclaimer/Publisher’s Note: The statements, opinions and data contained in all publications are solely those of the individual author(s) and contributor(s) and not of MDPI and/or the editor(s). MDPI and/or the editor(s) disclaim responsibility for any injury to people or property resulting from any ideas, methods, instructions or products referred to in the content. |
© 2023 by the authors. Licensee MDPI, Basel, Switzerland. This article is an open access article distributed under the terms and conditions of the Creative Commons Attribution (CC BY) license (https://creativecommons.org/licenses/by/4.0/).