Abstract
Using solid waste to sequester carbon dioxide not only reduces the greenhouse effect but also reuses resources. However, the existing solidified carbon dioxide storage materials are expensive and have poor storage effect. Therefore, in this study, cement, solid waste base material, and 30% hydrogen peroxide were used to make foamed concrete materials through chemical foaming, and XRD, BET, SEM, and thermogravimetric techniques were used to explore the amount of carbon dioxide adsorbed by foamed concrete materials under different ratio conditions. The results show that (1) the hydration products of the cementified materials mainly include C-S-H, Ht and Ca(OH)2, which are important factors for the storage of CO2. (2) A water–cement ratio of 0.7 and a foaming agent dosage of 10% are the best ratios for foamed concrete materials. With the increase of the water–cement ratio and the dosage of the foaming agent, the amount of CO2-sealed stock first increases and then decreases. (3) The maximum carbon dioxide sealing capacity of foamed concrete material is 66.35 kg/m3.
1. Introduction
Climate change is a great challenge related to human survival and long-term development. Low-carbon development has increasingly become one of the keys to sustainable human development. Therefore, how to reduce the CO2 in the atmosphere and overcome the global greenhouse effect has attracted great attention globally.
CO2 capture is an effective method to reduce the CO2 in the atmosphere. Many capture methods, such as absorption [1], adsorption [2], membrane separation [3], hydrate-based separation [4], and cryogenic distillation [5], have been developed. The captured CO2 can further be reutilized in many fields, such as in the production of ammonia and urea, food and beverages, refrigerants, and fire extinguishing gases [6,7]. However, the reutilized CO2 only accounts for 2% of the emissions [8], which is a tiny contribution to CO2 reduction. In addition, most methods still exhibit shortcomings in terms of application convenience and cost. The cement-based materials can capture CO2 from the atmosphere during the hydration reaction [9,10], and thus their application potentials in CO2 sequestration have gradually attracted great attention [11,12,13]. Pure cement materials, such as cement and concrete, can sequester CO2 but not cost-efficiently. Therefore, the composition and preparation process of cement material needs to be optimized for the economic cost of the implementation and carbon footprint issue [14]. The CO2 diffusion rate is the controlling step for the early carbonation reaction rate of cement material [15,16]. Carbonation reduces the porosity of the carbonized area and forms carbonates at the edges of the cement particles, which inhibits CO2 diffusion. Due to the compact structure of concrete, the carbonation depth is small. Therefore, only a very small amount of the components reacts with CO2.
Based on the analysis above, cementitious materials prepared from solid wastes (slags, carbide slags, and mining solid wastes) can be further foamed and cured into porous materials to realize large-scale CO2 capture [17]. Relevant studies have shown that various solid wastes, such as bauxite tailings [18], red mud [19], gold tailings [20], fly ash [21], silt [22], and so on, can be used as the raw material for this purpose. Cai investigated the effects of lime and fly ash contents on the compressive strength of foam concrete and found both of the foam concretes obtained with 10% lime mix ratio and 20% fly ash mix ratio exhibited the highest 28-day compressive strength [23]. The strength and pore structure of the porous material can also be tuned by adjusting the components, admixtures, and reaction process during the preparation. To study the properties of fly ash, Łach et al. prepared foam concrete with fly ash substituted for cement, using water, glass, and sodium hydroxide as the activators and 30% hydrogen peroxide as the foaming agent [24].
The foam concrete exhibited a dry density of 400–600 kg/m3, the highest compressive strength of 3.4 MPa, and the lowest thermal conductivity of 0.0826 W/(m·k). Chen [25] was able to regulate the pore structure and strength of porose material by adjusting the ratio of raw materials and the type of admixtures during the preparation process. Xi studied the effects of the raw material ratio on pore structure, and the results showed that the porosity decreased with the increase of water–cement ratio and fly ash content and increased with the increase of water–cement ratio [26]. The influence of the water–cement ratio was most significant, and the equivalent average pore size was positively correlated with these three parameters. Zhang et al. reported the optimal raw material ratio for the preparation of foam concrete by a physical foaming method using titanium-containing waste residue and red gypsum as the admixtures, which was ordinary Portland (PO) cement:titanium-containing waste residue:red gypsum = 10:45:45 (mass ratio), 2% lime, and 4% sulfoaluminate cement [27]. The dry density and 28-day compressive strength of the obtained foam concrete reached up to 437 kg/m3 and 2.14 MPa, respectively. Zhang et al. obtained foam concrete with an average pore size smaller than 0.3 mm from silt and cement as a building backfill material [22]. Liu et al. investigated the effects of the fly ash content on the strength enhancement and pore structure of foam concrete, and the results showed that increasing the amount of fly ash could increase the average pore size [28]. Controlling the CO2 pressure and curing time can also improve the diffusion rate and sequestration efficiency of CO2. Many studies on the curing conditions have shown that the pressure and concentration of CO2 directly affect its diffusion capacity during the curing of foam concrete or ordinary concrete [29]. In general, the higher the CO2 pressure, the higher the sequestration of CO2. CO2 sequestration increases; however, the reaction rate decreases with curing time [30]. In addition, to sequester CO2 more efficiently, connected pores inside the material are highly desired. Studies have shown that it is completely feasible to prepare foam concrete with connected pores by optimizing the raw materials and reaction conditions. Zhang prepared a porous foam material with a tunable open pore structure (open pore 30–80%) using the ordinary PO and forming agent [31]. The material exhibited good pollutant adsorption performances.
Alkaline cementitious materials represented by cement have the ability to sequester CO2, yet most studies have focused on the effects of carbonization on the material strength. CO2 sequestration performance is less involved, and thus the pore-channel properties of the materials are rarely reported. In the present study, the effects of pore structure on CO2 sequestration performance were demonstrated. A series of foam concretes were prepared using PO cement at different water–cement ratios and different foaming agent dosages. This was performed by natural curing and CO2 curing using slag and fly ash as the raw materials and 30% hydrogen peroxide as the foaming agent. The materials were characterized by XRD, BET, SEM, and TGA to explore the influence mechanism of different systems on CO2 sequestration, aimed to provide guidance for the utilization of solid waste materials and mitigation of the greenhouse effect.
2. Experimental Design
Figure 1 shows the experimental flow chart. Firstly, different foam concrete materials were prepared by varying the water–cement ratio and the amount of foaming agent. The materials were cured for 24 h naturally or by CO2, demolded, dried to terminate hydration, ground, and characterized by TGA, XRD, BET, and SEM. CO2 sequestration was calculated from the TGA results to determine the optimal system. The hydration products, pore structure, specific surface area, and pore volume were analyzed by XRD, BET, and SEM to explore the influence mechanism of water–cement ratio and forming agent dosage on CO2 sequestration.
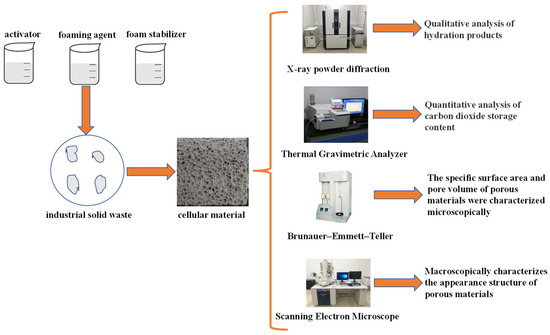
Figure 1.
Experimental flow chart.
2.1. Preparation of Foam Concrete Materials
The cementitious material was prepared with 50% PO cement, 35% slag, and 15% fly ash. Hydrogen peroxide (30%) [32], sodium stearate, and calcium oxide were used as the foaming agent, foam stabilizer, and alkali activator, respectively. Table 1 lists the composition of each system.

Table 1.
Foam concrete mix ratios.
The solid waste-based porous materials were obtained from the systems by chemical foaming. First, pour the pre-weighed cementing material and foaming agent dry powder material into the mixing pot for 1 min at low speed, and then pour the water at normal temperature into the mixing pot for 1 min at low speed according to the experimental requirements, add the CaO alkali activator and stir for 2 min. Finally, pour H2O2 into the mixing pot and mix with cement slag slurry, and quickly stir for 10s to prepare foamed concrete. After that, quickly pour it into the prepared 5 × 5 × 5 cm mold. After the foaming is finished, cover the surface with a layer of plastic wrap to prevent water evaporation. After standing for 1 day, remove the mold, wrap the sample in a plastic bag, and send it to the curing box for curing until the specified age (3 days). The actual picture of material preparation is shown in Figure 2.
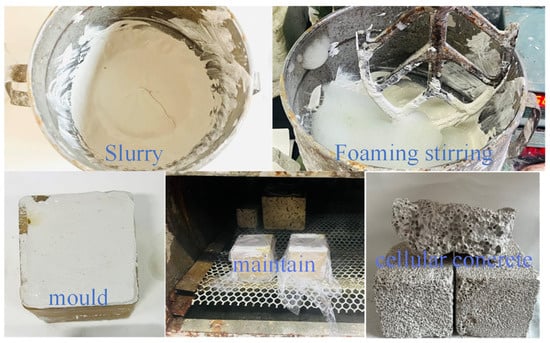
Figure 2.
Actual picture of material preparation.
2.2. CO2 Curing and Sequestration
The CO2 sequestration experiment simulated the real CO2 adsorption process in foam concrete. First, the curing chamber was purged with pure CO2 (99.9%) for a period of time to remove the air. The samples were placed in the curing chamber in the order of labels, and 0.1 MPa CO2 was continuously introduced for 24 h for CO2 curing and sequestration.
2.3. Characterizations
The hydration product composition of the cementitious material was determined by X-ray diffraction (XRD) using a Rigaku Ultima IV X-ray diffractometer in the scanning range of 5–80° at the scanning speed of 8°/min and the step size of 0.02°.
The evolution of the multiscale porous structure of the solid waste-based porous material with the variation of water–cement ratio and foaming agent dose was characterized by SEM and BET analysis. Specifically, the microstructure and surface morphology were imaged with a Nova Nano SEM 450 high-resolution scanning electron microscope, and the specific surface area and average pore diameter were measured with a fully automated ASAP-2460 surface area and porosity analyzer.
TGA was conducted on the prepared solid waste-based material samples at the heating rate of 10 °C/min under a nitrogen atmosphere. The pyrolysis process was analyzed with TGA and DTG curves, and CO2 sequestration was calculated from the weight loss and dry density of the sample.
3. Experimental Results and Analysis
3.1. Effects of Water–Cement Ratio on CO2 Sequestration
The naturally cured samples at the water–cement ratios of 0.4, 0.7, and 0.8 are denoted as NC 0.4, NC 0.7, and NC 0.8, respectively, and the corresponding carbon-cured samples are denoted as CC 0.4, CC 0.7, and CC 0.8, respectively. The hydration products, specific surface areas, average pore sizes, and CO2 sequestrations of these samples were analyzed and characterized to determine the optimal water–cement ratio.
3.1.1. XRD Analysis
Figure 3 shows the XRD patterns of the naturally cured samples with different water–cement ratios. The diffraction peak at 2θ = 29.5° is the strongest, which is the characteristic peak of the main hydration product C-S-H, and the peak intensity increases with the increase of water–cement ratio. The diffraction peaks at 2θ = 36.9°, 47.1°, and 50.7° are attributed to Ca(OH)2. These diffraction peaks in NC 0.4 are not obvious, possibly because the low water–cement ratio causes incomplete hydration or low Ca(OH)2 content, which will eventually result in low CO2 sequestrations. The characteristic diffraction peaks of calcite are detected at 2θ = 29.4°, 39.4°, and 42.8°. The cementitious material contains calcite. CaCO3 can also be formed by the carbonization of Ca2+ during the material preparation. The diffraction peaks at 2θ = 25.7°, 26.6°, 32.1°, and 43.9° can be indexed to vaterite, and the peaks also become stronger with the increase of water–cement ratio. The diffraction peaks at 2θ = 10.9° and 23.3° can be assigned to the Ht phase, and that at 2θ = 30.8° is due to the mayenite phase. The comparison of the XRD patterns of samples with different water–cement ratios suggest they contain the same phases, indicating that changing the water–cement ratio will not alter the types of hydration products.
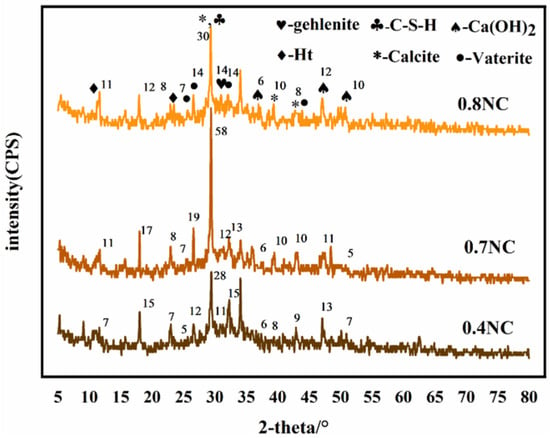
Figure 3.
XRD patterns of the samples with different water–cement ratios.
3.1.2. SEM Analysis
Figure 4 shows the SEM images of the samples with different water–cement ratios. At the low water–cement ratio of 0.4, the samples exhibit dense surfaces, high dry densities, significantly ununiform pore sizes, wide size distributions, and small specific surface areas (Figure 4a1,a2). As the water–cement ratio increases, the sample surface becomes loose, the pores on the surface are refined, the dry density decreases, the number of pores in the sample increase, and pore sizes are more uniform (Figure 4b1,b2,c1,c2). Connected pores are clearly observed in NC 0.7 and CC 0.7 (Figure 4b1,b2), which are conducive to CO2 diffusion, increase the contact area between CO2 and foam concrete material and eventually improve CO2 sequestration. Their high magnification images reveal the fibrous hydration product C-S-H gel and the flaky Ca(OH)2 in NC0.7. However, there is much more CaCO3 in CC 0.7, and Ca(OH)2 flakes are barely seen (Figure 4d1,d2), suggesting most of the Ca(OH)2 is carbonated into CaCO3.
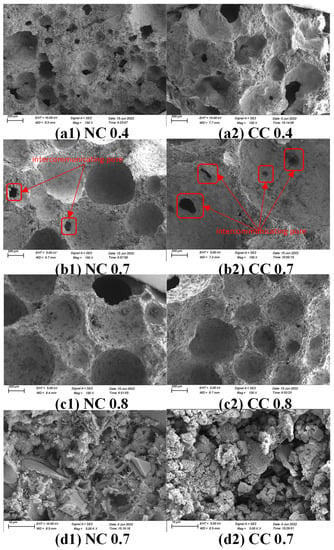
Figure 4.
SEM images of samples with different water–cement ratios before and after carbonization and high magnification images of the samples with water–cement ratio of 0.7 (a1) water-cement ratio 0.4, non-carbonized sample with 10% foaming agent; (a2) water-cement ratio 0.4, carbonized sample with 10% foaming agent; (b1) water-cement ratio 0.7, non-carbonized sample with 10% foaming agent; (b2) water-cement ratio 0.7, carbonized sample with 10% foaming agent; (c1) water-cement ratio 0.8; For non-carbonized sample with 10% foaming agent, (c2) water-cement ratio 0.8, and carbonized sample with 10% foaming agent, (d1) water-cement ratio 0.7 at 5000 times magnification, and (d2) sample with 10% foaming agent after carbonization at 5000 times magnification.
3.1.3. BET Analysis
The samples NC 0.4, NC 0.7, NC 0.8, CC 0.4, CC 0.7, and CC 0.8 were then characterized for N2 adsorption/desorption isotherm and pore size distribution. As shown in Figure 5a, the nitrogen adsorption of all samples increases gradually up to a relative pressure of 0.5 and then increases dramatically as the relative pressure rises further. This pattern of nitrogen adsorption is due to the capillary condensation phenomenon, which is caused by the slit-like pore structure. The adsorption capacity is extremely high as the relative pressure is close to 1, approaching the saturation adsorption due to multi-layer adsorption. The N2 adsorption capacities before and after carbonization are different because the precipitates generated by the CO2 absorption block the mesopores in foam concrete and hinder the adsorption.
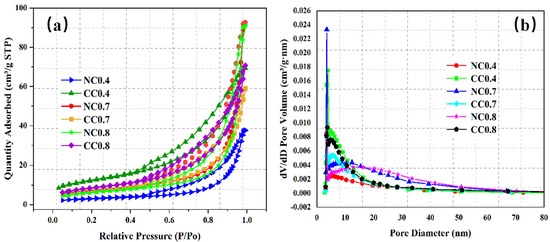
Figure 5.
N2 adsorption/desorption isotherms (a) and pore size distributions (b) of samples with different water–cement ratios.
Figure 5b shows the pore size distributions of these samples, and Figure 6 compares their specific surface areas and pore structures. As can be seen, the pore sizes of all of them mainly fall between 2 and 15 nm, with some exceptions between 15 and 60 nm, indicating that the pores in the samples are mainly mesopores. Before carbonization, both pore volume and specific surface area gradually increase with the increase of water–cement ratio and reach the highest values of 0.144 cm3/g and 25.412 m2/g, respectively, at the ratio of 0.7. The average pore size shows similar changes, and the value at the water–cement ratio of 0.7 is 12.84 nm, second only to that of NC 0.8. Overall, CO2 diffusion is easier in NC 0.7. Its large surface area provides a large contact surface with CO2, which also improves CO2 sequestration.
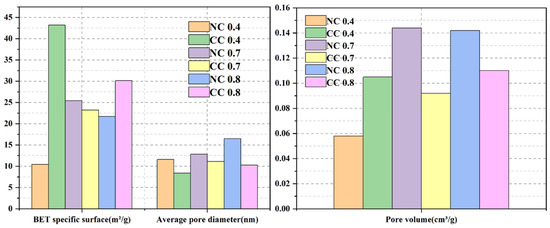
Figure 6.
Comparison of the specific surface areas and pore structure properties of the samples with different water–cement ratios.
3.1.4. CO2 Sequestration
To determine the CO2 sequestration amount, TGA was conducted on the naturally cured and carbon-cured samples with different water–cement ratios. Figure 7 shows their TGA and DTG curves. All samples show constant weight losses during the whole heating process. The weight loss between 30 °C and 100 °C is mainly caused by the evaporation of adsorbed water, and that from 100–200 °C is mainly due to the decomposition of the hydration product C-S-H. The decomposition of the hydration product Ht phase results in the weight loss between 200 °C and 350 °C. The weight loss between 350 °C and 500 °C is mainly caused by the loss of Ca(OH)2, and that between 500 °C and 900 °C is mainly attributed to the decomposition of carbonate. The carbonate is mainly from the material itself and the carbonization of Ca(OH)2. Therefore, CO2 sequestration can be obtained as the difference in the weight loss between naturally cured and carbon-cured samples during the carbonate decomposition.
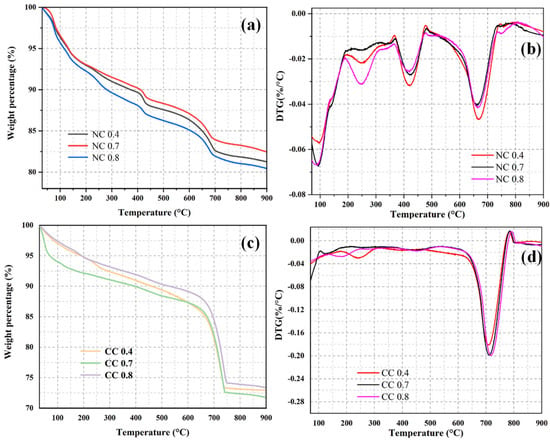
Figure 7.
GA curves (a,c) and DTG curves (b,d) of samples with different water–cement ratios.
As can be seen from Figure 7a, in the naturally solidified sample, the weight loss rate of NC 0.8, NC 0.7, and NC 0.4 is 19.59%, 17.55%, and 18.75%, respectively, within the whole temperature range. As shown in Figure 7b, the weight loss rate of NC 0.4 is 4.62%, that of NC 0.7 is 4.03%, and that of NC 0.8 is 4.15% in the temperature range of 500–900 °C of carbonate decomposition, which is mainly the carbonation of Ca(OH)2 in the material itself.
Specifically, it shows the highest weight losses from 30–100 °C and 200–350 °C, corresponding to the decomposition of the Ht phase (Figure 7b). The weight loss of NC 0.4 is the highest in the Ca(OH)2 decomposition temperature range, indicating that its Ca(OH)2 consumption is the least. The weight loss of NC 0.4 in the carbonate decomposition temperature range of 500–900 °C is higher than those of the other two naturally cured samples.
Among the carbon-cured samples, the weight loss of CC 0.7 is the highest, with values up to 28.25% (Figure 7c). The weight loss rate of CC 0.4 is 27.05%, and that of CC 0.8 is 26.62%. As shown in Figure 6d, the weight loss rate of CC 0.4 is 18.07%, and that of CC 0.7 is 19.39% in the 500–900 °C temperature range of carbonate decomposition. The weight loss rate of CC 0.8 is 19.87%, which is mainly due to the effective absorption of CO2 by all hydration products in the carbonization process and their conversion into CaCO3-dominated carbonates.
Unlike the naturally cured sample, CC 0.7 shows the highest weight loss in the temperature range of 500–900 °C among its different weight loss temperature ranges. As can be seen from the DTG curves of the carbon-cured samples, they exhibit the same weight loss temperature ranges as the naturally cured samples; however, the weight losses in the decomposition temperature ranges of Ca(OH)2 and Ht phase are lower, and the weight loss in the carbonate decomposition temperature range of 500–900 °C is much greater (Figure 7d). These results indicate that during CO2 curing, the hydration products and CO2 are converted into carbonates. The weight loss of carbonate increases first and then decreases with the increase of water–cement ratio, and so does the sequestration content of CO2, indicating that extremely high water–cement ratios are inconducive to CO2 sequestration. The high dry density, dense structure, fewer pores, and ununiform pore sizes of the material with the water–cement ratio of 0.4 are unfavorable to CO2 sequestration. At the water–cement ratio of 0.7, the strong hydration reaction of the cementitious material results in a loose structure, many uniform pores, and even connected pores, which can promote CO2 diffusion between the pores and increase the contact area. Further increasing the water–cement ratio to 0.8 decreases CO2 sequestration, which may be due to the good fluidity of the slurry, which easily breaks the bubbles and reduces the pore volume. Although more hydration products are generated, the reductions in CO2 diffusion rate and contact area cause low sequestration.
3.2. Effects of Foaming Agent Dosage on CO2 Sequestration
The study on the effects of water–cement ratio on CO2 sequestration suggests that the optimal water–cement ratio is 0.7. Therefore, the effects of the foaming agent dosage on CO2 sequestration were investigated with the water–cement ratio fixed at 0.7 and foaming agent dose varied to 8%, 10%, and 12%, respectively. The corresponding naturally cured samples are denoted as NC 8%, NC 10%, and NC 12%, and the corresponding carbon-cured samples are denoted as CC 8%, CC 10%, and CC 12%. The hydration products, specific surface areas, average pore sizes, and CO2 sequestrations of these samples were analyzed and characterized to determine the optimal foaming agent dosage.
3.2.1. XRD Analysis
Figure 8 shows the XRD patterns of the samples prepared at different foaming agent doses. As can be seen, the changes in the XRD pattern with the foaming agent dosage are similar to those with the change in water–cement ratio. The diffraction peak at 2θ = 29.5° is the strongest one, which is the characteristic diffraction peak of the main hydration product C-S-H of the cementitious material. The intensity of the diffraction peak increases with the increase of the foaming agent dosage. The diffraction peaks at 2θ = 36.1°, 34.1°, 47.1°, and 52.2° are indexed to Ca(OH)2. These diffraction peaks also become stronger with the increase of foaming agent dosage. The diffraction peaks at 2θ = 10.9° and 23.3° are indexed to the Ht phase, which is a double-layer of metal hydroxides composed of Mg2+ (or Ca2+) and Al3+. Similarly, the diffraction peaks of CaCO3 at 2θ = 29.4°, 39.4°, and 43.2° are observed in the XRD patterns of all samples, suggesting that main phases remain unchanged with the increase of foaming agent dosage and the foaming agent dosage has no effects on the type of hydration products of the material.
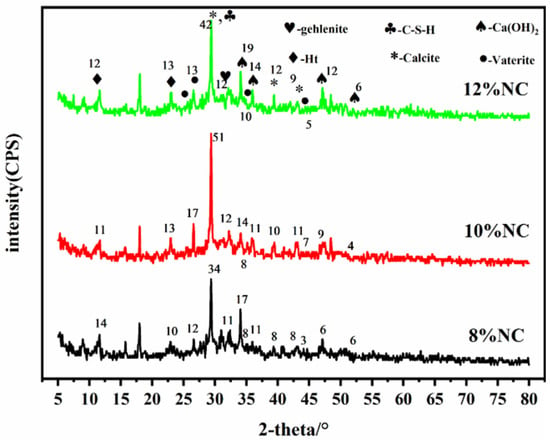
Figure 8.
XRD patterns of the samples prepared with different foaming agent doses.
3.2.2. SEM Analysis
The SEM imaging reveals that the foaming agent dosage affects the microscopic pore distribution in foam concrete significantly (Figure 9). At the foaming agent dose of 8%, more round pores are formed in the sample; however, pore sizes are ununiform. The low foaming agent dose also results in a low relative water content and dense structure. As the foaming agent dose increases to 10%, the relative water content and the degree of hydration of the cementitious material increase, and more bubbles are generated. There are more round pores between the particles of the cementitious material, and connected pores are clearly observed, which lowers the resistance to CO2 diffusion, increases the contact area, and thus is conducive to CO2 sequestration. However, further increasing the foaming agent dose to an excess amount, 12%, the number of bubbles increases, and the bubbles tend to break or connect with each other to form bigger bubbles, which leads to low dry density and thus is inconducive to CO2 sequestration. It is worth noting that the hydration products C-S-H gel and Ca(OH)2 flakes are also observed in the 5000× magnification image.
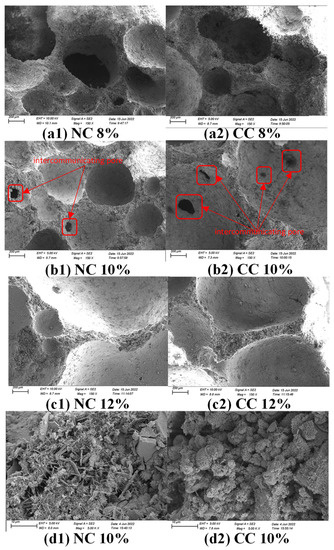
Figure 9.
SEM images of samples prepared with different foaming agent doses before and after carbonization and high magnification images of the samples prepared with 10% foaming agent. (a1) uncarbonized sample with a water-cement ratio of 0.7 and foaming agent of 8%, (a2) uncarbonized sample with a water-cement ratio of 0.7 and foaming agent of 8%, (b1) uncarbonized sample with a water-cement ratio of 0.7 and foaming agent of 10%, (b2) water-cement ratio of 0.7 and foaming agent of 10% and (c1) water-cement ratio of 0.7, For the uncarbonized sample with 12% foaming agent, (c2) water-cement ratio 0.7, and the carbonized sample with 12% foaming agent, (d1) water-cement ratio 0.7, and the uncarbonized sample with 10% foaming agent, and (d2) 5000-fold magnification of water-cement ratio 0.7, and the carbonized sample with 10% foaming agent.
3.2.3. BET Analysis
The pore structure of foam concrete is an important factor affecting CO2 sequestration efficiency. In addition to water–cement ratio, foaming agent dosage is also an important factor affecting the pore structure. Therefore, NC 8%, NC 10%, NC 12%, CC 8%, CC 10%, and CC 12% were characterized by BET analysis for their pore properties. Figure 10 and Figure 11 show the N2 adsorption/desorption isotherms, pore size distributions, and specific surface areas of these samples.
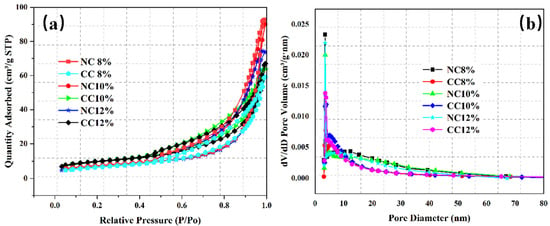
Figure 10.
N2 adsorption/desorption isotherms of the samples prepared with different foaming agent dosages before and after carbonation (a) and their pore diameter distributions (b).
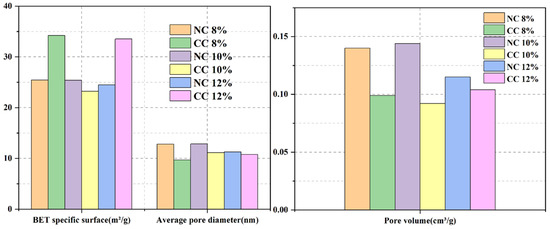
Figure 11.
Comparison of specific surface areas and pore structures of the samples prepared with different foaming agent dosages.
Similar to those obtained at different water–cement ratios, the N2 adsorption/desorption isotherms of the samples prepared with different foaming agent dosages are the typical type IV isotherms (Figure 10a). The N2 adsorption capacity increases with the increase of pressure, indicating that the pore structure is still dominated by mesopores, despite the variations in the foaming agent dosage.
The pore sizes range from 2 nm to 70 nm and mainly distribute in the range of 3–10 nm (Figure 10b). Although the specific surface area of NC10% is slightly smaller, its pore volume and average pore size are the largest, which is conducive to CO2 diffusion and transport, improves the reaction efficiency between CO2 and the hydration products or Ca2+, and thus increases CO2 sequestration.
3.2.4. CO2 Sequestration
CO2 sequestration directly reflects the CO2 adsorption performance of a foam concrete material. Therefore, TGA analysis was also carried out on the foam concrete materials prepared with different foaming agent doses to calculate their CO2 sequestrations. As shown in Figure 12a,c, each sample shows obvious weight loss in the temperature range of 30–900 °C. The weight loss of NC12% is the highest among the naturally cured samples, with values of up to 23.8%. The weight loss rate of 10% NC is 17.55%, and that of 8% NC is 23.64. CC 10% has a maximum weight loss of 28.21%, CC 12% has a weight loss of 24.37, CC 8% has a weight loss of 23.98%, and that of CC 10% is the highest among the carbon-cured sample with values of up to 27.0%. DTG curves suggest that the weight loss caused by the decomposition of the Ht phase at 200–350 °C and that of Ca(OH)2 at 350–500 °C are lower in the carbonized sample than in the naturally cured sample (Figure 12d vs. Figure 12b). However, in the temperature range of 500–800 °C, the weight loss of the carbon-cured sample is higher, suggesting that the hydration products effectively absorb CO2 and convert it into CaCO3. The weight loss caused by the decomposition of carbonate gradually increases with the increase of the foaming agent dose and then declines at the dose of 12%. This can be explained by the fact that the relative water content of the material increases with the increase of the foaming agent dose, and the hydration reaction of the material becomes more thorough. At the same time, the number of generated bubbles increases, which provides more adsorption sites for CO2 sequestration. However, the extremely high amount of foaming agent tends to generate large pores. The good fluidity of the slurry also tends to break the foam in the concrete and thus reduces the pore volume, which leads to the reduction of the actual adsorption site for CO2 and lowers CO2 sequestration.
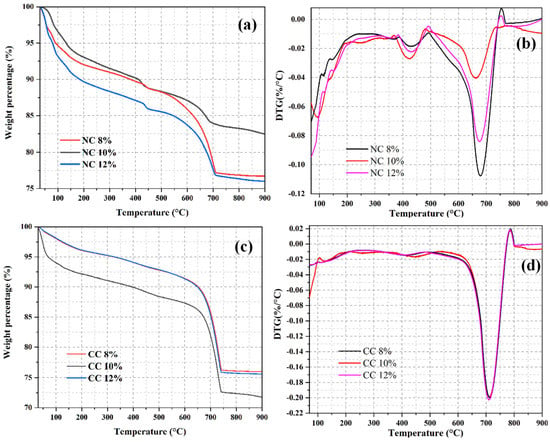
Figure 12.
TGA (a,c) and DTG (b,d) curves of the samples prepared with different foaming agent doses.
4. Discussion
There have been many studies on the recovery, capture, and utilization of CO2; however, most methods have problems of poor storage effect and high cost. In this study, industrial wastes such as cement, slag, and fly ash (in combination with hydrogen peroxide) were used as chemical foaming agents in the production of foamed concrete. This was performed using an alkali excitation agent, and the pore structure of the material was adjusted by changing the water–cement ratio and the amount of foaming agent. It was found that C-S-H, Ca(OH)2, and other substances produced in the hydration process of the material would precipitate carbonate with carbon dioxide. With the increase of water–cement ratio and dosage of foaming agent, thermogravimetric data showed that the carbon dioxide sealing capacity showed a trend of first increasing and then decreasing. It was found by BET and SEM that when the water–cement ratio increased to 0.7, and the dosage of foaming agent increased to 10%, the specific surface area of the material gradually increased, the proportion of connected pores increased, and the size of pores gradually became uniform. The samples are all mesoporous, with pore sizes ranging from 2–50 nm. With the further increase of water–cement ratio and dosage of foaming agent, the sealing effect is poor because the foaming is too intense, the water–cement ratio is high, and bubbles burst easily, leading to the increase of the proportion of large pores. After CO2 storage, the specific surface area and average pore diameter of the sample increased slightly, which could be caused by the hydration reaction of Ca2+ on the surface of slag particles before carbonization. During the carbonization process, Ca2+ was generated by continuous decalcification of C-S-H gel, and CO2 was dissolved into CO32− and HCO3− in the carbonization chamber. Ca2+ combines with CO32− in the solution to produce CaCO3 with a stable structure. After decalcification, C-S-H gels undergo condensation reactions with each other and finally form calcium-modified gels with a higher degree of polymerization, forming deeper ion-leaching channels, thus increasing pore volume and average pore diameter.
This study explored the optimal water–cement ratio and amount of foaming agent. The amount of alkali activator and alkali excitation system are also important factors affecting the adsorption of carbon dioxide. In the next step, we will continue to research the influence of the amount and type of alkali activator on the pore structure of foamed concrete materials and the amount of carbon dioxide adsorption.
5. Conclusions
In this paper, foam concrete materials were prepared from cement and solid waste-based materials using hydrogen peroxide as the foaming agent. The effects of water–cement ratio and foaming agent dosage on CO2 adsorption were studied by XRD, BET, SEM, and TGA. The following conclusions have been drawn.
(1) XRD analysis reveals that the hydration products of the cementitious material mainly include C-S-H, Ht, and Ca(OH)2, and they are responsible for CO2 sequestration. The types of hydration products remain the same, despite the changes in water–cement ratio and foaming agent dosage.
(2) BET analysis suggests that the pores in the foam concrete materials are mainly mesopores. The specific surface area, pore volume, and average pore size of the material change with the changes in water–cement ratio and foaming agent dosage. When the water–cement ratio, foaming, and dosage increase continuously, the specific surface area of foamed concrete materials increases first and then decreases. When the water–cement ratio is 0.7, the specific surface area reaches the maximum, increasing the contact area between CO2 and materials and increasing the adsorption point, which is conducive to the solidification of CO2.
At the water–cement ratio of 0.7 and the foaming agent dose of 10%, the obtained foam concrete exhibits a specific surface area of 25.412 m2/g, a pore volume of 0.144 cm3/g, and an average pore diameter of 12.840 nm.
(3) SEM analysis shows that the hydration degree of the cementitious material is low at low water–cement ratios and low foaming agent dosages. The surface structure of the obtained sample is dense, with fewer pores and ununiform big pores. At the water–cement ratio of 0.7 and foaming agent dose of 10%, more pores with uniform sizes are formed, and even connected pores are observed, which is conducive to the CO2 diffusion in the material.
(4) CO2 sequestration can be determined from the TGA and DTG curves. The decompositions of the hydration products or the carbonate produced from carbonization of Ca(OH)2 occur in the temperature range of 550–850 °C. CO2 sequestration first increases and then decreases with the increases of water–cement ratio and foaming agent dosage. The highest CO2 sequestration of 66.35 kg/m3 is obtained at the water–cement ratio of 0.7 and the foaming agent dose of 10%.
Through the CO2 curing experiment of foamed concrete materials prepared under the conditions of water–cement ratio and foaming agent, it is concluded that when the water–cement ratio is 0.7 and foaming agent dosage is 10%, the foamed concrete materials have uniform pore size, high porosity and connected pore ratio, large specific surface area of pores, and the highest CO2 sealing stock is 66.35 kg/m3. Therefore, the water–cement ratio is 0.7. The foaming agent content of 10% is the best proportion in this group of raw material systems.
Author Contributions
All authors contributed to this paper. Conceptualization, Y.W. and G.W.; methodology, X.C.; validation, M.Z., G.W. and Z.L.; formal analysis, Y.W. and X.C.; investigation, M.Z.; writing—original draft preparation, Z.L.; writing—review and editing, G.W.; supervision, X.C.; funding acquisition, G.W. All authors have read and agreed to the published version of the manuscript.
Funding
The authors would like to acknowledge the support of the project by the National Natural Science Foundation of China (No. 51974176), the Taishan Scholars Project (TS20190935), and the Shandong outstanding youth fund (ZR2020JQ22).
Data Availability Statement
The data used for conducting classifications are available from the corresponding author upon request.
Conflicts of Interest
The authors declare no potential conflict of interest with respect to the research, authorship, and publication of this article.
References
- Hendriks, C. Energy Conversion: CO2 Removal from Coal-Fired Power Plant; Kluwer Academic Publishers: Dordrecht, The Netherlands, 1995; p. 7. [Google Scholar]
- Takamura, Y.; Narita, S.; Aoki, J.; Uchida, S. Application of high-PSA process for improvement of CO2 recovery system. Can. J. Chem. Eng. 2001, 79, 812–816. [Google Scholar] [CrossRef]
- Audus, H. Leading options for the capture of CO2 at power stations. In Proceedings of the 5th International Conference on Greenhouse Gas Controltechnology, Cairns, Australia, 13–16 August 2000. [Google Scholar]
- Englezos, P.; Ripmeester, J.A.; Kumar, R.; Linga, P. Hydrate processes for CO2 capture and scale up using a new apparatus. In Proceedings of the International Conference on Gas Hydrates, Vancouver, BC, Canada, 6–10 July 2008; ICGH: Lincolnton, NC, USA, 2008. [Google Scholar]
- Gottlicher, G.; Pruschek, R. Comparison of CO2 removal systems for fossil fuelled power plants. Energy Convers. Manag. 1997, 38, 173–178. [Google Scholar] [CrossRef]
- Dooley, J.J.; Davidson, C.L.; Dahowski, R.T. An assessment of the commercial availability of carbon dioxide capture and storage technologies as of June 2009. In Report for the US Department of Energy under a Contract no. DE-AC05-T6RL01830, PNNL-18520; Pacific Northwest National Lab: Richland, WA, USA, 2009. [Google Scholar]
- Leung, D.Y.C.; Caramanna, G.; Maroto-Valer, M.M. An overview of current status of carbon dioxide captureand storage technologies. Renew. Sustain. Energy Rev. 2014, 39, 426–443. [Google Scholar] [CrossRef]
- Dennis, Y.C.; Leung Aresta, M.; Dibenedetto, A. Utilisation of CO2 as a chemical feedstock: Opportunities and challenges. Dalton Trans. 2007, 28, 2975–2992. [Google Scholar]
- Nässén, J.; Hedenus, F.; Karlsson, S.; Holmberg, J. Concrete vs. wood in buildings: An energy system approach. Build. Environ. 2012, 51, 361–369. [Google Scholar] [CrossRef]
- Yang, K.; Seo, E.; Tae, S. Carbonation and CO2 uptake of concrete. Environ. Impact Assess 2014, 46, 43–52. [Google Scholar] [CrossRef]
- Bertos, M.F.; Simons, S.J.R.; Hills, C.D.; Carey, P.J. A review of accelerated carbonation technology in the treatment of cement-based materials and sequestration of CO2. J. Hazard. Mater. 2004, 112, 193–205. [Google Scholar]
- Ashraf, W. Carbonation of cement-based materials: Challenges and opportunities. Constr. Build. Mater. 2016, 120, 558–570. [Google Scholar] [CrossRef]
- Jang, J.G.; Kim, G.M.; Kim, H.J.; Lee, H.K. Review on recent advances in CO2 utilization and sequestration technologies in cement-based materials. Constr. Build. Mater. 2016, 127, 762–773. [Google Scholar] [CrossRef]
- Chen, H. Study on Regulation of Pore Structure of Chemical Foamed Concrete. Master’s Thesis, North China University of Science and Technology, Qinhuangdao, China, 2015. [Google Scholar]
- Kashef-Haghighi, S.; Shao, Y.; Ghoshal, S. Mathematical modeling of CO2 uptake by concrete during accelerated carbonation curing. Cem. Concr. Res. 2015, 67, 1–10. [Google Scholar] [CrossRef]
- Shi, C.; Liu, M.; He, P.; Ou, Z. Factors affecting kinetics of CO2 curing of concrete. J. Sustain. Cem.-Based Mater. 2012, 1, 24–33. [Google Scholar]
- Xue, Q.; Zhang, L.; Mei, K.; Wang, L.; Wang, Y.; Li, X.; Cheng, X.; Liu, H. Evolution of structural and mechanical properties of concrete exposed to high concentration CO2. Constr. Build. Mater. 2022, 343, 128077. [Google Scholar] [CrossRef]
- Wu, H.; Zhou, M.; Wang, H.; Ge, X. Research on composition design of foam ceramics with bauxite tailing. New Build. Mater. 2020, 47, 153–158. [Google Scholar]
- Wang, Q.; Yu, H.; Ben, T.; Li, Q.; Li, F.; Xu, H.; Qiao, H.; Du, Q. Preparation of Light-weight High-strength Thermal Insulation and Decoration Integration Building Materials Using Red Mud as Raw Materials. Bull. Chin. Ceram. Soc. 2018, 37, 1393–1398. [Google Scholar]
- Guo, J.; Wang, Z. Preparation and Study of Gold Tailings Foam Cement. Multipurp. Util. Miner. Resour. 2017, 53, 119–122. [Google Scholar]
- Lei, W.; Wang, Y.; Liu, X. Study on development and production process of foam cement panels. Fly Ash Compr. Util. 2013, 6, 40–41. [Google Scholar]
- Zhang, H.; Qi, X.; Wan, L.; Zuo, Z.; Ge, Z.; Wu, J.; Song, X. Properties of silt-based foamed concrete: A type of material for use in backfill behind an abutment. Constr. Build. Mater. 2020, 261, 119966. [Google Scholar] [CrossRef]
- Cai, H. Study on the Constitutive Relations of Sulfoaluminate Foam Concrete. Master’s Thesis, Jilin Jianzhu University, Changchun, China, 2014. [Google Scholar]
- Łach, M.; Korniejenko, K.; Mikuła, J. Thermal Insulation and Thermally Resistant Materials Made of Geopolymer Foams. Procedia Eng. 2016, 151, 410–416. [Google Scholar] [CrossRef]
- Chen, H. Research on the Control of the Pore Structure of Chemically Foamed Concrete. Master’s Thesis, North China University of Science and Technology, Qinhuangdao, China, 2015. [Google Scholar]
- Xi, Y. Study on the Pore Structure and Properties of Foam Concrete. Master’s Thesis, Nanjing University of Aeronautics and Astronautics, Nanjing, China, 2016. [Google Scholar]
- Zhang, J.; Yan, Y.; Hu, Z. Preparation and characterization of foamed concrete with Ti-extracted residues and red gypsum. Constr. Build. Mater. 2018, 171, 109–119. [Google Scholar] [CrossRef]
- Liu, X.; Ni, C.; Meng, K.; Zhang, L.; Liu, D.; Sun, L. Strengthening mechanism of lightweight cellular concrete filled with fly ash. Constr. Build. Mater. 2020, 251, 118954. [Google Scholar] [CrossRef]
- Zhang, C.; Cai, J.; Kong, D. Influence of carbon dioxide curing process on cement hydration hardening performance. Gansu Water Resour. Hydropower Technol. 2018, 54, 37–40. [Google Scholar]
- Bonenfant, D.; Kharoune, L.; Sauvé, S.; Hausler, R.; Niquette, P.; Mimeault, M.; Kharoune, M. CO2 Sequestration by Aqueous Red Mud Carbonation at Ambient Pressure and Temperature. Indengchemres 2008, 47, 7617–7622. [Google Scholar] [CrossRef]
- Zhang, Y. Preparation and Adsorption Properties of Open-Pore Foam Concrete. Master’s Thesis, Southwest University of Science and Technology, Mianyang, China, 2017. [Google Scholar]
- Candamano, S.; Policicchio, A.; Conte, G.; Abarca, R.; Algieri, C.; Chakraborty, S.; Curcio, S.; Calabro, V.; Crea, F.; Agostino, R.G. Preparation of foamed and unfoamed geopolymer/nax zeolite/activated carbon composites for CO2 adsorption. J. Clean. Prod. 2022, 330, 129843. [Google Scholar] [CrossRef]
Disclaimer/Publisher’s Note: The statements, opinions and data contained in all publications are solely those of the individual author(s) and contributor(s) and not of MDPI and/or the editor(s). MDPI and/or the editor(s) disclaim responsibility for any injury to people or property resulting from any ideas, methods, instructions or products referred to in the content. |
© 2023 by the authors. Licensee MDPI, Basel, Switzerland. This article is an open access article distributed under the terms and conditions of the Creative Commons Attribution (CC BY) license (https://creativecommons.org/licenses/by/4.0/).