Abstract
The treatment of inoculation of white cast iron with carbide precipitations that consist of increasing the number of primary austenite grains is not as well-known as the treatment of inoculation of gray cast iron in which the number of eutectic grains increases. In the studies included in the publication, experiments were carried out using the addition of ferrotitanium as an inoculant for chromium cast iron. The Cellular Automaton Finite Elements (CAFE) module of ProCAST software was used in order to analyze the formation of the primary structure of hypoeutectic chromium cast iron in a casting of various thicknesses. The modeling results were verified using Electron Back-Scattered Diffraction (EBSD) imaging. The obtained results confirmed obtaining a variable number of primary austenite grains in the cross-section of the tested casting, which significantly affects the strength properties of the obtained chrome cast iron casting.
1. Introduction
The microstructure of white high-chromium cast iron largely depends on the chemical composition of the liquid phase and the direction of change in the chemical composition of the liquid during the crystallization process. The data contained in [1] show that the structure of high-chromium cast iron may have the following phase composition:
- dendrites α + peritectic (γ—M7C3) + eutectic (α—M7C3) + eutectic (γ—M7C3);
- primary carbides M7C3 + peritectic (γ—M3C) + eutectic: (γ—M3C) + eutectic (γ—M7C3);
- primary carbides M7C3 + peritectic (γ—M7C3) + eutectic (γ—M7C3);
- dendrites γ eutectic (γ—M7C3);
- dendrites γ peritectic (γ—M7C3) + eutectic (γ—M7C3) + eutectic (γ—M3C);
- primary carbides M3C + eutectic (γ—M3C);
- dendrites α + peritectic phase γ peritectic (γ—M7C3) + eutectic (γ—M7C3);
- dendrites γ + eutectic (γ—M3C);
- primary carbides M7C3 + eutectic (γ—M7C3);
- M7C3 primary carbides + M3C primary carbides + eutectic (γ—M3C);
- eutectic (γ—M7C3).
The described phase composition of chromium cast iron results from the theoretical analysis of cross-sections of the polythermal triple phase equilibrium system of Fe-C-Cr alloys determined for the designed chemical composition. The eutectic structure of white high-chromium cast iron is related to the crystallization of the M7C3 complex carbide [2].
As a pre-eutectic phase and as a phase included in the eutectic grain, there is M7C3 carbide, which crystallizes in the form of rods with a hexagonal cross-section. Undoubtedly, the leading phase during the crystallization of the eutectic α + M7C3 is carbide and it should be expected that eutectic grains will nucleate and grow on its surface. In addition, high-chromium cast iron is a material sensitive to the cooling rate, as well as other types of cast iron. Thus, the morphology of the eutectic crystallization and the phase composition of the microstructure in high-chromium cast iron also depend on the crystallization and cooling conditions of the casting. When a high-chromium cast iron casting is provided with a high cooling rate, the share of the eutectic type γ(α) + (Fe,Cr)7C will increase, while the share of the eutectic type γ(α) + (Cr,Fe)3C will decrease. Therefore, the microstructure of the casting walls of various dimensions will differ not only in the size of a given phase but also in the phase composition. In general, the structure of white chromium cast iron can be classified according to the range of alloy chemistry, phase growth rate and temperature gradient. These parameters allow hypoeutectic, eutectic and hypereutectic structures to be obtained in cast iron.
Table 1 presents the chemical composition and hardness of abrasion-resistant high-chromium cast iron according to the PN-EN 12513 standard (https://www.en-standard.eu/din-en-12513-founding-abrasion-resistant-cast-irons/ accessed on 5 March 2023 or https://sklep.pkn.pl/pn-en-12513-2011e.html accessed on 5 March 2023). Based on the data presented in Table 1, white high-chromium cast iron covers four ranges of chromium content: the first is 11 wt% < Cr ≤ 14 wt%; the second is 14 wt% < Cr ≤ 18 wt%; the third is 18 wt% < Cr ≤ 23 wt%; and the fourth is 23 wt% < Cr ≤ 28 wt%. However, for each range of chromium content, this standard provides three ranges of carbon content. It should be remembered that as the carbon content decreases, both the plastic properties and the resistance to repeated impact loads increase. However, when the carbon content increases, the hardness of this cast iron also increases. Wear-resistant high-chromium cast iron, on the other hand, is particularly sensitive to the cooling rate. Therefore, the microstructure of high-chromium cast iron is particularly dependent on the thickness of the casting wall, i.e., on the casting modulus, similarly to nickel-chromium (martensitic) cast iron.

Table 1.
Chemical composition and hardness of high-chromium cast iron resistant to abrasive wear.
To obtain the required hardness given in Table 1, it becomes necessary to optimize the chemical composition, that is, the appropriate selection of alloying elements depending on the thickness of the casting wall. For castings supplied in the unfinished state of high chrome cast iron with a low content of alloying elements, may be difficult to obtain the hardness required by the standard. A similar situation should be expected in the case of castings of this type of cast iron with a high wall thickness. The requirements for such castings should be separately agreed upon between the ordering party and the manufacturer. In addition, it should be noted that the shrinkage of white chrome cast iron of all types during crystallization is significant (about 2%), similarly to the shrinkage of cast steel which requires the use of risers of appropriate dimensions. Castings are usually left in the molds until they reach an ambient temperature. However, it is also allowed to remove castings from the mold at a sufficiently high temperature for the purpose of heat treatment. The addition of additives (recommended by the PN-EN-12513 standard), such as molybdenum and vanadium, to the white high-chromium cast iron can lead to the formation of additional carbides in the discussed structure, or if such carbides do not precipitate, to replace some of the chromium in the M7C3 type carbides, thereby increasing its share in the metal matrix. Molybdenum is introduced into high-chromium cast iron to prevent the separation of pearlite in the metal matrix of high-chromium cast iron. If pearlite appears in the metal matrix of this cast iron, it will mean a significant decrease in the abrasion resistance of the cast iron.
In the group of high-chromium cast iron resistant to abrasive wear, there is a widespread type 15-3 chromium-molybdenum cast iron (known as Climax Alloy) containing 14 ÷ 16 wt% chromium and 2.4 ÷ 3 wt% molybdenum. Grades of this type of cast iron are included in the US standard ASTM A532 as Class II Types B and D and designated as 15% Cr-Mo-LC (low carbon) and 15% Cr-Mo-HC (high carbon). In fact, it is a grade of white martensitic cast iron and its equivalent, according to the PN-EN 12513 standard, is a grade classified in the group of high-chromium white cast iron as EN-GJN-HV600(XCr14) with some modifications in the composition of alloying elements such as wt% Ni + wt% Mo + wt% Cu. It must be noted that this cast iron shows very good resistance to abrasive wear while maintaining good plastic properties and good corrosion resistance. The molybdenum in this alloy is bound in the form of carbides of the Mo2C and (Cr, Fe, Mo)7C3 types and is partially dissolved in a solid solution. Type 15-3 cast iron can be used in the unfinished state when the wall thickness of the casting is small, with the possible use of stress relief annealing at a temperature of 200–250 °C. To obtain a high hardness value, this type of cast iron is hardened in air and then possibly tempered. In general, it must be said that the PN-EN 12513 standard for high-chromium cast iron castings allows the following types of heat treatment: tempering, hardening, hardening and tempering, soft annealing, soft annealing and hardening, soft annealing, hardening and tempering. However, in the case of the need for mechanical treatment of castings made of high chromium cast iron, soft annealing is recommended. If the order concerns castings after soft annealing, it is the client who is responsible for the correct course of the subsequent treatments: hardening and tempering.
Chromium cast iron is used in the production of castings that must be characterized by very good wear resistance and good corrosion resistance.
The casts produced may be several millimeters thick, for example, the cast wall of a defibrating machine used for the production of wood pulp for the production of MDF plates, which can be up to several dozen millimeters, or the cast of slurry pump bodies used in mines. In articles [3,4], the authors presented the results of research related to the inoculation of cast iron. The study was concerned with the effect of changing the content of the FeTi inoculant on the primary structure of hypoeutectic chromium cast iron. These studies show that this inoculant affects the primary structure of cast iron, that is, the faster nucleation of the primary austenite grains results in an increase in their number. This leads to a reduction in the hot cracking of cast components and reduces the level of porosity in the casting. These unfavorable properties can be eliminated by FeTi inoculation as a result of fragmentation of the primary structure of the casting [3,4]. According to the authors of the article, this is how the effect of using the inoculation procedure on the structure and properties of such alloys should be understood.
The phase composition of chromium cast iron described above results from the theoretical analysis of cross-sections of the polythermal triple phase equilibrium system of Fe-C-Cr alloys determined for the designed chemical composition.
In the literature, another important approach to the inoculation procedure can be found, which consists of the production of other types of carbides in the structure of chrome cast iron, for example, TiC, NbC and others [5,6,7,8,9,10,11,12,13,14,15,16,17,18]. Determining the number of primary phase in hypoeutectic cast iron with austenite-carbide eutectic is problematic. In the case of graphite eutectic, there are simple methods based on counting nodular graphite precipitates (ductile iron) or areas limited by phosphorus eutectic precipitates (flake graphite cast iron). In the case of carbide eutectics, the above-mentioned methods cannot be used. A separate issue is the measurement number and size of primary austenite grains. In order to perform reliable metallographic tests, the use of the Electron Back-Scattered Diagram (EBSD) method is proposed [3]. This method requires the use of a scanning microscope with an appropriate detector and very careful sample preparation. These factors make the analysis of alloys with high abrasion resistance difficult and time-consuming. The solution may be the use of metal crystallization simulation software such as ProCAST by the ESI Group. With the selection of appropriate parameters, the structure [19,20,21,22,23,24,25,26,27] can be simulated, which will be formed throughout the casting volume, allowing the testing time by reducing the number of samples tested.
2. Methodology
2.1. Simulation Domain
In the Laboratory of Computer Modelling of Crystallization Processes, modeling of the primary structure was carried out for the thickness of 20 mm, 30 mm and 40 mm. The model was carried out for a fragment of an infinite plate with the thickness mentioned above, located between the two layers of bentonite mass, 50 mm thick each, as in Figure 1a.
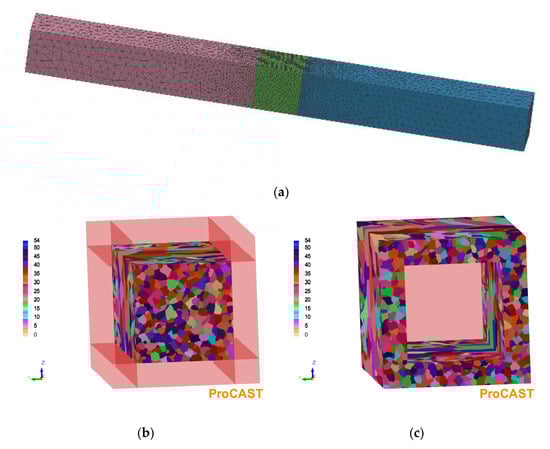
Figure 1.
(a) An example of a model of a 20 mm thick plate (green) between two layers of 50 mm thick bentonite molding composition; (b) typical microstructure in the analyzed area with cross-section 10 × 10 mm; (c) 2.5 mm thick outer buffer layer.
The length of the sample in the direction of heat dissipation (L) is 20, 30 and 40 mm, respectively. The cross-section of the area for which the results of the microstructure simulation with the CAFE method were presented has dimensions of 10 × 10 mm (Figure 1b). In the direction perpendicular to the discharge direction, the heated sample is surrounded on all sides by a 2.5 mm thick buffer layer (Figure 1c), in which the CAFE simulation was also carried out. The total area in which nucleation and grain growth are simulated using the CAFE method is 15 × 15 × L mm.
Few examples are known of the application of the CAFE method to simulate the microstructure of hypoeutectic alloys [28,29,30]. The CAFE module of the ProCAST 2022.0/Visual-Environmemt 18.0 software is designed to predict the structure formed during primary single-phase solidification and does not provide for the possibility of considering eutectic solidification. Due to the relatively small fraction of carbide eutectics, the growth of eutectic colonies in the analyzed alloy begins at the final stage of crystallization, and eutectic structure components are mostly localized at the grain boundaries of the primary solid solution grains. Therefore, in this study, it was decided to apply the above software to evaluate the sizes, distribution and shape of austenite primary grains formed in the alloyed iron castings studied.
The model does not take into account the possibility of nucleation and grain growth processes in the area beyond the outer boundaries of the buffer layers. For this reason, the microstructure of the outer zone of the buffer zone obtained in the simulation is not a good representation of the microstructure of the primary grains. The purpose of using such a buffer area was to eliminate the impact on the microstructure of the analyzed area of the inability to account for the influence of nucleation and grain growth in the area located beyond the outer lateral surface of these buffer areas. When analyzing the simulation results, the microstructure of the buffer zone was not taken into account. All simulation results shown below were obtained in the analysis area with a 10 × 10 mm cross-section.
The sample is located between the two layers of molding sand of the same cross-section and 50 mm thickness in the direction of heat dissipation on each side. The adiabatic condition was assumed on the side surfaces of the entire temperature field modeling area. On the front walls of the molding sand area (15 × 15 mm), the condition of air cooling was adopted.
2.2. Café Simulation
For the prediction of the primary grains structure, the Cellular Automata technique is used in the ProCAST software. The processes of the nucleation and growth of the solid phase grains from the liquid are analyzed based on a simulated temperature field. Detailed information on the simulation method using the cellular automaton technique can be found in the publications [31,32,33,34,35].
For the prediction of the temperature field, the Fourier equation is solved numerically by using the Finite Elements Method as follows:
where:
- ρ—density, kg/m3; c—heat capacity, J/(kg × K);
- T—temperature, K; τ—time, s;
- λ—thermal conductivity coefficient, W/(m × K);
- q—rate of heat of crystallization release (source function), W/m3;
- div and grad—mathematical operators of divergence and gradient.
In the model, 3D approach is used for the estimation of the primary austenite grain number and shape with an account of the local undercooling at the solid-liquid interface ΔT. The model assumes that the dependence of the fraction of substrates for the heterogeneous nucleation of primary austenite grains on the undercooling at which their activation and nucleation occur follows the Gaussian statistical law. The parameters of this normal distribution are the mean value of undercooling (ΔTm), at which the rate of increase in the number of growing grains with increasing undercooling increases more rapidly, and the standard deviation (ΔTσ).
With undercooling increasing, the number of activated nucleation substrates n, on which the primary austenite grains nucleate and grow, increases until maximum undercooling is reached before recalescence. The rate of nucleation with increasing undercooling is calculated based on the probability density function of the normal distribution as follows:
where nmax is the maximum number of heterogeneous nucleation substrates generated in the alloy as a result of the inoculation treatment.
The number of grains is calculated by integrating Equation (2) during the period of increasing undercooling to a maximum value. Increasing the temperature during recalescence, which causes a decrease in undercooling, terminates the nucleation.
The velocity of the interface migration at the dendrite grain tip () is calculated by the Kurz–Giovanola–Trivedi relation [36] as follows:
where a2 and a3 are growth kinetics coefficients.
The parameters of the nucleation equations that describe the kinetics and grain growth used in the simulation are summarized in Table 2.
Table 2.
Parameters of nucleation and growth kinetics law.
The parameter nmax, which determines the maximum number of substrates for heterogenic nucleation in alloys with technical purity levels, depends on the method of smelting and the subsequent ladle metallurgy processing of the liquid alloy. The goal of inoculation processing is to create more such substrates by introducing master alloys containing substances that form such substrates in greater quantities into the melt. Details of the applied treatment analyzed in this text will be presented below.
To evaluate the effect of the inoculation treatment on the number and size of primary austenite grains in the simulation, three different values of the nmax parameter were used.
The thermal solution using Finite Elements (FE) and a Cellular Automata (CA) technique for primary microstructure prediction is coupled by the source function term of Equation (1).
The initial alloy temperature was assumed to be 1400 °C, while the initial molding sand temperature was 20 °C. The density of the analyzed alloy used to simulate the temperature field by means of Equation (1) in the temperature range of 1200 to 1400 °C varies from 7180 kg/m3 to 6840 kg/m3. The corresponding changes in the thermal conductivity coefficient in the same range of temperature changes were 23,000 to 25,100 W/(m·K), and the changes in specific heat were 905 J/(kg·K) to 810 J/(kg·K).
2.3. Experimental Verification of Simulation Results
To verify the results of the simulation, chromium cast iron was melted. Melts were carried out at Odlewnie Polskie S.A. in Starachowice. A medium-frequency induction furnace with a capacity of 120 kg located in the Research and Development Centre of Foundry Components “OBRKO” was used for the tests. Plates with dimensions of 100 × 100 mm and thicknesses of 10, 20, 30 and 40 mm were cast. The appearance of the research casting is shown in Figure 2.
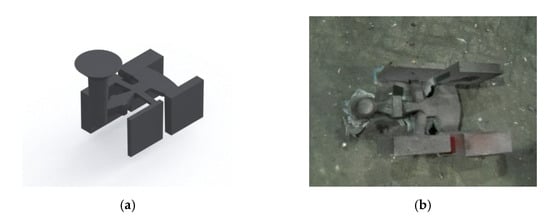
Figure 2.
(a) Model of the research casting; (b) the appearance of the casting immediately after removing the mold.
The EBSD microstructure analysis was performed for three thicknesses: 20, 30 and 40 mm. The chemical composition of the inoculated cast iron is presented in Table 3.
Table 3.
Chemical composition of hypoeutectic chromium cast iron, wt%.
From the cast plates, samples were cut for analysis on a scanning microscope with an EBSD detector as follows:
- -
- from a 40 mm plate, the center of the sample is 0.5 of the thickness of the plate;
- -
- from a 30 mm plate, the center of the sample is 0.18 of the thickness of the plate;
- -
- from a 20 mm plate, the center of the sample is 0.12 of the thickness of the plate.
Primary microstructure analysis was performed using a high-resolution scanning electron microscope FEI Quanta 3D FEGSEM with the EDAX Trident system (EDAX Genesis spectrometer, WDS Genesis LambdaSpec spectrometer and EBSD Genesis TSL back-scatter electron diffraction acquisition system) located in the Institute of Metallurgy and Materials Engineering, Polish Academy of Sciences in Kraków.
3. Simulation Results
The results of the simulation with a given number of nucleation sites from 109 to 1011 are shown in Figure 3, Figure 4 and Figure 5.
Figure 3.
Simulation results for a casting wall thickness of 20 mm with a given number of austenite nucleation sites in the amount of: (a)—109; (b)—1010; (c)—1011.
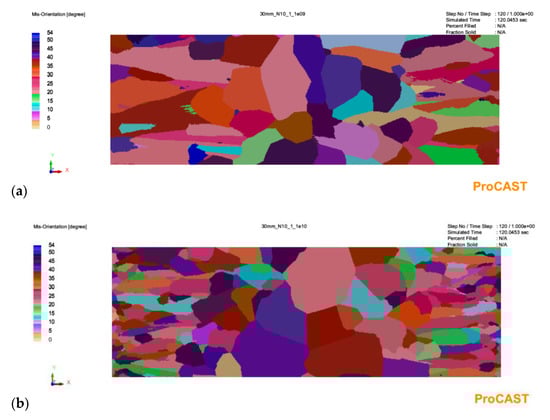
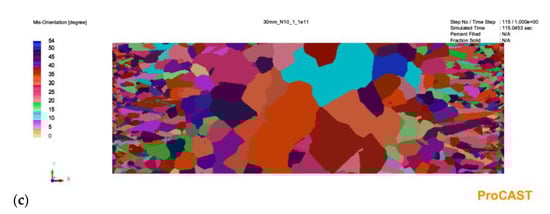
Figure 4.
Simulation results for a casting wall thickness of 30 mm with a given number of austenite nucleation sites in the amount of: (a)—109; (b)—1010; (c)—1011.
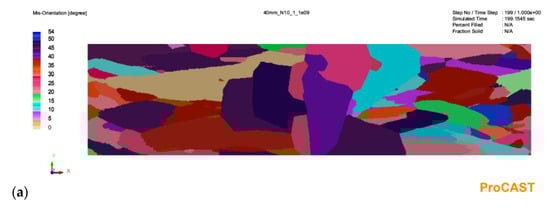
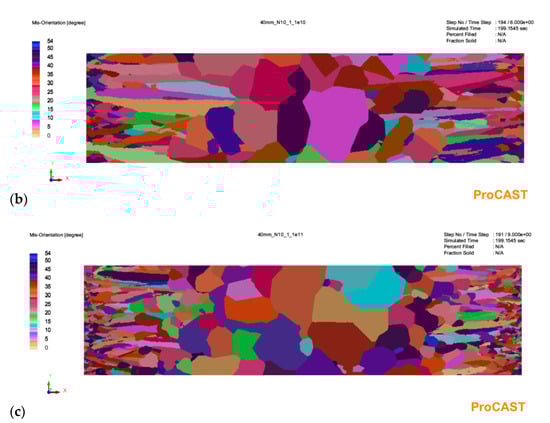
Figure 5.
Simulation results for a casting wall thickness of 40 mm with a given number of austenite nucleation sites in the amount of: (a)—109; (b)—1010; (c)—1011.
As can be seen in Figure 3, in the case of a 20 mm thick casting, increasing the number of substrates for heterogeneous nucleation in the analyzed range in the melt volume results in a decrease in grain size. However, it does not change the profile of the microstructure of the primary austenite grains. There are two areas of equiaxial grains and finer grains near the plate axis. For a 30 mm plate casting (Figure 4), increasing the number of substrates not only affects grain size but also causes qualitative changes. For the smallest number (109 m−3), there is no zone of equiaxial fine crystals near the casting surface. In this zone, columnar grain structure prevails. The depth of the zone of columnar grains is similar for each analyzed variant. Increasing the number of nucleation substrates results in a marked increase in the number of fine equiaxial grains near the casting surface (Figure 4b,c). The changes in the microstructure of the primary austenite grains for the plate castings look similar: the absence of equiaxial grains near the surface in Figure 5a and an increase in the number of fine equiaxial grains in Figure 5b,c.
4. Analysis of the Obtained Microstructures
The FEI Quanta 3D FEGSEM high-resolution scanning electron microscope was used for the analysis. Figure 6, Figure 7, Figure 8 and Figure 9 show the microstructure of chromium cast iron using light microscopy and characterize the structure of primary austenite using the EBSD technique in individual plates of variable thickness. The drawings show that the number of primary austenite grains changes with the change in casting wall thickness. The chromium carbide content is low and does not exceed 16% vol. During the calculations, the following assumptions were made so that spatial grain configurations followed the so-called Poisson–Voronoi model [19], as shown in Equations (4)–(6). For each sample, the number of primary austenite grains was calculated, and then the surface grain density NA (5) and the volumetric grain density NV (6) were calculated according to the formula. The calculation results are presented in Table 4 and Figure 10. However, the number of grains in a given area of the metallographic microsection N was calculated according to Formula (4) as follows:
where:
- N—number of grains in the area; NW—number of whole grains in the area; NP—number of grains cut by sides of the area; NR—number of grains in corners of the area; NA—surface grain density 1/mm2; P—area mm2; NV—volumetric grain density 1/mm3.

Figure 6.
Structure of chromium cast iron in a 20 mm thick plate. (a) light microscope; (b) EBSD.

Figure 7.
Structure of chromium cast iron in a 30 mm thick plate. (a) light microscope; (b) EBSD.

Figure 8.
Structure of chromium cast iron in a 40 mm thick plate. (a) light microscope; (b) EBSD.

Figure 9.
Phase and grain orientation scale.
Table 4.
Data and results for calculating numbers of NA and NV grains.
Table 4.
Data and results for calculating numbers of NA and NV grains.
| Sample | N | P | NA | NA | NV | |
|---|---|---|---|---|---|---|
| mm2 | 1/mm2 | 1/cm2 | 1/cm3 | |||
| 20 mm | E9 | 26 | 43.3063 | 0.6145 | 61.45 | 273.65 |
| E10 | 77.5 | 1.8318 | 183.18 | 1408.294 | ||
| E11 | 157.88 | 3.7318 | 373.18 | 4094.78 | ||
| EBSD | 164.6 | 3.8906 | 389.06 | 4358.98 | ||
| 30 mm | E9 | 7.5 | 14.033 | 0.5344 | 53.44 | 221.92 |
| E10 | 13 | 0.9263 | 92.63 | 506.44 | ||
| E11 | 24.5 | 1.7458 | 174.58 | 1310.29 | ||
| EBSD | 25 | 1.7815 | 178.15 | 1350.60 | ||
| 40 mm | E9 | 4.5 | 58.6762 | 0.0766 | 7.66 | 12.06 |
| E10 | 4.5 | 0.0766 | 7.66 | 12.06 | ||
| E11 | 6 | 0.1022 | 10.22 | 18.57 | ||
| EBSD | 7 | 0.1192 | 11.92 | 23.40 |

Figure 10.
Number of grains of primary austenite NA in the tested samples.
On the basis of the results, pictures of EBSD microstructures and simulation imaging were matched. The results are shown in Figure 11.
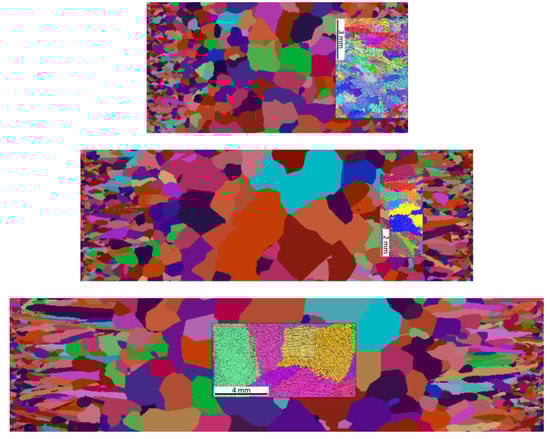
Figure 11.
Superimposed images from a cellular automaton simulation with actual EBSD images of the structure.
Research has shown that the use of cellular automaton simulation allows analysis of the number of primary austenite grains produced in the structure of a chrome cast iron casting. In addition, the images from the simulation clearly show a large influence of the casting wall thickness on its structure. The number of primary austenite grains at the edge of the wall increases significantly in relation to the central part of the casting. Therefore, the grain measurements made on the central surface of the casting are inadequate for the number of grains located on the edge of the casting.
5. Conclusions
- Simulation with a cellular automaton in the ProCAST program allows for predicting the number of primary austenite grains in chrome cast iron by controlling the number of nucleation sites on the cross-section of the casting.
- The number of grains determined by the ProCast simulation, after verifying it at selected points of the cross-section of the casting using the EBSD method, allows for faster determination of the number of grains than in the case of using only the EBSD method over the entire cross-sectional area of the casting.
Author Contributions
Methodology, D.K., E.G. and A.B.; Investigation, D.K., A.B. and A.S.; Writing—original draft, A.S.; Funding acquisition, E.G. All authors have read and agreed to the published version of the manuscript.
Funding
This research received no external funding.
Institutional Review Board Statement
Not applicable.
Informed Consent Statement
Not applicable.
Data Availability Statement
Not applicable.
Conflicts of Interest
The authors declare no conflict of interest.
References
- Andersson, J.O. A thermodynamic evaluation of the Fe-Cr-C system. Metall. Trans. A 1988, 19, 627–636. [Google Scholar] [CrossRef]
- Laird, G. Some Comments of White Cast Iron Microstructures and Wear Properties. AFS Trans. 1993, 101, 497–504. [Google Scholar]
- Siekaniec, D.; Kopyciński, D.; Guzik, E.; Szczęsny, A. Effect of inoculation treatment on number of primary austenite grains in hypoeutectic chromium cast iron: EBSD imaging and mathematical structure prediction. Materials 2022, 15, 6318. [Google Scholar] [CrossRef]
- Siekaniec, D.; Kopyciński, D.; Tyrała, E.; Guzik, E.; Szczęsny, A. Optimisation of solidification structure and properties of hypoeutectic chromium cast iron. Materials 2022, 15, 6243. [Google Scholar] [CrossRef]
- Dojka, M.; Kondracki, M.; Studnicki, A.; Dojka, R. Crystallization process of high chromium cast iron with the addition of Ti and Sr. Arch. Foundry Eng. 2018, 18, 57–64. [Google Scholar]
- Dojka, M.; Dojka, R.; Stawarz, M.; Studnicki, A. Influence of Ti and REE on Primary Crystallization and Wear Resistance of Chromium Cast Iron. J. Mater. Eng. Perform. 2019, 28, 4002–4011. [Google Scholar] [CrossRef]
- Bedolla-Jacuinde, A.; Guerra, F.V.; Guerrero-Pastran, A.J.; Sierra-Cetina, M.A.; Valdez-Medina, S. Microstructural effect and wear performance of high chromium white cast iron modified with high boron contents. Wear 2021, 476, 203675. [Google Scholar] [CrossRef]
- Pourasiabi, H.; Gates, J.D. Effects of niobium macro-additions to high chromium white cast iron on microstructure, hardness and abrasive wear behaviour. Mater. Des. 2021, 212, 110261. [Google Scholar] [CrossRef]
- Jia, R.N.; Tu, T.Q.; Zheng, K.H.; Jiao, Z.B.; Luo, Z.C. Abrasive wear behavior of TiC-strengthened eutectic high chromium cast iron composites. Mater. Today Commun. 2021, 29, 102906. [Google Scholar] [CrossRef]
- Sanchez-Cruz, A.; Bedolla-Jacuinde, A.; Guerra, F.V.; Mejía, I. Microstructural modification of a static and dynamically solidified high chromium white cast iron alloyed with vanadium. Results Mater. 2020, 7, 100–114. [Google Scholar] [CrossRef]
- Bedolla-Jacuinde, A. Microstructure of vanadium-, niobium- and titanium-alloyed high-chromium white cast irons. Int. J. Cast Met. Res. 2001, 13, 343–361. [Google Scholar] [CrossRef]
- Zhi, X.; Xing, J.; Fu, H.; Gao, Y. Effect of titanium on the as-cast microstructure of hypereutectic high chromium cast iron. Mater. Charact. 2008, 59, 1221–1226. [Google Scholar] [CrossRef]
- Bedolla-Jacuinde, A.; Correa, R.; Quezada, J.G.; Maldonado, C. Effect of titanium on the as-cast microstructure of a 16%chromium white iron. Mater. Sci. Eng. A 2005, 398, 297–308. [Google Scholar] [CrossRef]
- Bedolla-Jacuinde, A.; Aguilar, S.L.; Hernández, B. Eutectic Modification in a Low-Chromium White Cast Iron by a Mixture of Titanium, Rare Earths, and Bismuth: I. Effect on Microstructure. J. Mater. Eng. Perform. 2005, 14, 149–157. [Google Scholar] [CrossRef]
- Da Silva, A.E.; de Melo, I.N.R.; Pinheiro, I.P.; da Silva, L.P. Characterisation and machinability of high chromium hardened white cast iron with and without the addition of niobium. Wear 2020, 460, 203463. [Google Scholar] [CrossRef]
- Lv, Y.; Sun, Y.; Zhao, J.; Yu, G.; Shen, J.; Hu, S. Effect of tungsten on microstructure and properties of high chromium cast iron. Mater. Des. 2012, 39, 303–308. [Google Scholar] [CrossRef]
- Zhang, Y.; Sun, Y.F.; Guan, S.; Deng, X.; Yan, X. Effect of titanium and tungsten on the structure and properties of heat-abrasion resistant steel. Mater. Sci. Eng. A 2008, 478, 214–220. [Google Scholar] [CrossRef]
- Mousavi Anijdan, S.H.; Bahrami, A.; Varahram, N.; Davami, P. Effects of tungsten on erosion-corrosion behavior of high chromium white cast iron. Mater. Sci. Eng. A 2007, 454, 623–628. [Google Scholar] [CrossRef]
- Ohser, J.; Lorz, U. Quantitative Gefgeanalyse; DVG: Leipzig/Stuttgart, Germany, 1994. [Google Scholar]
- Catalina, A.V.; Burbelko, A.; Kapturkiewicz, W.; Zhu, M. Computational models for prediction of solidification microstructure. In Handbook Volume 1A, Cast Iron Science and Technology; ASM International: Novelty, OH, USA, 2017; pp. 94–105. [Google Scholar]
- Burbelko, A.; Kapturkiewicz, W. Undercooling, cooling, curves and nodule count for hypo-, hyper- and eutectic thin-walled ductile iron castings. In Proceedings of the Advances in the Science and Engineering of Casting Solidification, Orlando, FL, USA, 15–19 March 2015; John Wiley & Sons: Hoboken, NJ, USA, 2015; pp. 313–321. [Google Scholar]
- Wróbel, M.; Burbelko, A.; Gurgul, D. Modelling of change in density of nodular cast iron during solidification using cellular automation. Arch. Metall. Mater. 2015, 60, 2709–2713. [Google Scholar] [CrossRef]
- Burbelko, A.; Fraś, E.; Gurgul, D.; Kapturkiewicz, W.; Sikora, J. Simulation of the Ductile Iron Solidification Using a Cellular Automaton. Key Eng. Mater. 2010, 457, 330–336. [Google Scholar] [CrossRef]
- Zhu, M.F.; Zhang, L.; Zhao, H.L.; Stefanescu, D.M. Modeling of microstructural evolution during divorced eutectic solidification of spheroidal graphite irons. Acta Mater. 2014, 84, 413–425. [Google Scholar] [CrossRef]
- Stefanescu, D.M. Modeling of cast iron solidification—The defining moments. Metall. Mater. Trans. A 2005, 7, 1433–1447. [Google Scholar] [CrossRef]
- Zhang, L.; Zhao, H.L.; Zhu, M.F. Simulation of solidification microstructure of spheroidal graphite cast iron using a cellular automation method. Acta Metall. Sin. 2015, 51, 148–158. [Google Scholar]
- Guillemot, G.; Gandin, C.A.; Bellet, M. Interaction between single grain solidification and macro segregation: Application of a cellular automaton—Finite element model. J. Cryst. Growth 2007, 303, 58–68. [Google Scholar] [CrossRef]
- Carozzani, T.; Digonnet, H.; Gandin, C.-A. 3D CAFE modeling of grain structures: Application to primary dendritic and secondary eutectic solidification. Model. Simul. Mater. Sci. Eng. 2012, 20, 015010. [Google Scholar] [CrossRef]
- Liu, D.R.; Mangelinck-Noe, N.; Gandin, C.-A.; Zimmermann, G.; Sturz, L.; Nguyen-Thi, H.; Billia, H. Simulation of directional solidification of refined Al–7 wt.%Si alloys—Comparison with benchmark microgravity experiments. Acta Mater. 2015, 93, 24–37. [Google Scholar] [CrossRef]
- Liu, D.R.; Reinhart, G.; Mangelinck-Noel, N.; Gandin, C.-A.; Nguyen-Thi, H.; Billia, H. Coupled Cellular Automaton (CA)—Finite Element (FE) Modeling of Directional Solidification of Al-3.5 wt% Ni Alloy: A Comparison with X-ray Synchrotron Observations. ISIJ Int. 2014, 54, 392–400. [Google Scholar] [CrossRef]
- Bobadilla, M.; Lacaze, J.; Lesoult, G. Influence des conditions de solidification sur le déroulement de la solidification des aciers inoxydables austénitiques. J. Cryst. Growth 1988, 89, 531–544. [Google Scholar] [CrossRef]
- Rappaz, M.; Gandin, C.-A. Probabilistic modelling of microstructure formation in solidification processes. Acta Metall. Mater. 1993, 41, 345–360. [Google Scholar] [CrossRef]
- Gandin, C.A.; Rappaz, M. A coupled Finite Element-Cellular Automaton model for the prediction of dendritic grain structures in solidification processes. Acta Metall. Mater. 1994, 42, 2233–2246. [Google Scholar] [CrossRef]
- Rappaz, M.; Gandin, C.A.; Desbiolles, J.L.; Thevoz, P. Prediction of Grain Structures in Various Solidification Processes. Metall. Mater. Trans. A 1996, 27, 695–705. [Google Scholar] [CrossRef]
- Gandin, C.A.; Desbiolles, J.L.; Rappaz, M.; Thevoz, P. A Three-Dimensional Cellular Automaton-Finite Element Model for the Prediction of Solidification Grain Structures. Metall. Mater. Trans. A 1999, 30, 3153–3165. [Google Scholar] [CrossRef]
- Kurz, W.; Giovanola, B.; Trivedi, R. Theory of microstructural development during rapid solidification. Acta Metall. 1986, 34, 823–830. [Google Scholar] [CrossRef]
Disclaimer/Publisher’s Note: The statements, opinions and data contained in all publications are solely those of the individual author(s) and contributor(s) and not of MDPI and/or the editor(s). MDPI and/or the editor(s) disclaim responsibility for any injury to people or property resulting from any ideas, methods, instructions or products referred to in the content. |
© 2023 by the authors. Licensee MDPI, Basel, Switzerland. This article is an open access article distributed under the terms and conditions of the Creative Commons Attribution (CC BY) license (https://creativecommons.org/licenses/by/4.0/).