

Stress Relaxation Behaviour Modeling in Rigid Polyurethane (PU) Elastomeric Materials
 ,
,  , , ,
, , ,  , ,
, ,  ,
,  and
and
Abstract
:1. Introduction
2. Materials and Methods
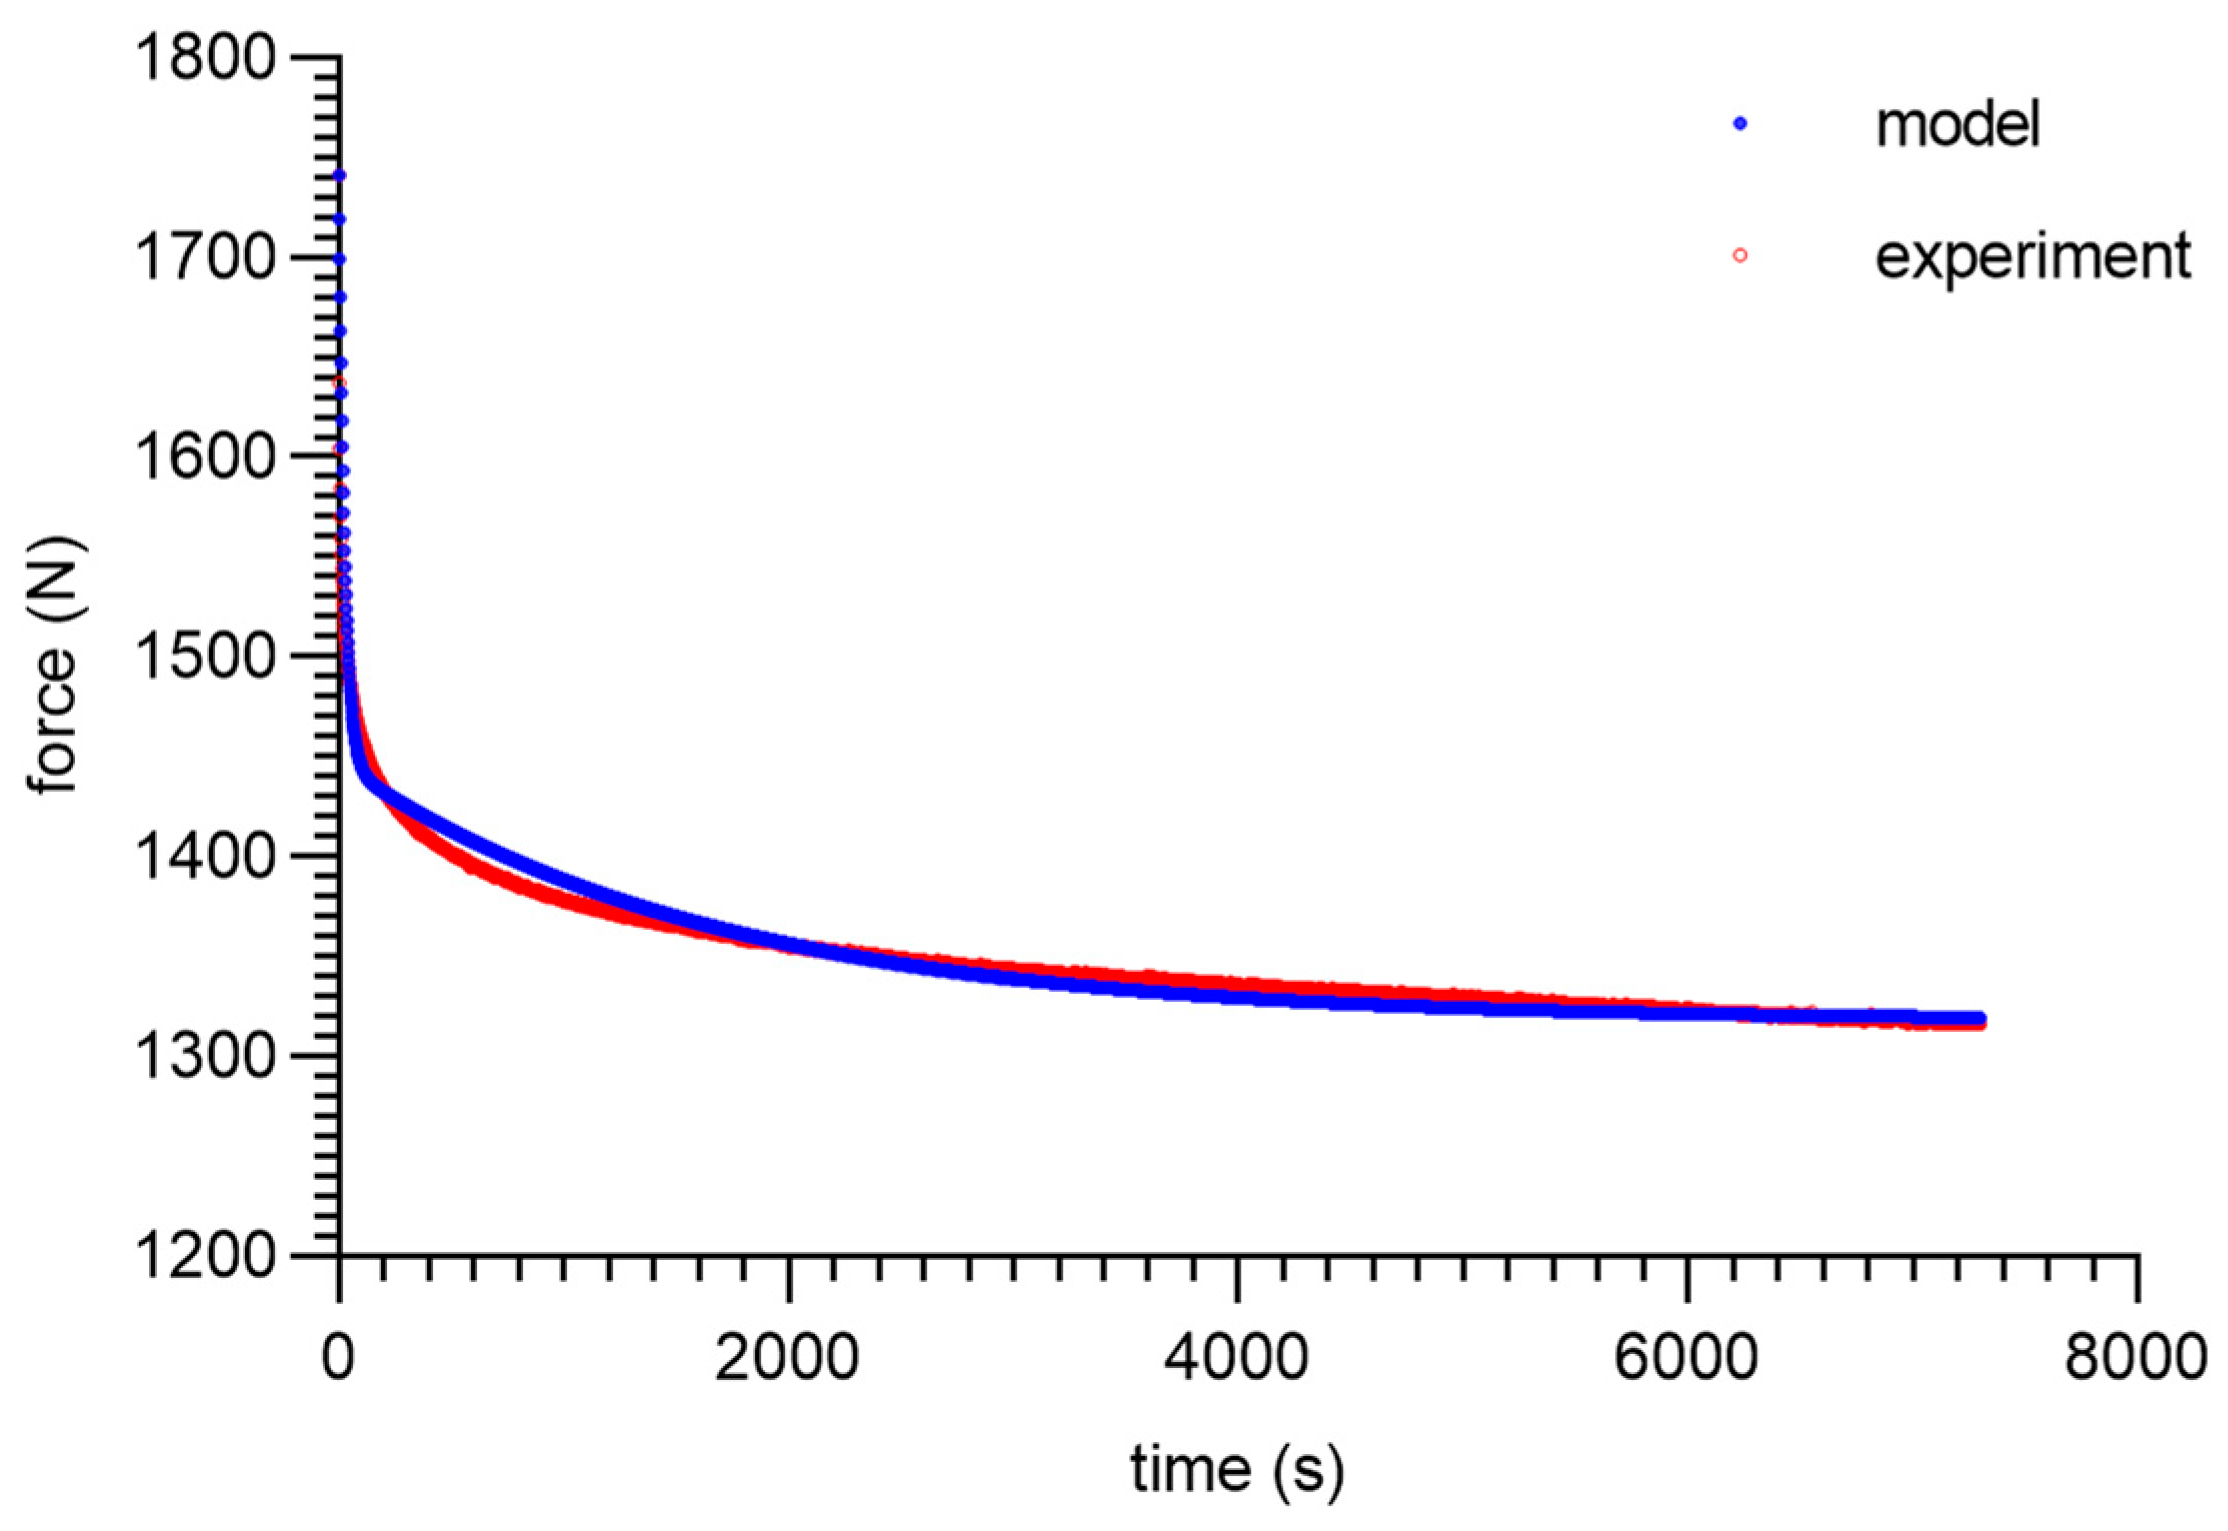
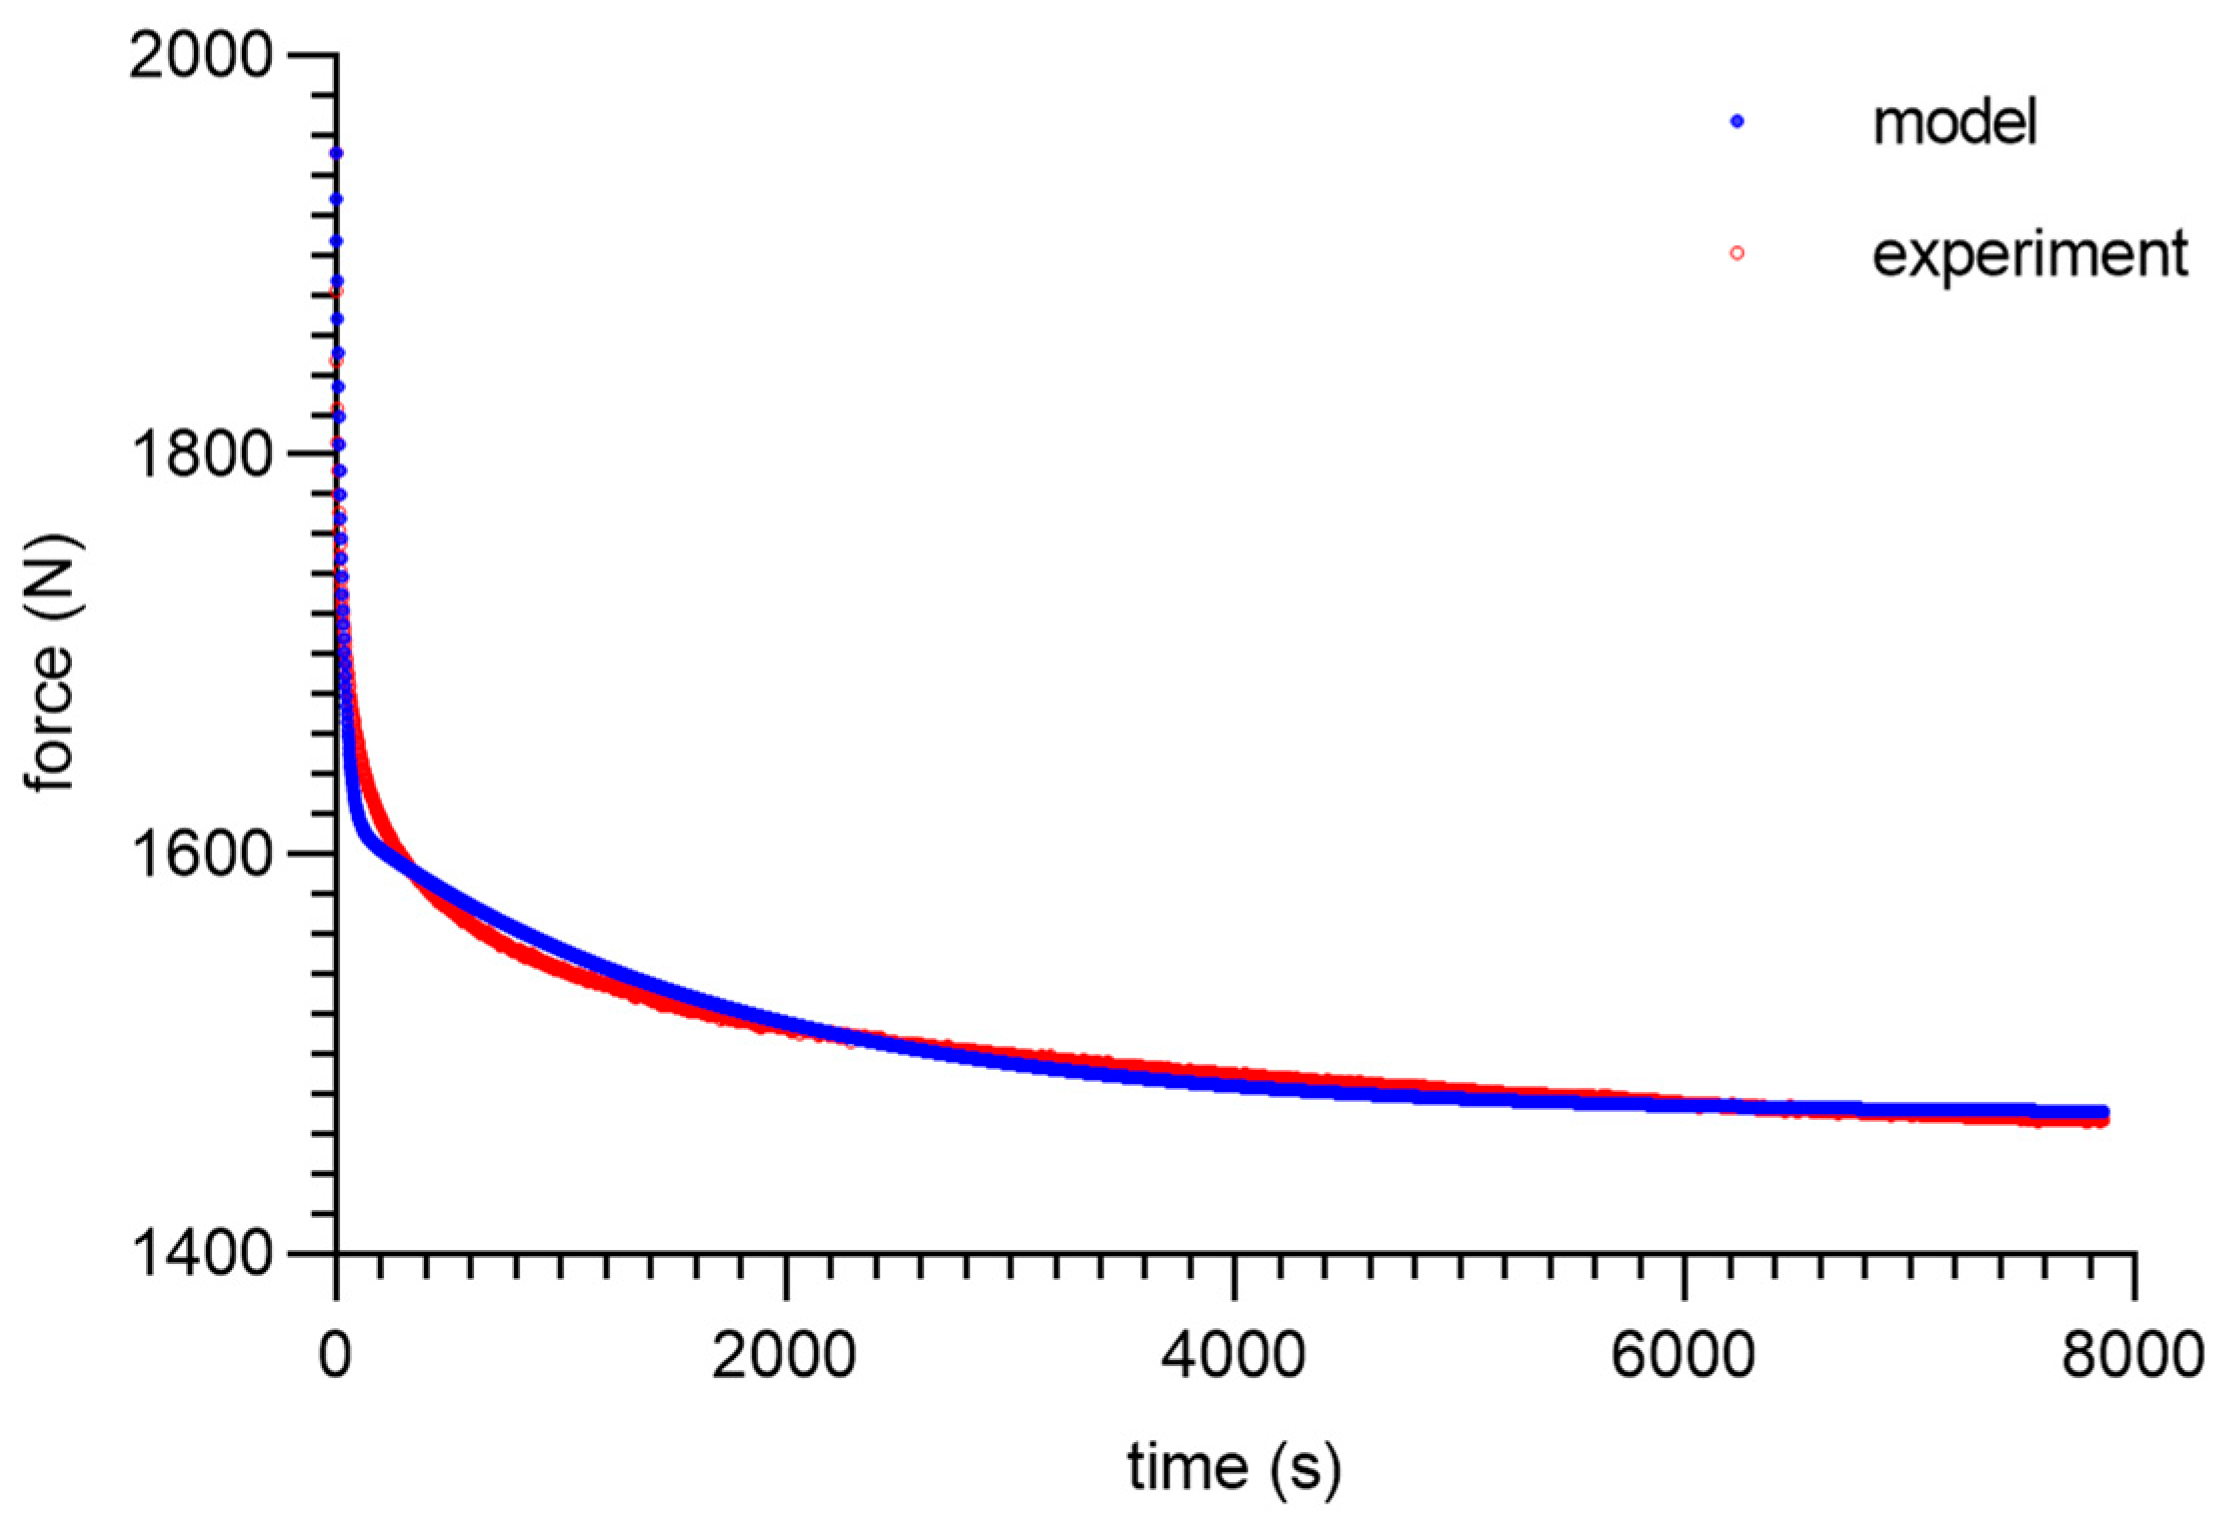
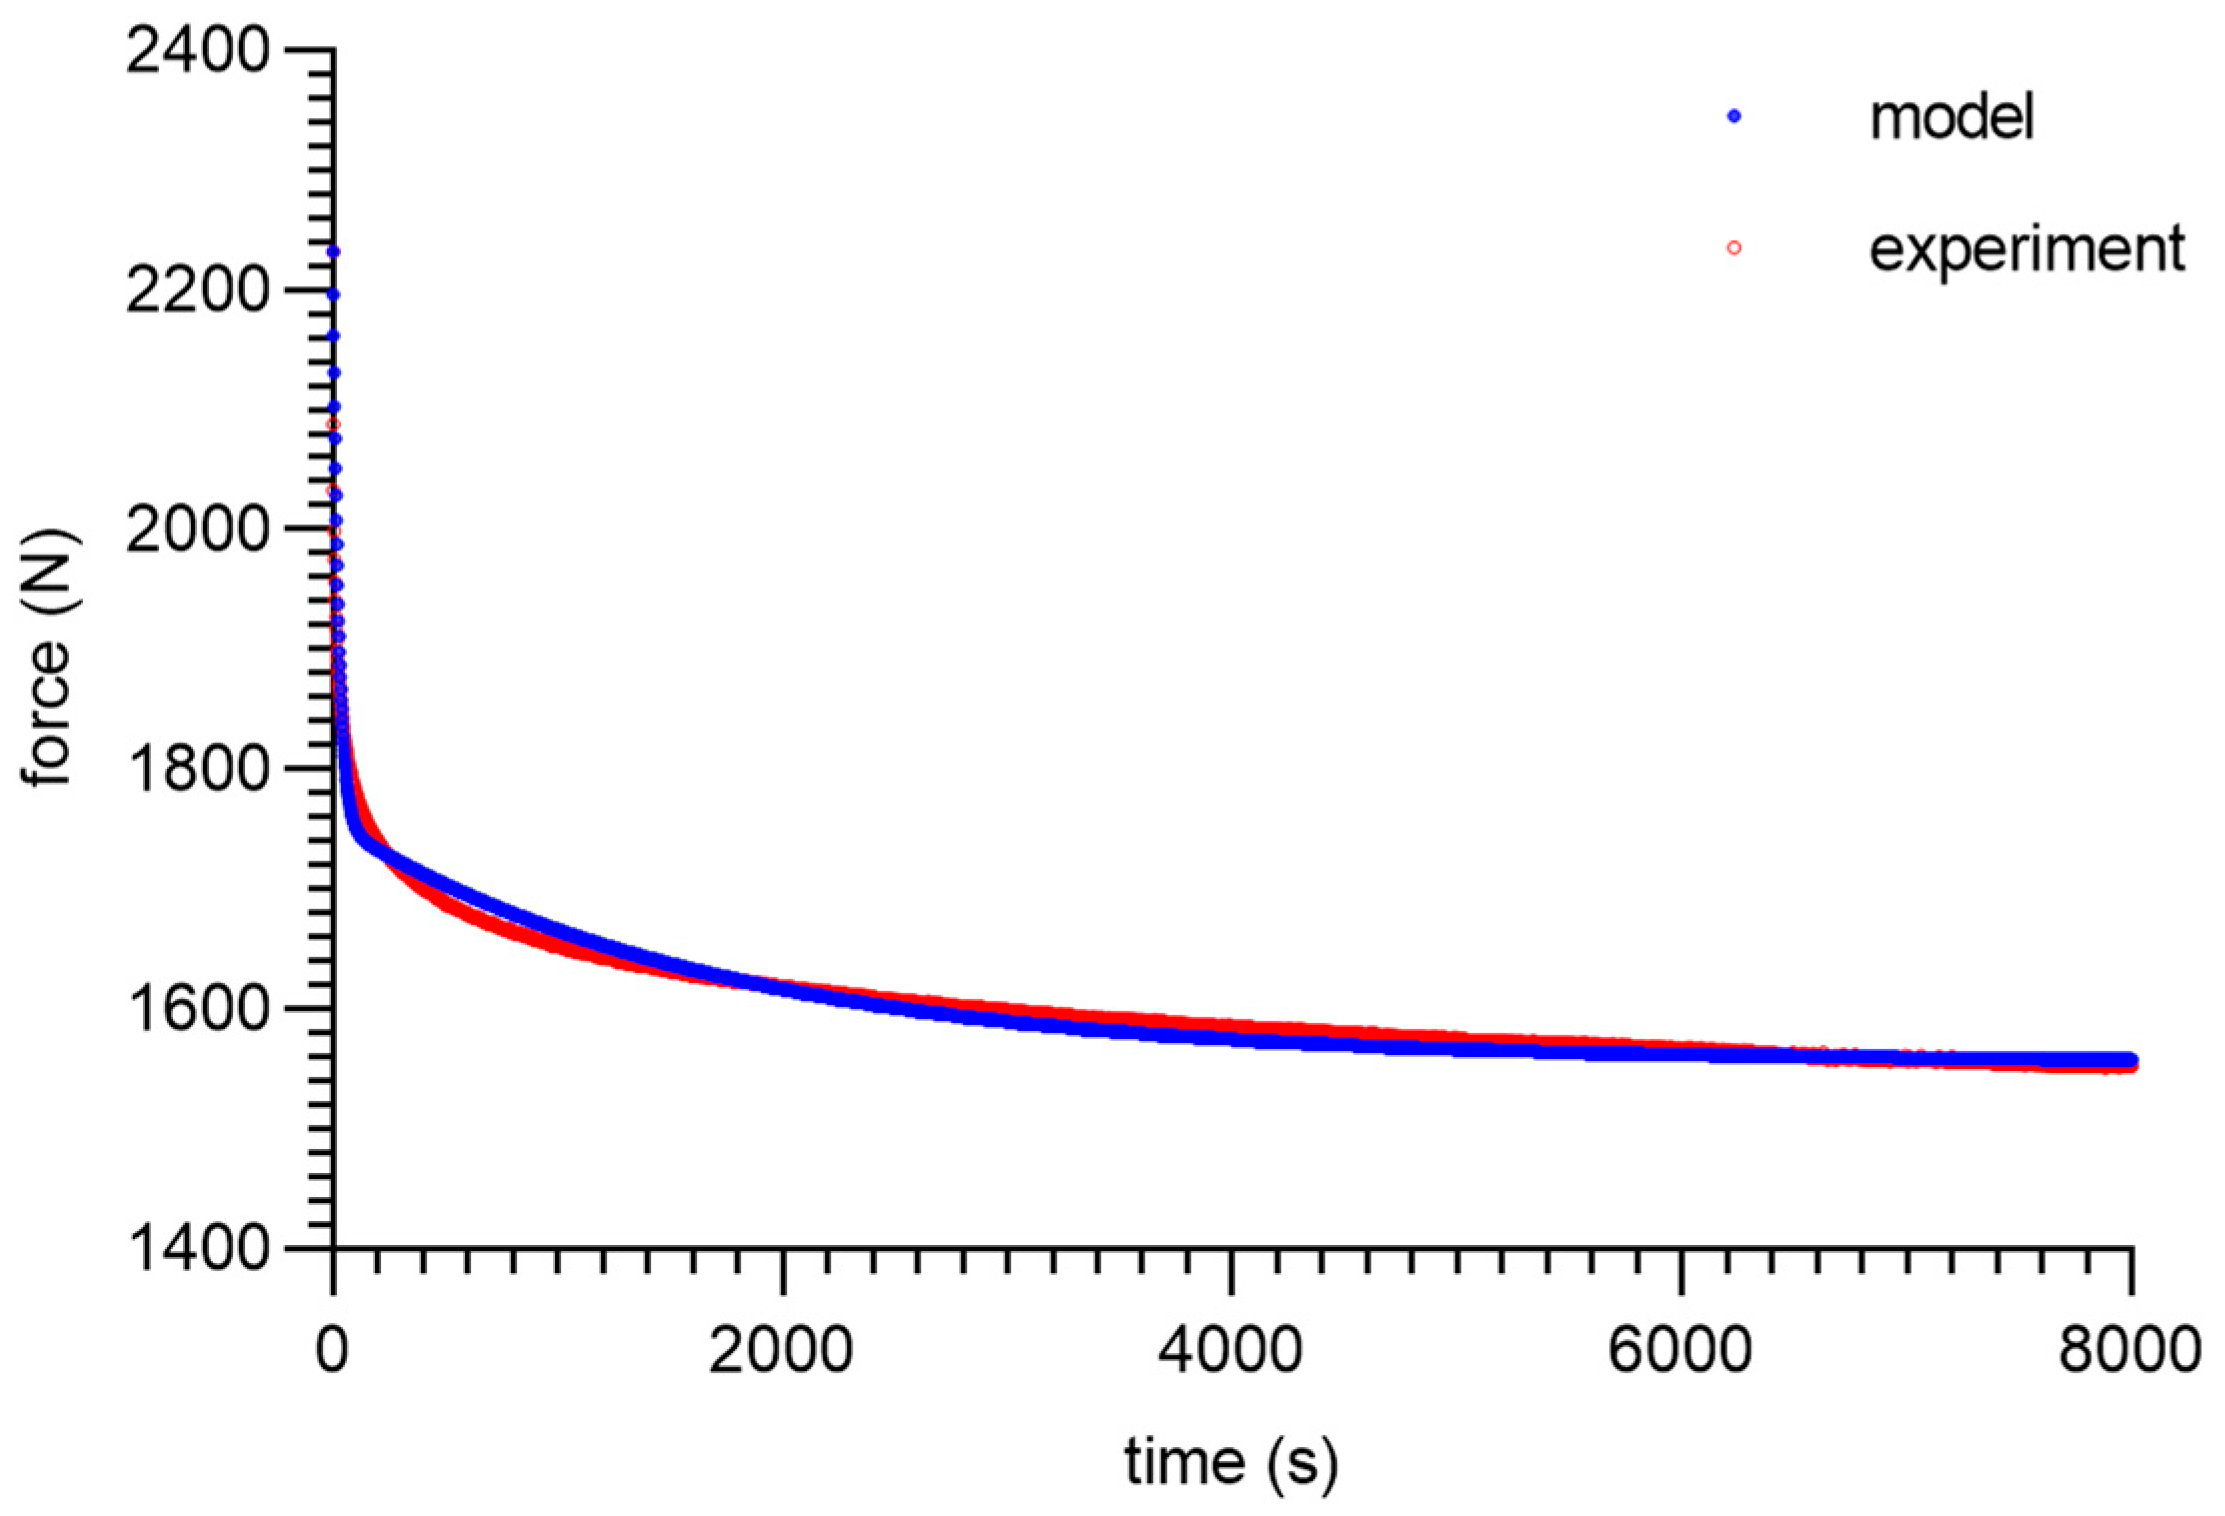
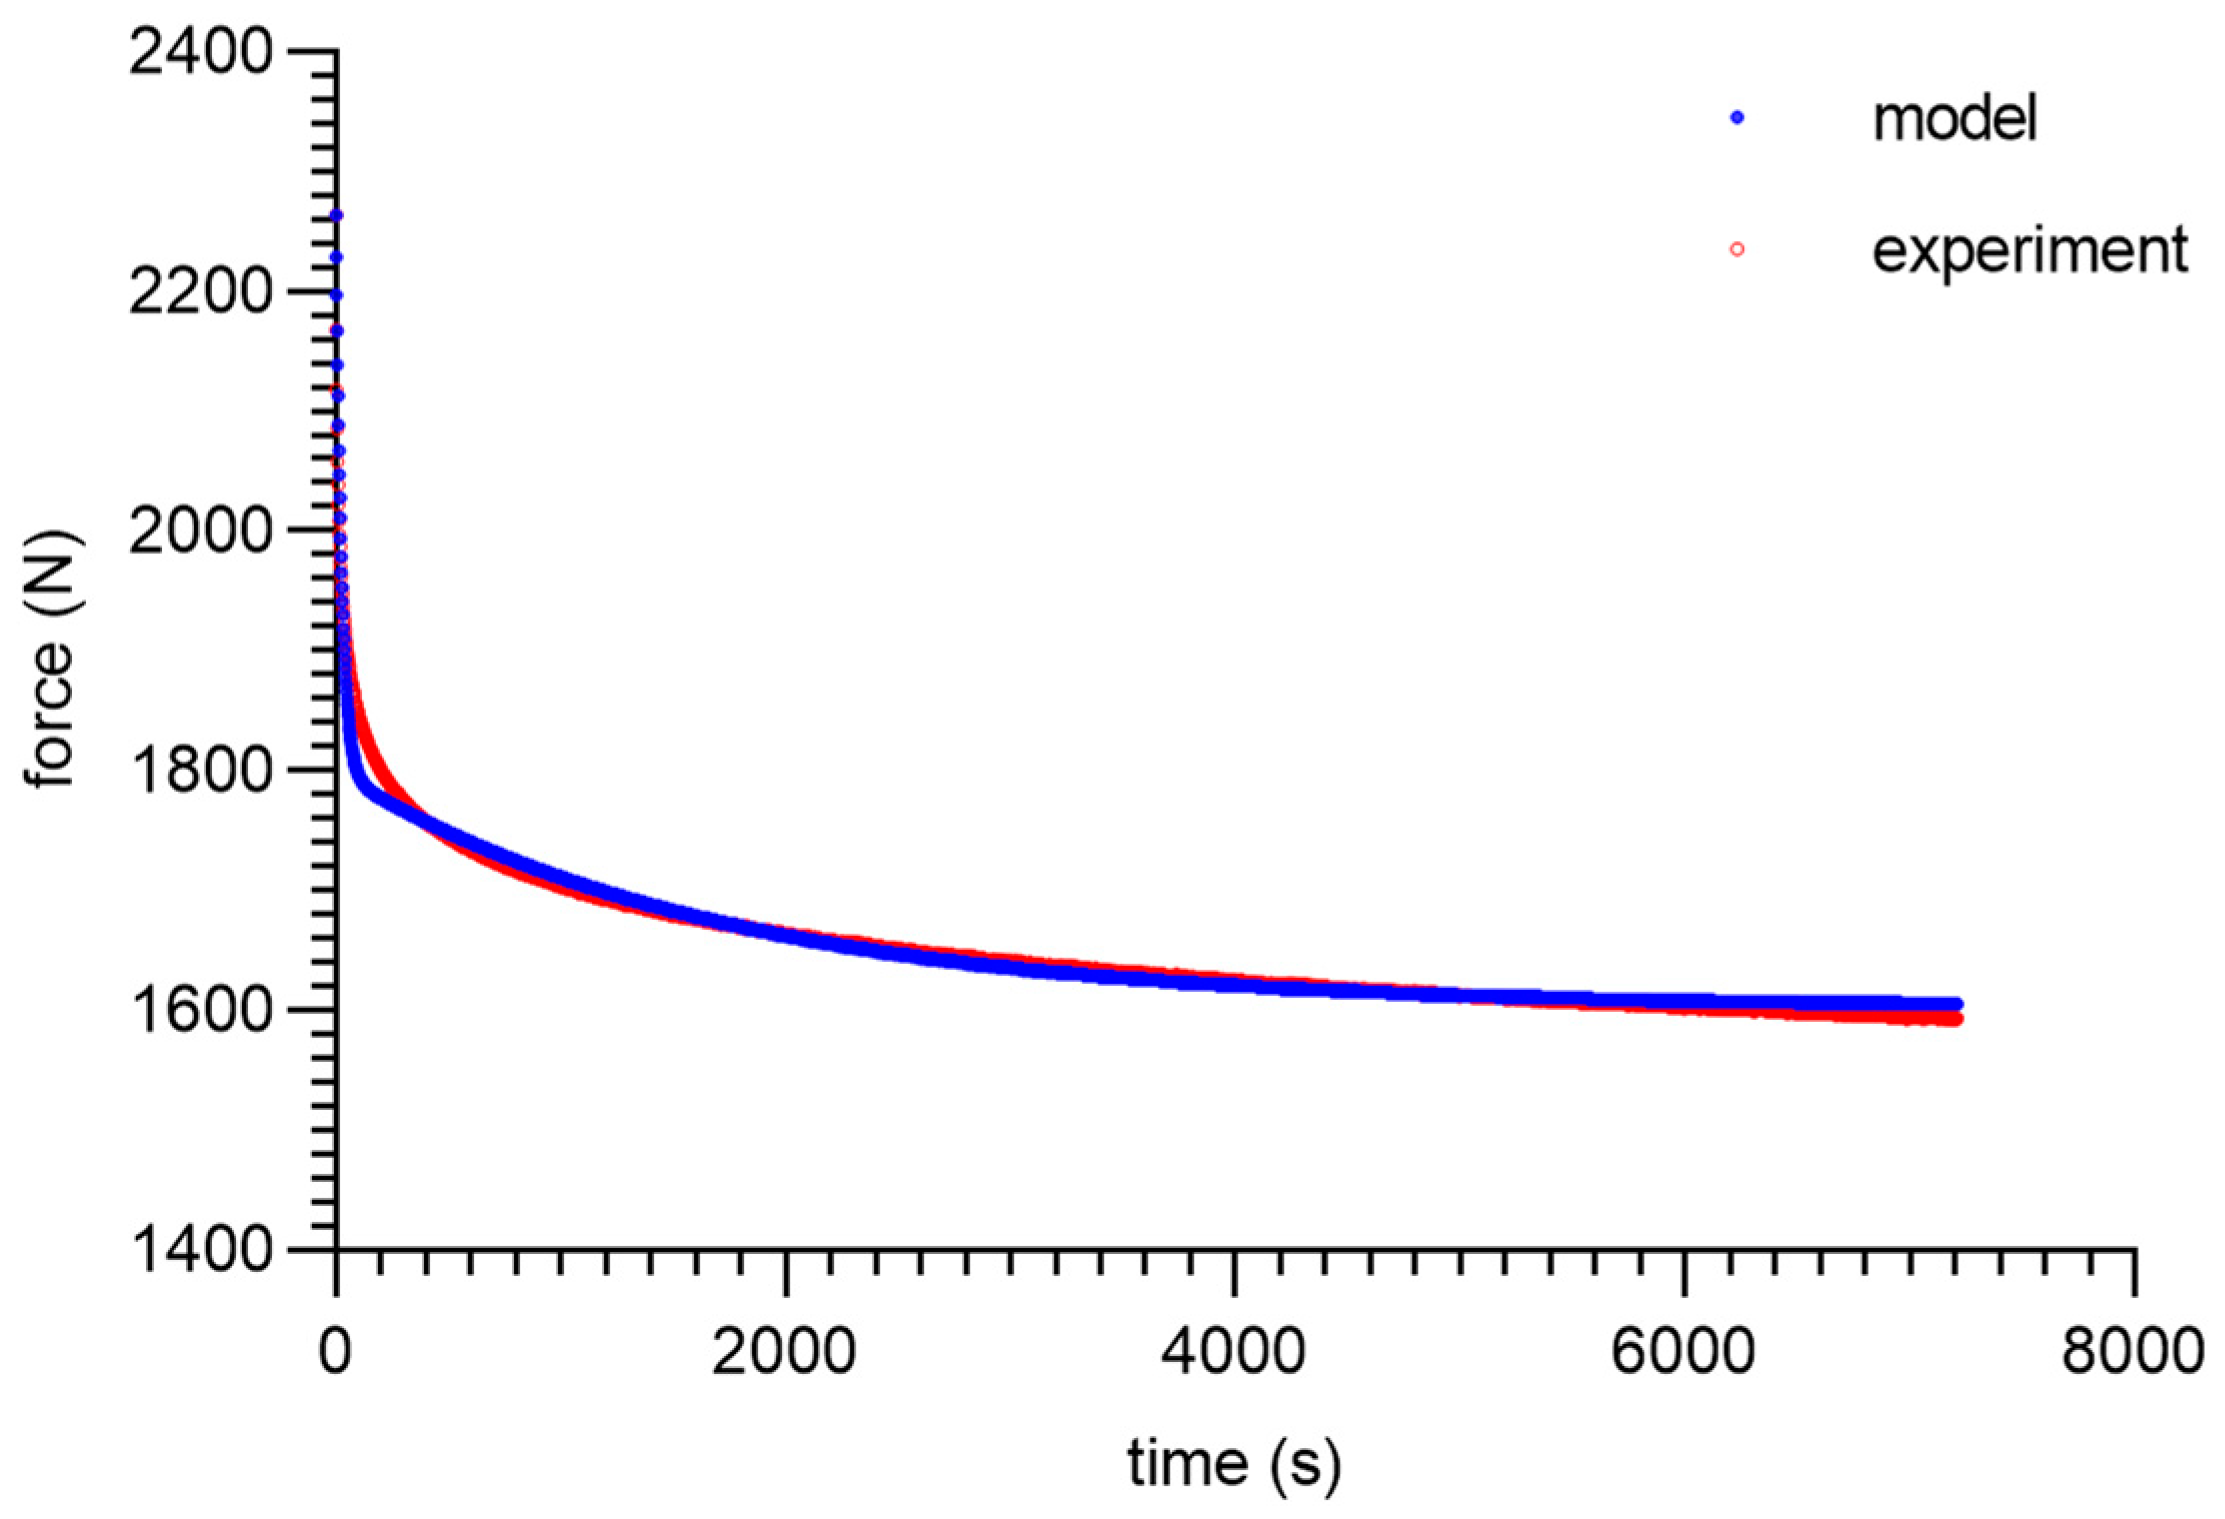
3. Modeling and Experimental Results
- E—elastic constant (such as Young’s modulus);
- η—the ratio of the viscosity;
- ε—applied strain;
- σ—stress;
- t—time.
- E0, E1, E2, η1, and η2 are model parameters.
- Dt represents differentiation operator.
- ε0—strain for t0 = 0, where H(t) represents Heaviside’s function.
4. Discussion
5. Conclusions
Author Contributions
Funding
Institutional Review Board Statement
Informed Consent Statement
Data Availability Statement
Acknowledgments
Conflicts of Interest
References
- Bayer, O. Das Di-Isocyanat-Polyadditionsverfahren (Polyurethane). Angew. Chem. 1947, 59, 257–272. [Google Scholar] [CrossRef]
- Trzebiatowska, P.J.; Echart, A.S.; Calvo-Correas, T.; Eceiza, A.; Datta, J. The changes of crosslink density of polyurethanes synthesised with using recycled component. Chemical structure and mechanical properties investigations. Prog. Org. Coat. 2018, 115, 41–48. [Google Scholar] [CrossRef]
- Kojio, K.; Nozaki, S.; Takahara, A.; Yamasaki, S. Influence of chemical structure of hard segments on physical properties of polyurethane elastomers: A review. J. Polym. Res. 2020, 27, 1–13. [Google Scholar] [CrossRef]
- Engels, H.W.; Pirkl, H.G.; Albers, R.; Albach, R.W.; Krause, J.; Hoffmann, A.; Casselmann, H.; Dormish, J. Polyurethanes: Versatile materials and sustainable problem solvers for today’s challenges. J. Ger. Chem. Soc. 2013, 52, 9422–9441. [Google Scholar] [CrossRef] [PubMed]
- Berezkin, Y.; Urick, M. Modern Polyurethanes: Overview of structure property relationship. In Polymers for Personal Care and Cosmetics; ACS Publication: Washington, DC, USA, 2013; pp. 65–81. [Google Scholar]
- Tian, S. Recent advances in functional polyurethane and its application in leather manufacture: A Review. Polymers 2020, 12, 1996. [Google Scholar] [CrossRef]
- Li, B.; Zhao, Y.; Liu, G.; Li, X.; Luo, Y. Mechanical properties and thermal decomposition of PBAMO/GAP random block ETPE. J. Therm. Anal. Calorim. 2016, 126, 717–724. [Google Scholar] [CrossRef]
- Zhang, C.; Li, J.; Luo, Y. Synthesis and characterization of 3,3′-bisazidomethyl oxetane-3-azidomethyl-3′-methyl oxetane alternative block energetic thermoplastic elastomer. Propellants Explos. Pyrotech. 2012, 37, 235–240. [Google Scholar] [CrossRef]
- Eroglu, M.S.; Guven, O. Characterization of network structure of poly(glycidyl azide) elastomers by swelling, solubility and mechanical measurements. Polymer 1998, 39, 1173–1176. [Google Scholar] [CrossRef]
- Chen, H.M.; Li, X.P.; Chen, J.; He, X.D.; Huang, W.M.; Zhu, K.; Yu, W.H.; Ni, H.L.; Zhao, K.Q.; Hu, P. Unified method to prepare thermoplastic/thermoset soft polyurethanes reshape-able around room temperature on-demand. J. Polym. Res. 2021, 28, 201. [Google Scholar] [CrossRef]
- Meiorin, C.; Calvo-Correas, T.; Mosiewicki, M.A.; Aranguren, M.I.; Corcuera, M.A.; Eceiza, A. Comparative effects of two different crosslinkers on the properties of vegetable oil-based polyurethanes. J. Appl. Polym. Sci. 2019, 137, 48741. [Google Scholar] [CrossRef]
- Gent, A.N. Relaxation processes in vulcanized rubber. I. Relation among stress relaxation, creep, recovery, and hysteresis. J. Appl. Polym. Sci. 1962, 6, 433–441. [Google Scholar] [CrossRef]
- Murata, H. Rheology-Theory and Application to Biomaterials. In Polymerization; Gomes, A.D.S., Ed.; IntechOpen: London, UK, 2012. [Google Scholar]
- Larson, R.G. The rheology of dilute solutions of flexible polymers: Progress and problems. J. Rheol. 2005, 49, 1–70. [Google Scholar] [CrossRef]
- Puyvelde, P.V.; Velankar, P.; Moldenaers, P. Rheology and morphology of compatibilized polymer blends. Curr. Opin. Colloid Interface Sci. 2001, 6, 457–463. [Google Scholar] [CrossRef]
- Ruymbeke, V.E.; Bailly, C.; Keunings, R.; Vlassopoulos, D. A General methodology to predict the linear rheology of branched polymers. Macromolecules 2006, 39, 6248–6259. [Google Scholar] [CrossRef]
- Burgaz, E.; Gencoglu, O.; Goksuzoglu, M. Carbon black reinforced natural rubber/butadiene rubber and natural rubber/butadiene rubber/styrene-butadiene rubber composites: Part I: Rheological, mechanical and thermomechanical properties. Res. Eng. Struct. Mater. 2019, 5, 233. [Google Scholar] [CrossRef]
- Bhattacharya, B.A.; Chatterjee, T.; Naskar, K. Automotive applications of thermoplastic vulcanizates. J. Appl. Polym. Sci. 2020, 137, 49181. [Google Scholar] [CrossRef]
- Leblanc, J.L. Rubber–Filler interactions and rheological properties in filled compounds. Prog. Polym. Sci. 2022, 27, 627–687. [Google Scholar] [CrossRef]
- Pole, S. Constitutive Modeling of the Rheological Behavior of Rubber Compounds and Plastic Composites. Doctoral Dissertation, The University of Akron, Akron, OH, USA, 2019. [Google Scholar]
- Ghahfarokhi, Z.M.; Zand, M.M.; Salmani-Tehrani, M. Proposing a new nonlinear hyperviscoelastic constitutive model to describe uniaxial compression behavior and dependence of stress-relaxation response on strain levels for isotropic tissue-equivalent material. Sci. Iran. 2019, 26, 3262–3270. [Google Scholar]
- Socha, T.; Kula, K.; Denisiewicz, A.; Lesiuk, G.; Błażejewski, W. Rheological relaxation of OSB beams reinforced with CFRP composites. Materials 2021, 14, 7527. [Google Scholar] [CrossRef]
- Laity, P.R.; Taylor, J.E.; Wong, S.S.; Khunkamchoo, P.; Cable, M.; Andrews, G.T.; Johnson, A.F.; Cameron, R.E. The effect of polyurethane composition and processing history on mechanical properties. J. Macromol. Sci. 2005, 2, 261–287. [Google Scholar] [CrossRef]
- Junik, K.; Lesiuk, G.; Duda, S.; Jamroziak, K.; Błażejewski, W.; Zielonka, P.; Socha, T.; Denisiewicz, A.; Kula, K.; Szczurek, A. Constitutive law identification and fatigue characterization of rigid PUR elastomers 80 ShA and 90 ShA. Materials 2022, 15, 6745. [Google Scholar] [CrossRef] [PubMed]


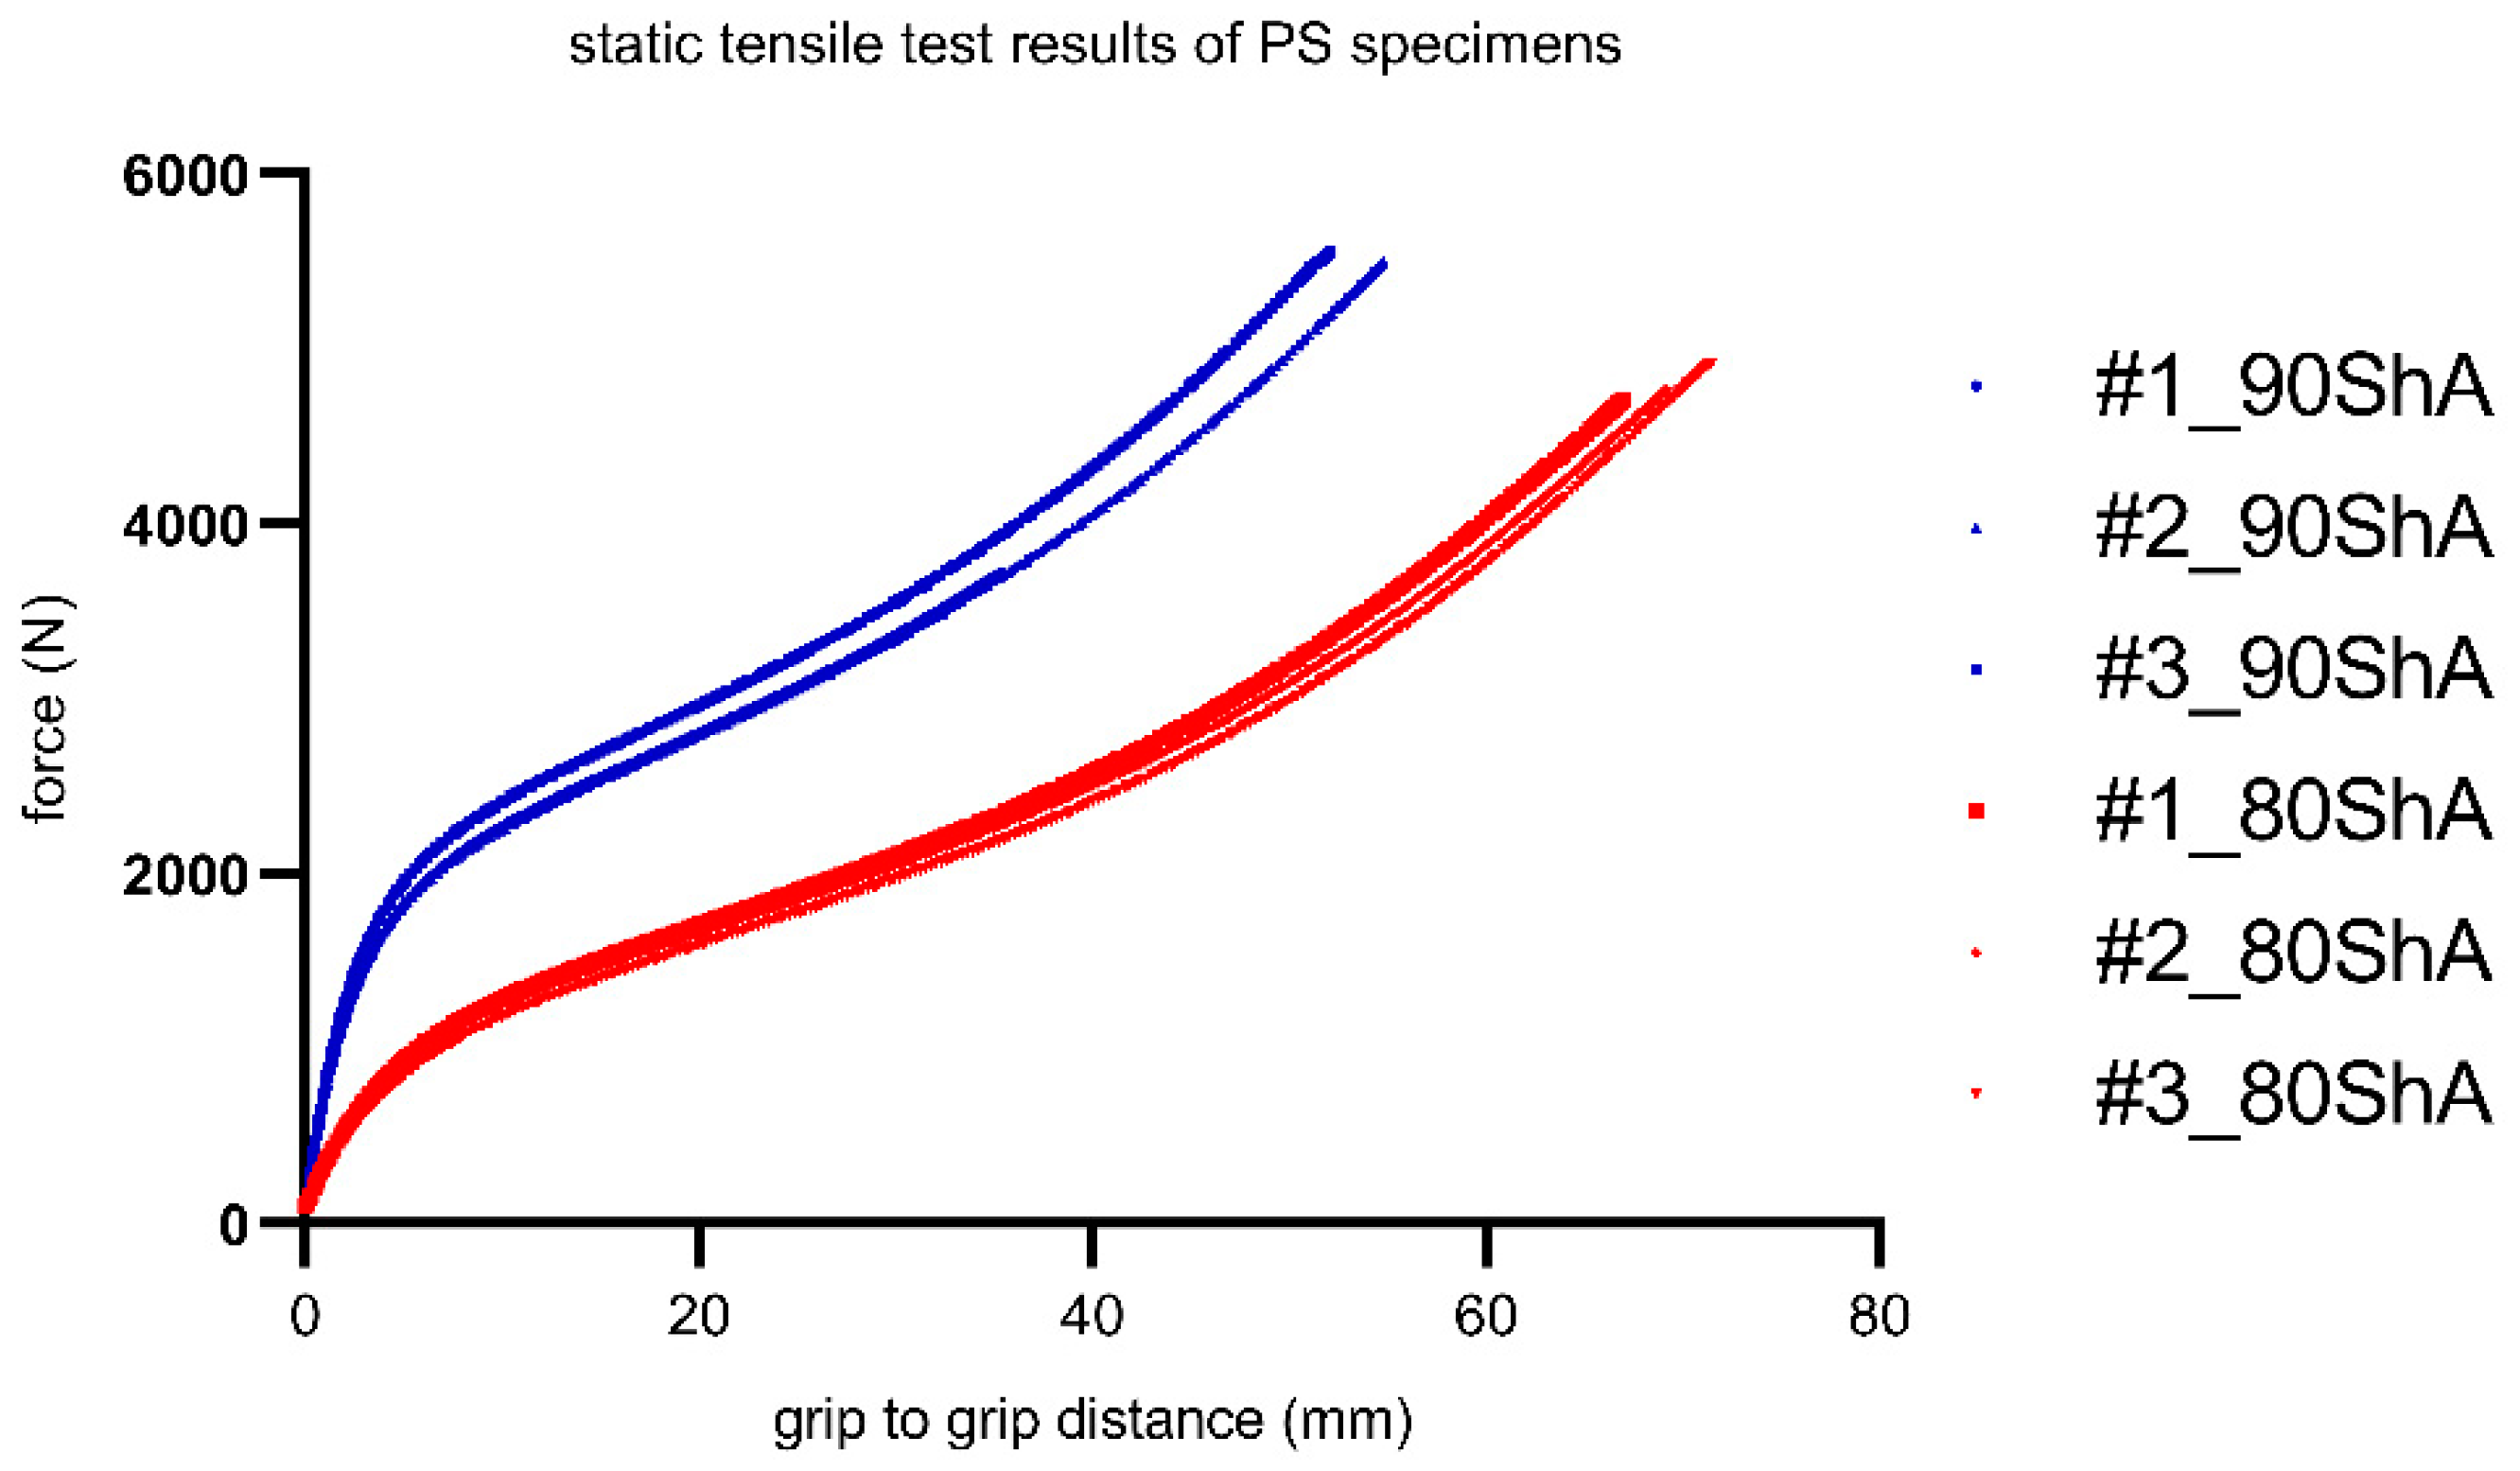
| Specimen ID | UTS—Ultimate Tensile Strength in MPa | A—Elongation at Break in % |
|---|---|---|
| 80 ShA | 19.4 ± 2.3 | 710.4 ± 43.9 |
| 90 ShA | 27.9 ± 0.2 | 535.3 ± 21.9 |
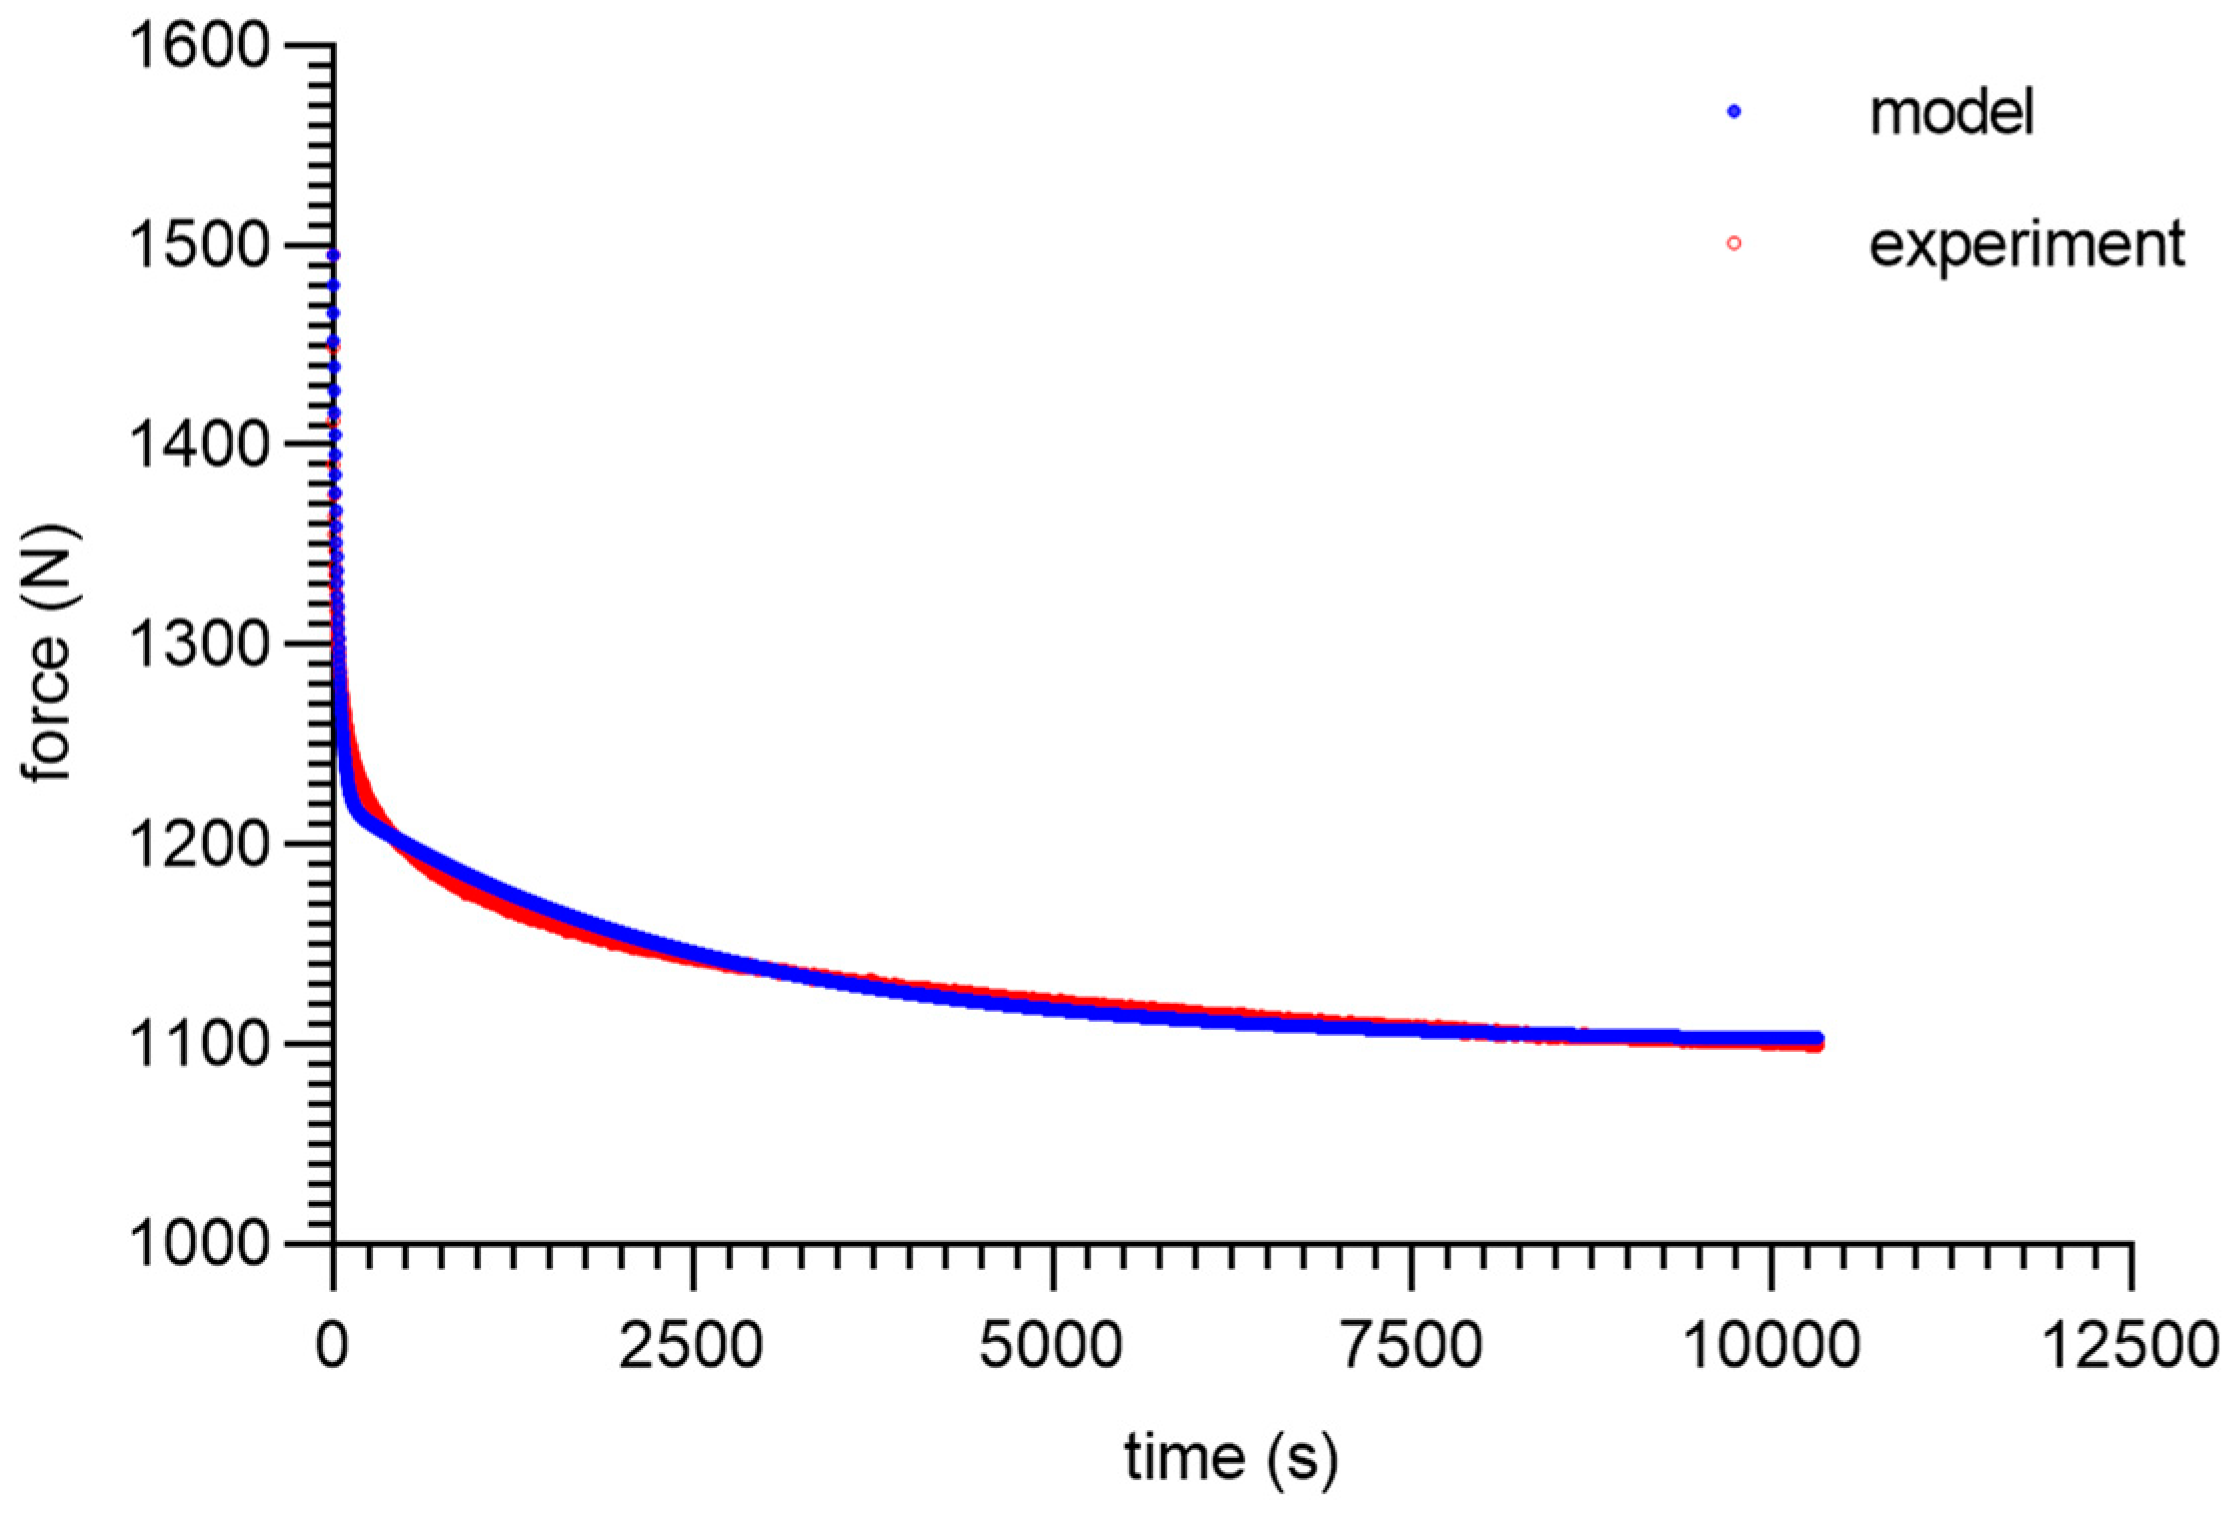
| E0 (MPa) | E1 (MPa) | E2 (MPa) | η1 (MPa∙s) | η2 (MPa∙s) | R2 | |
|---|---|---|---|---|---|---|
| 80 ShA-25% | 8.47 | 56.92 | 92.39 | 2411.36 | 259,006.98 | 0.92 |
| 80 ShA-50% | 9.17 | 56.87 | 92.69 | 2441.50 | 259,108.88 | 0.93 |
| 80 ShA-75% | 12.64 | 56.87 | 92.69 | 2441.50 | 259,108.88 | 0.94 |
| 80 ShA-100% | 13.32 | 56.58 | 94.3 | 2264.29 | 258,169.65 | 0.93 |
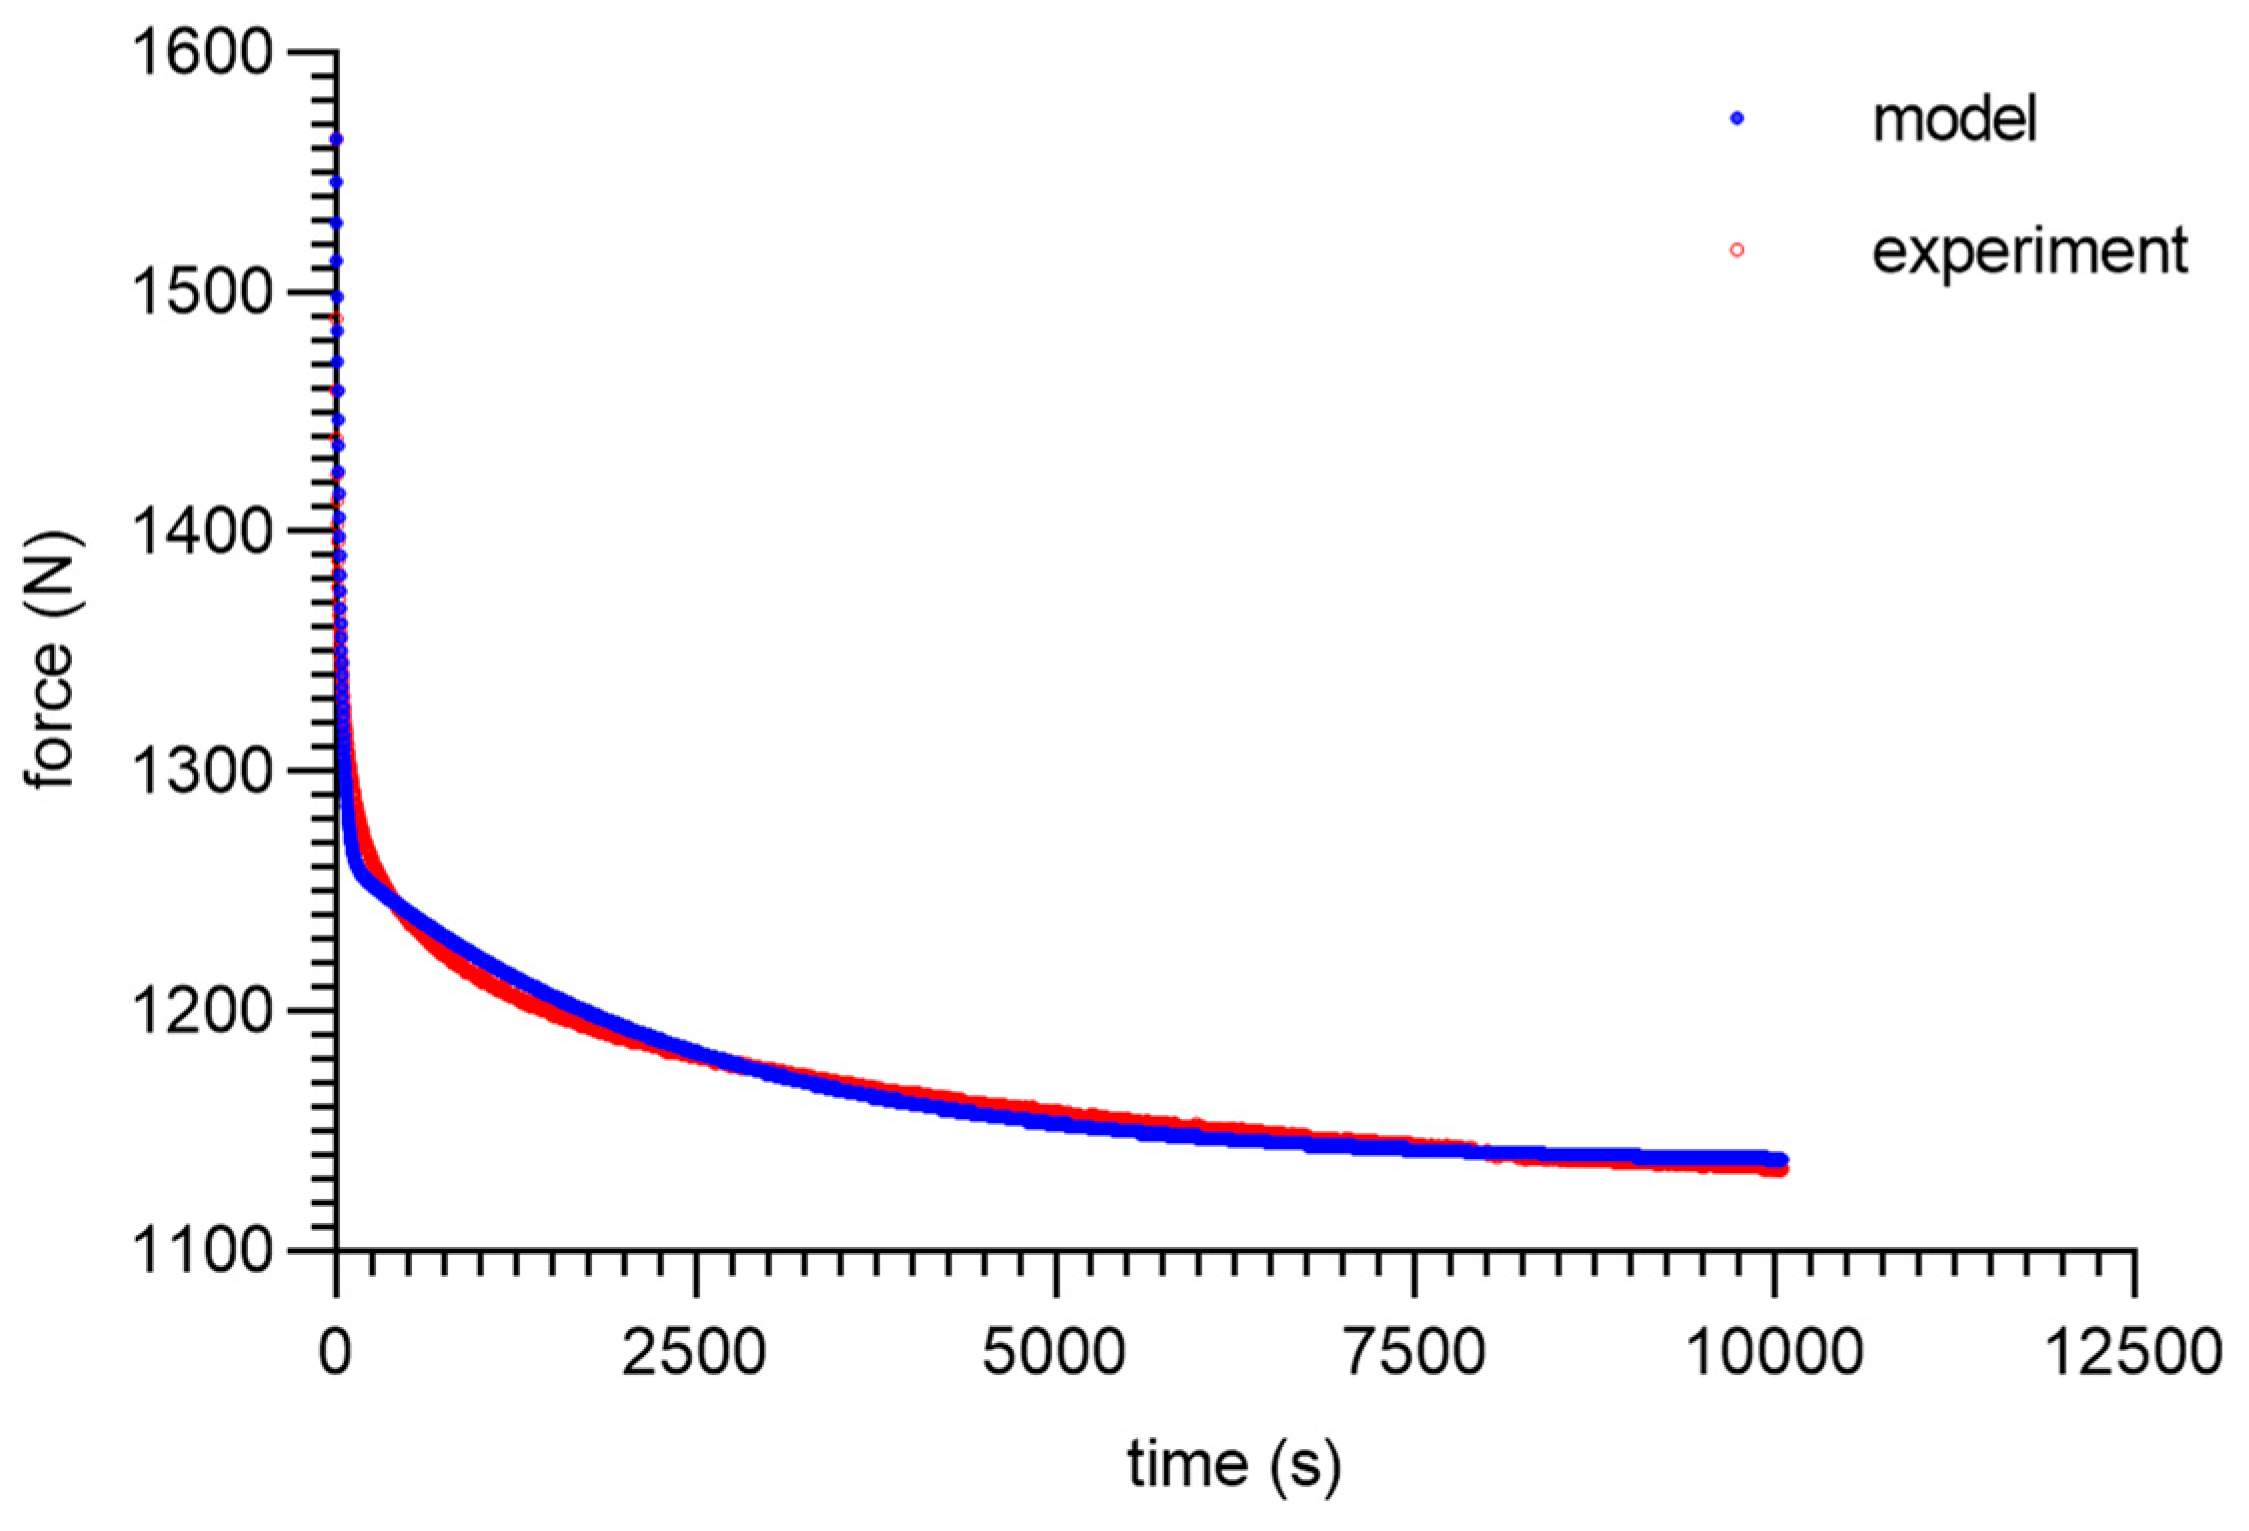
| 90 ShA-25% | 11.91 | 58.76 | 100.39 | 1847.00 | 181,866.00 | 0.91 |
| 90 ShA-50% | 12.09 | 59.03 | 98.40 | 1993.56 | 183,629.76 | 0.93 |
| 90 ShA-75% | 15.99 | 59.12 | 97.68 | 1912.86 | 184,578.90 | 0.92 |
| 90 ShA-100% | 15.21 | 59.12 | 97.68 | 1912.86 | 184,578.90 | 0.93 |
Disclaimer/Publisher’s Note: The statements, opinions and data contained in all publications are solely those of the individual author(s) and contributor(s) and not of MDPI and/or the editor(s). MDPI and/or the editor(s) disclaim responsibility for any injury to people or property resulting from any ideas, methods, instructions or products referred to in the content. |
© 2023 by the authors. Licensee MDPI, Basel, Switzerland. This article is an open access article distributed under the terms and conditions of the Creative Commons Attribution (CC BY) license (https://creativecommons.org/licenses/by/4.0/).
Share and Cite
Zielonka, P.; Junik, K.; Duda, S.; Socha, T.; Kula, K.; Denisiewicz, A.; Olaleye, K.; Macek, W.; Lesiuk, G.; Błażejewski, W. Stress Relaxation Behaviour Modeling in Rigid Polyurethane (PU) Elastomeric Materials. Materials 2023, 16, 3156. https://doi.org/10.3390/ma16083156
Zielonka P, Junik K, Duda S, Socha T, Kula K, Denisiewicz A, Olaleye K, Macek W, Lesiuk G, Błażejewski W. Stress Relaxation Behaviour Modeling in Rigid Polyurethane (PU) Elastomeric Materials. Materials. 2023; 16(8):3156. https://doi.org/10.3390/ma16083156
Chicago/Turabian StyleZielonka, Paweł, Krzysztof Junik, Szymon Duda, Tomasz Socha, Krzysztof Kula, Arkadiusz Denisiewicz, Kayode Olaleye, Wojciech Macek, Grzegorz Lesiuk, and Wojciech Błażejewski. 2023. "Stress Relaxation Behaviour Modeling in Rigid Polyurethane (PU) Elastomeric Materials" Materials 16, no. 8: 3156. https://doi.org/10.3390/ma16083156
APA StyleZielonka, P., Junik, K., Duda, S., Socha, T., Kula, K., Denisiewicz, A., Olaleye, K., Macek, W., Lesiuk, G., & Błażejewski, W. (2023). Stress Relaxation Behaviour Modeling in Rigid Polyurethane (PU) Elastomeric Materials. Materials, 16(8), 3156. https://doi.org/10.3390/ma16083156