
Measurement and Simulation of Magnetic Properties of Nanocrystalline Alloys under High-Frequency Pulse Excitation

Abstract
:1. Introduction
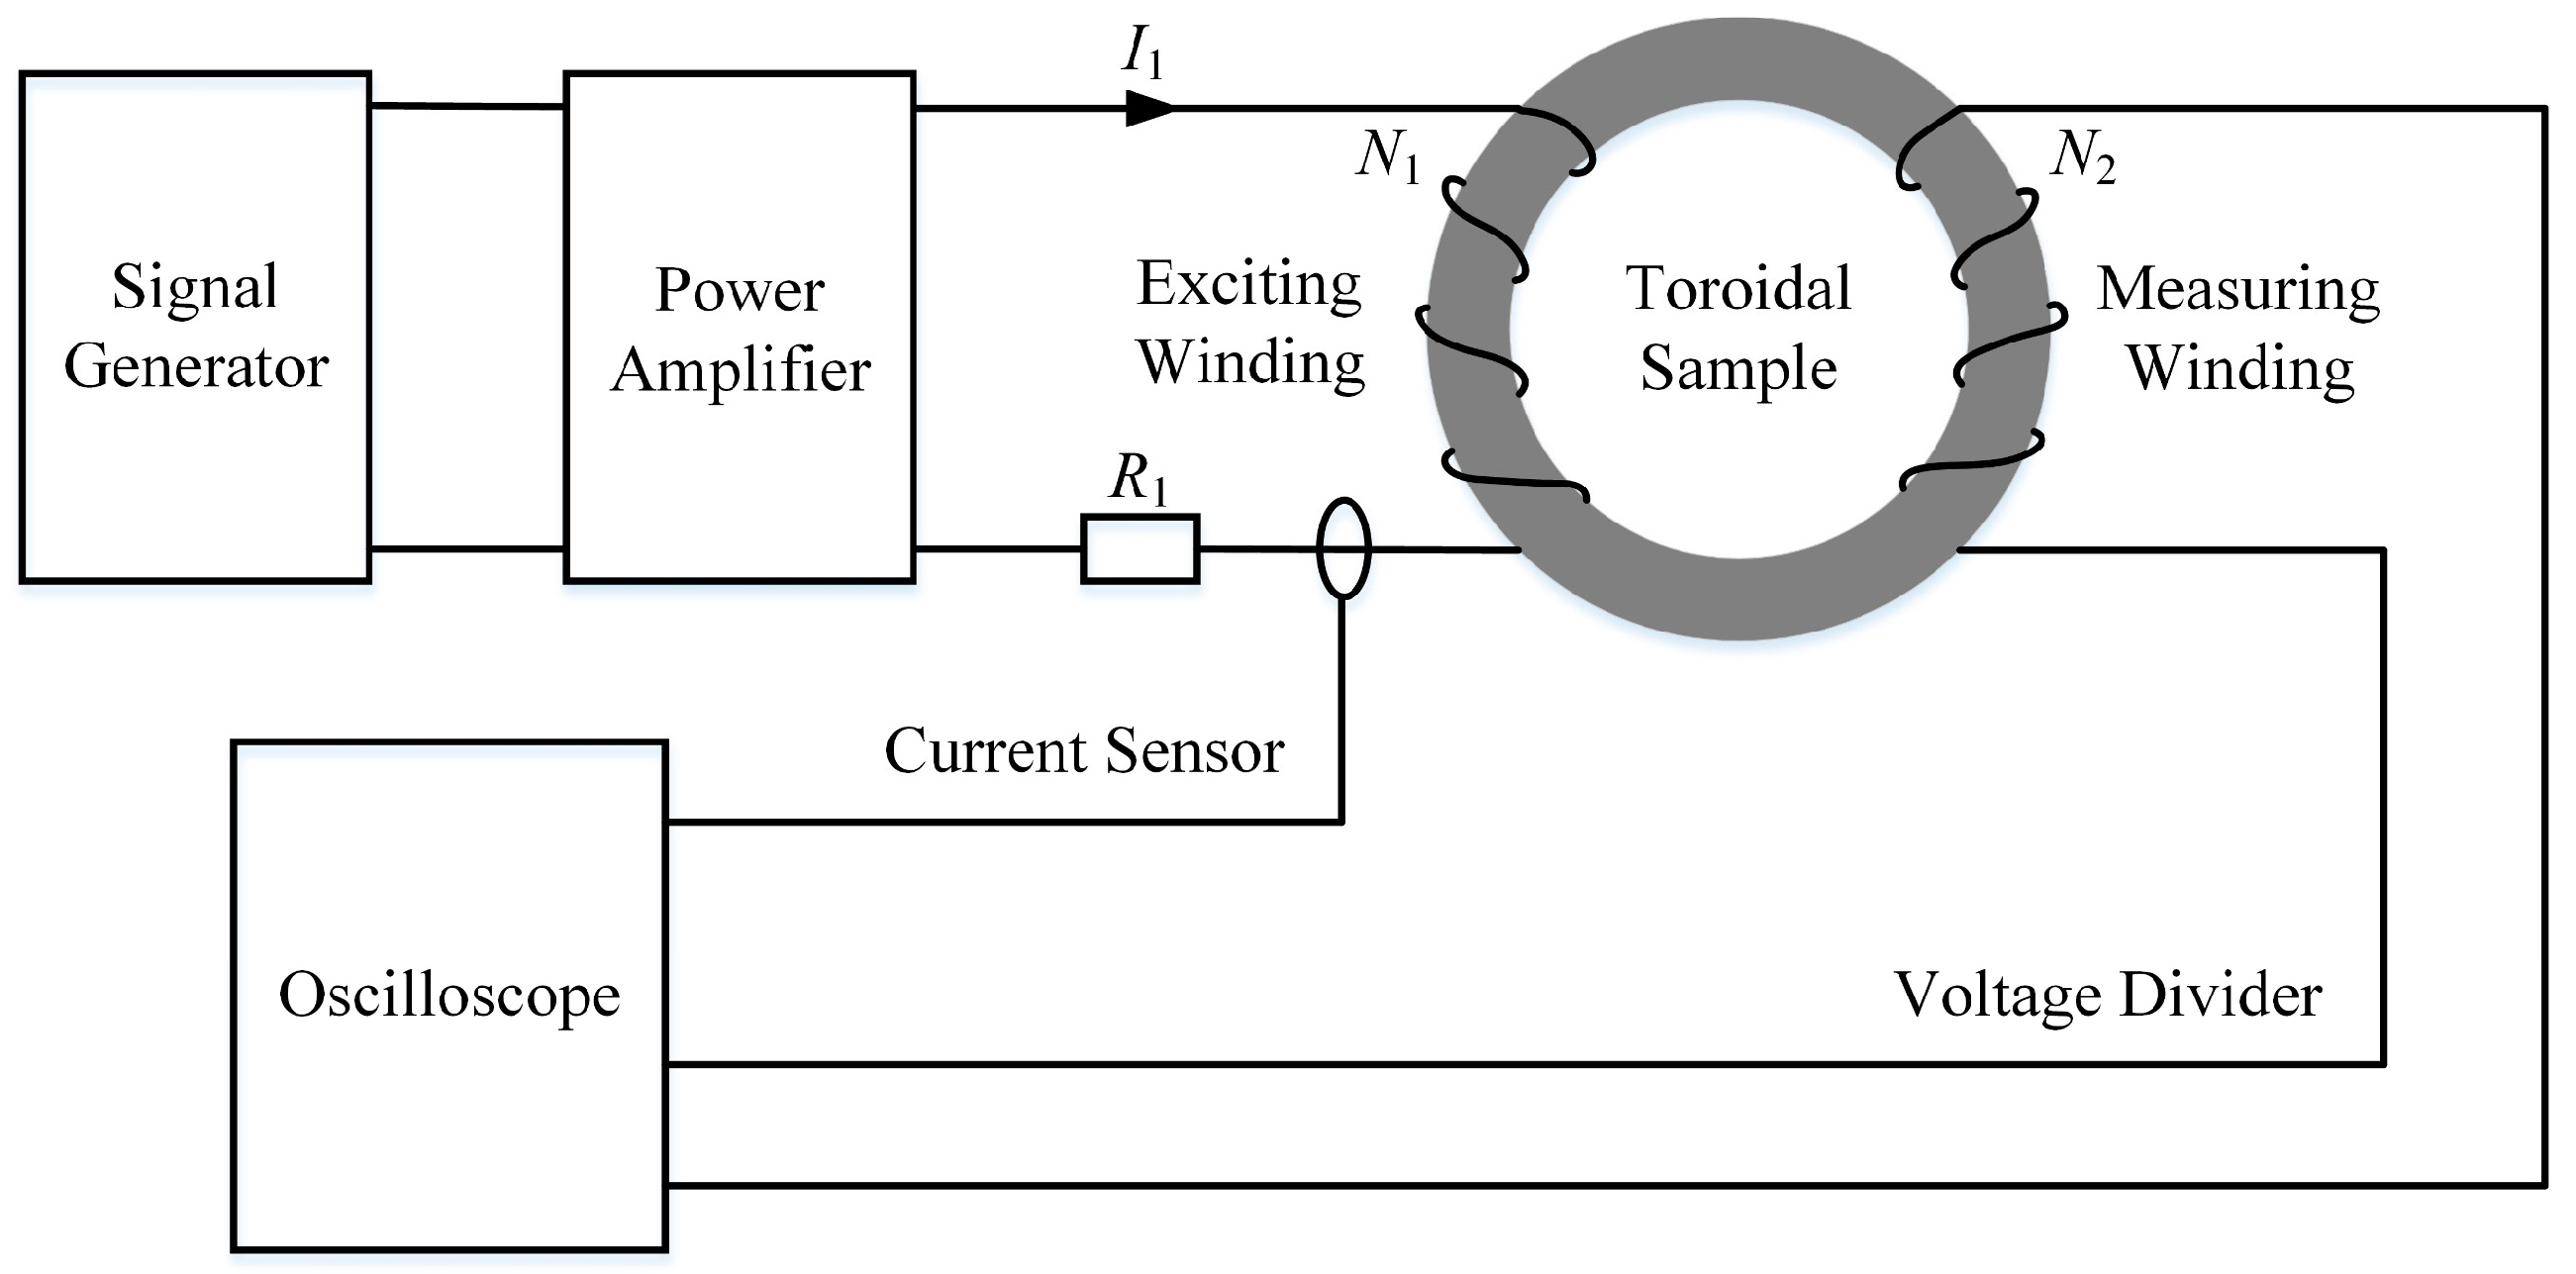
2. Measurement System
2.1. The Test Setup and the Measuring Principle
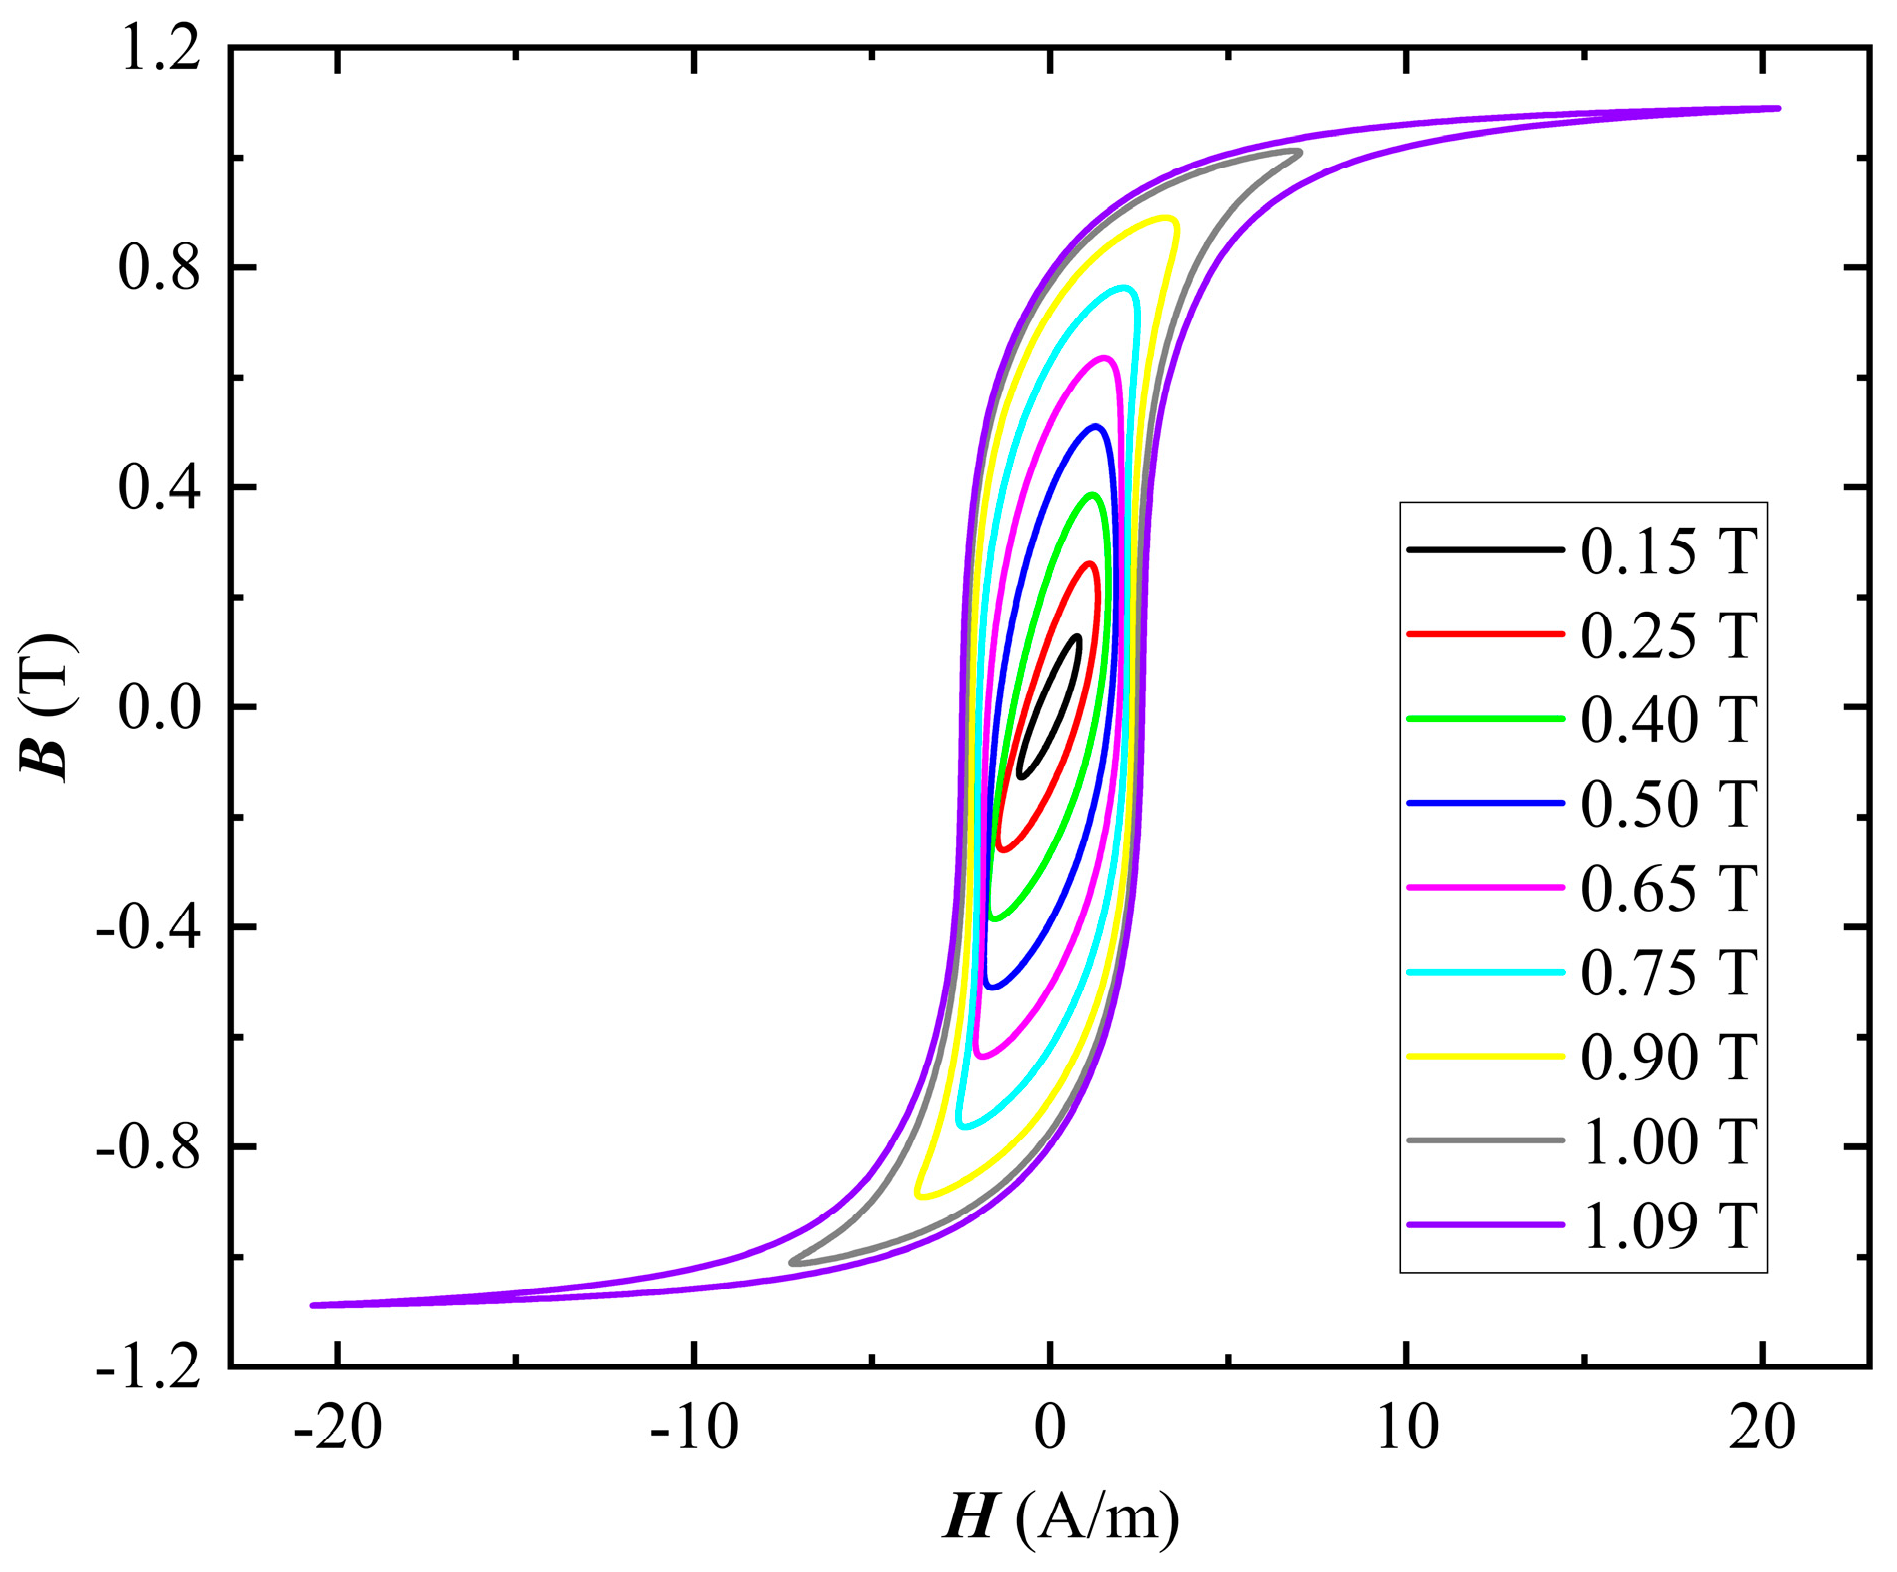
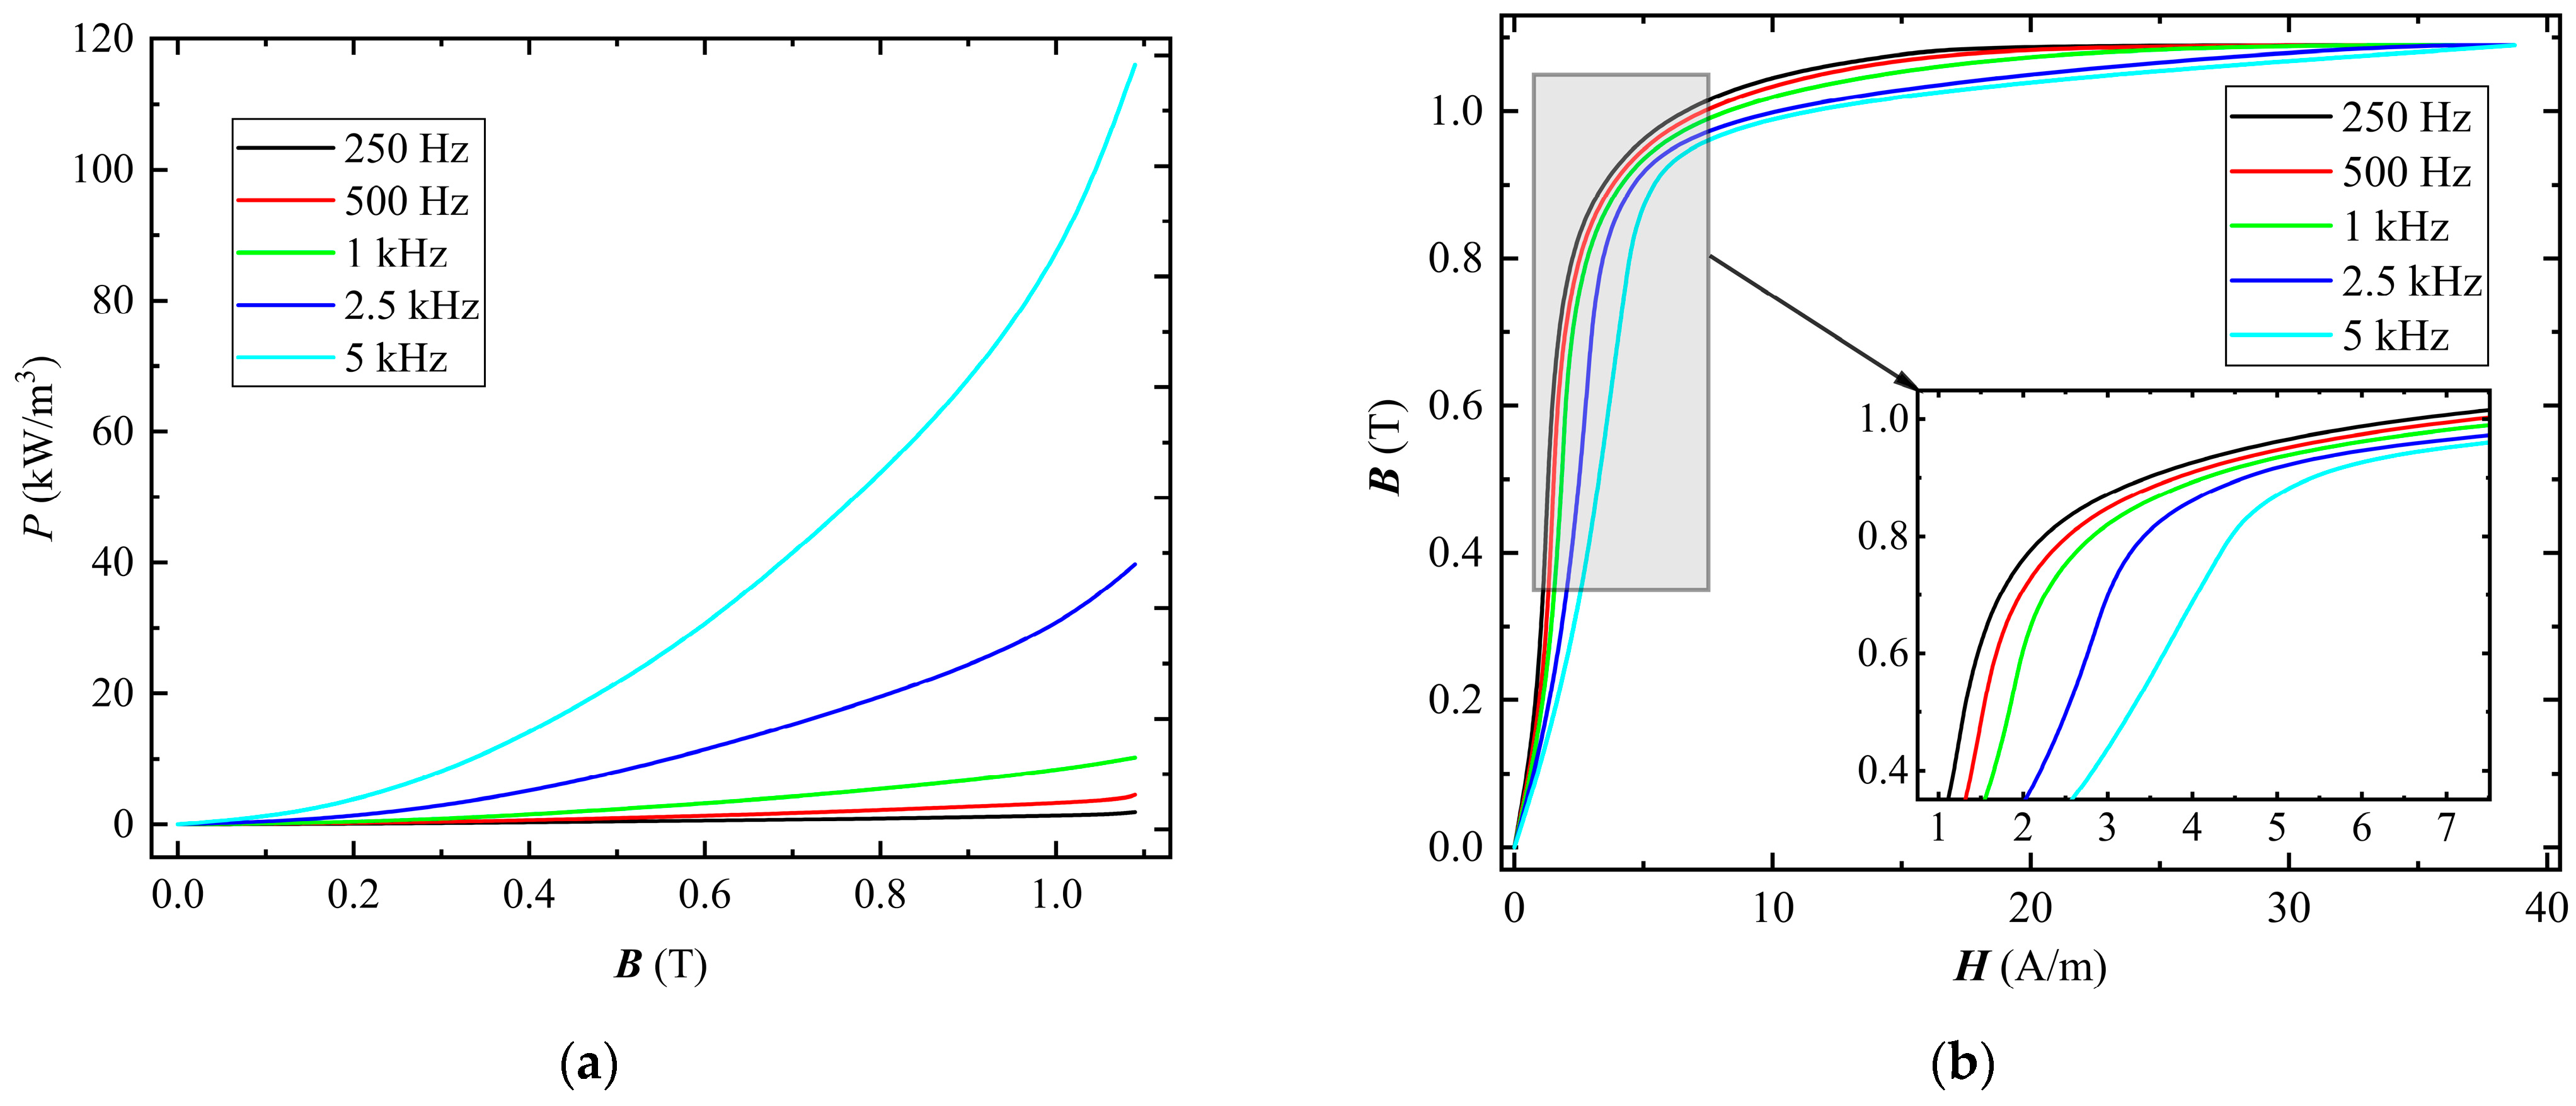
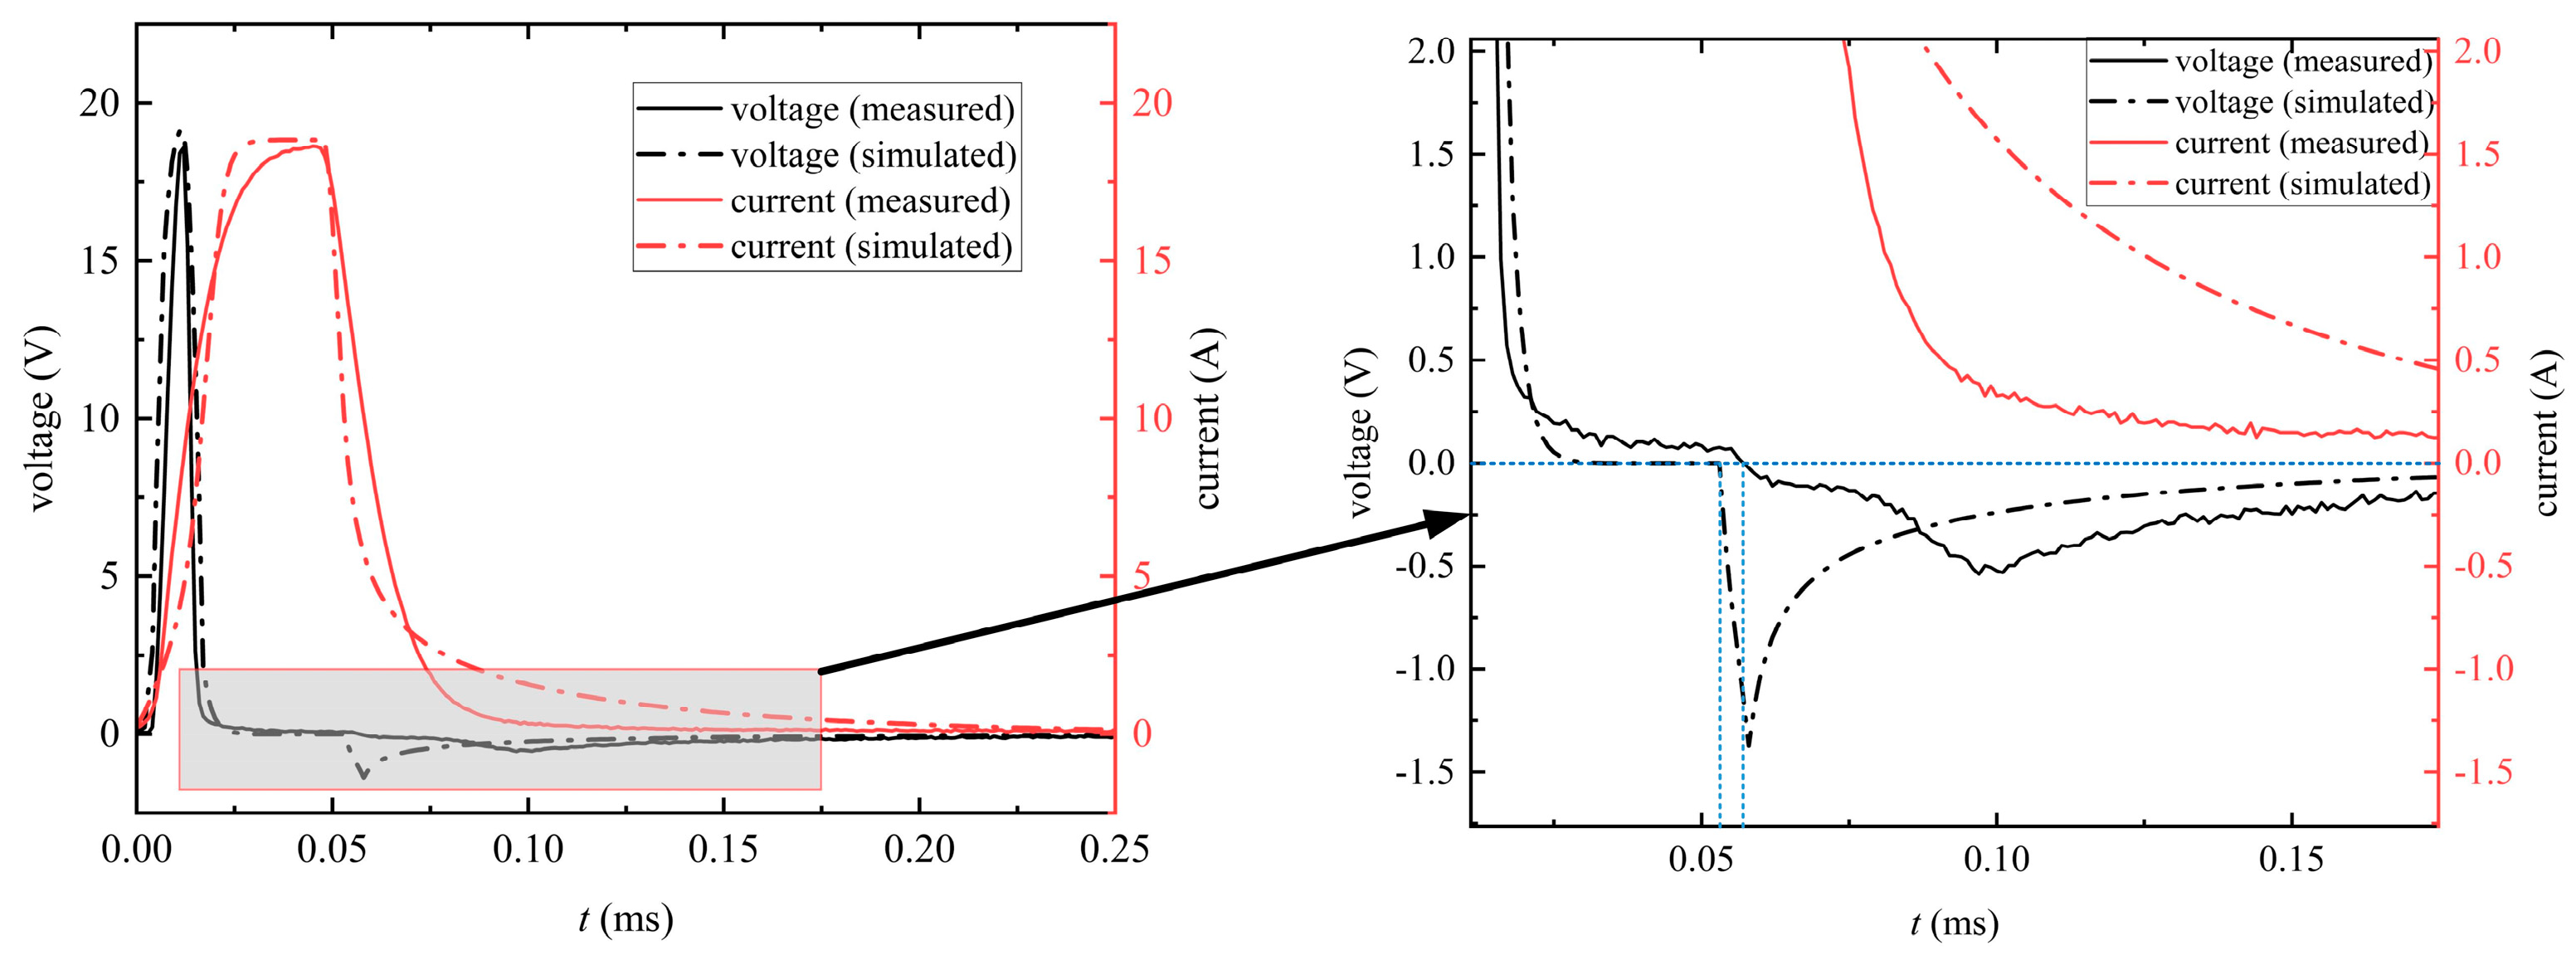
2.2. Experimental Results and Analysis
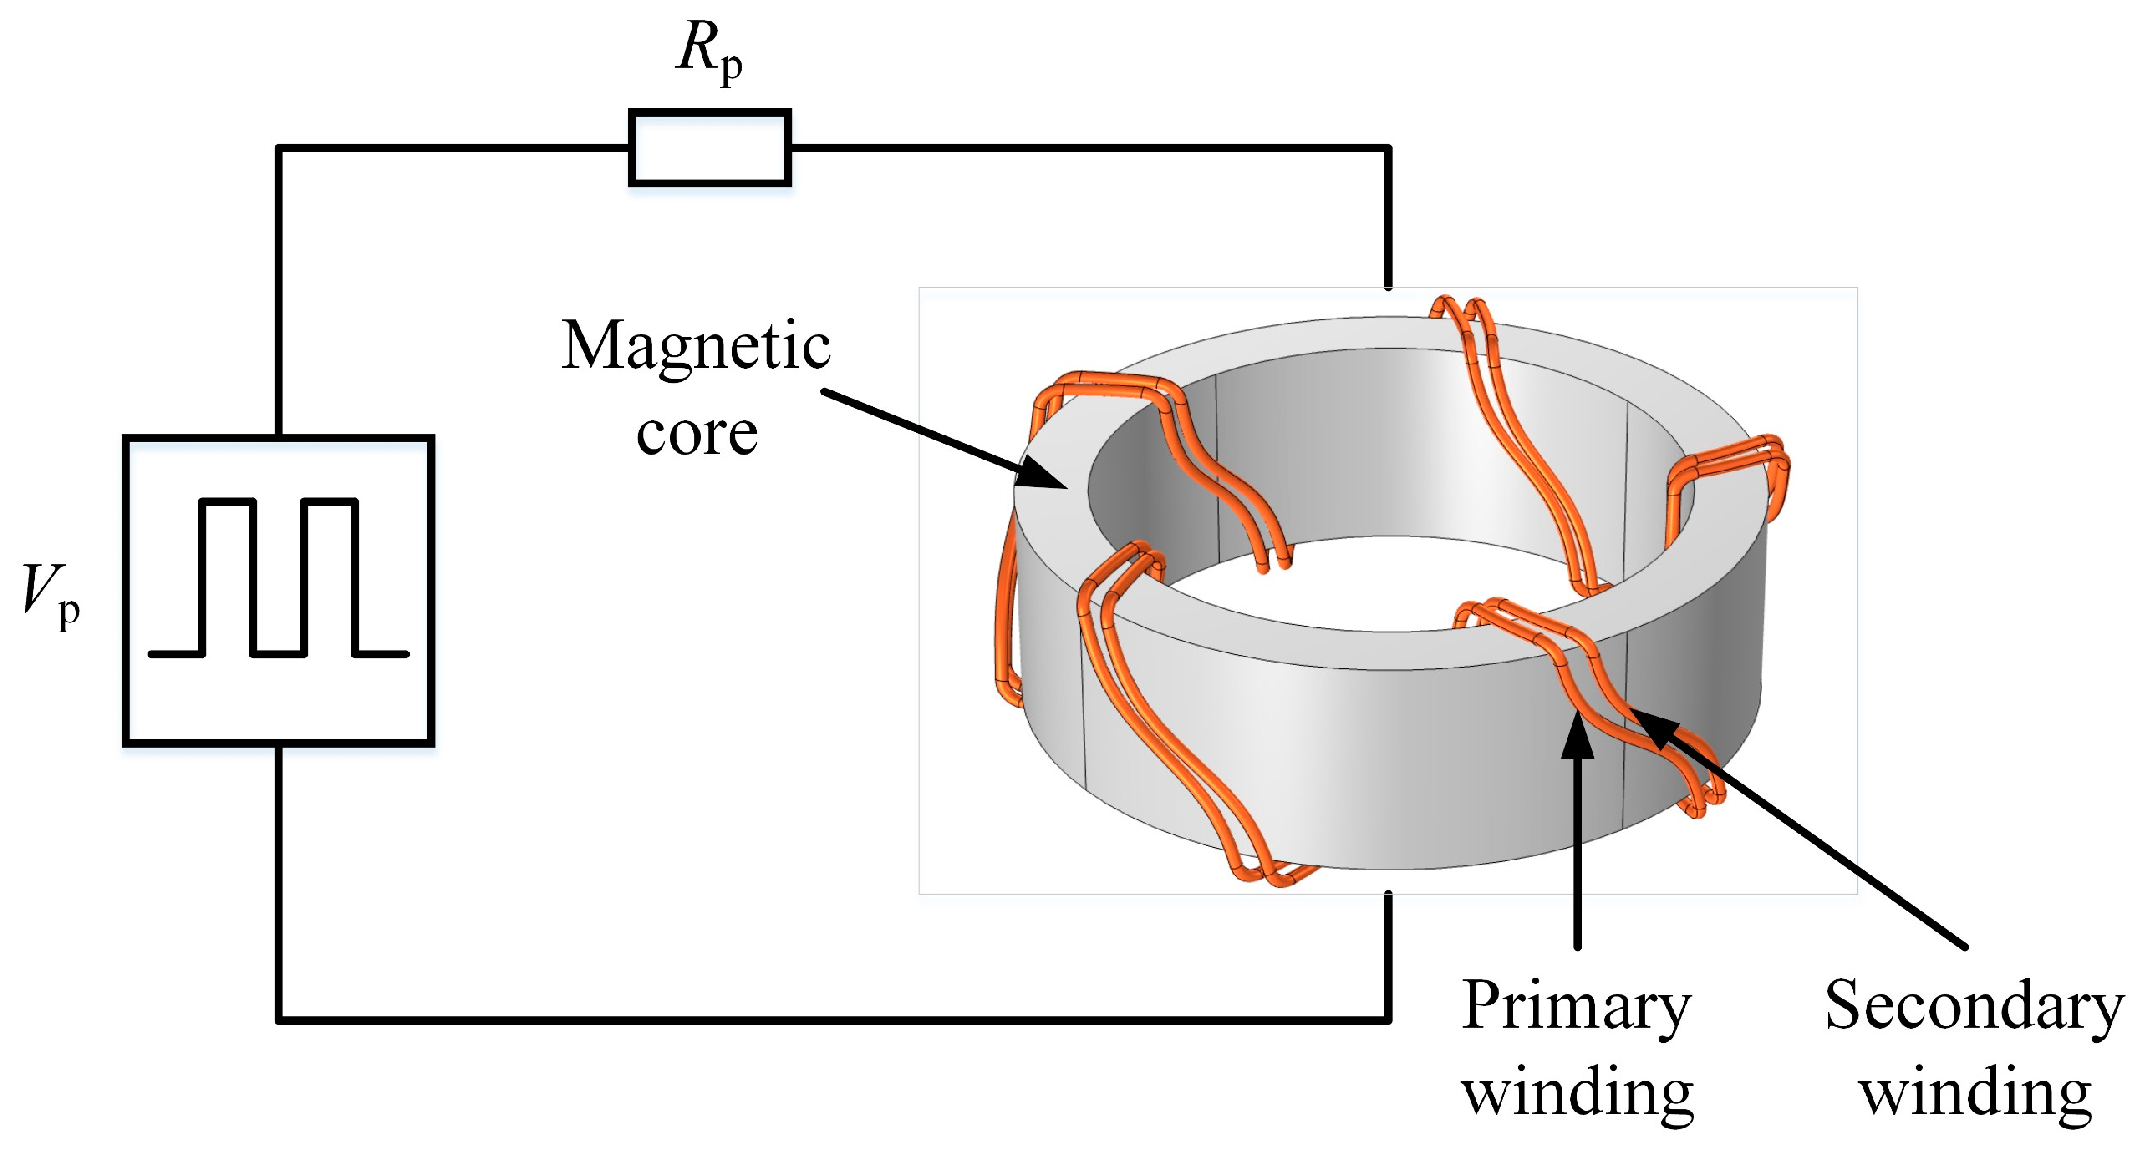
3. The Simulation
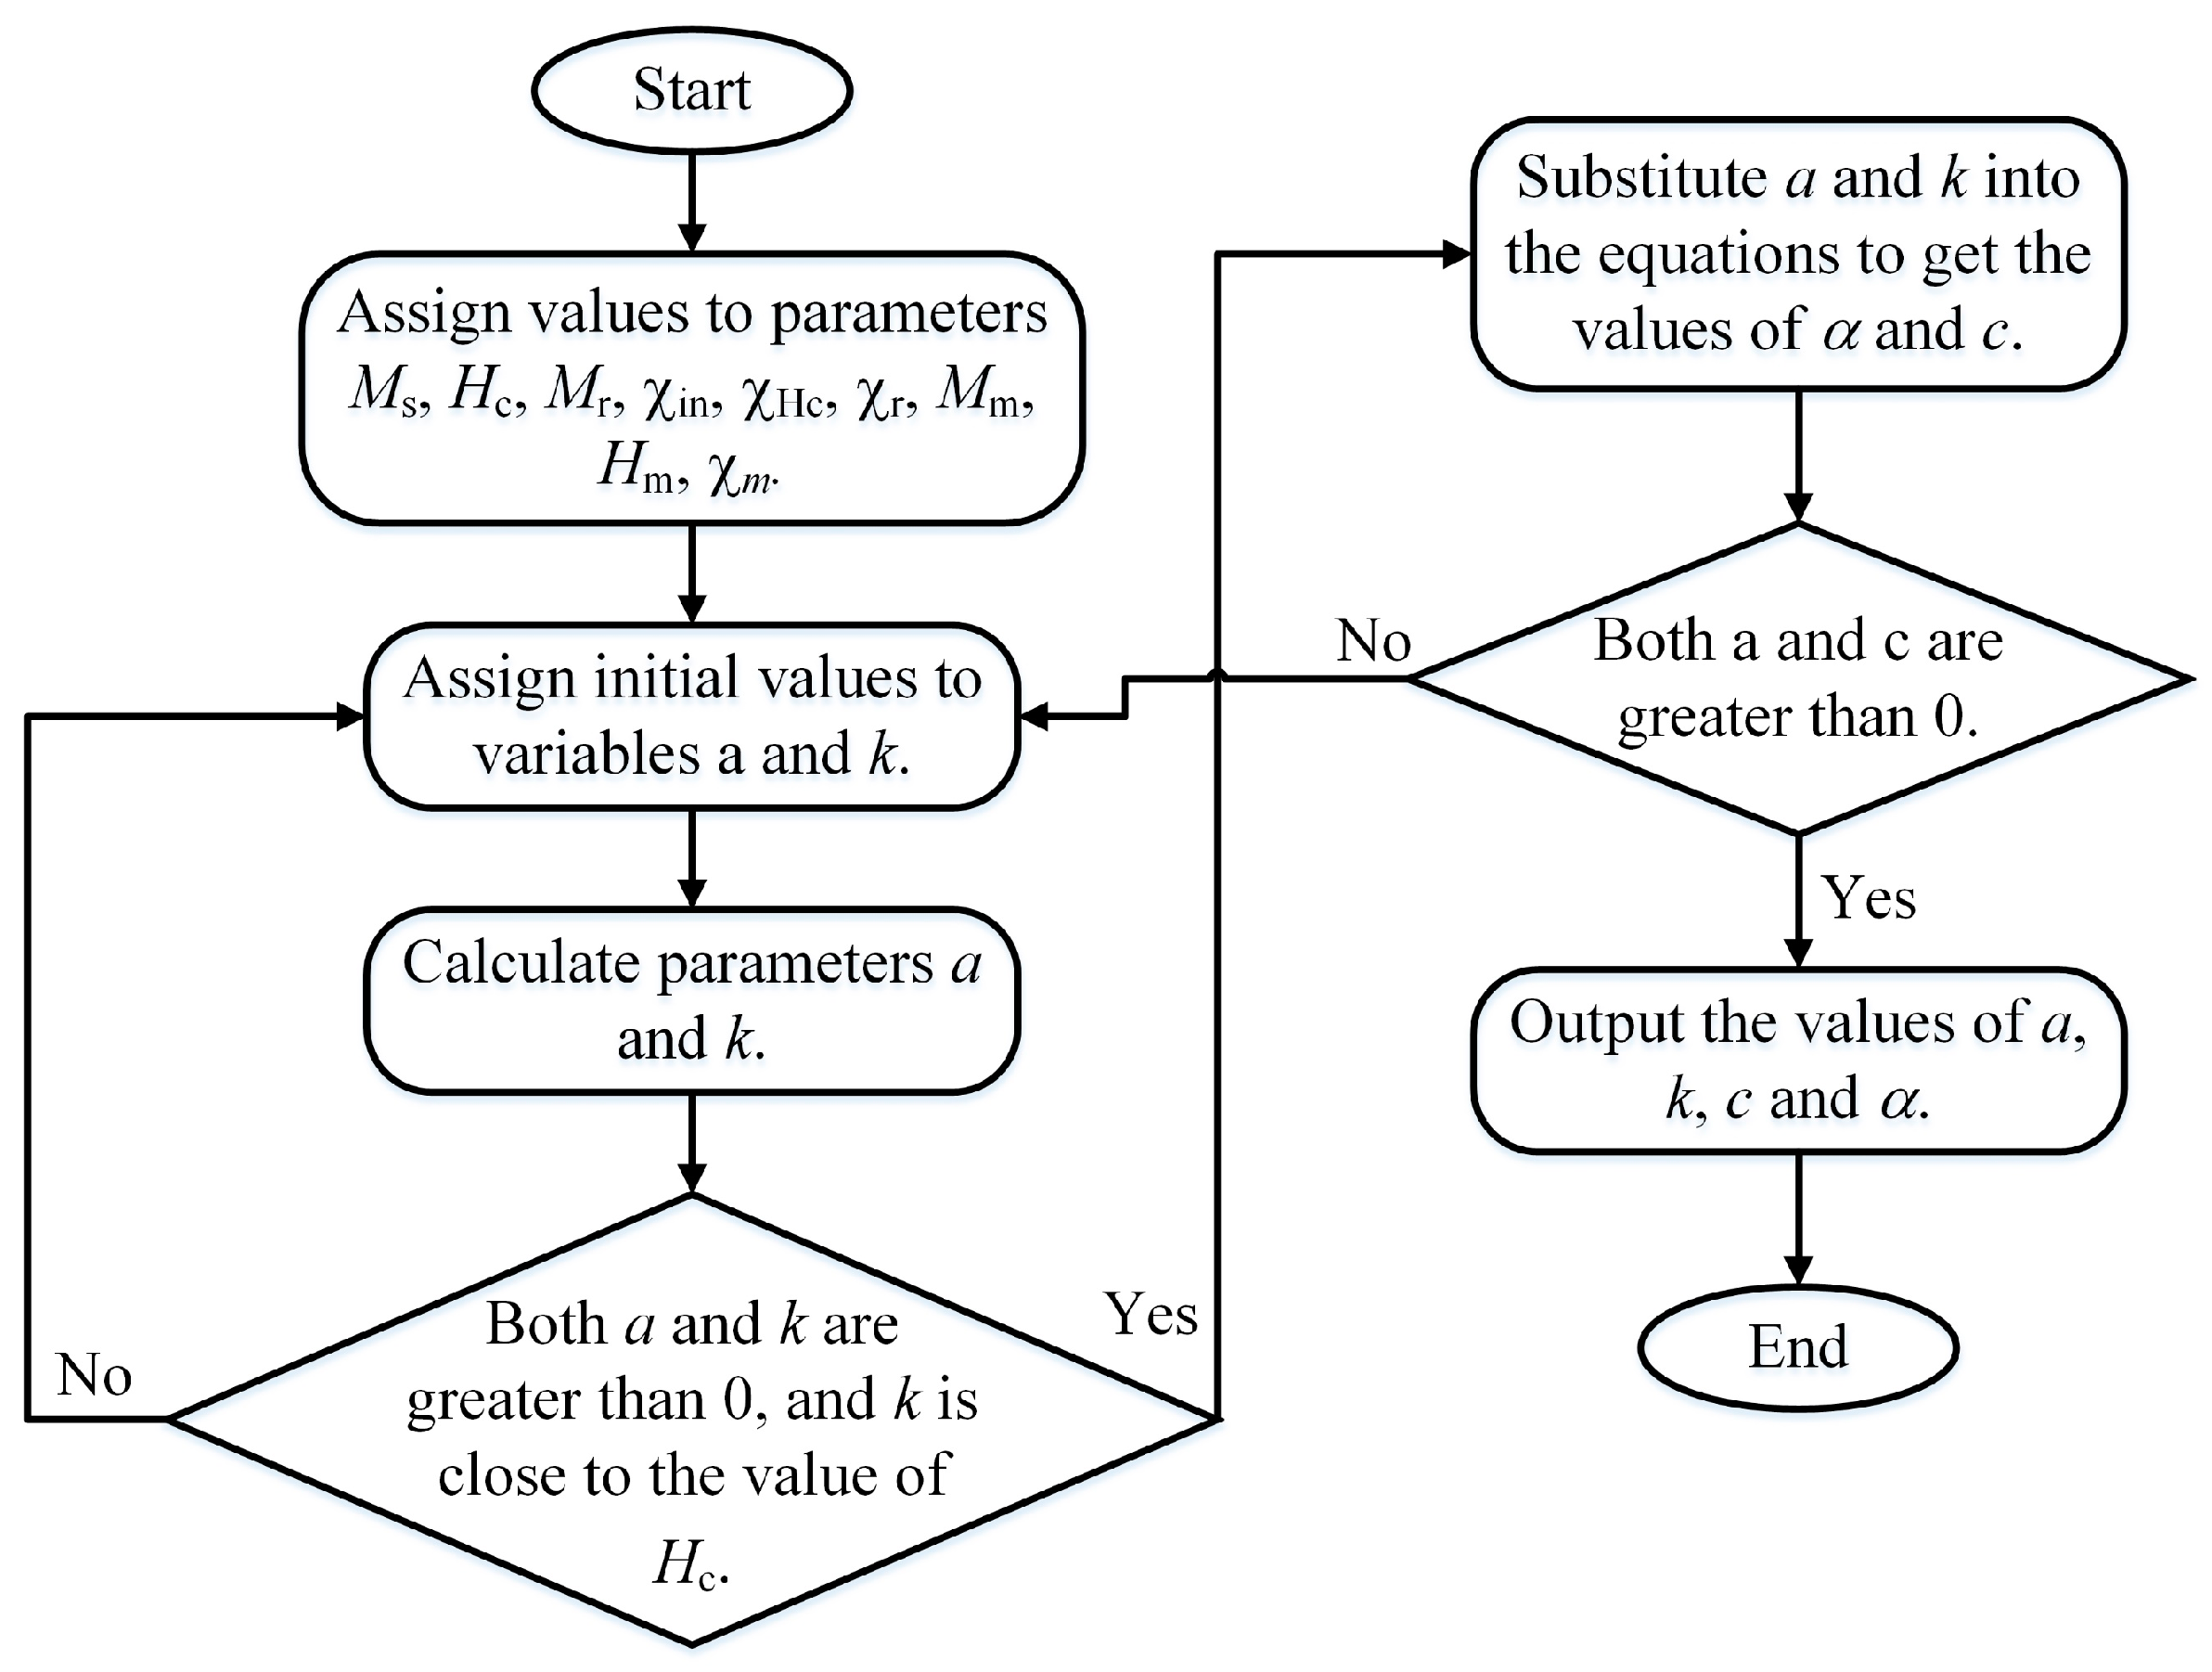
3.1. Modeling
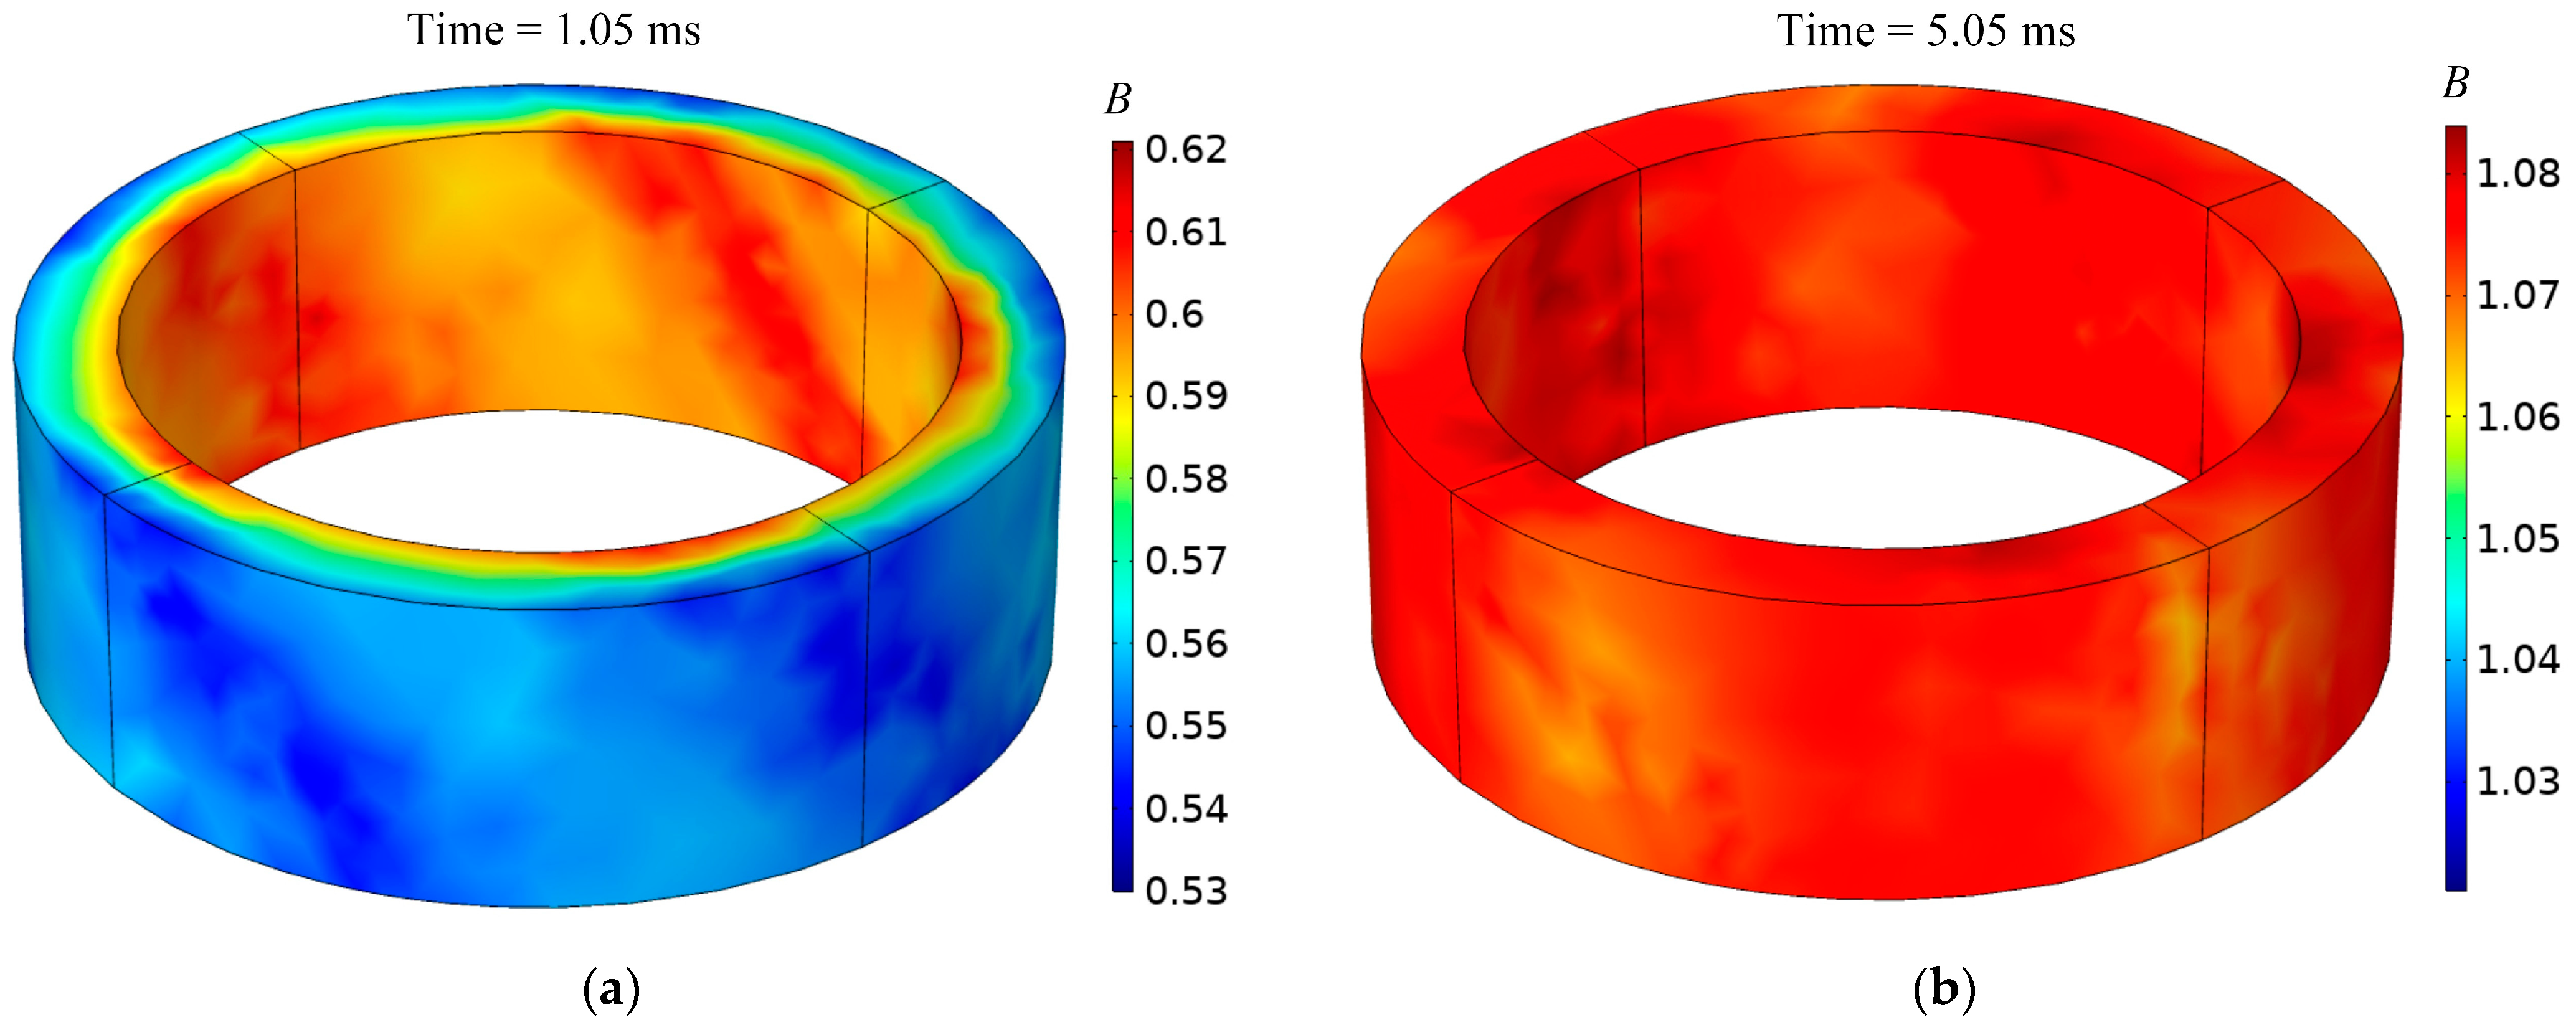
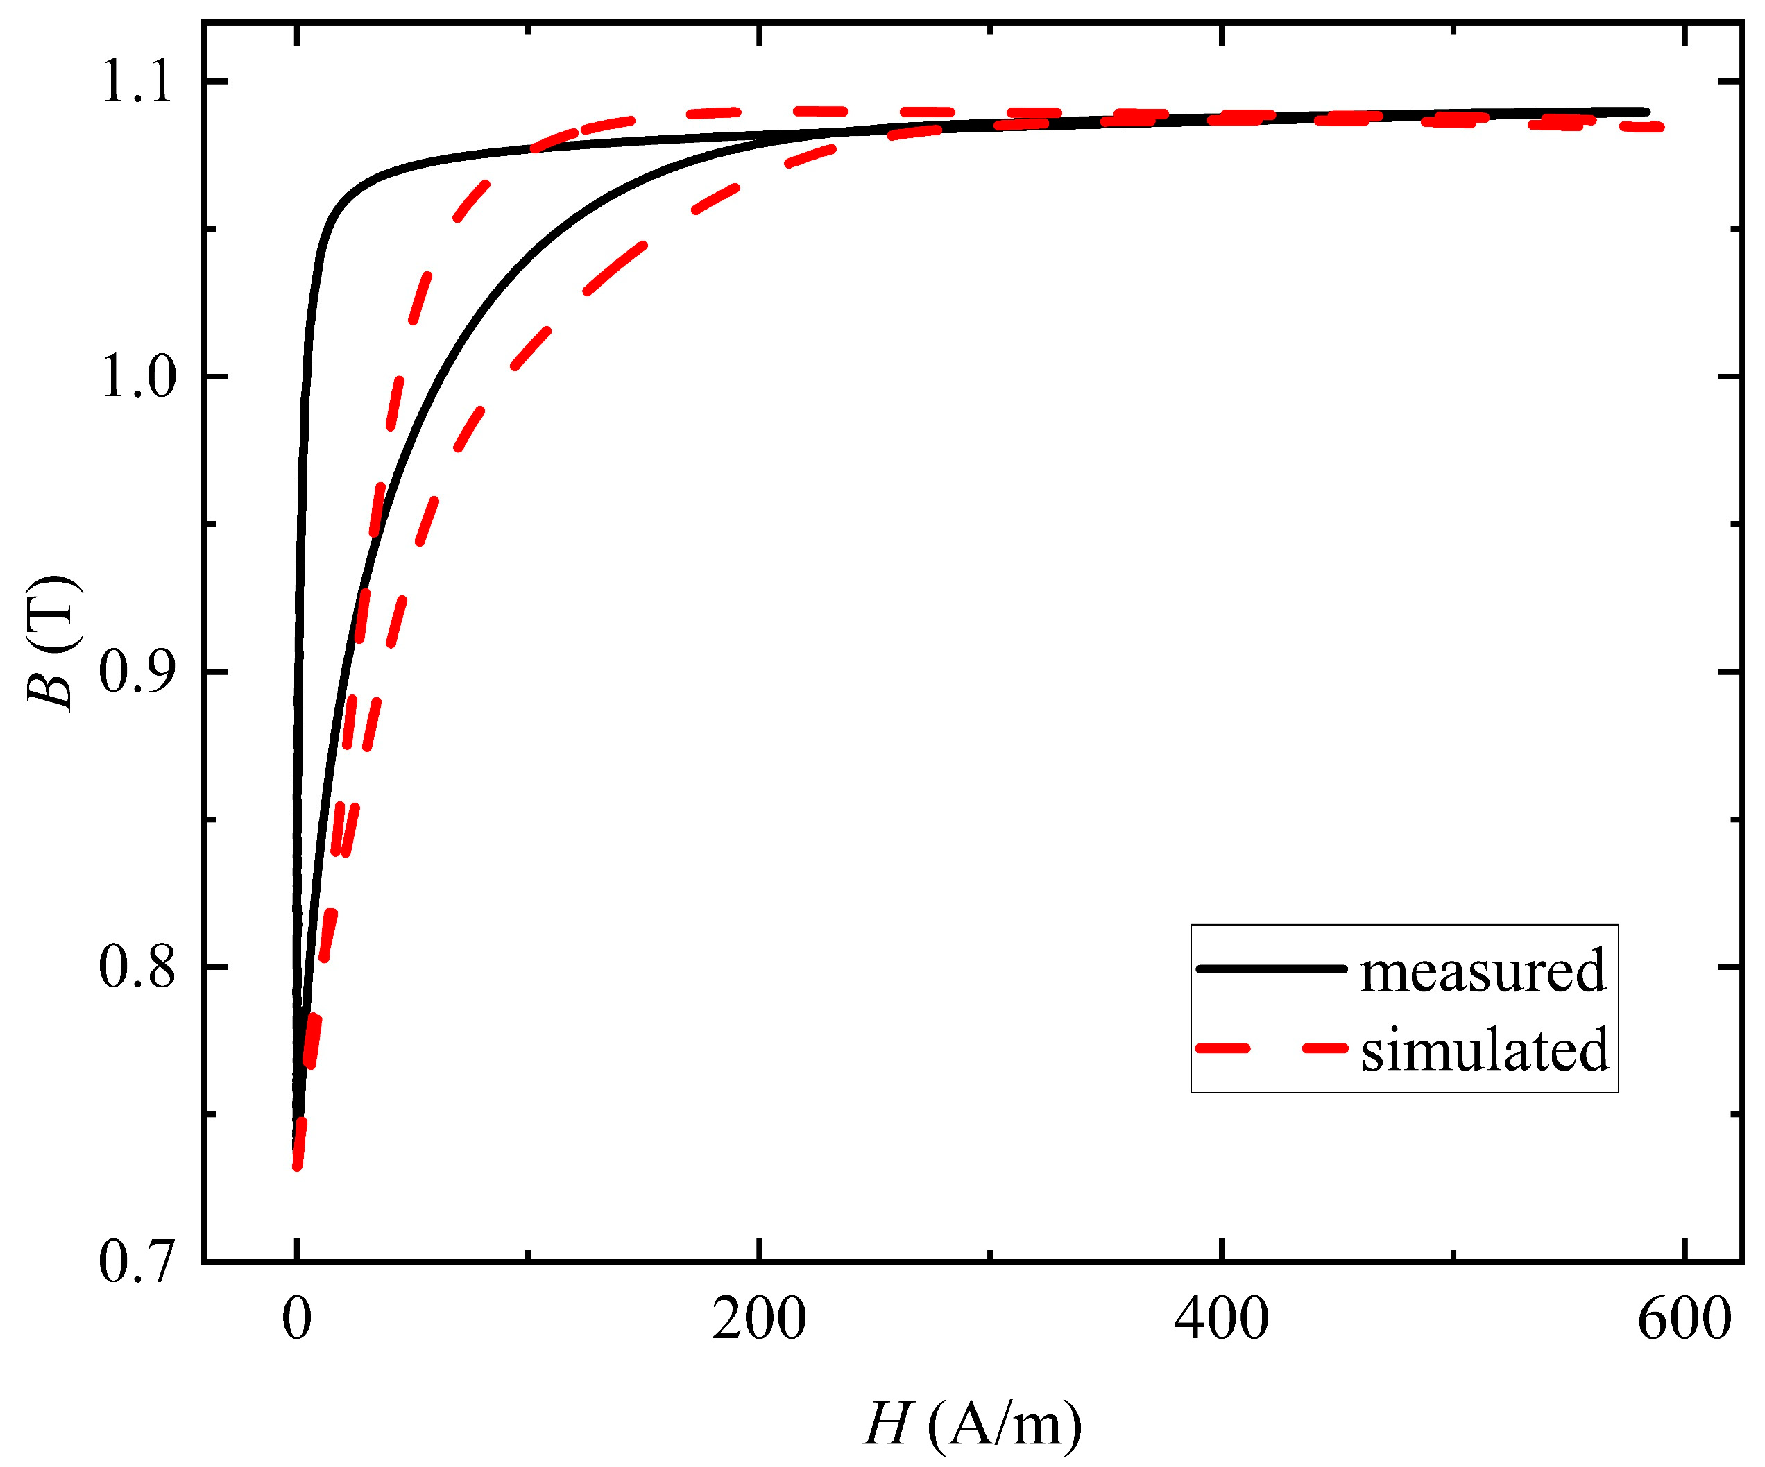
3.2. Results and Discussions
4. Conclusions
Author Contributions
Funding
Institutional Review Board Statement
Informed Consent Statement
Data Availability Statement
Conflicts of Interest
References
- Nakajima, S.; Arakawa, S.; Yamashita, Y.; Shiho, M. Fe-based nanocrystalline FINEMET cores for induction accelerators. Nucl. Instrum. Methods Phys. Res. Sect. A 1993, 311, 318–322. [Google Scholar] [CrossRef]
- Liu, Z.; Zou, B.; Li, W. Technical principle and field application of pulse power supply. In Proceedings of the 17th Chinese Conference on Electric Dust Removal 2017, Hefei, China, 24–25 October 2017; pp. 531–533. [Google Scholar]
- Zhang, D.; Yan, P.; Wang, J.; Zhou, Y. Magnetic characteristics of saturable pulse transformer in magnetic pulse compression system. In Proceedings of the 2009 IEEE Pulsed Power Conference, Washington, DC, USA, 29 June–2 July 2009. [Google Scholar]
- Lin, F.; Liu, Y.; Feng, X.; Liu, G. Study on a magnetic switch for pulsed power conditioning system. IEEE Trans. Plasma Sci. 2012, 40, 1183–1189. [Google Scholar]
- Zhang, S.; Yan, P.; Wang, J.; Yuan, W.; Ren, C.; Shao, T.; Zhang, D. Development situation and trends of pulsed power sources for civil applications. High Voltage Eng. 2009, 35, 618–631. [Google Scholar]
- Liu, Y.; Feng, X.; Lin, F. Design and performance of a pulse transformer based on Fe-based nanocrystalline core. Rev. Sci. Instrum. 2011, 82, 084703. [Google Scholar]
- Yu, B. Study on Characteristic of High Voltage Pulse Transformer with Open Magnetic Core. Master’s Thesis, National University of Defense Technology, Changsha, China, November 2012. [Google Scholar]
- McDonald, K.; Curry, R.; O’Connell, R.; Melcher, P.; Ness, R.; Huang, C. Evaluation of magnetic materials and insulation systems for repetition-rate pulse compression applications. In Proceedings of the 14th IEEE International Pulsed Power Conference, Dallas, TX, USA, 15–18 June 2003. [Google Scholar]
- Smith, C.H.; Nathasingh, D.M. Magnetic characteristics of amorphous metal saturable reactors in pulse power systems. In Proceedings of the 3rd European Particle Accelerator Conference, Berlin, Germany, 24–28 March 1992. [Google Scholar]
- Zheng, B.; Liu, Y.; Gao, C.; Li, Y. Design and application of multichannel peristaltic acceleration pulsed plasma power supply. IEEE Trans. Plasma Sci. 2014, 42, 1902–1908. [Google Scholar] [CrossRef]
- Li, B. The Design and Application of High Voltage Pulsed Power Marx Supply. Master’s Thesis, University of Electronic Science and Technology, Chengdu, China, June 2015. [Google Scholar]
- Howard, A.B.; Curry, R.D.; Burdt, R.A. High-dB/dt square-pulse excitation of Finemet magnetic material. IEEE Trans. Plasma Sci. 2016, 44, 1914–1918. [Google Scholar] [CrossRef]
- Kallas, N.D.; Curry, R.D.; Howard, A.B.; Burdt, R.A. Square-pulse excitation characteristics of Vitroperm. IEEE Trans. Magn. 2017, 53, 1–5. [Google Scholar] [CrossRef]
- Liu, Y.; Han, Y.; Liu, S.; Lin, F. Pulse magnetic properties measurement and characterization of Fe-based nanocrystalline cores for high-voltage pulse magnetics applications. IEEE Trans. Power Electron. 2015, 30, 6883–6896. [Google Scholar] [CrossRef]
- Liu, Y.; Han, Y.; Lin, F.; Li, L. Performance evaluation of Fe-based nanocrystalline cores with high and low residual flux. IEEE Trans. Plasma Sci. 2014, 42, 2079–2085. [Google Scholar] [CrossRef]
- Liu, Y.; Han, Y.; Liu, S.; Lin, F. Loss and permeability characterization of Fe-based nanocrystalline cores for pulsed power magnetic applications. In Proceedings of the 2014 IEEE International Power Modulator and High Voltage Conference, Santa Fe, NM, USA, 1–5 June 2014. [Google Scholar]
- Han, Y. Study on Repetitive Nanosecond Pulse Generator Based on Pulse Magnetic Components. Master’s Thesis, Huazhong University of Science and Technology, Wuhan, China, May 2016. [Google Scholar]
- Xin, W.; Mao, X.; Chen, X. Analysis of local hysteresis characteristics of ferromagnetic materials excited by pulsed current. Proc. CSEE 2014, 34, 2004–2011. [Google Scholar]
- Xin, W. Analysis and simulation of local hysteresis of ferromagnetic materials excited by pulse current with frequency and pulse width. Proc. CSEE 2015, 35, 1258–1265. [Google Scholar]
- Choi, J.; Namihira, T.; Sakugawa, T.; Katsuki, S.; Akiyama, H. Simulation of 3-staged MPC using custom characteristics of magnetic cores. IEEE Trans. Dielectr. Electr. Insul. 2007, 14, 1025–1032. [Google Scholar] [CrossRef]
- Choi, J.; Namihira, T.; Sakugawa, T.; Katsuki, S.; Akiyama, H. Loss characteristics of a magnetic core for pulsed power applications. IEEE Trans. Plasma Sci. 2007, 35, 1791–1796. [Google Scholar] [CrossRef]
- Yoshizawa, Y.; Oguma, S.; Yamauchi, K. New Fe-based soft magnetic alloys composed of ultrafine grain structure. J. Appl. Phys. 1988, 64, 6044–6046. [Google Scholar] [CrossRef]
- Herzer, G. Amorphous and nanocrystalline soft magnets. In Magnetic Hysteresis in Novel Magnetic Materials; Hadjipanayis, G.C., Ed.; Springer: Dordrecht, The Netherlands, 1997; pp. 711–730. [Google Scholar]
- Shen, W.; Wang, F.; Boroyevich, D.; Tipton, C.W. Loss characterization and calculation of nanocrystalline cores for high-frequency magnetics applications. IEEE Trans. Power Electron. 2008, 23, 475–484. [Google Scholar] [CrossRef]
- Tumanski, S. Handbook of Magnetic Measurements; CRC Press: Boca Raton, FL, USA, 2011. [Google Scholar]
- Bertotti, G. General properties of power losses in soft ferromagnetic materials. IEEE Trans. Magn. 1988, 24, 621–630. [Google Scholar] [CrossRef]
- Fang, Y. Research on Transformer Modeling and Simulation Based on Improved J-A Hysteresis Model. Master’s Thesis, China Three Gorges University, Yichang, China, June 2020. [Google Scholar]
- Jiles, D.C.; Thoelke, J.B.; Devine, M.K. Numerical determination of hysteresis parameters for the modeling of magnetic properties using the theory of ferromagnetic hysteresis. IEEE Trans. Magn. 1992, 28, 27–35. [Google Scholar] [CrossRef]


| Symbol Meaning | Symbol | Value |
|---|---|---|
| Saturation magnetization | Ms | 8.76 × 10⁵ A/m |
| Langevin parameter | a | 4.94 A/m |
| Domain pinning parameter | k | 4.99 A/m |
| Reversible coefficient | c | 0.17 |
| Local field parameters | α | 2.37 × 10⁻⁵ |
Disclaimer/Publisher’s Note: The statements, opinions and data contained in all publications are solely those of the individual author(s) and contributor(s) and not of MDPI and/or the editor(s). MDPI and/or the editor(s) disclaim responsibility for any injury to people or property resulting from any ideas, methods, instructions or products referred to in the content. |
© 2023 by the authors. Licensee MDPI, Basel, Switzerland. This article is an open access article distributed under the terms and conditions of the Creative Commons Attribution (CC BY) license (https://creativecommons.org/licenses/by/4.0/).
Share and Cite
Zhang, C.; Zhang, M.; Li, Y. Measurement and Simulation of Magnetic Properties of Nanocrystalline Alloys under High-Frequency Pulse Excitation. Materials 2023, 16, 2850. https://doi.org/10.3390/ma16072850
Zhang C, Zhang M, Li Y. Measurement and Simulation of Magnetic Properties of Nanocrystalline Alloys under High-Frequency Pulse Excitation. Materials. 2023; 16(7):2850. https://doi.org/10.3390/ma16072850
Chicago/Turabian StyleZhang, Changgeng, Min Zhang, and Yongjian Li. 2023. "Measurement and Simulation of Magnetic Properties of Nanocrystalline Alloys under High-Frequency Pulse Excitation" Materials 16, no. 7: 2850. https://doi.org/10.3390/ma16072850
APA StyleZhang, C., Zhang, M., & Li, Y. (2023). Measurement and Simulation of Magnetic Properties of Nanocrystalline Alloys under High-Frequency Pulse Excitation. Materials, 16(7), 2850. https://doi.org/10.3390/ma16072850