

The Impact of Laser Beam Power on the Microstructure and Some Mechanical Properties of Laser-Alloyed Inconel®600 with WC Particles


Abstract
:1. Introduction
2. Material and Methods
2.1. Materials
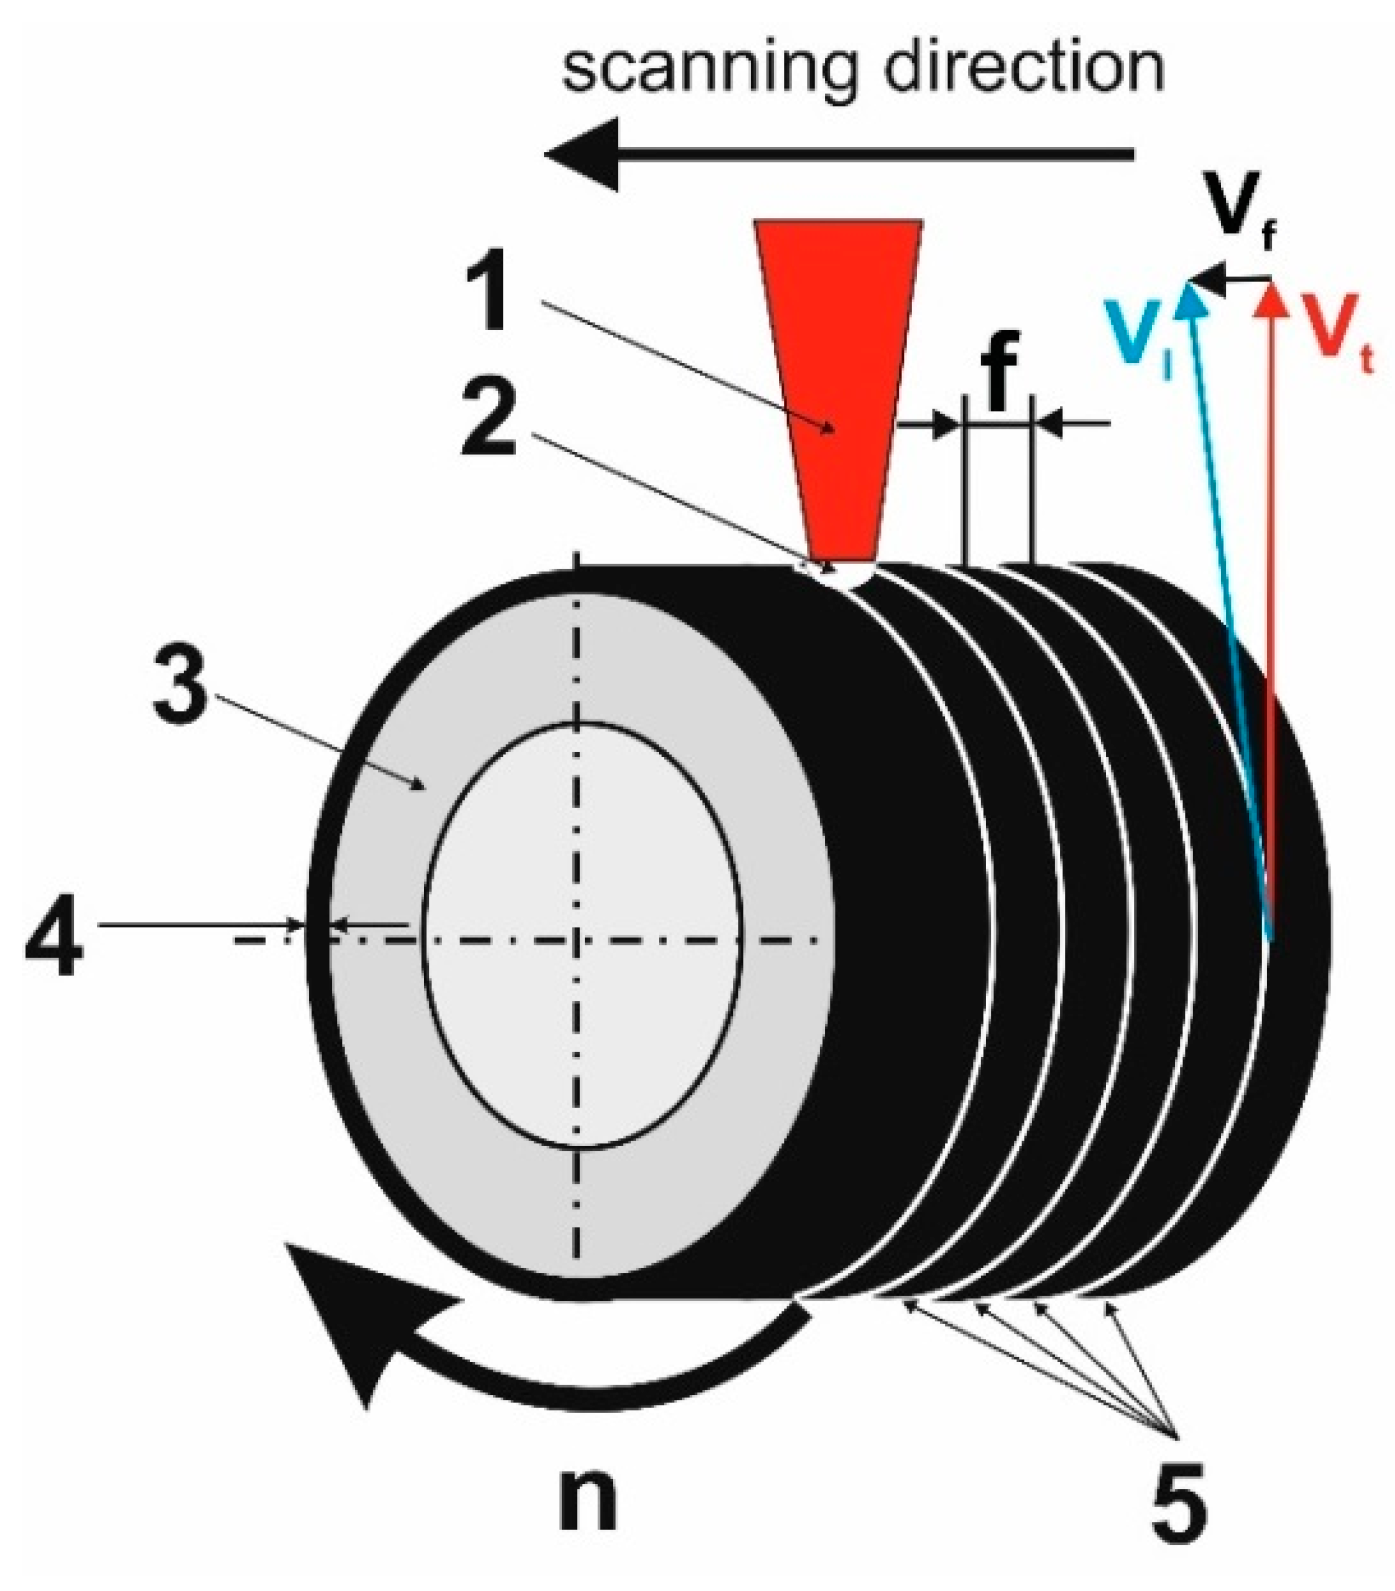
2.2. Laser Alloying
2.3. Microstructure Observations and Property Characterization
3. Results and Discussion
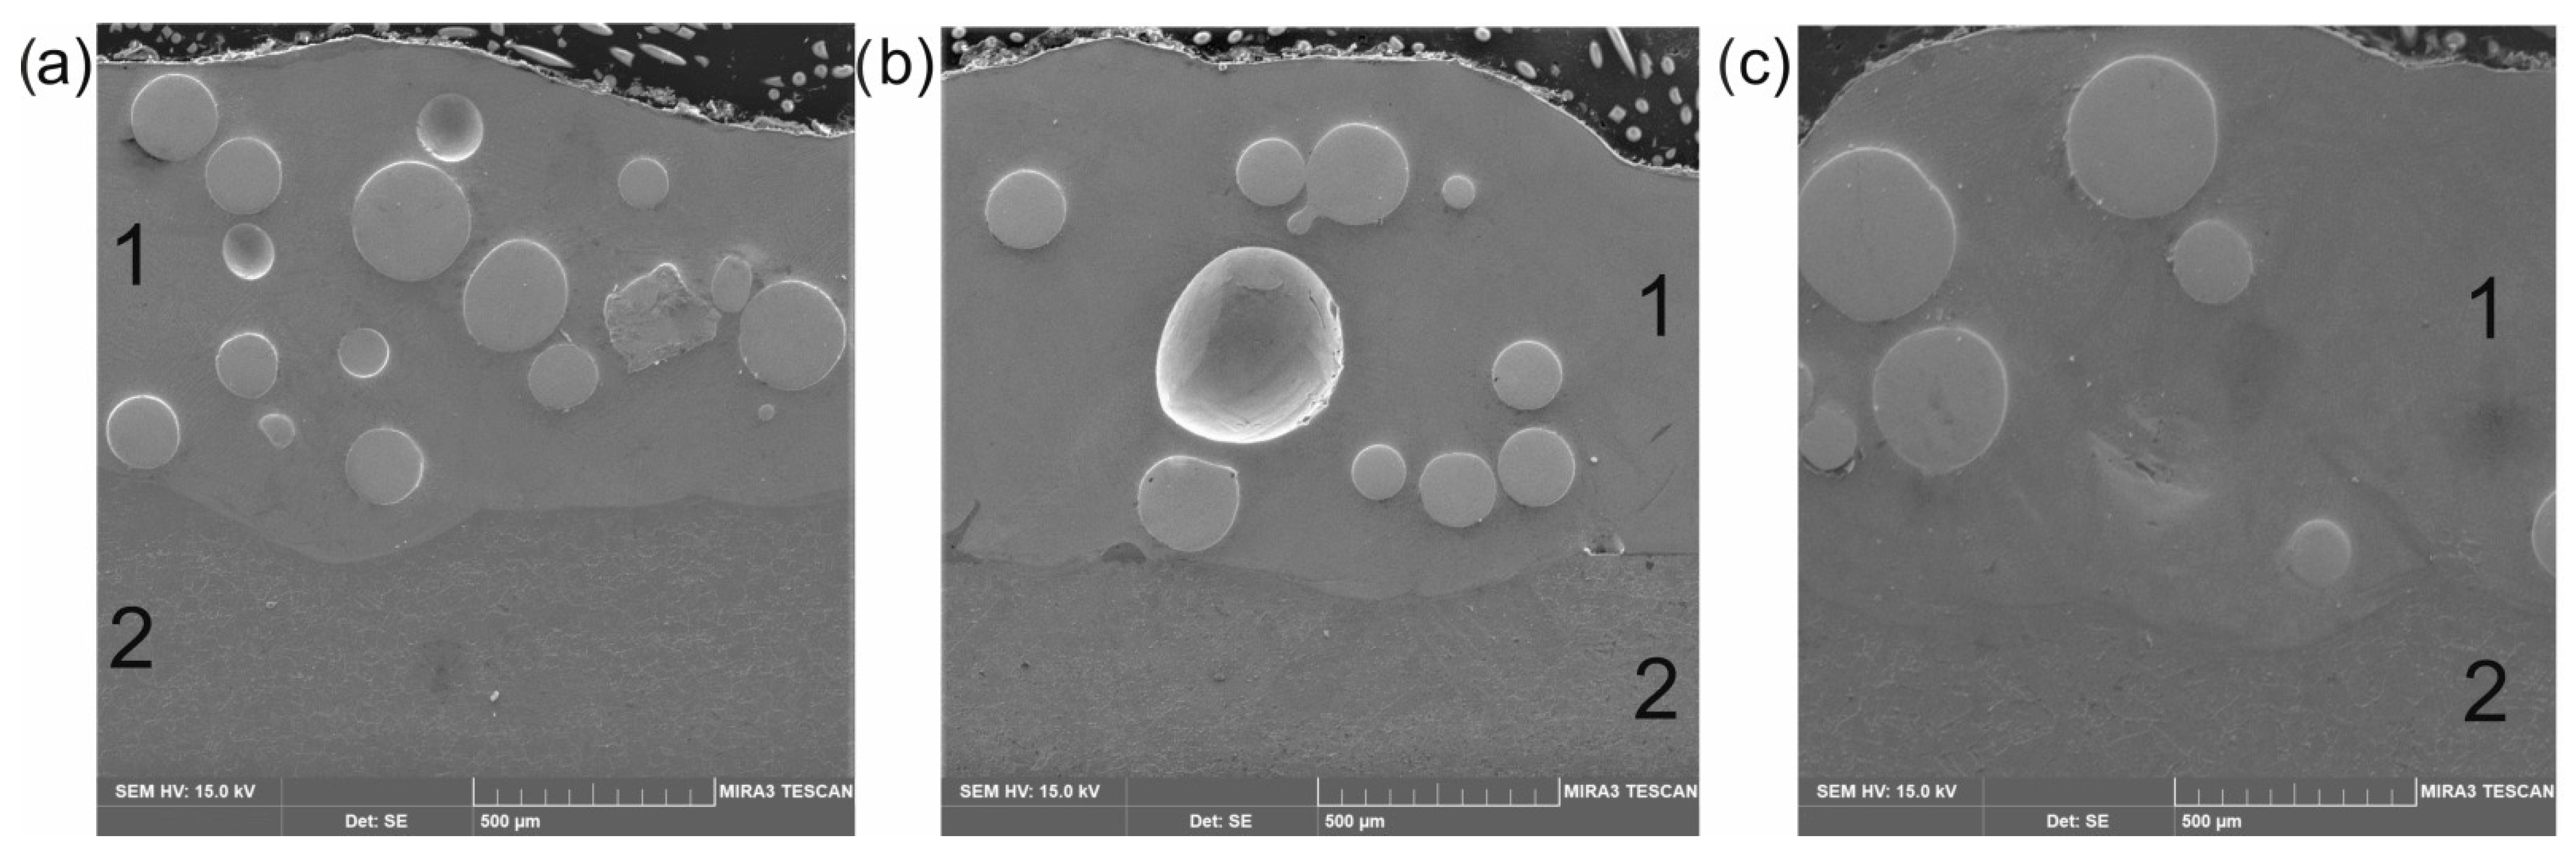
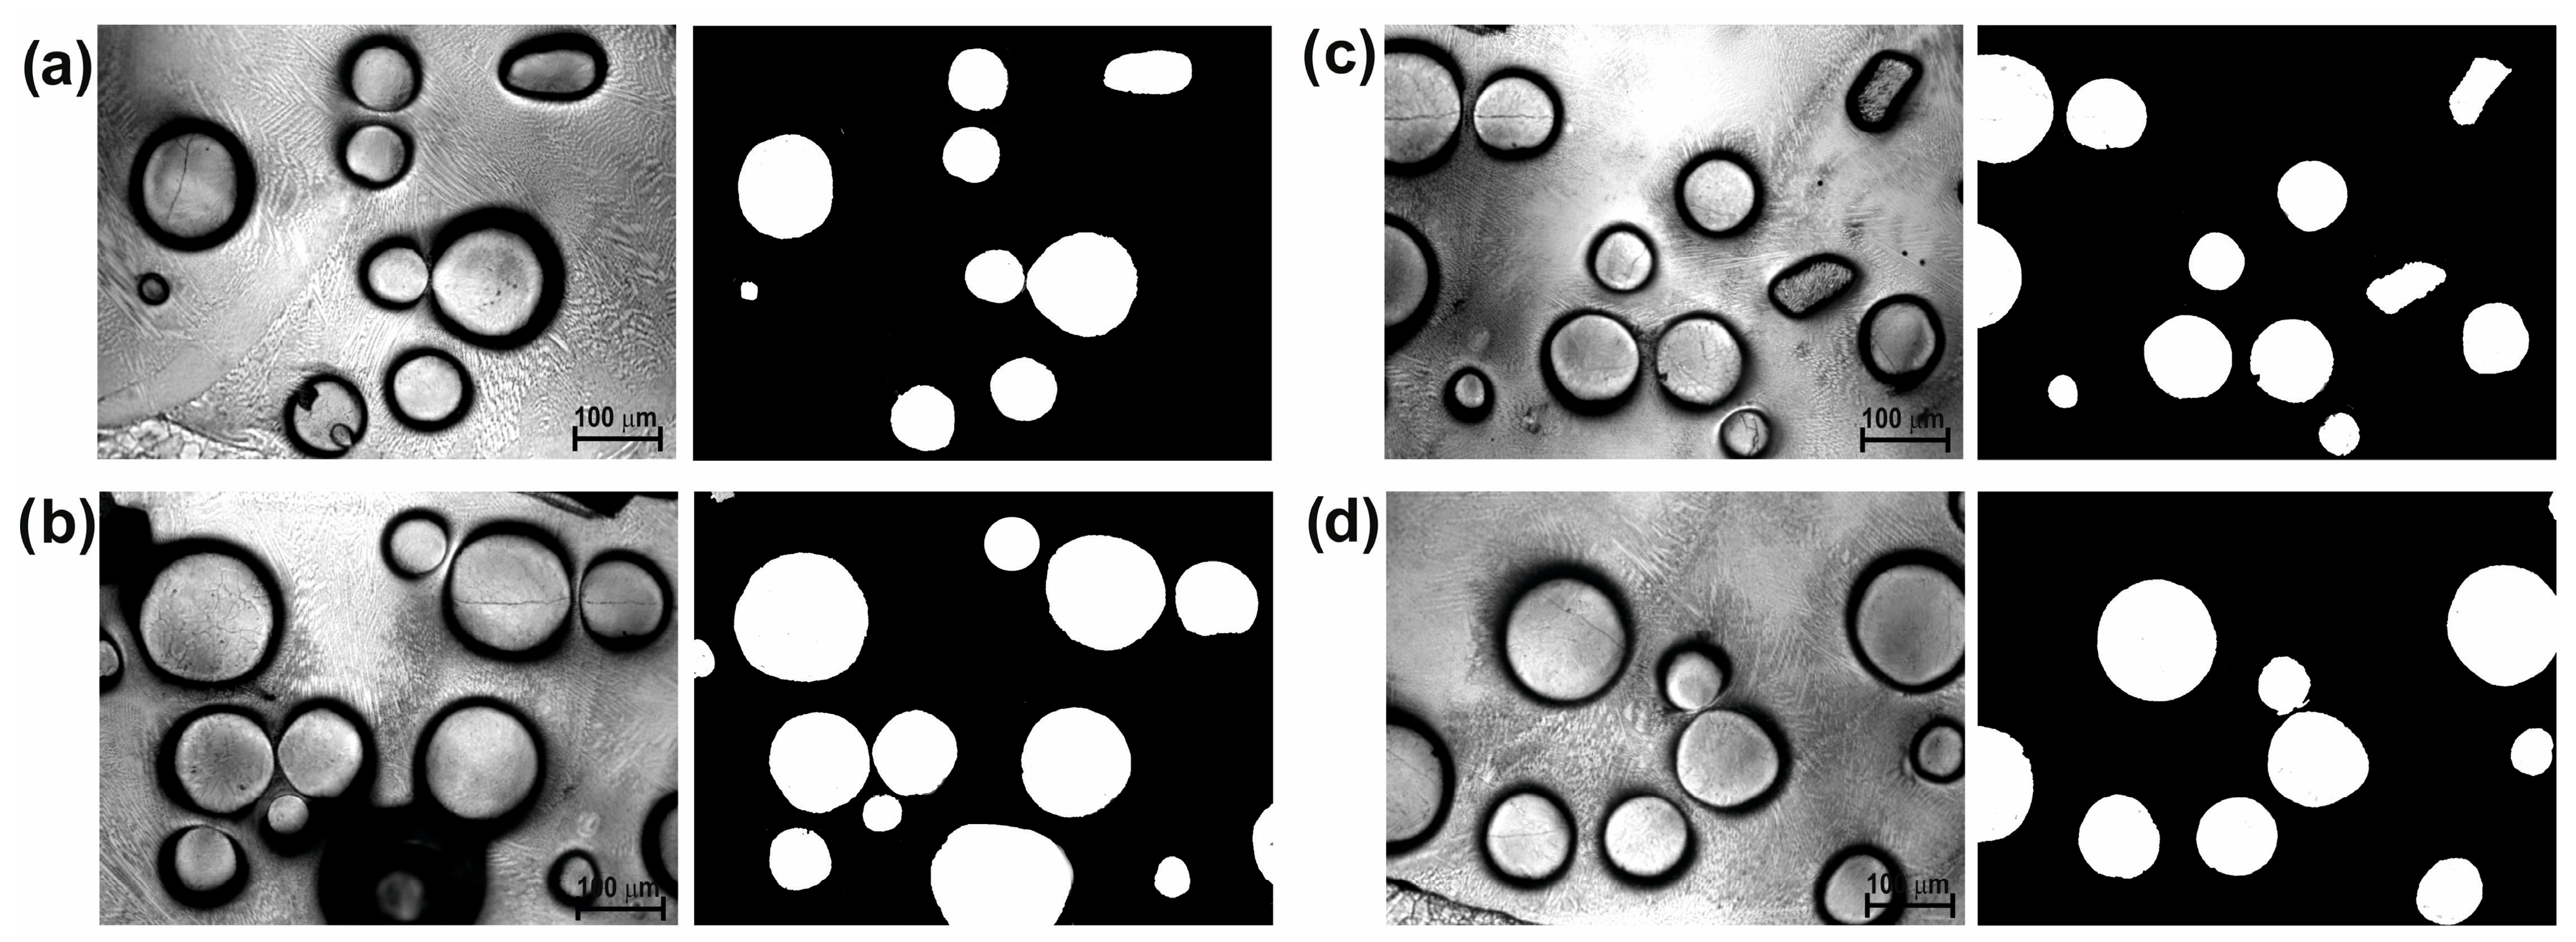
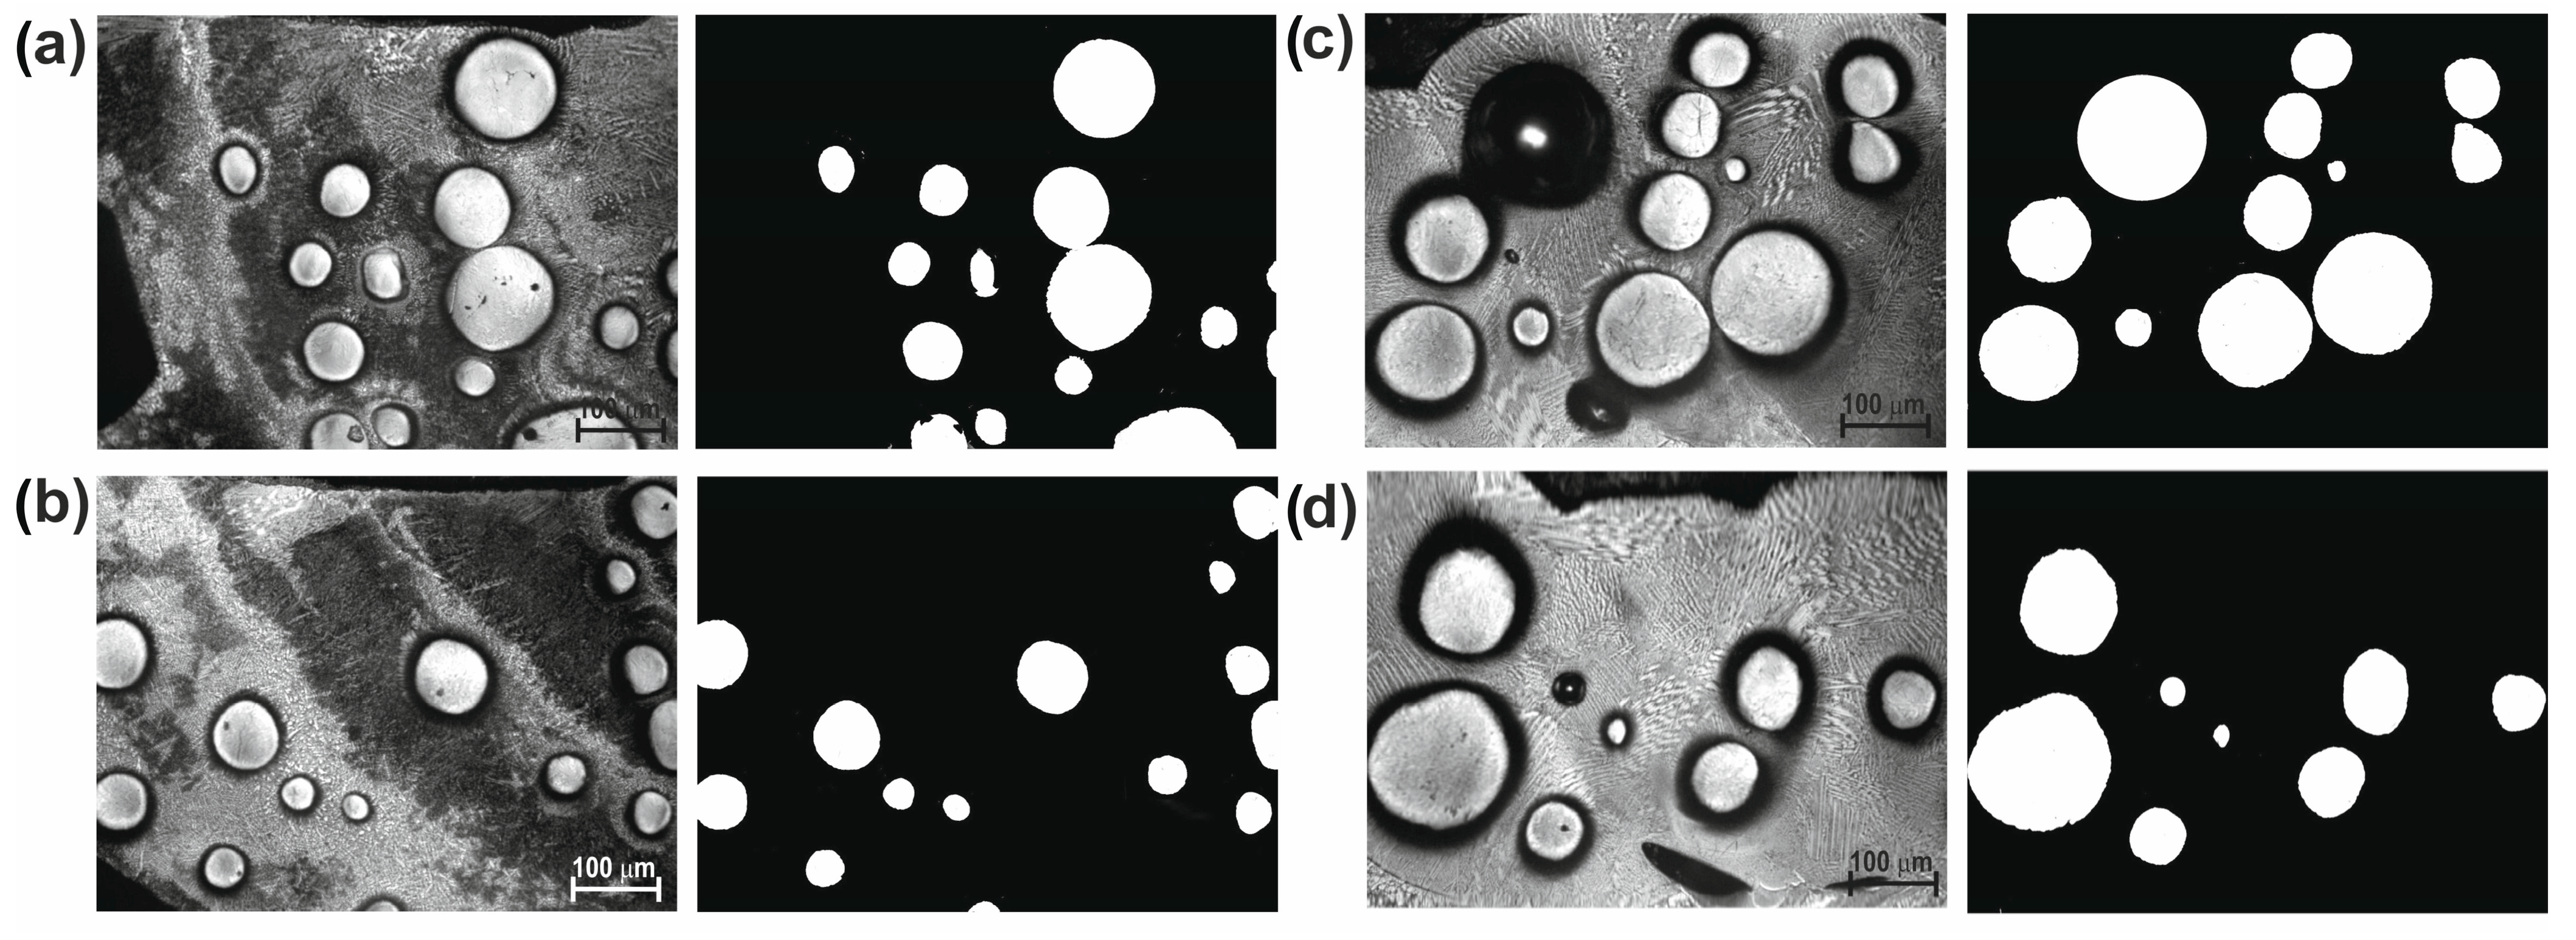
3.1. Microstructure of Laser-Alloyed Layers
3.2. Microhardness Profiles
3.3. Nanomechanical Properties
3.4. Wear Resistance
3.5. The Specifics of Wear Behavior
4. Summary and Conclusions
- (1)
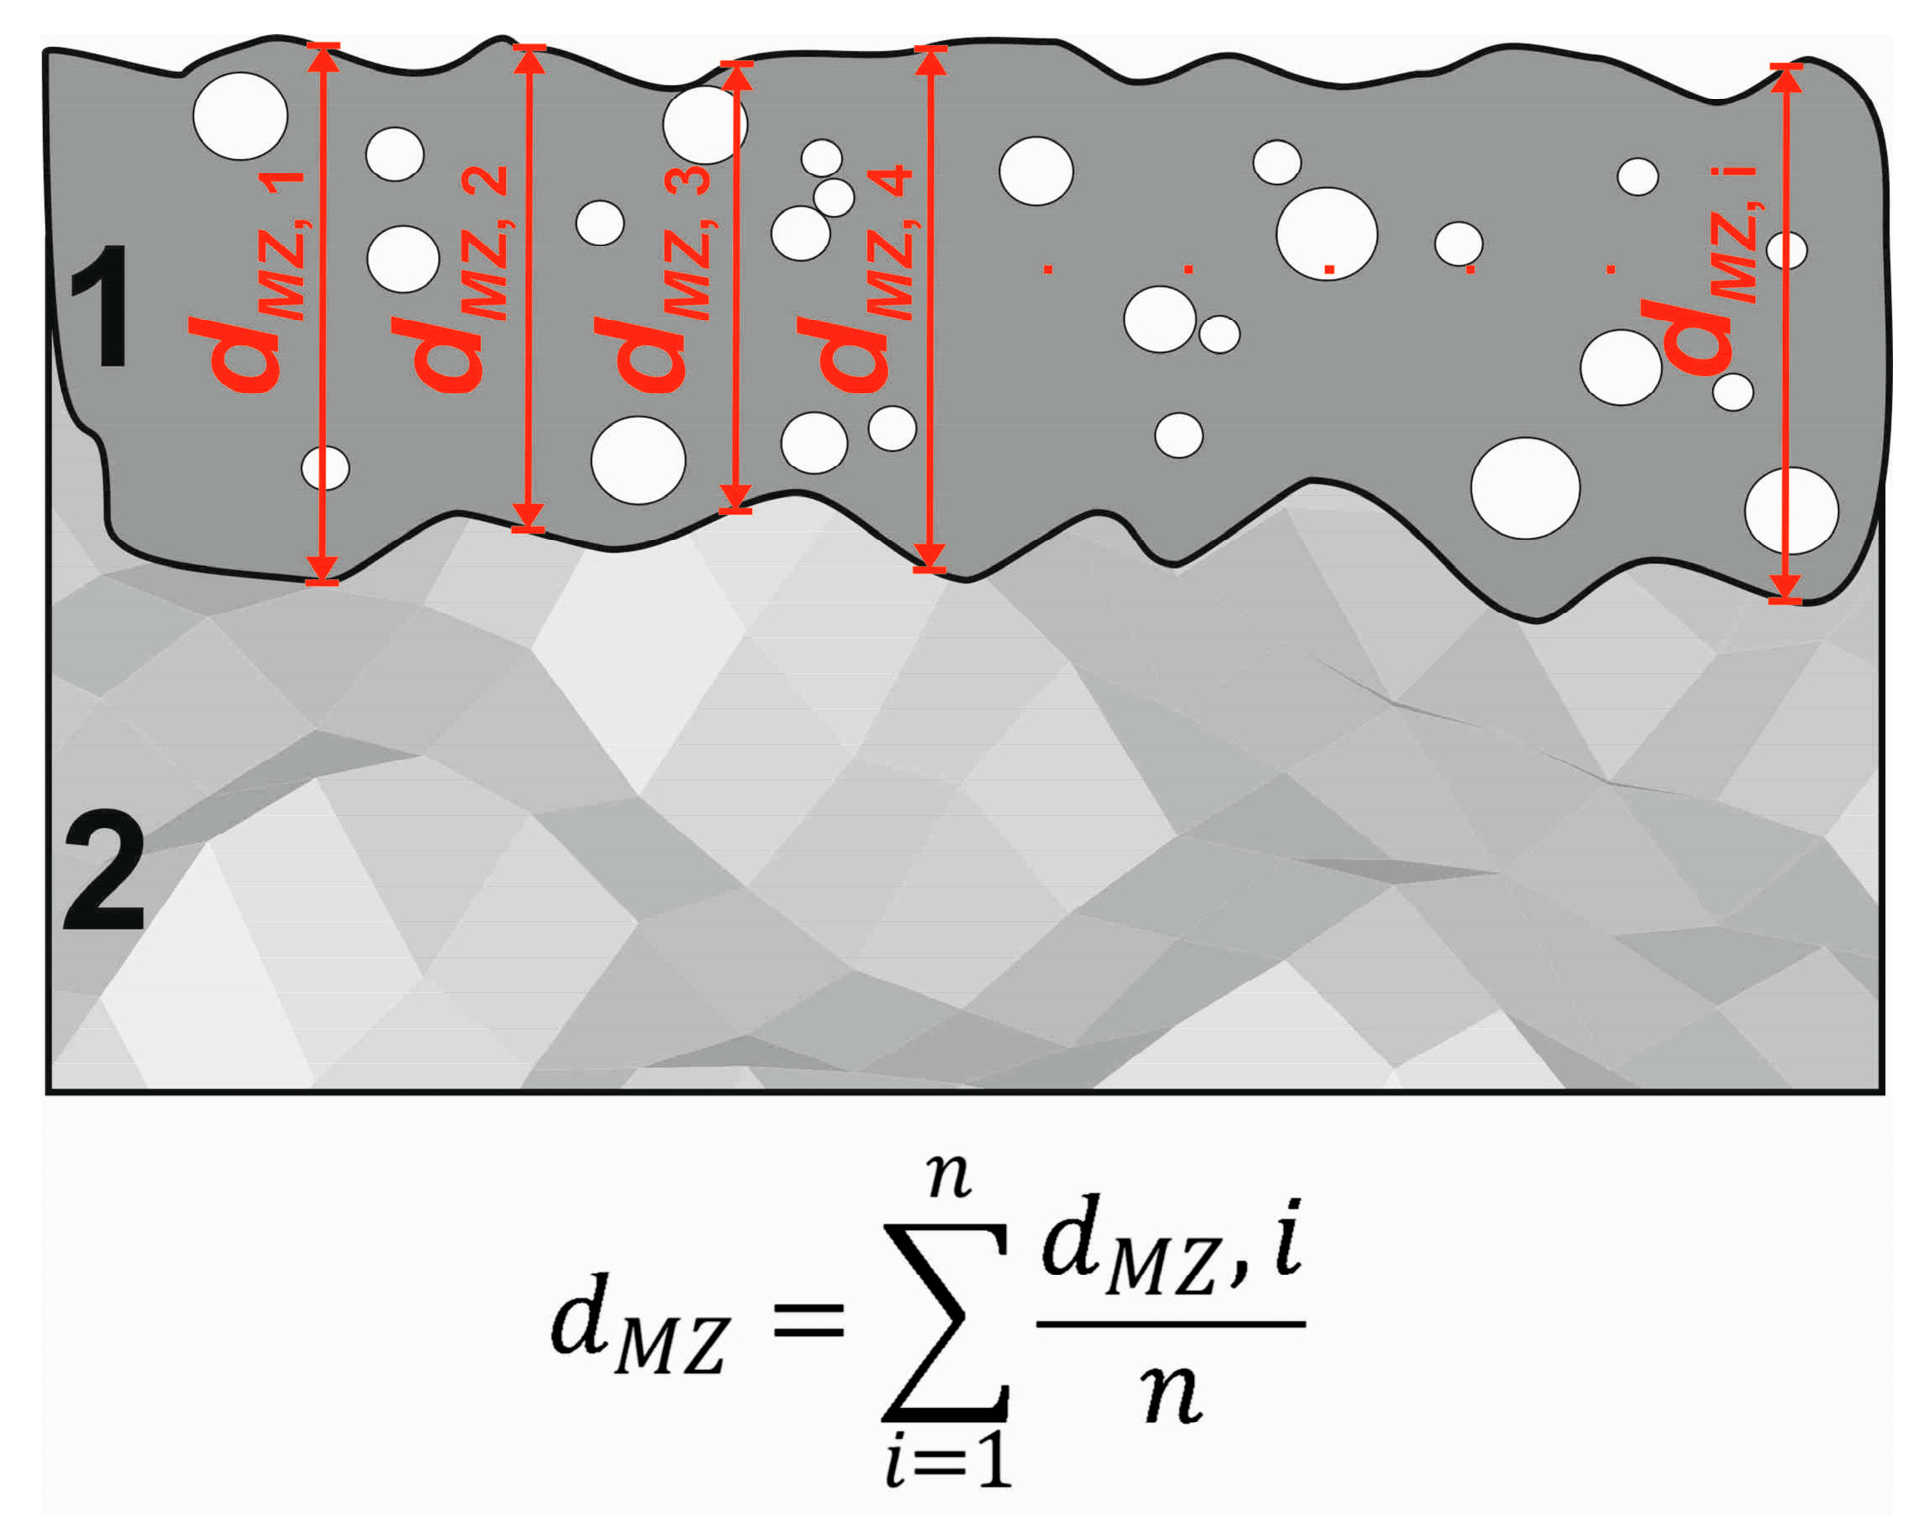
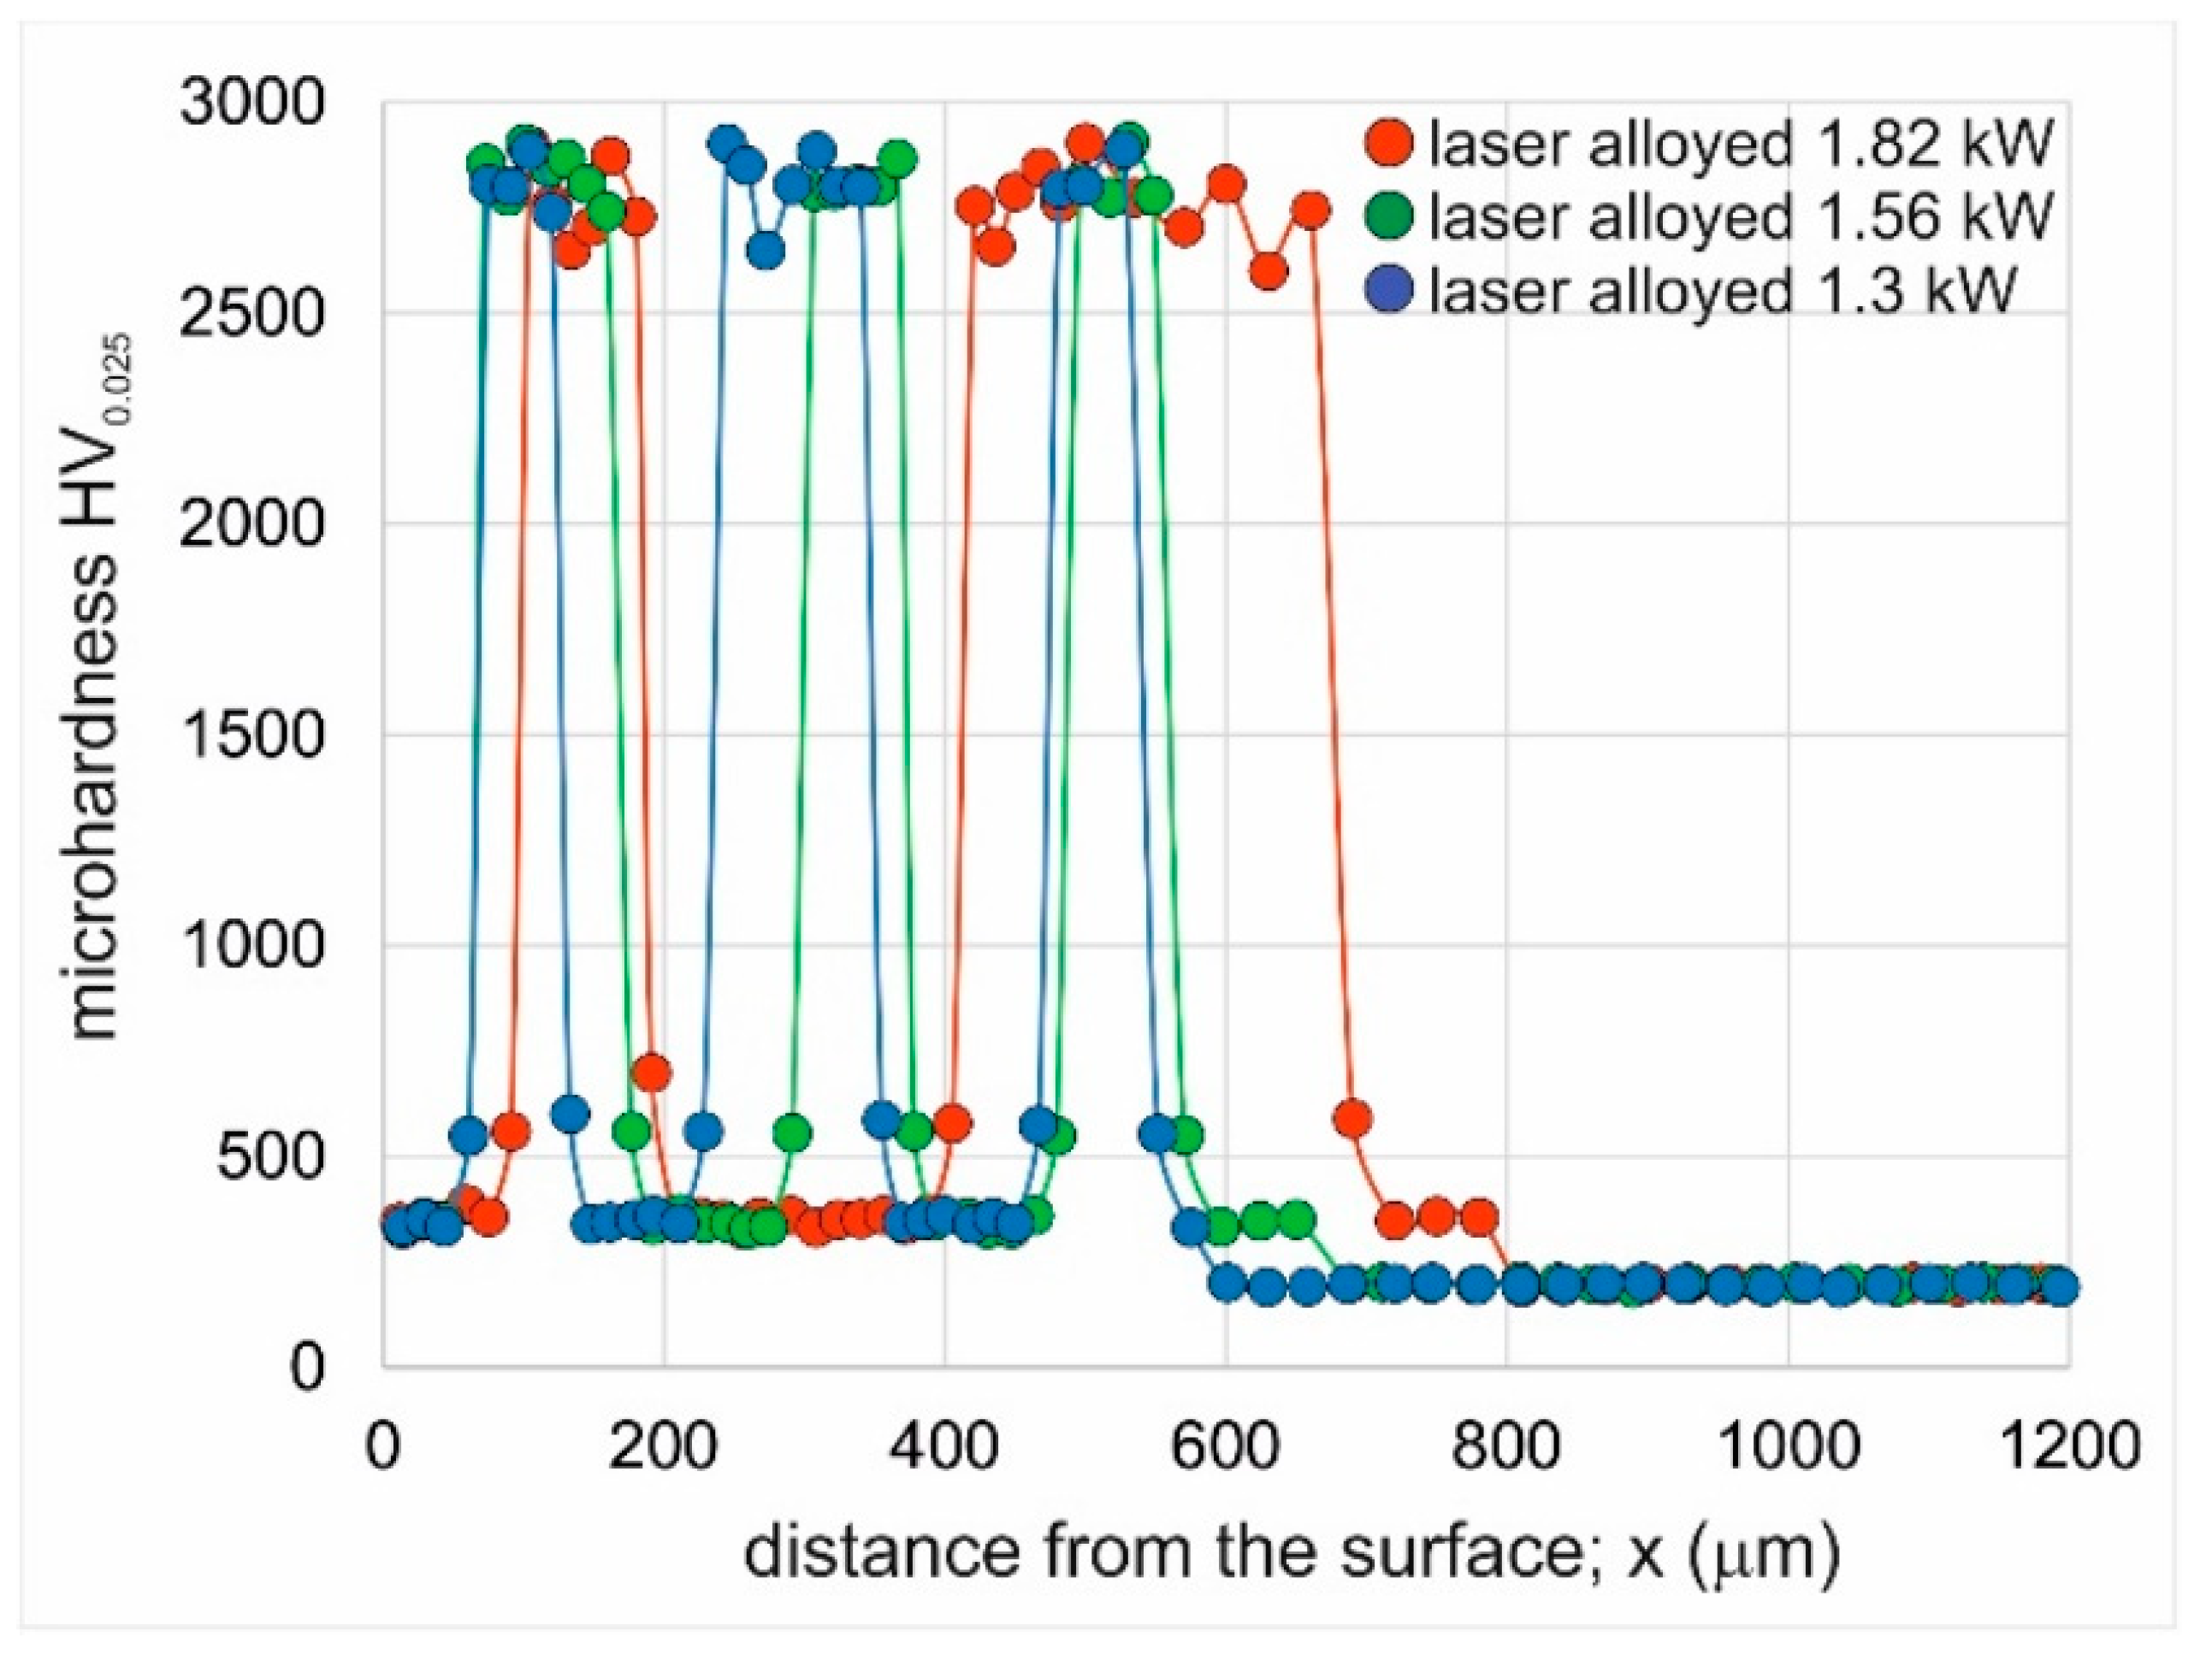
- The laser beam power used during laser treatment influenced the thickness of the produced layers. The increase in the laser beam power from 1.3 kW to 1.82 kW was accompanied by an increase in the average thickness of the laser-alloyed layer from 435 µm to 685 µm.
- (2)
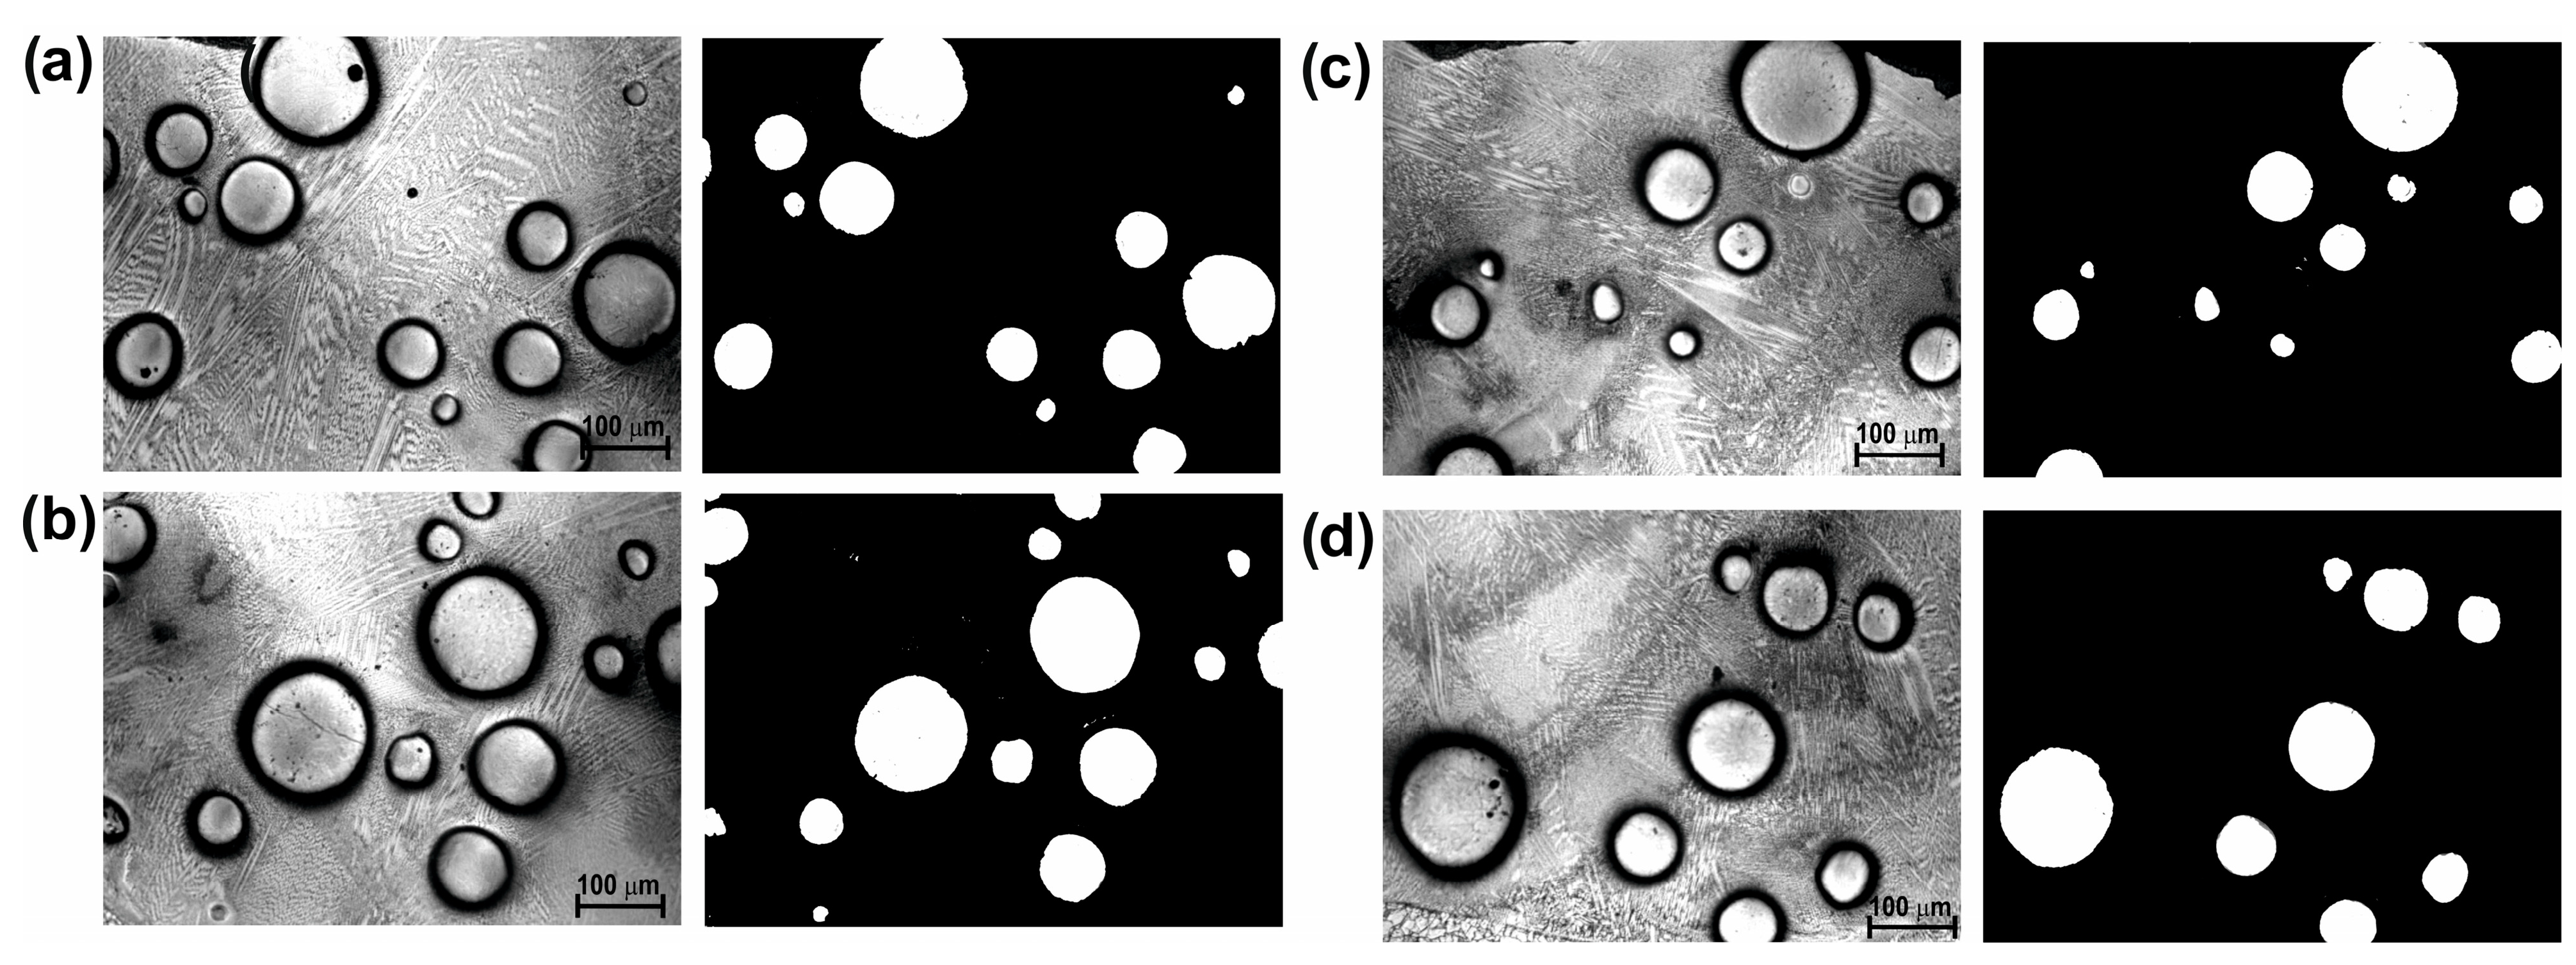
- An increase in laser beam power resulted in a decrease in the percentage of WC particles in the laser-alloyed layer. The layer produced with a laser beam power of 1.3 kW contained an average of 20.59% WC particles. Increasing the power to 1.82 kW provided a WC particle content of approximately 9.46%.
- (3)
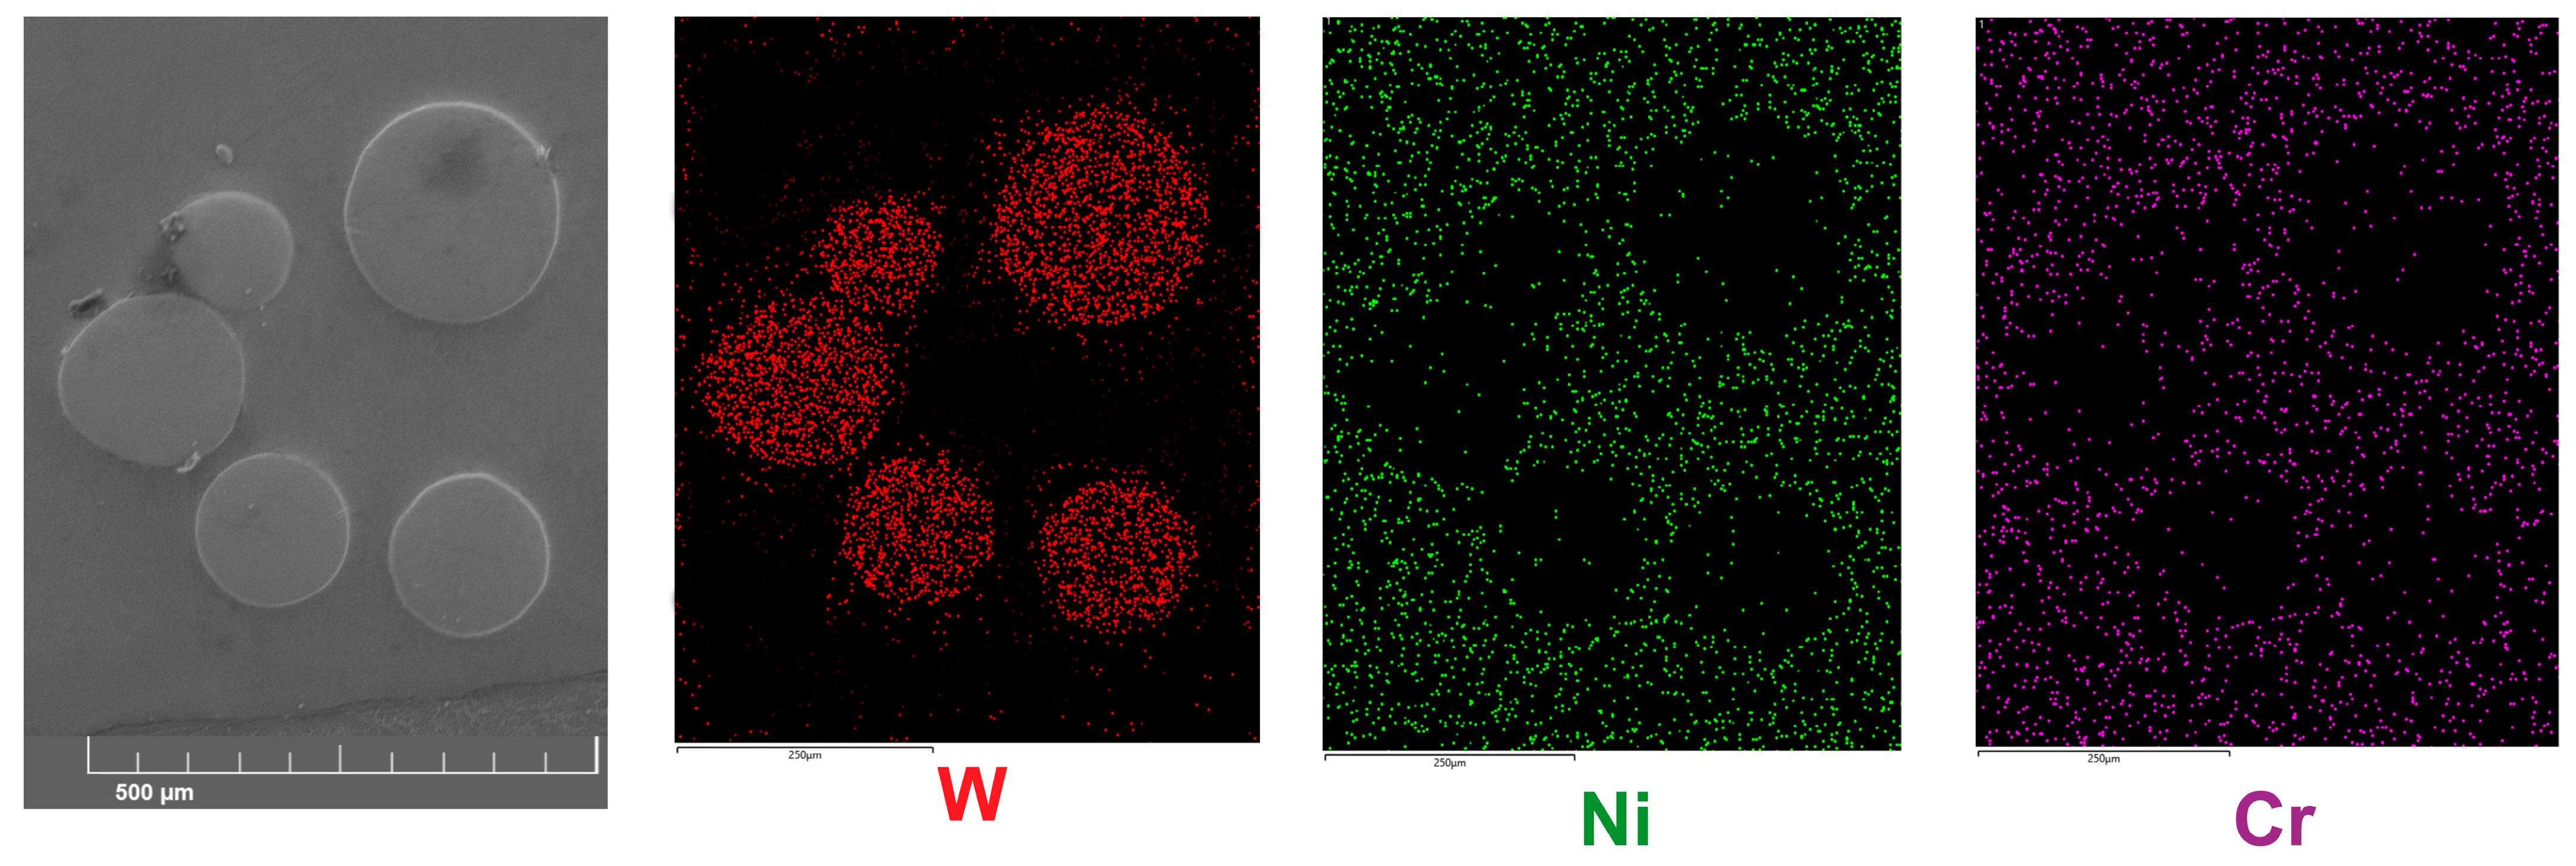
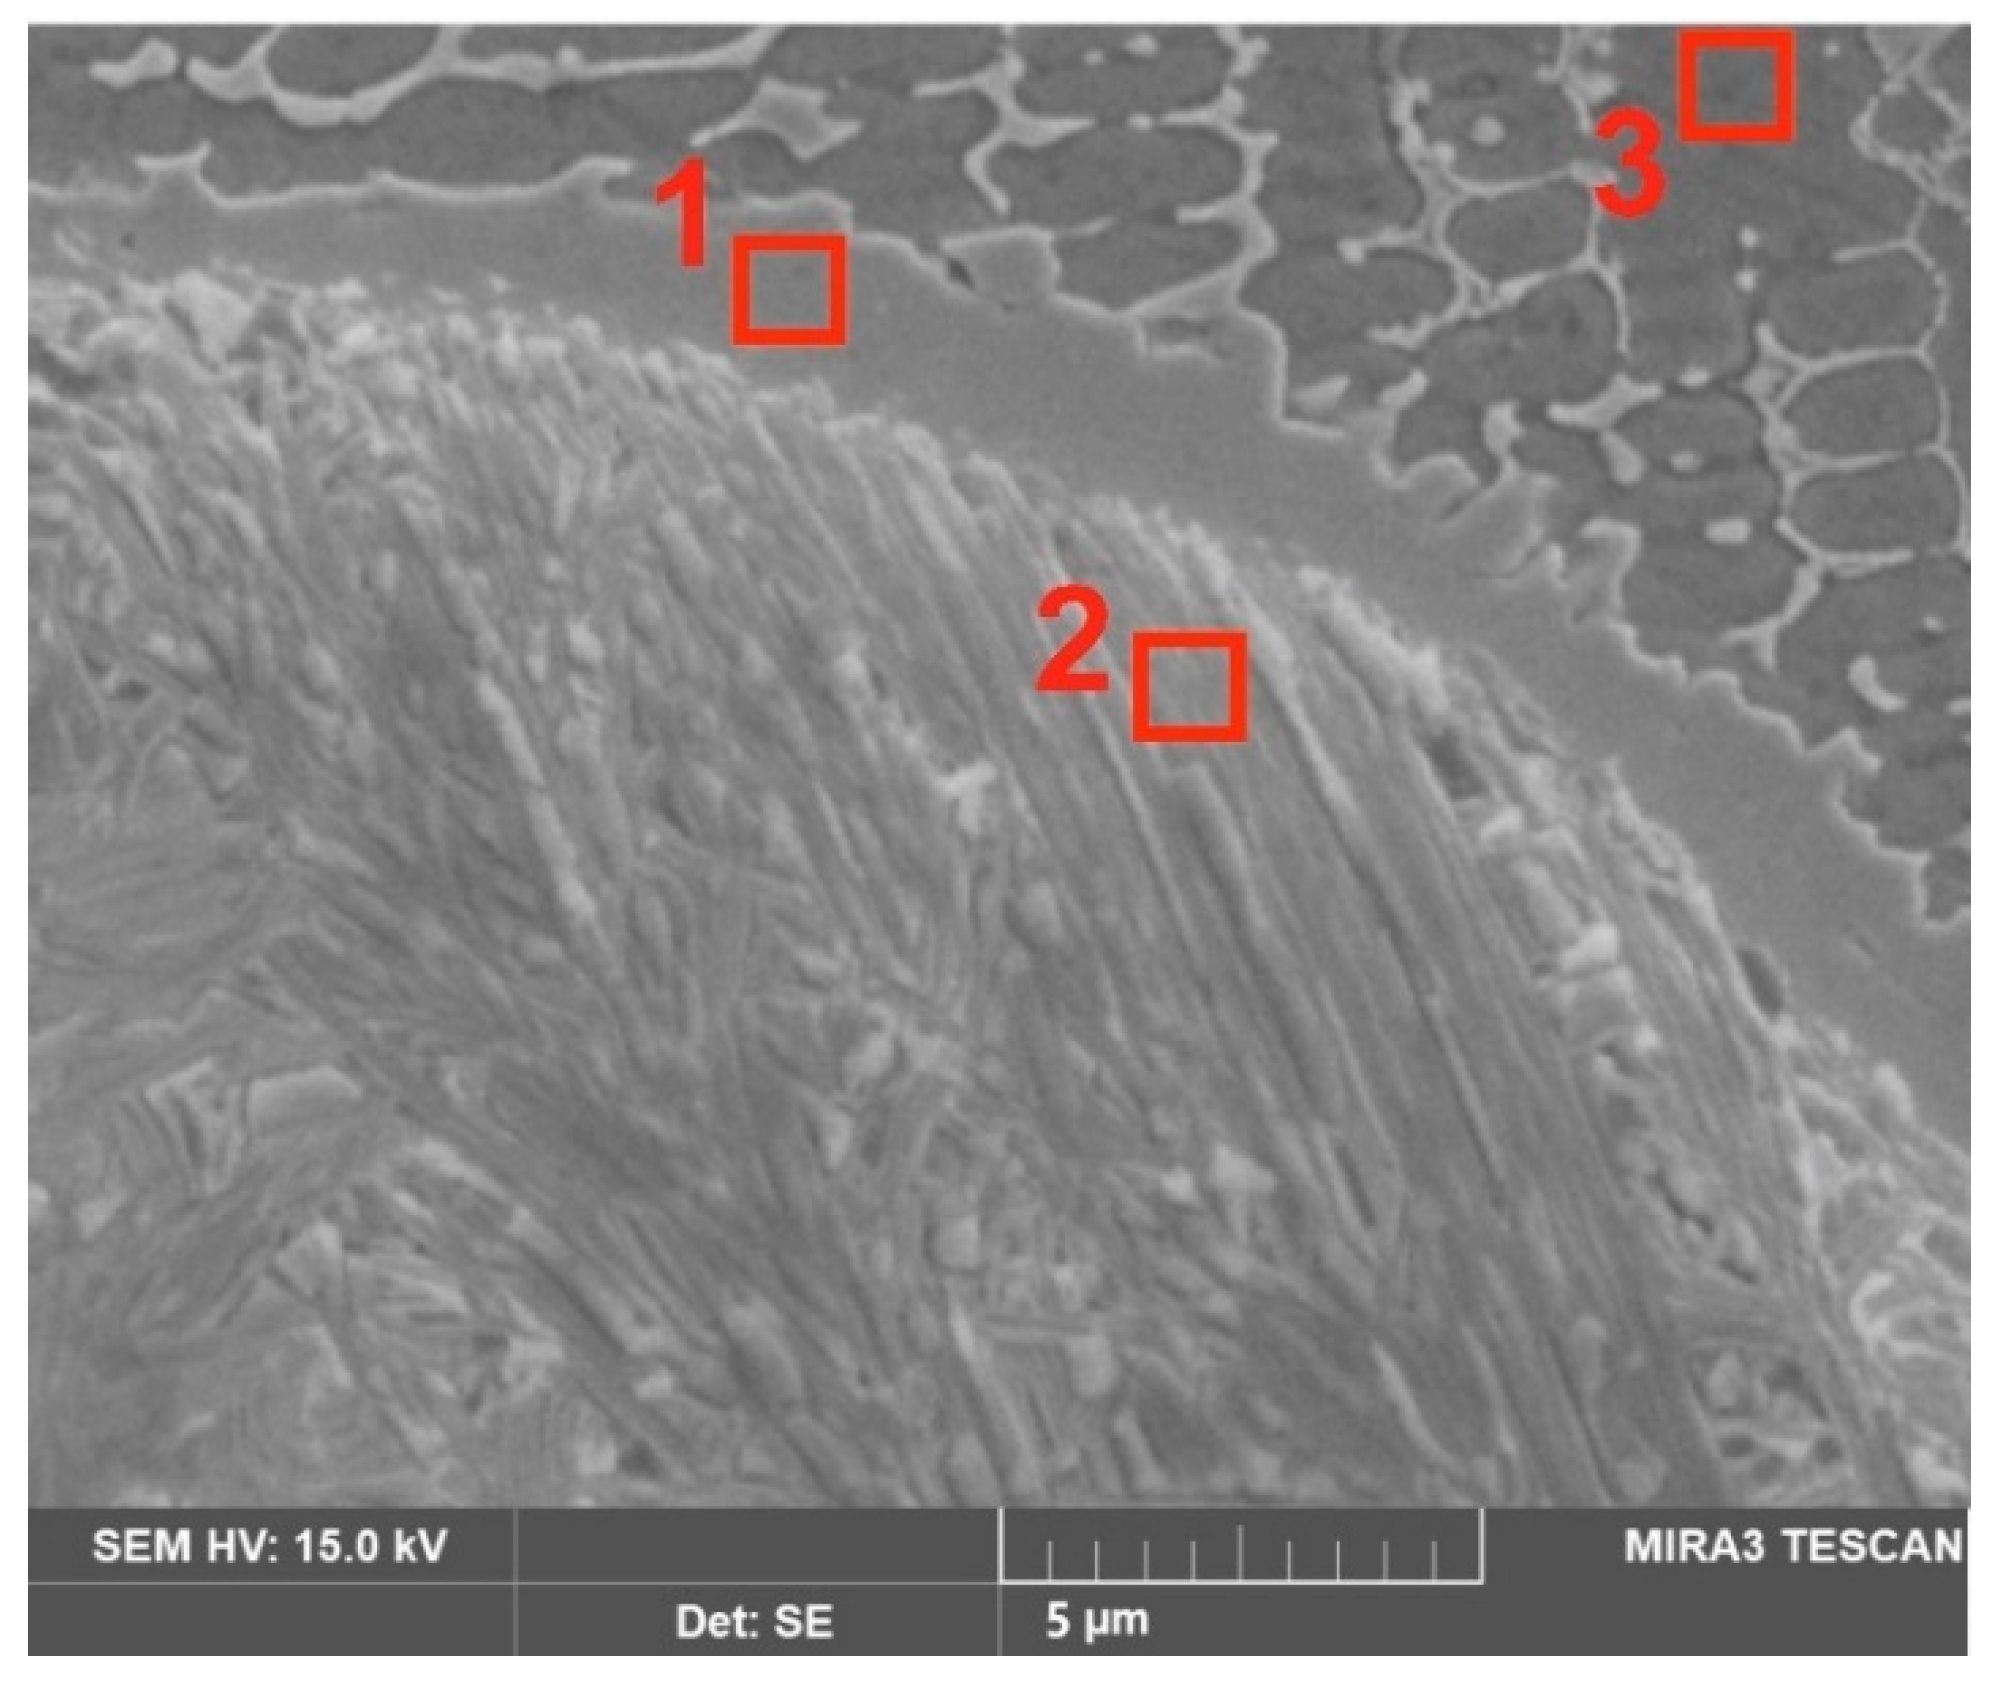
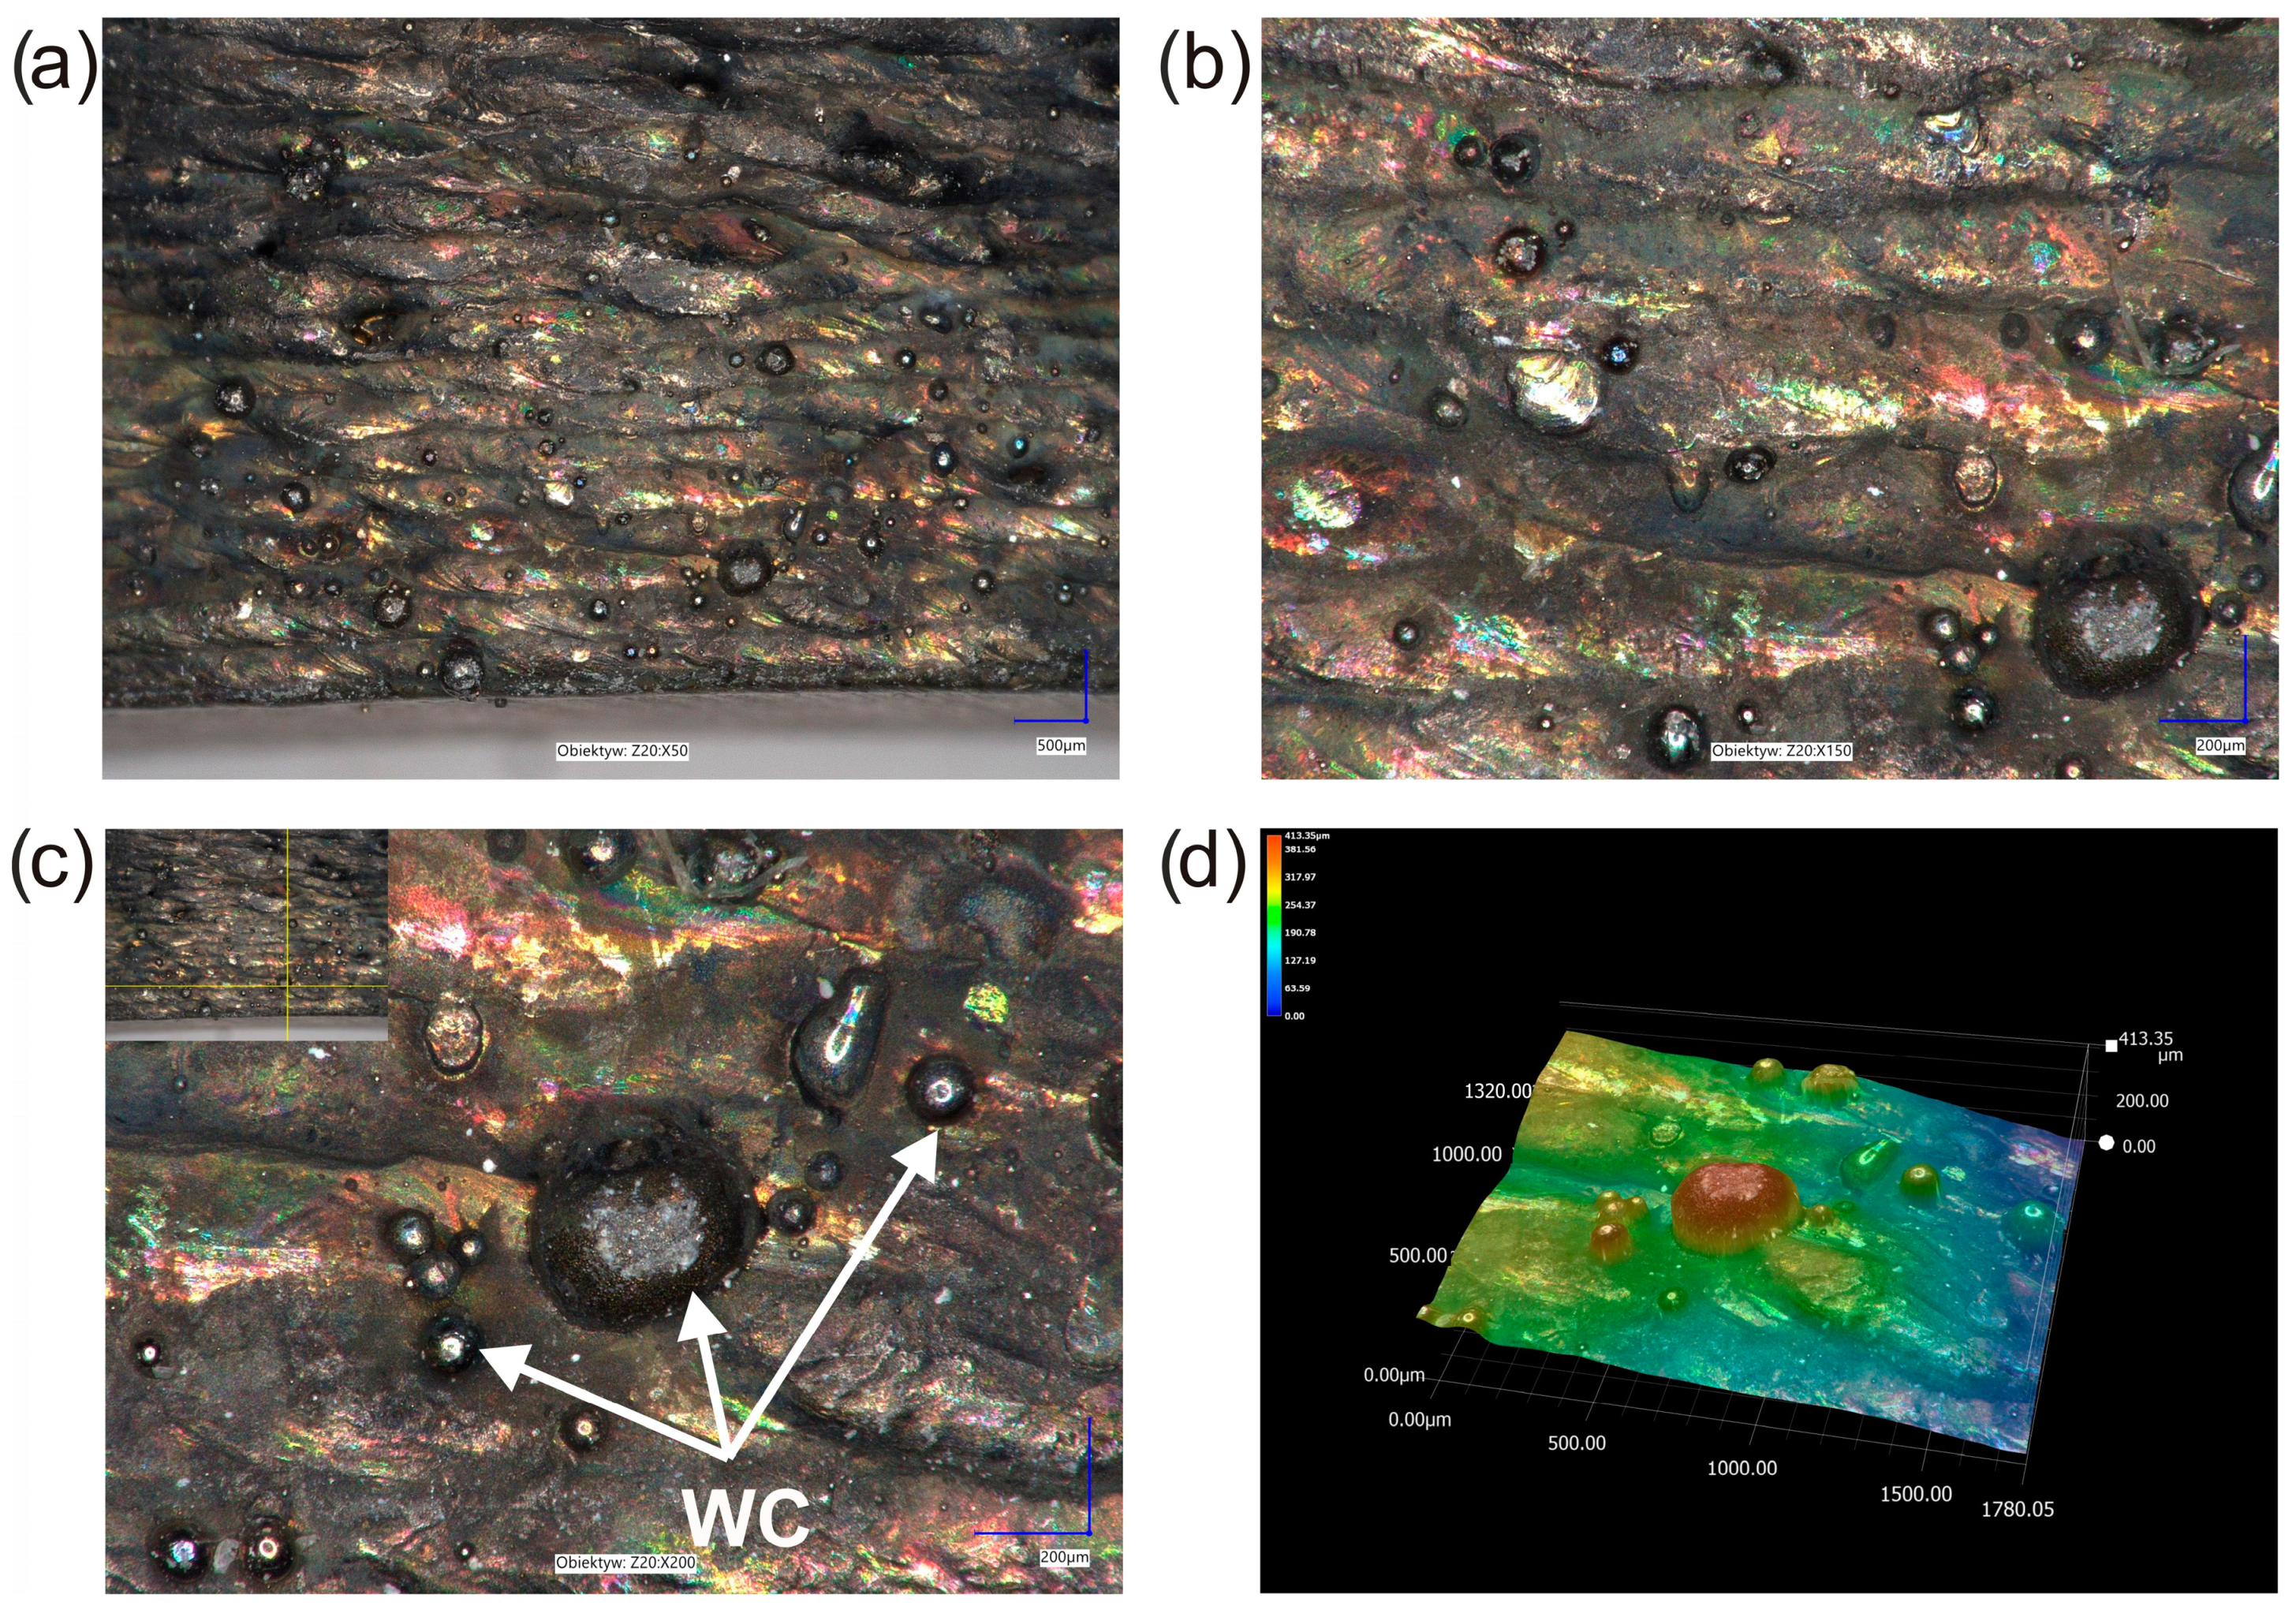
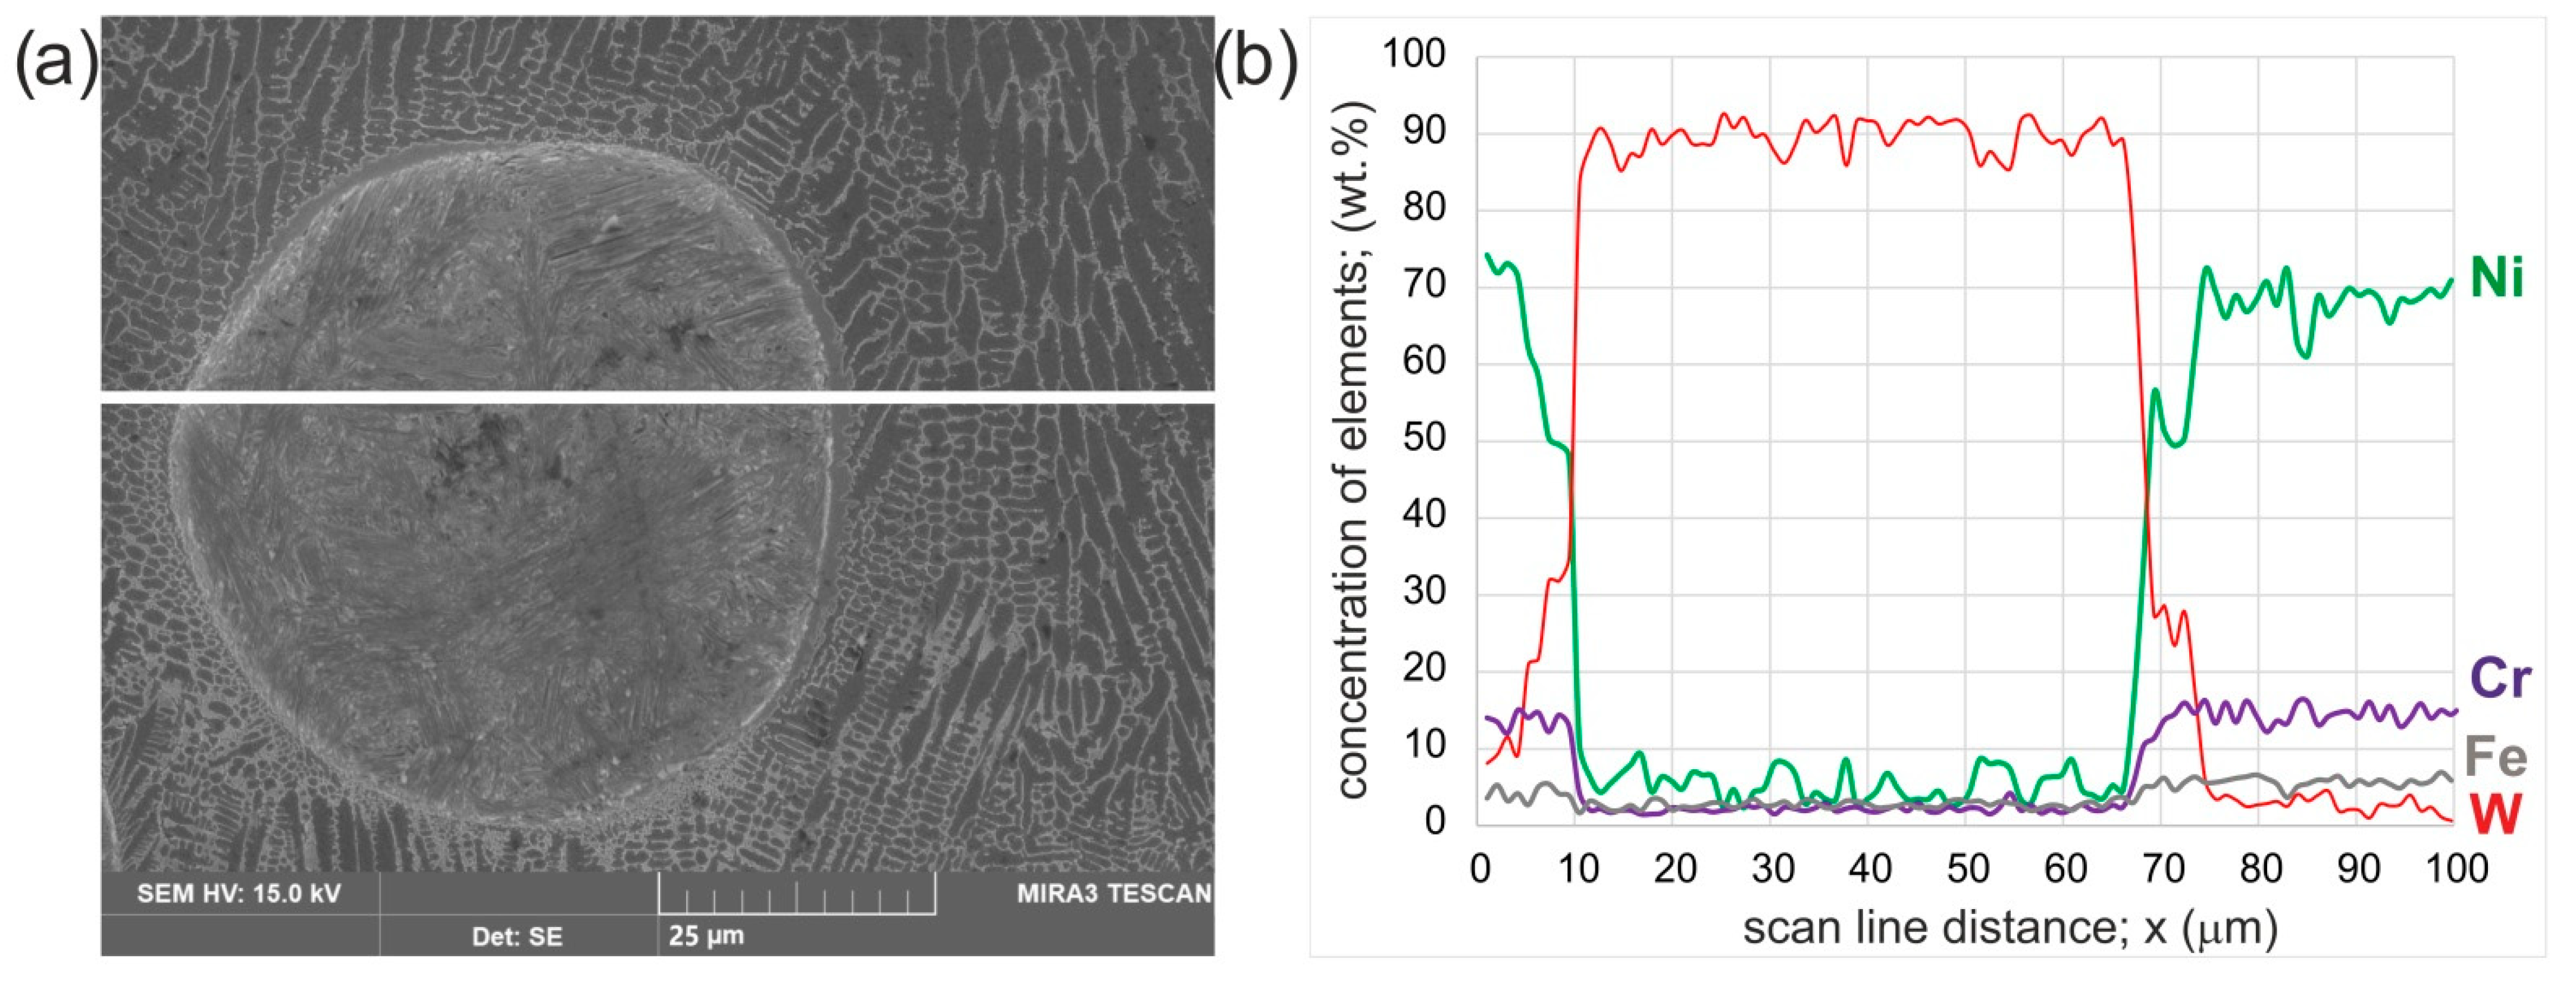
- WC particles did not decompose during laser treatment; they were therefore characterized by high hardness (2600–2900 HV0.025). Only in the region at the boundary between the WC particle and the matrix of the laser-alloyed layer were there signs of the occurrence of partial decomposition of WC. This was confirmed by the EDS microanalysis and the lower hardness of this region (548–690 HV0.025).
- (4)
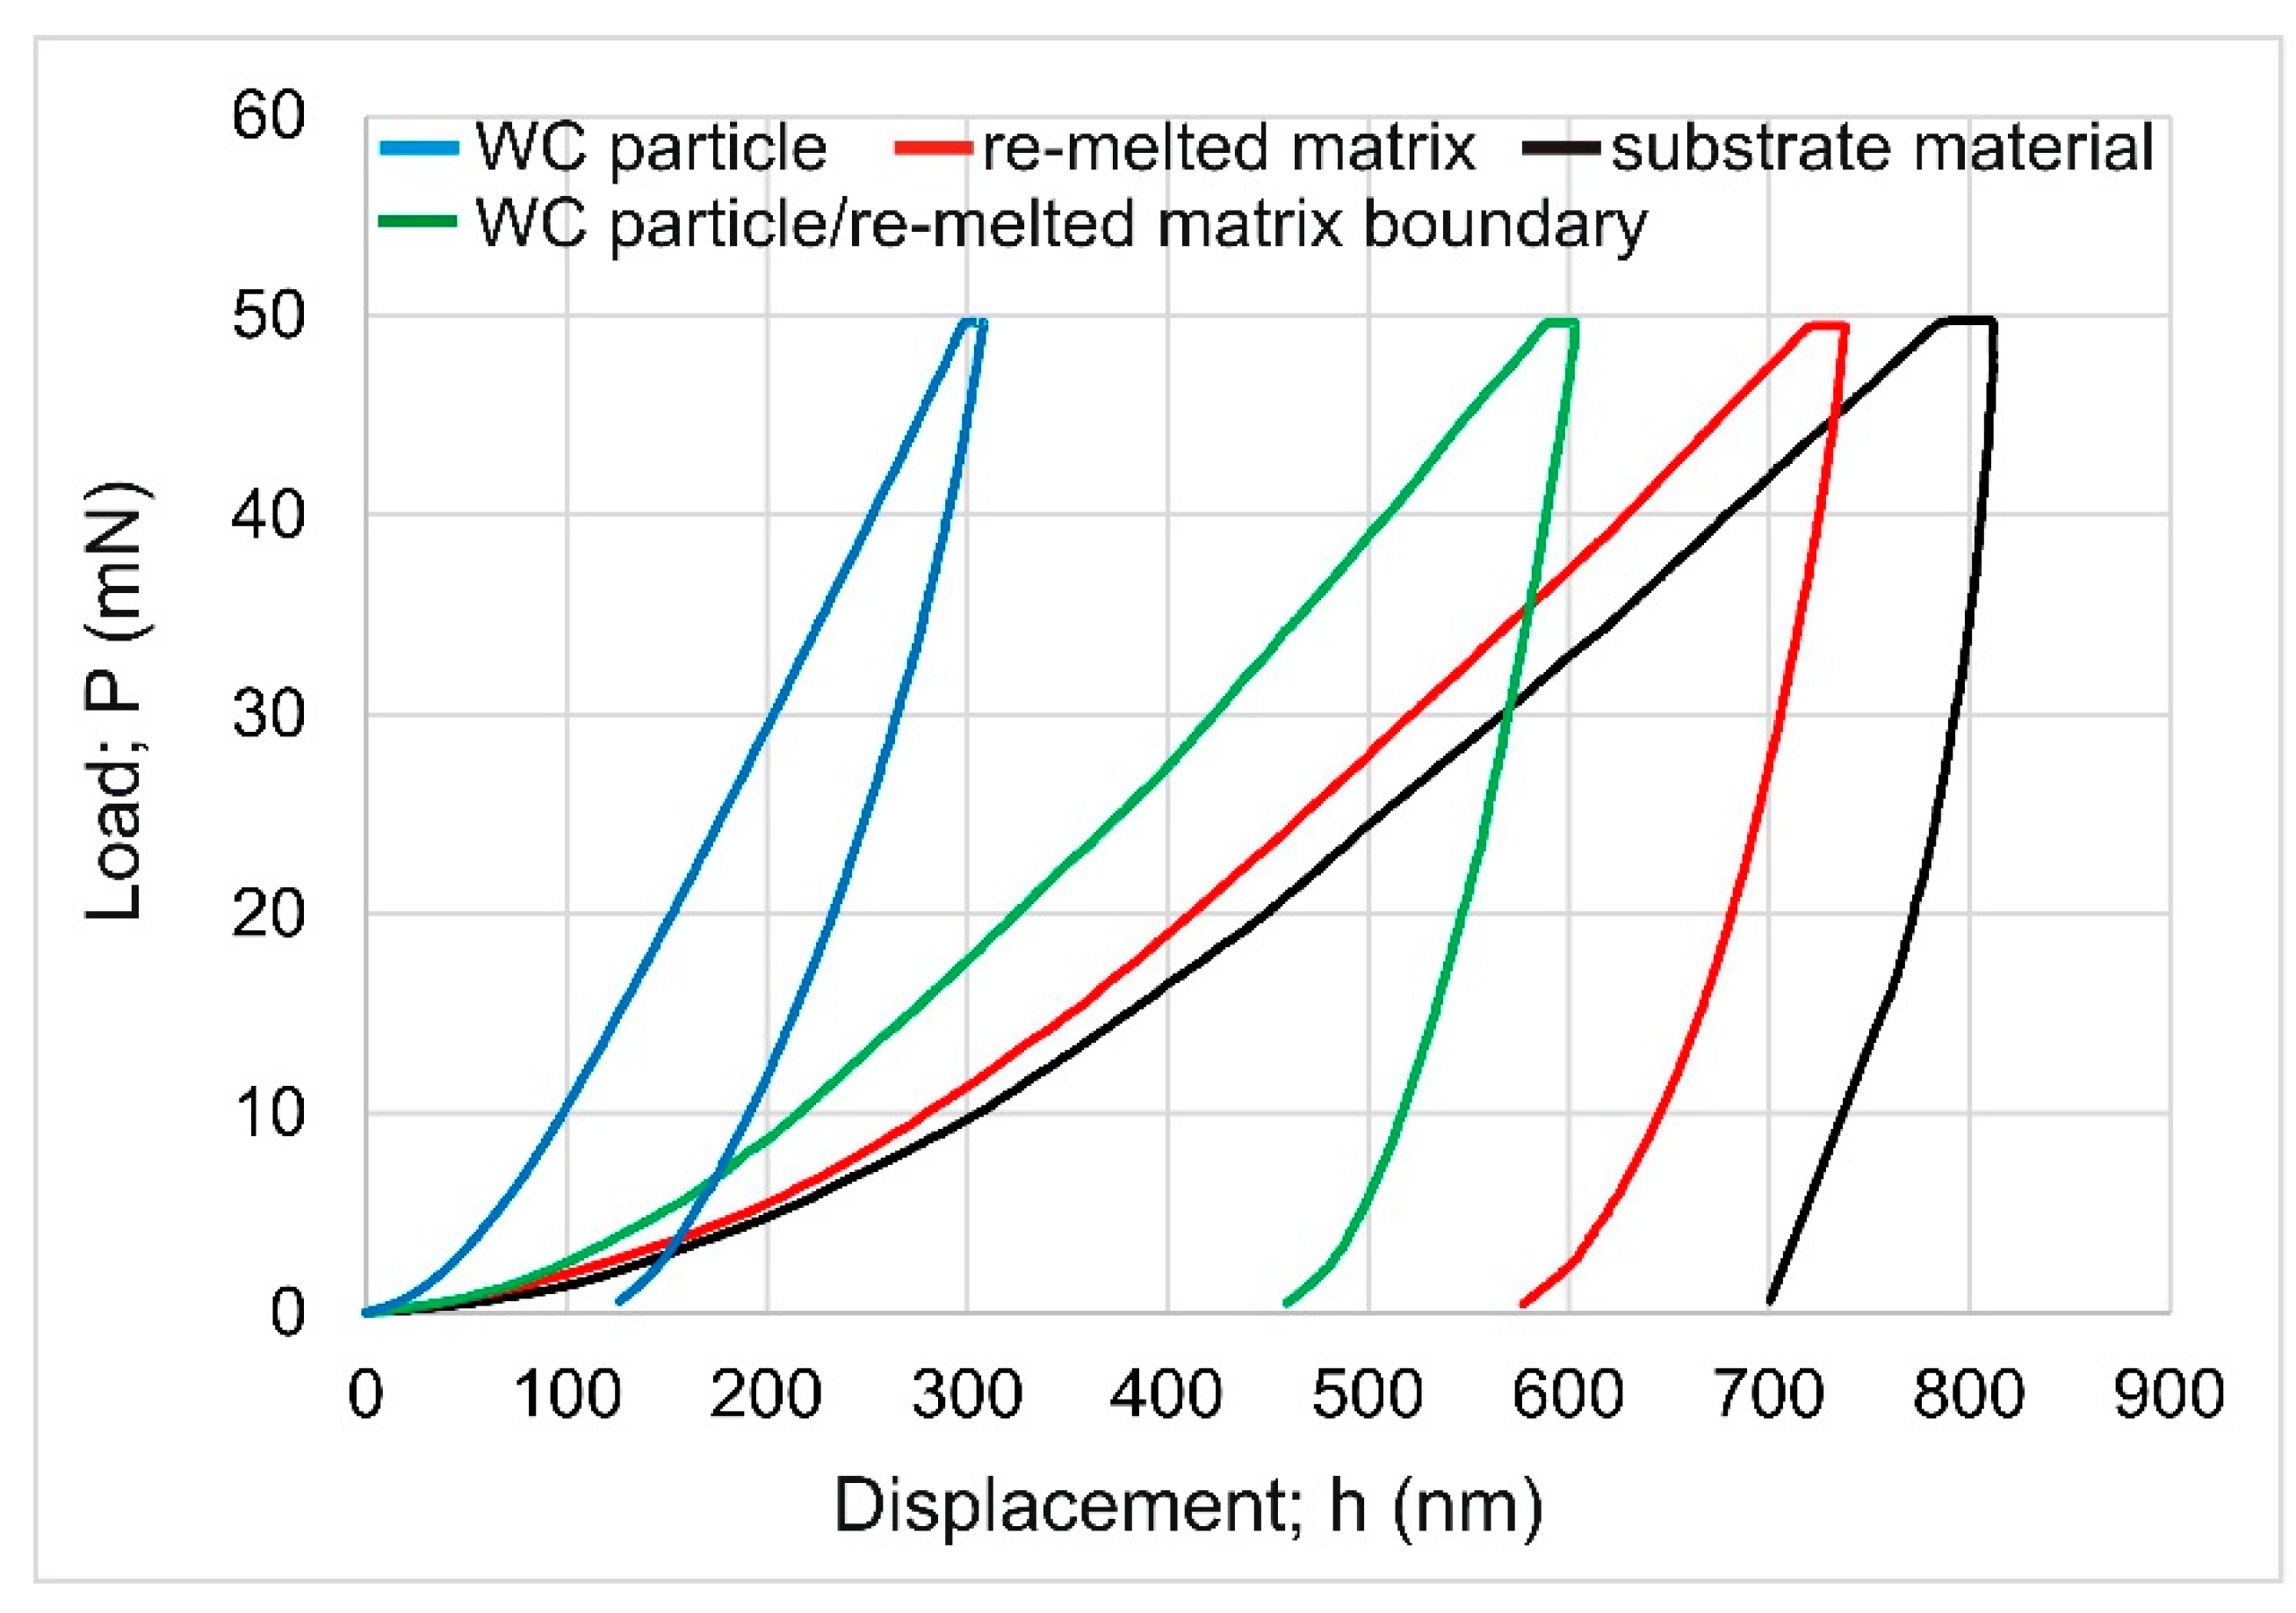
- WC particles were strengthening phases with high indentation hardness (31.25 GPa) and indentation Young’s modulus (609.33 GPa).
- (5)
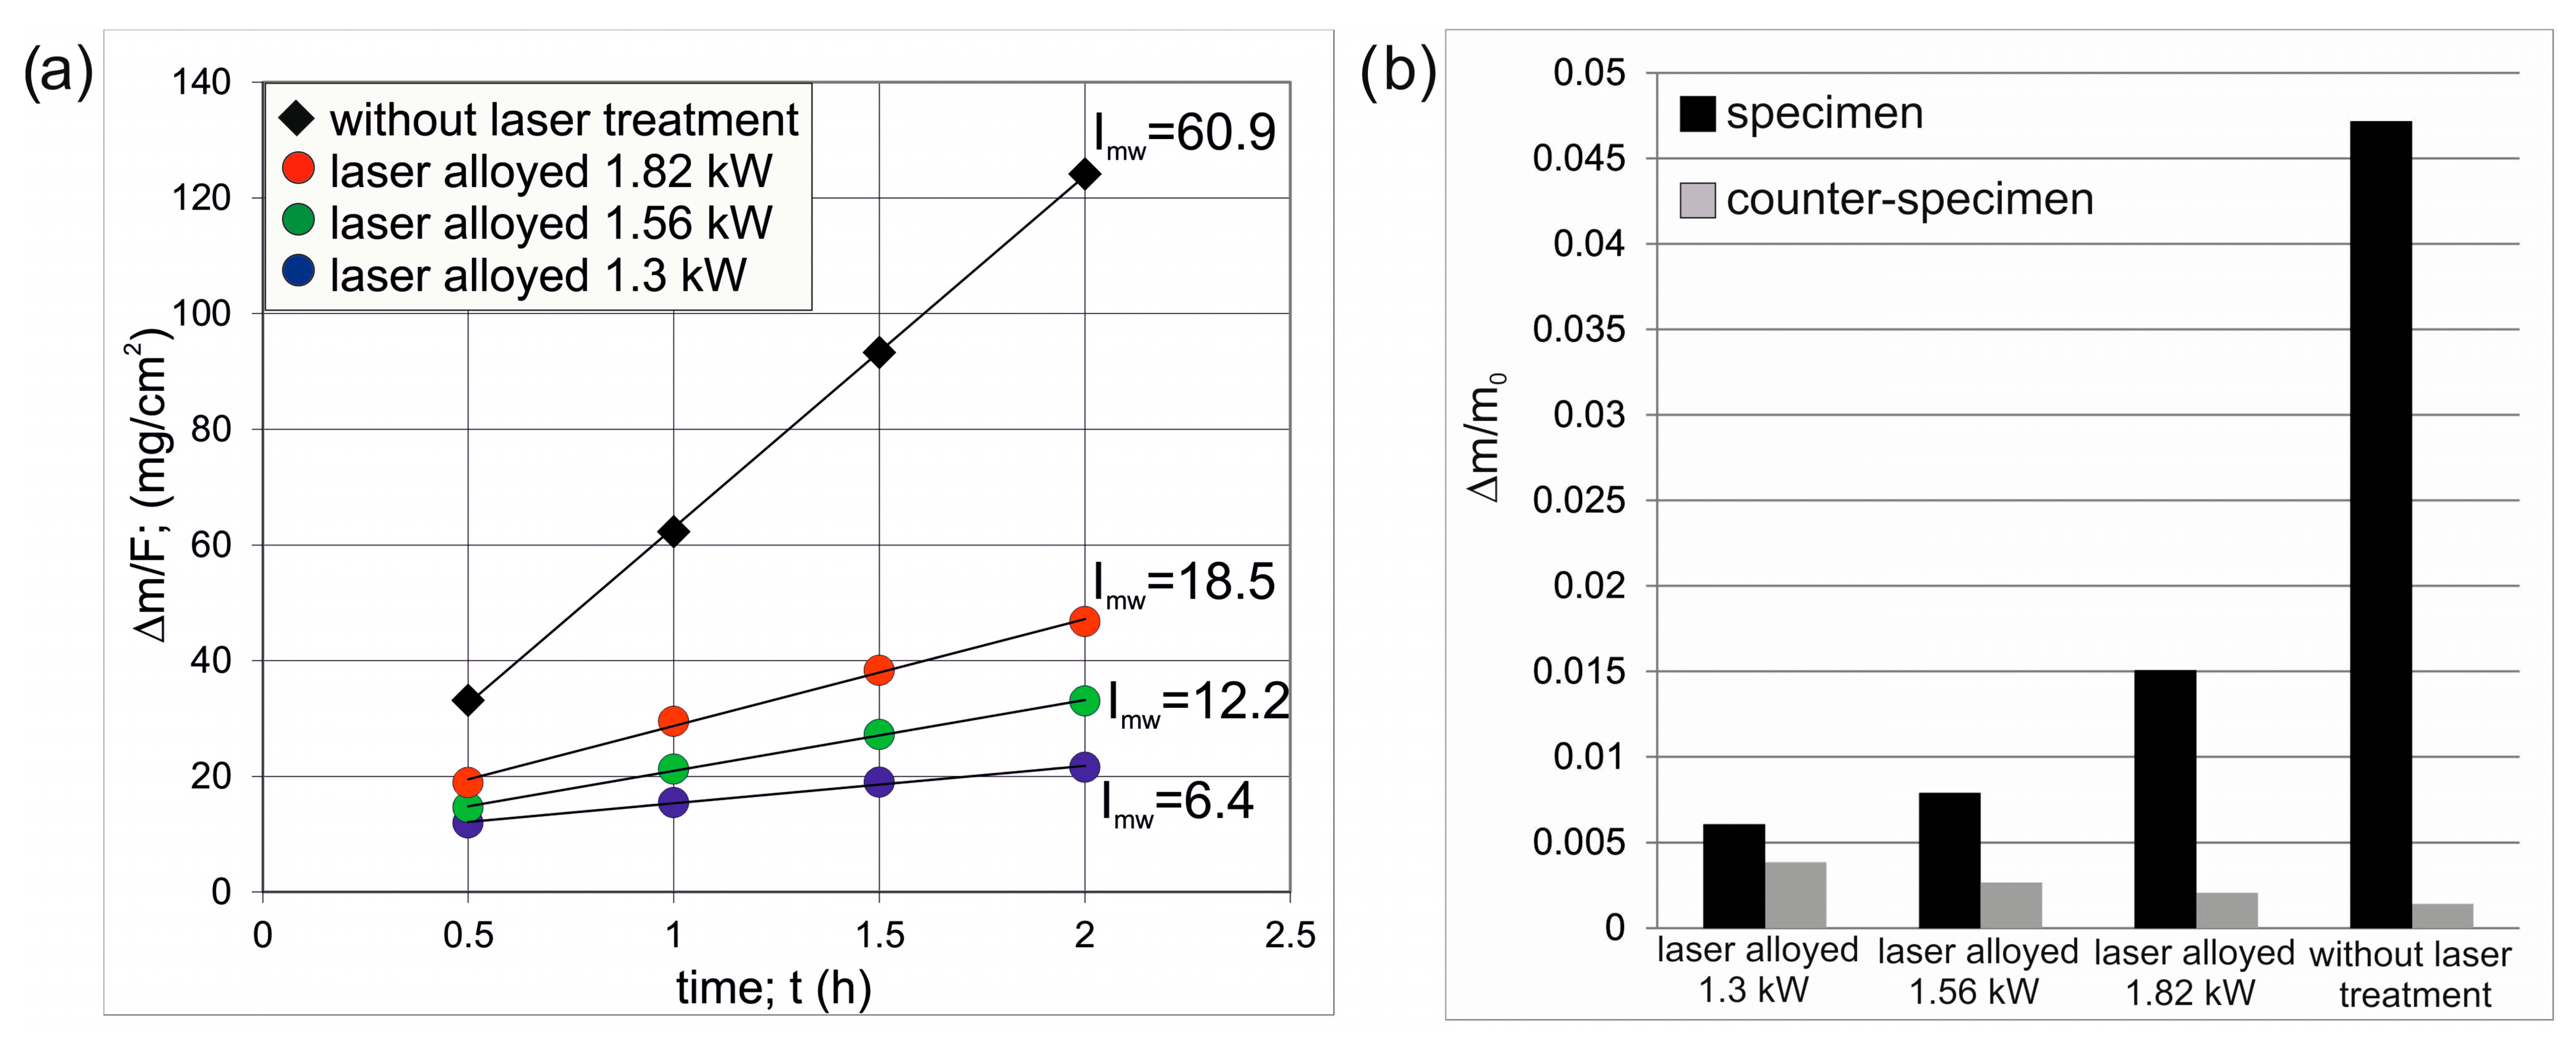
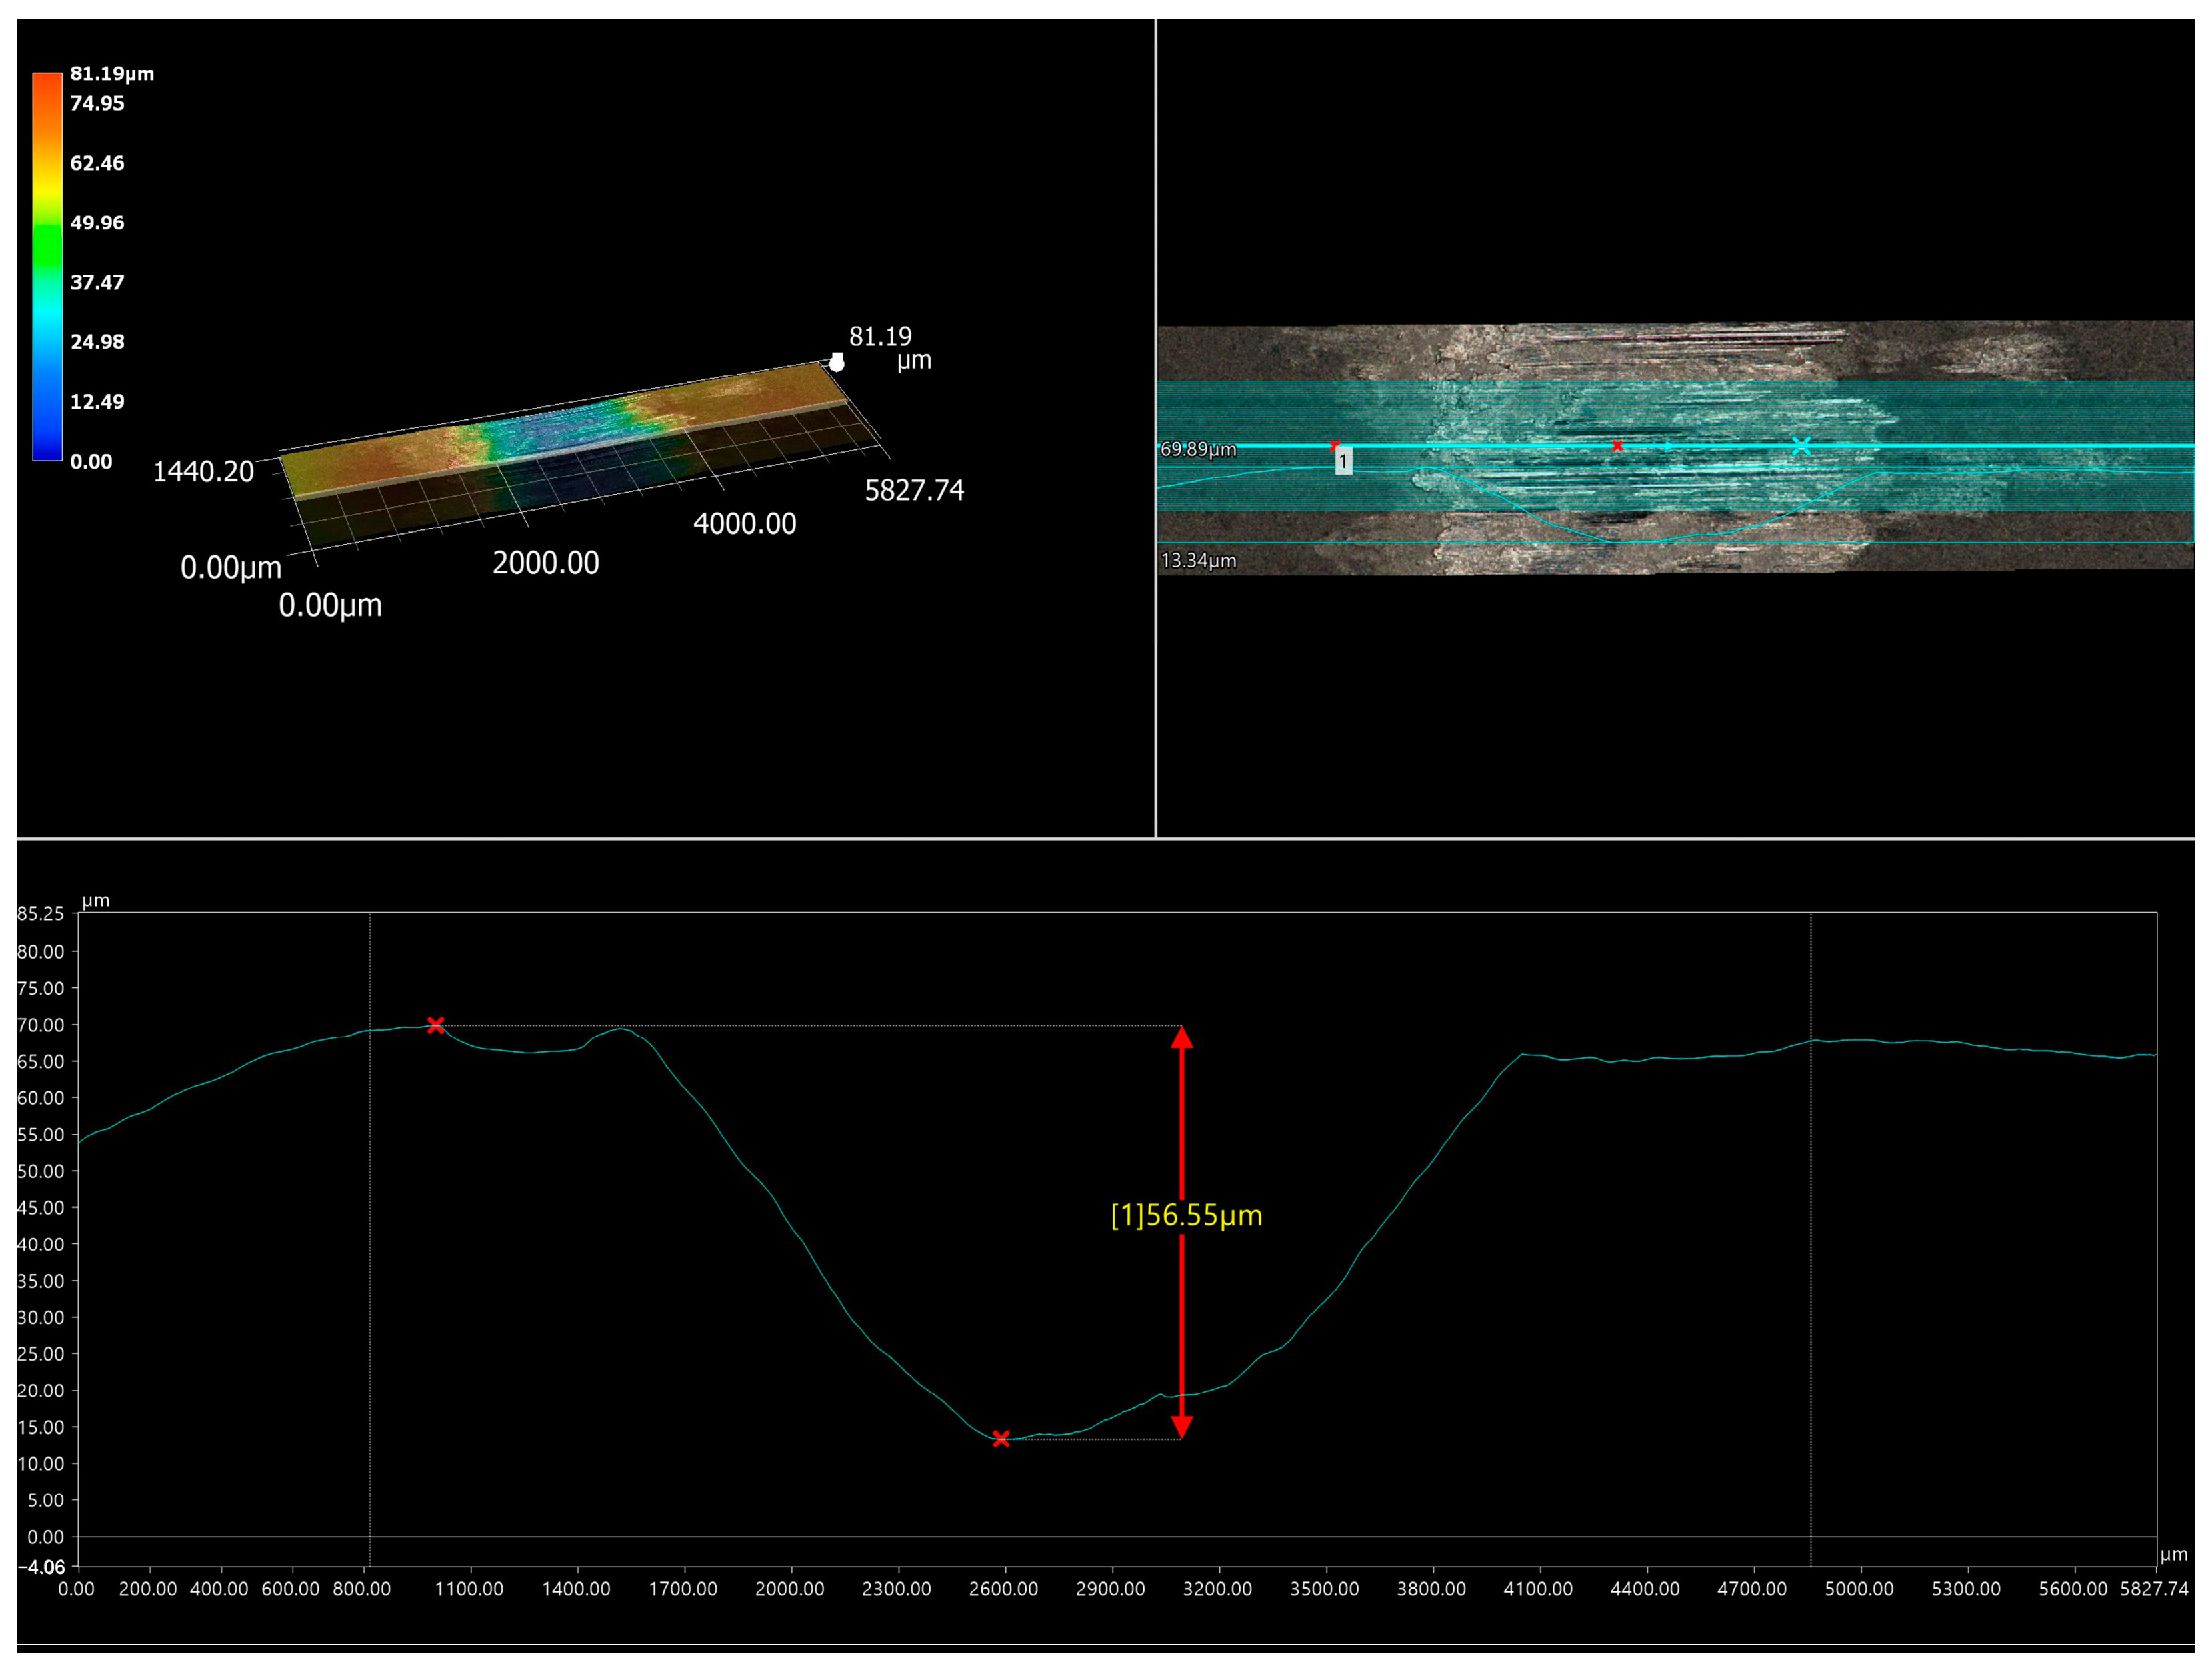
- All the produced composite layers contained WC particles, which ensured improved wear resistance compared to the Inconel®600-alloy without the produced layer. An increase in laser beam power resulted in a decrease in the wear resistance of the laser-alloyed layers. The lowest mass wear intensity factor (Imw = 6.4 mg·cm−2·h−1) characterized the layer produced at a laser beam power of 1.3 kW, and the highest Imw (18.5 mg·cm−2·h−1) was obtained for the layer produced with a laser beam power of 1.82 kW.
- (6)
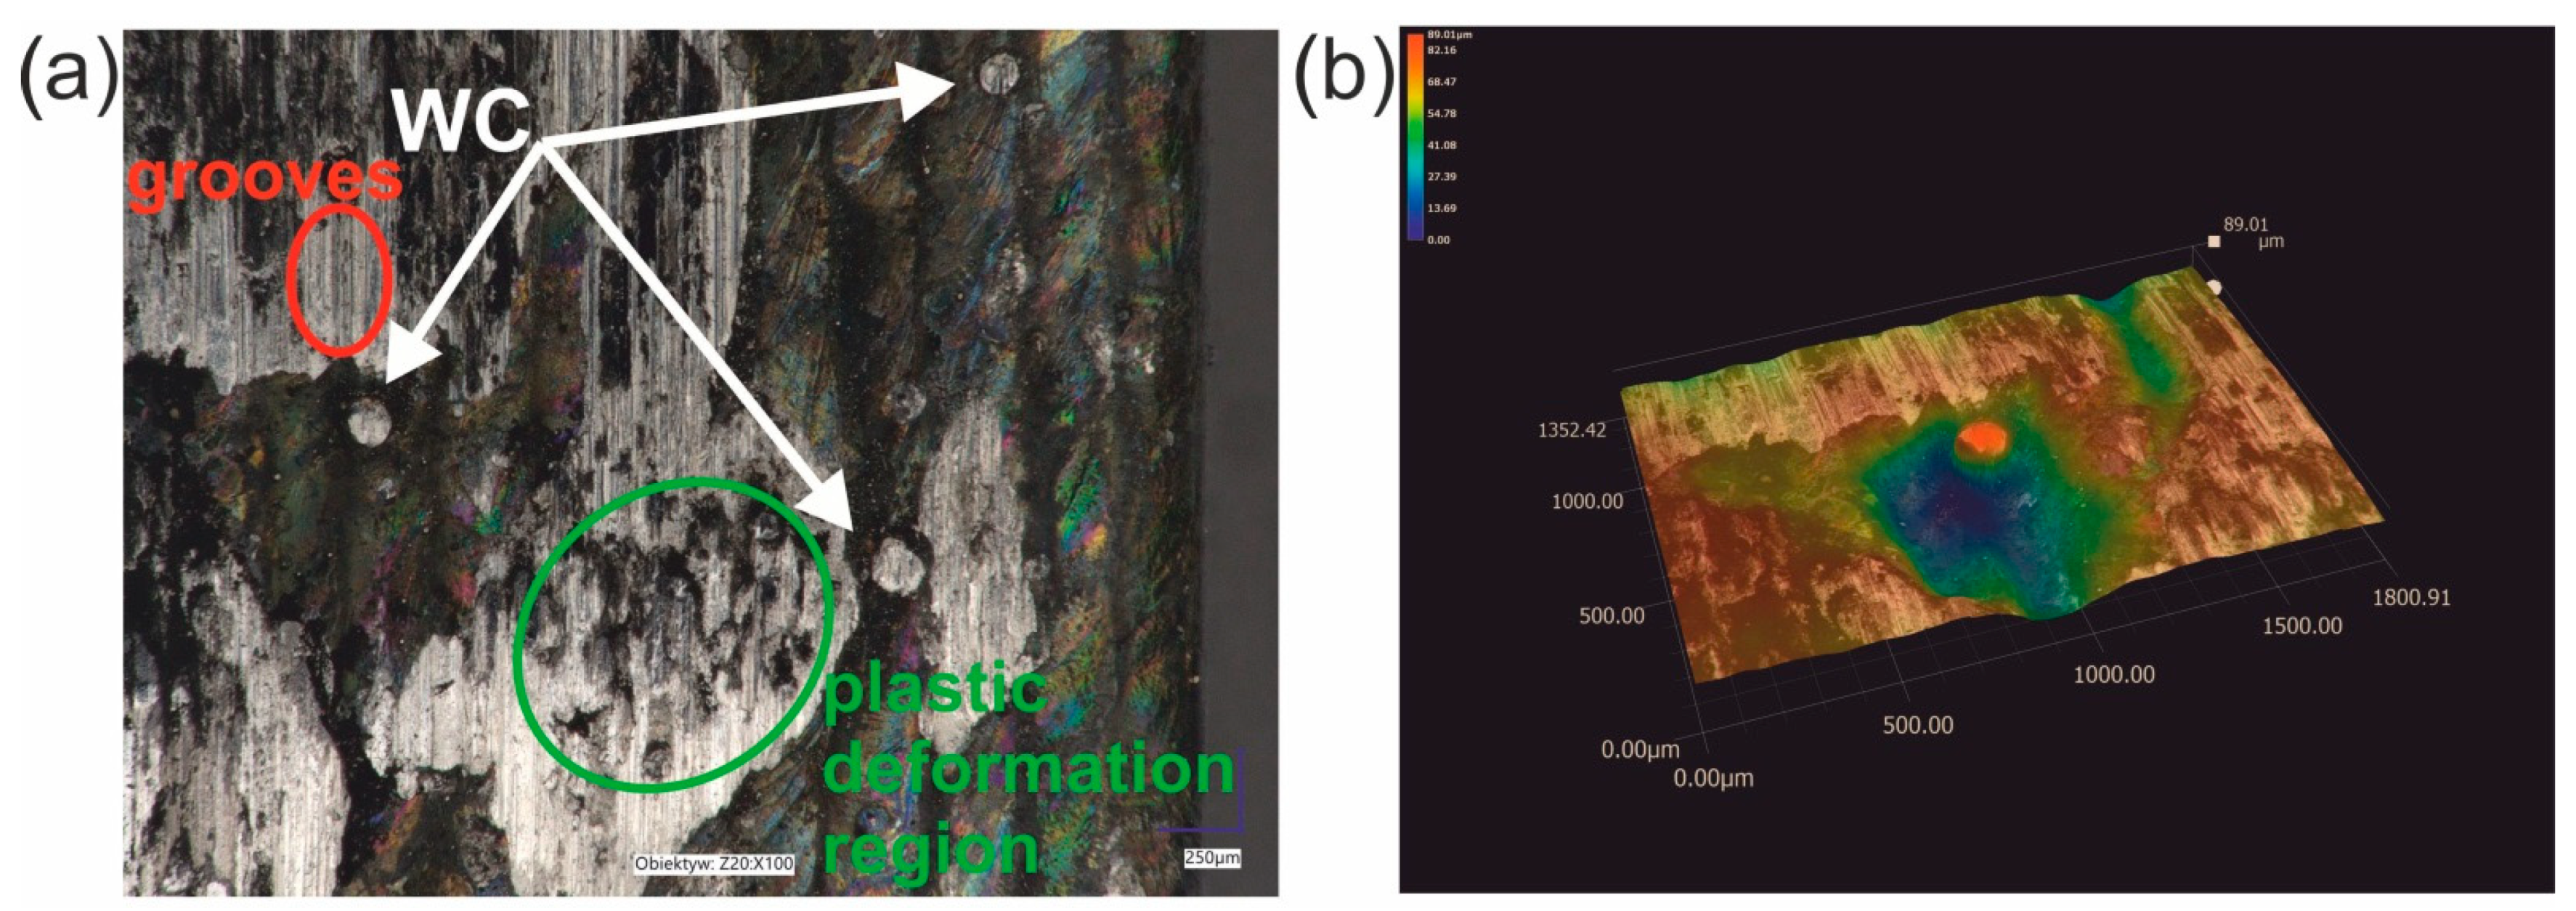
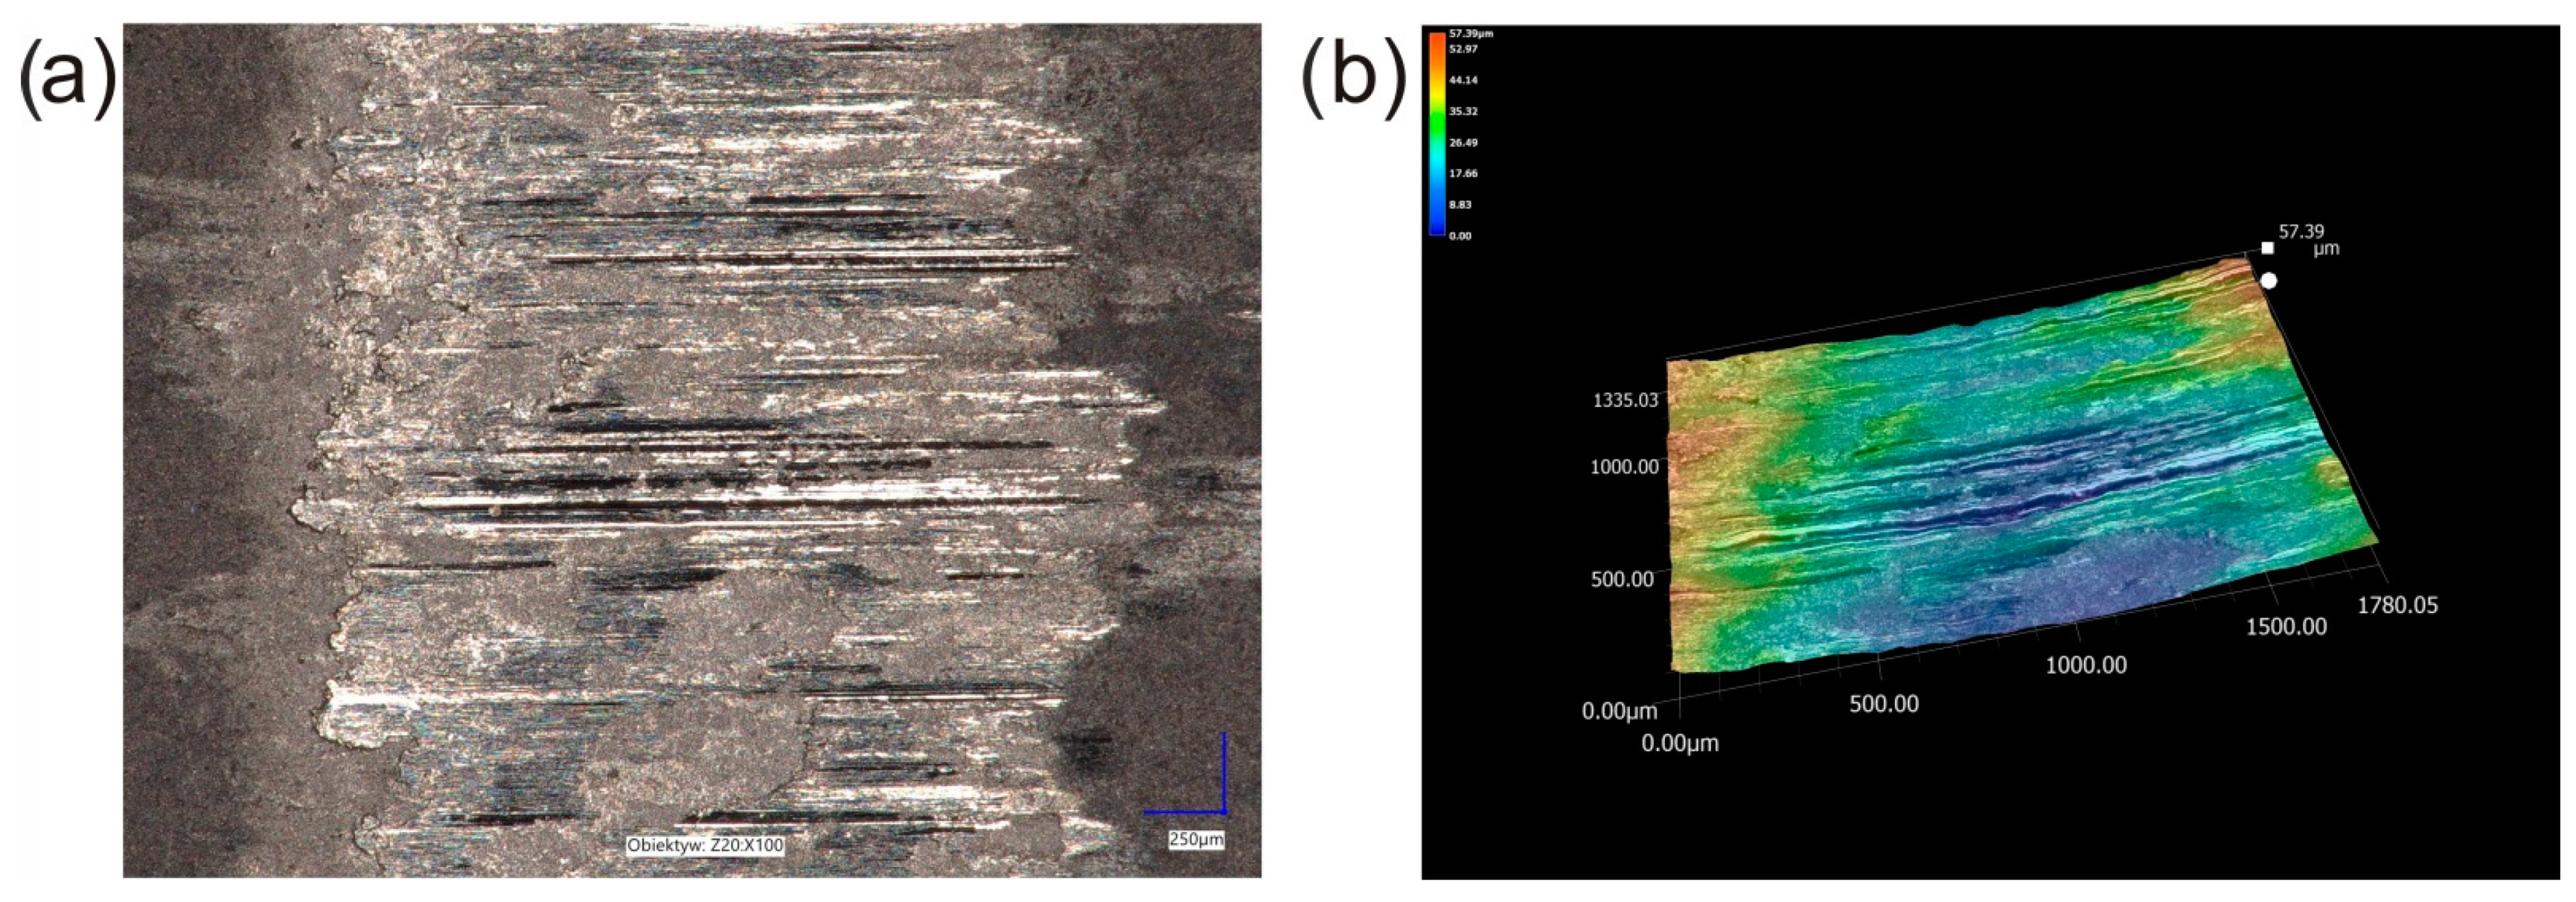
- WC particles of a high hardness were responsible for the formation of deep grooves and scratches on the surface of the counter-specimen. The higher the percentage of WC particles in the layer, the greater the degradation of the counter-specimen surface.
- (7)
- The amount of WC particles is a critical factor in both greater wear resistance of the specimen and greater wear of the counter-specimen.
- (8)
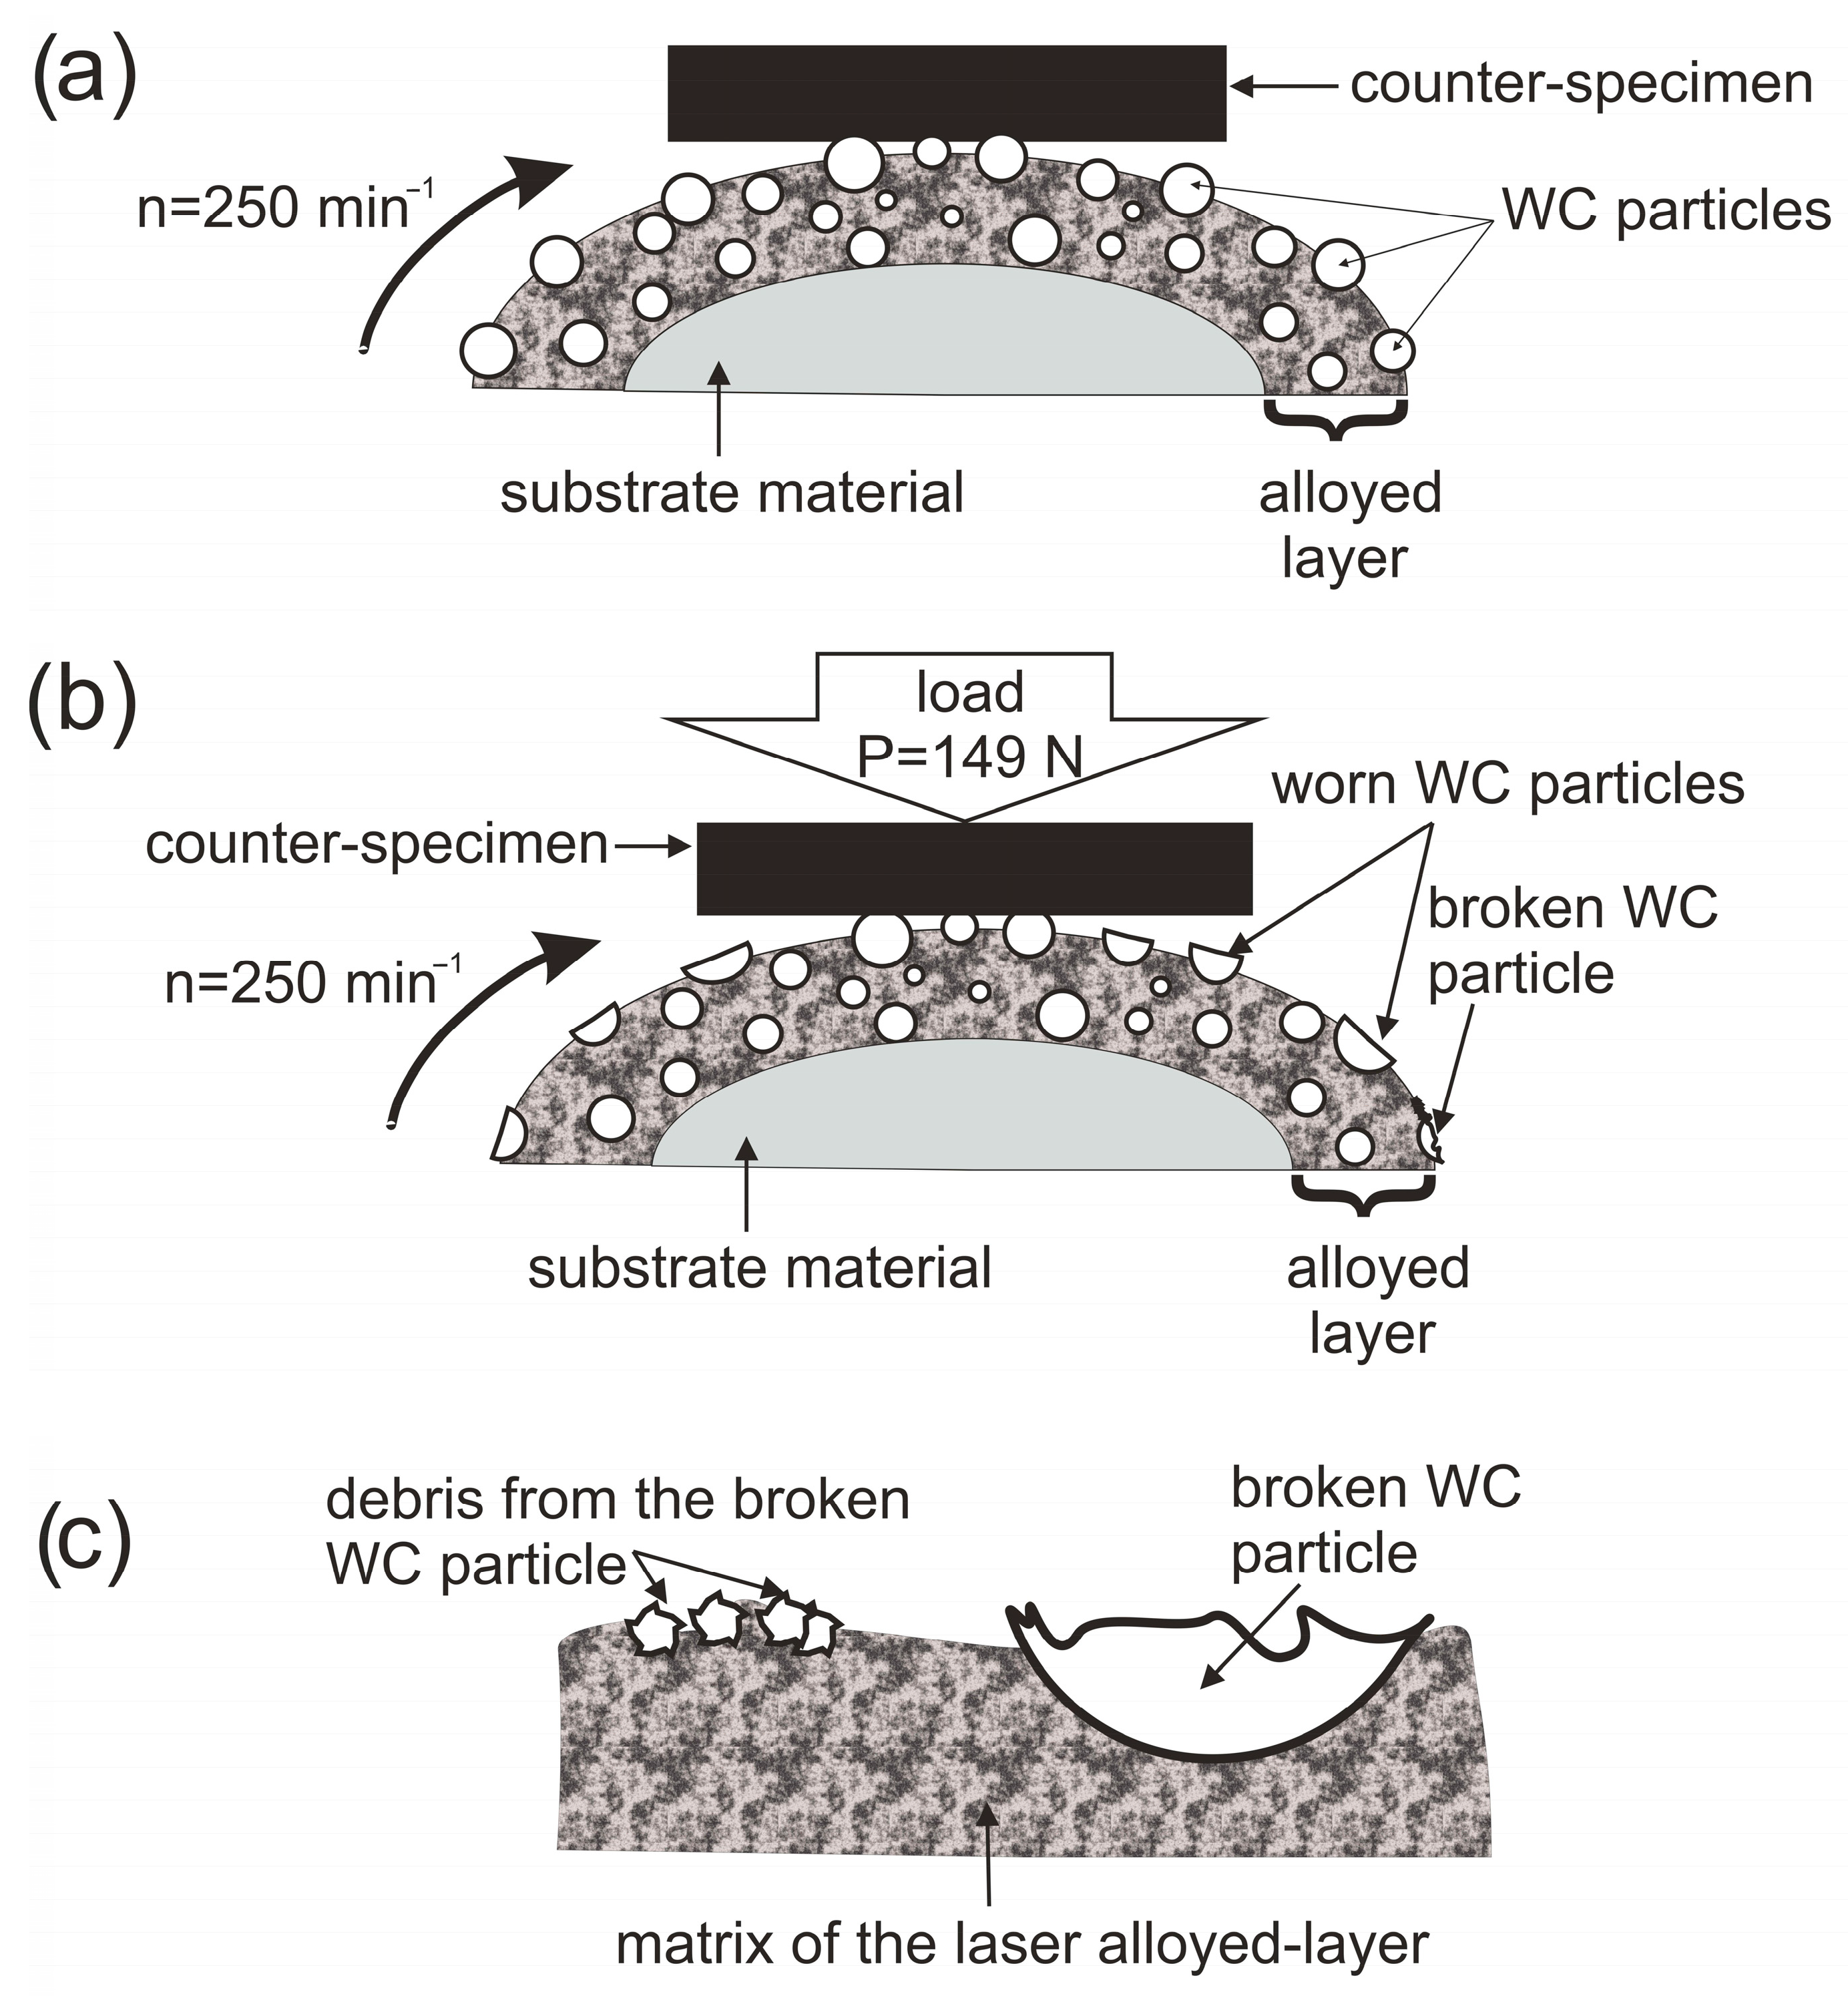
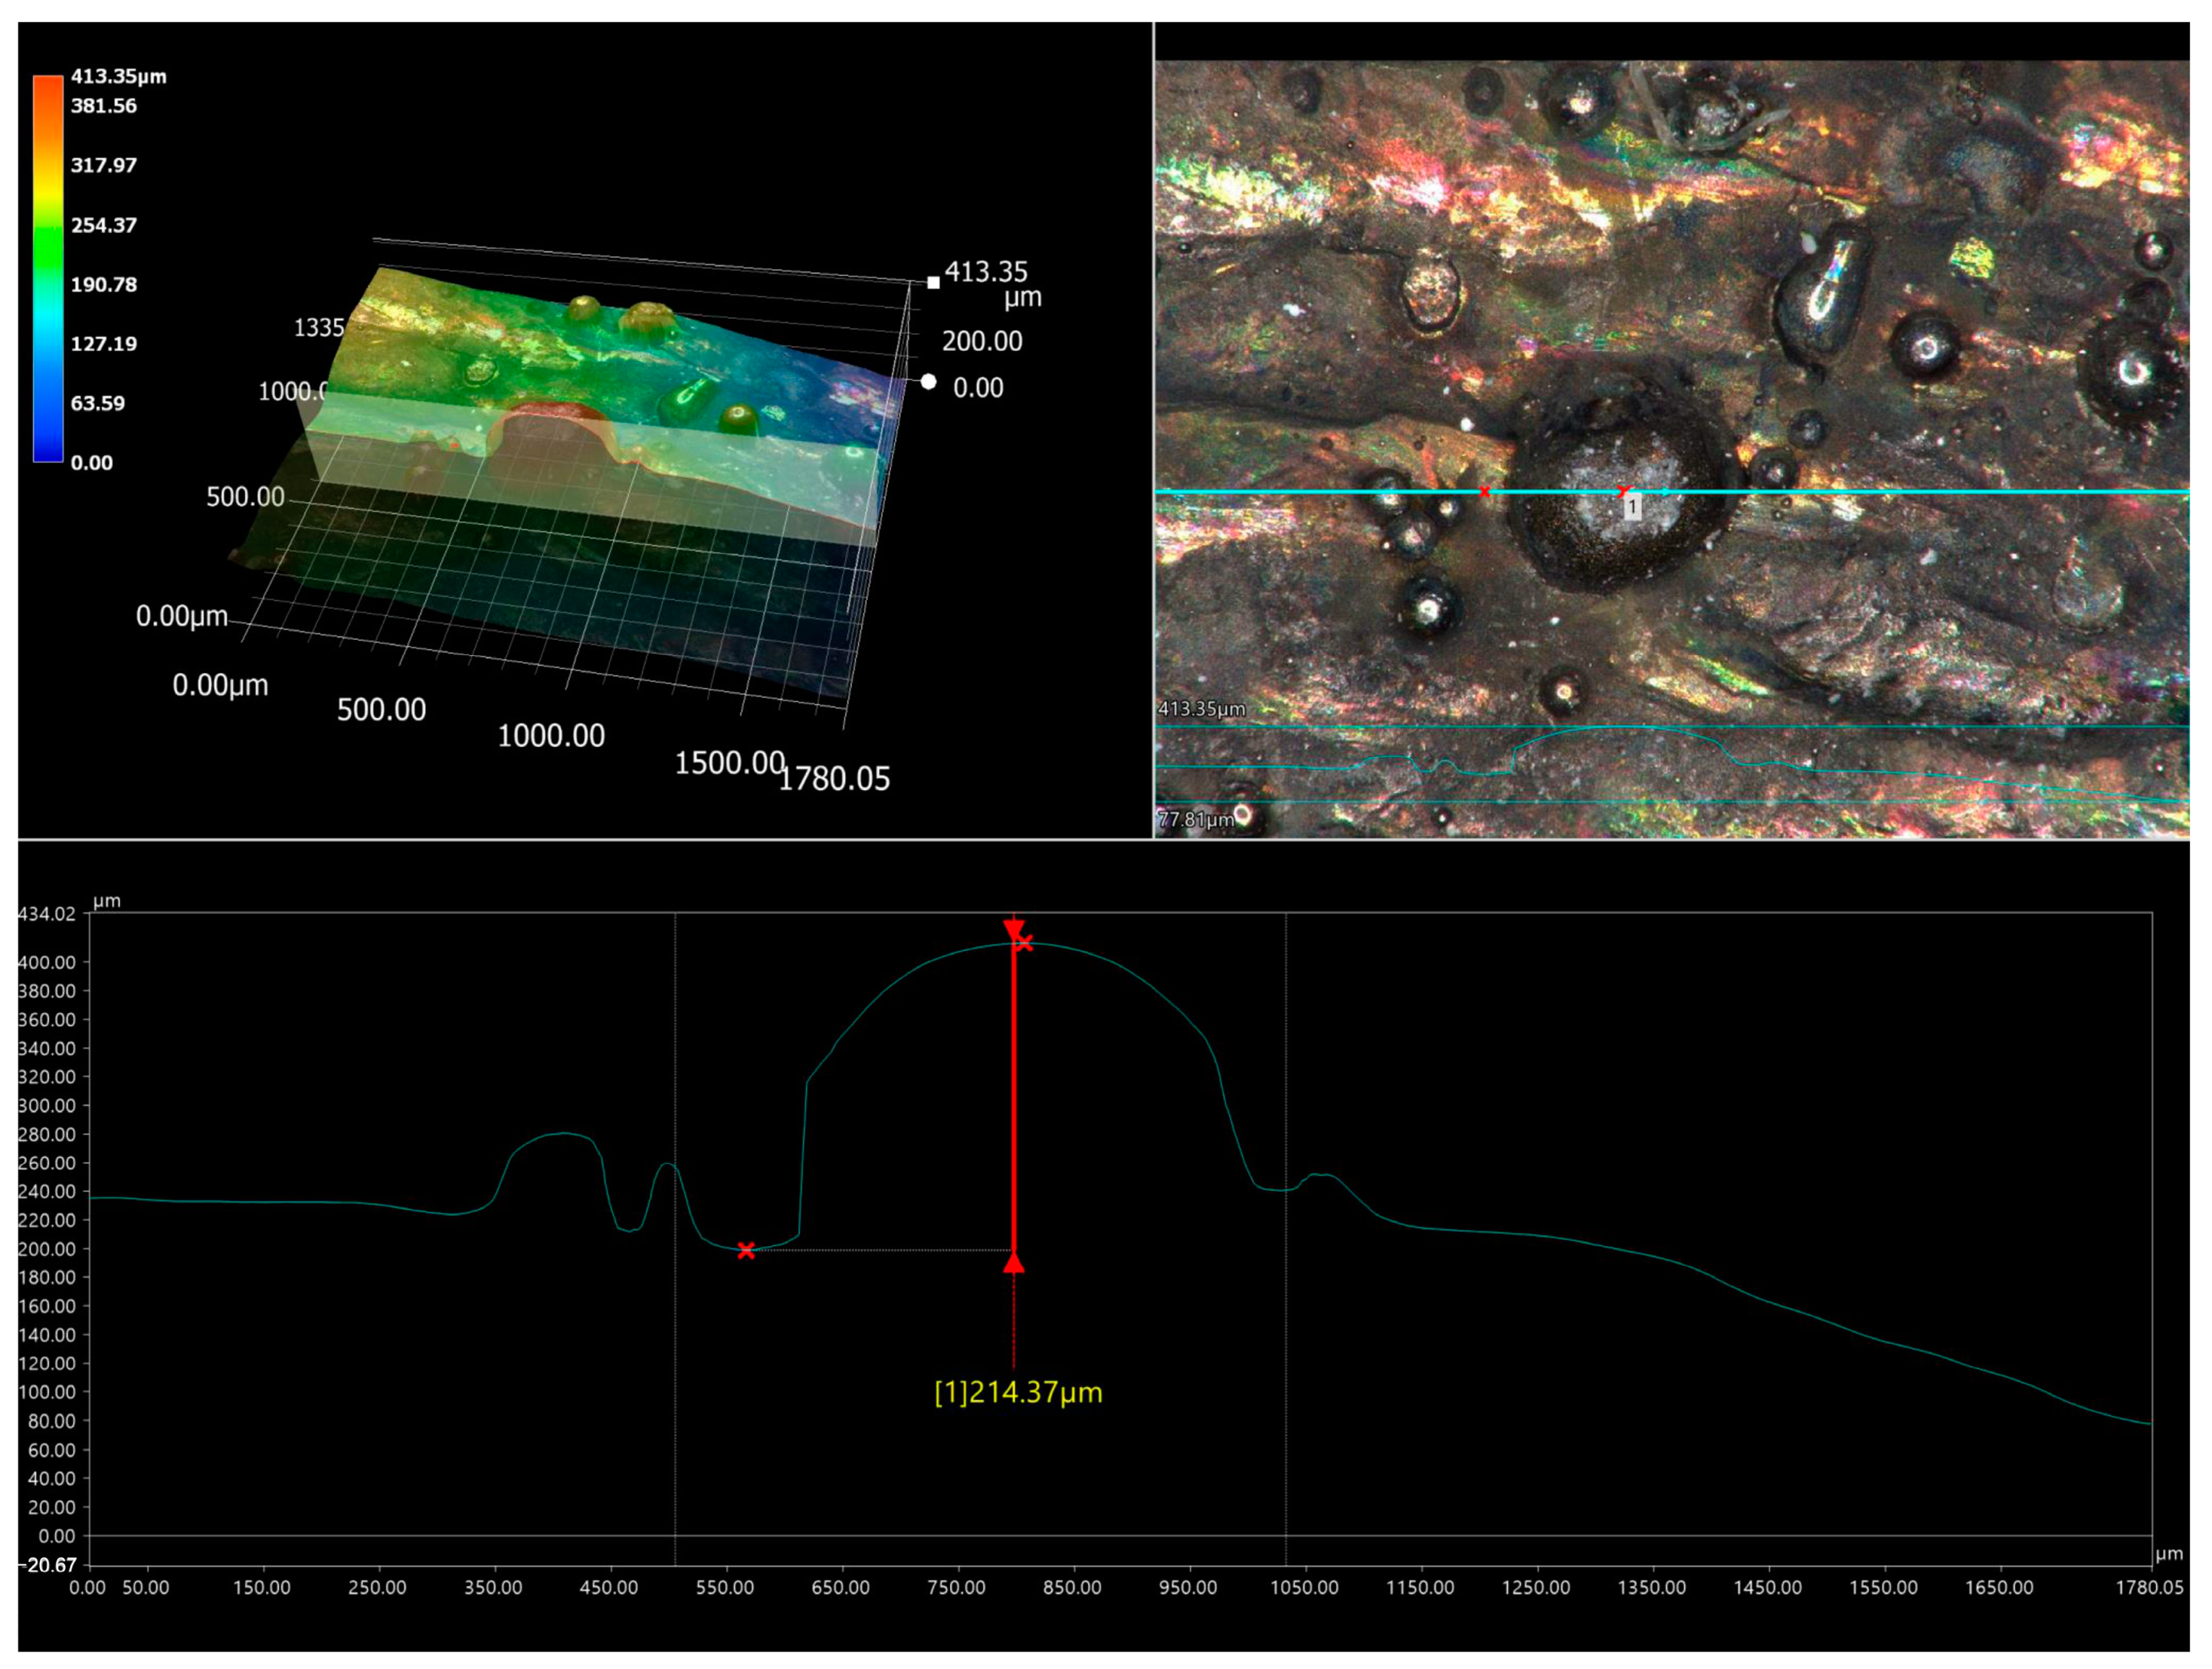
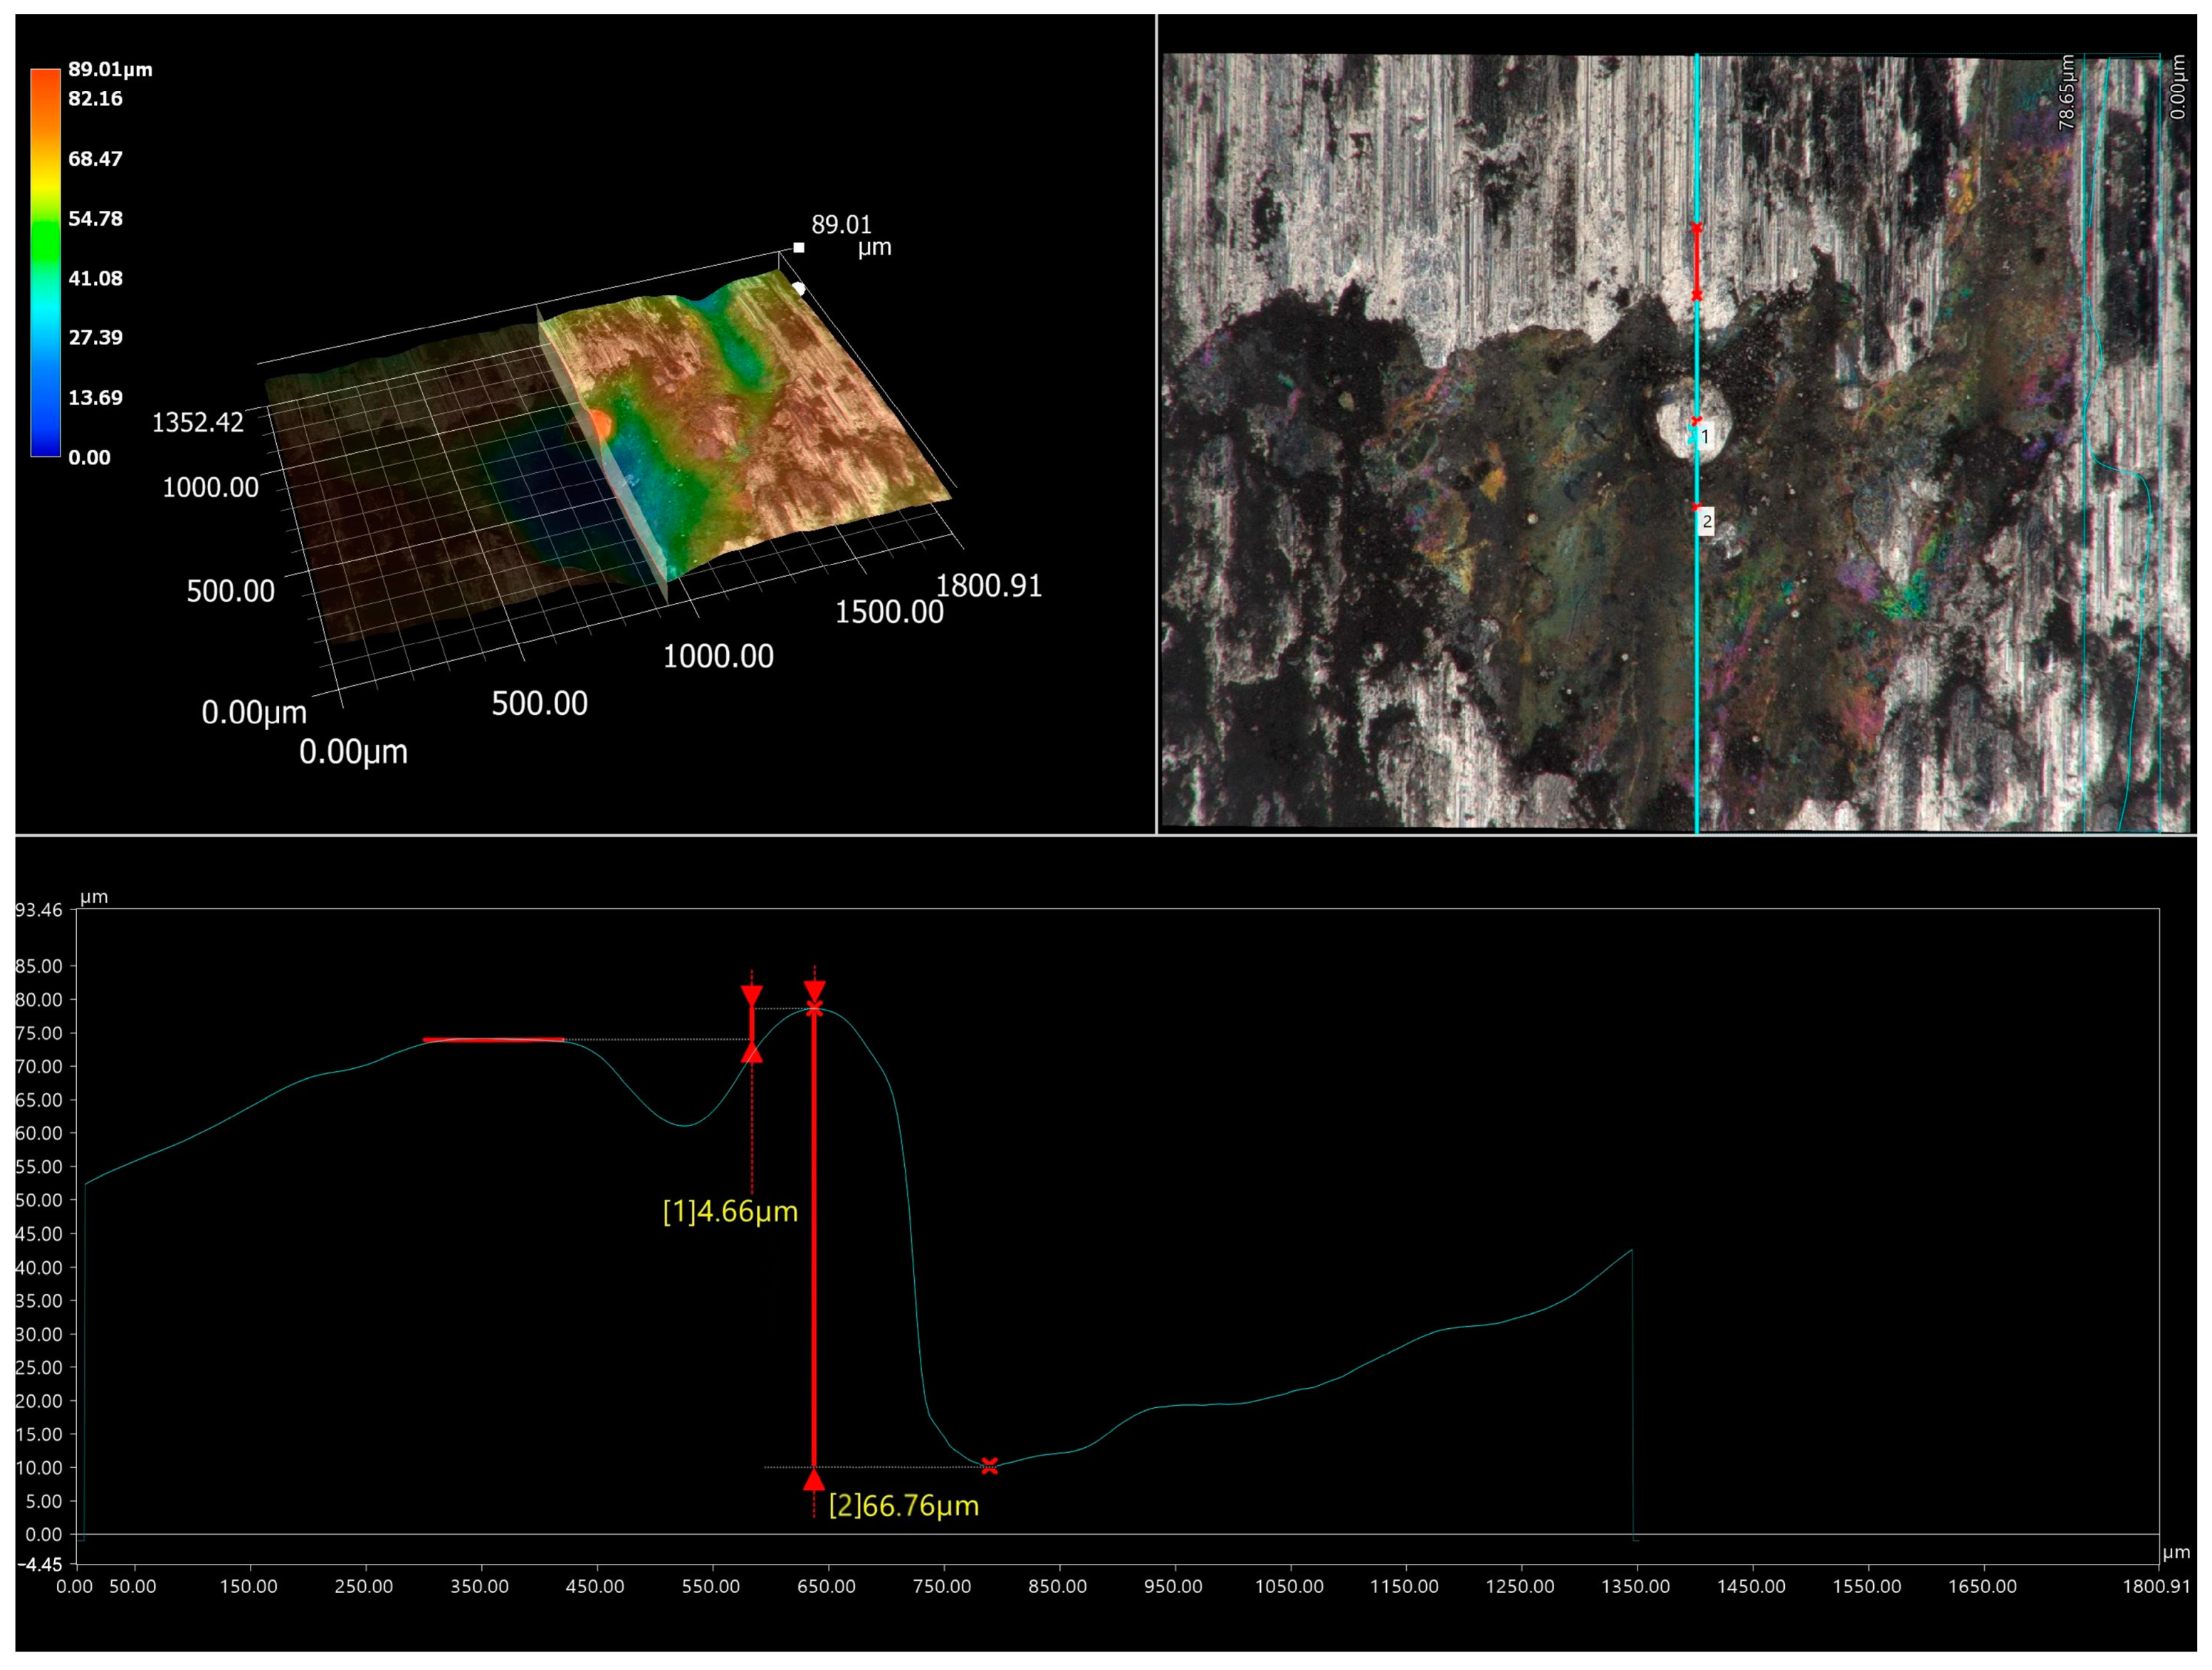
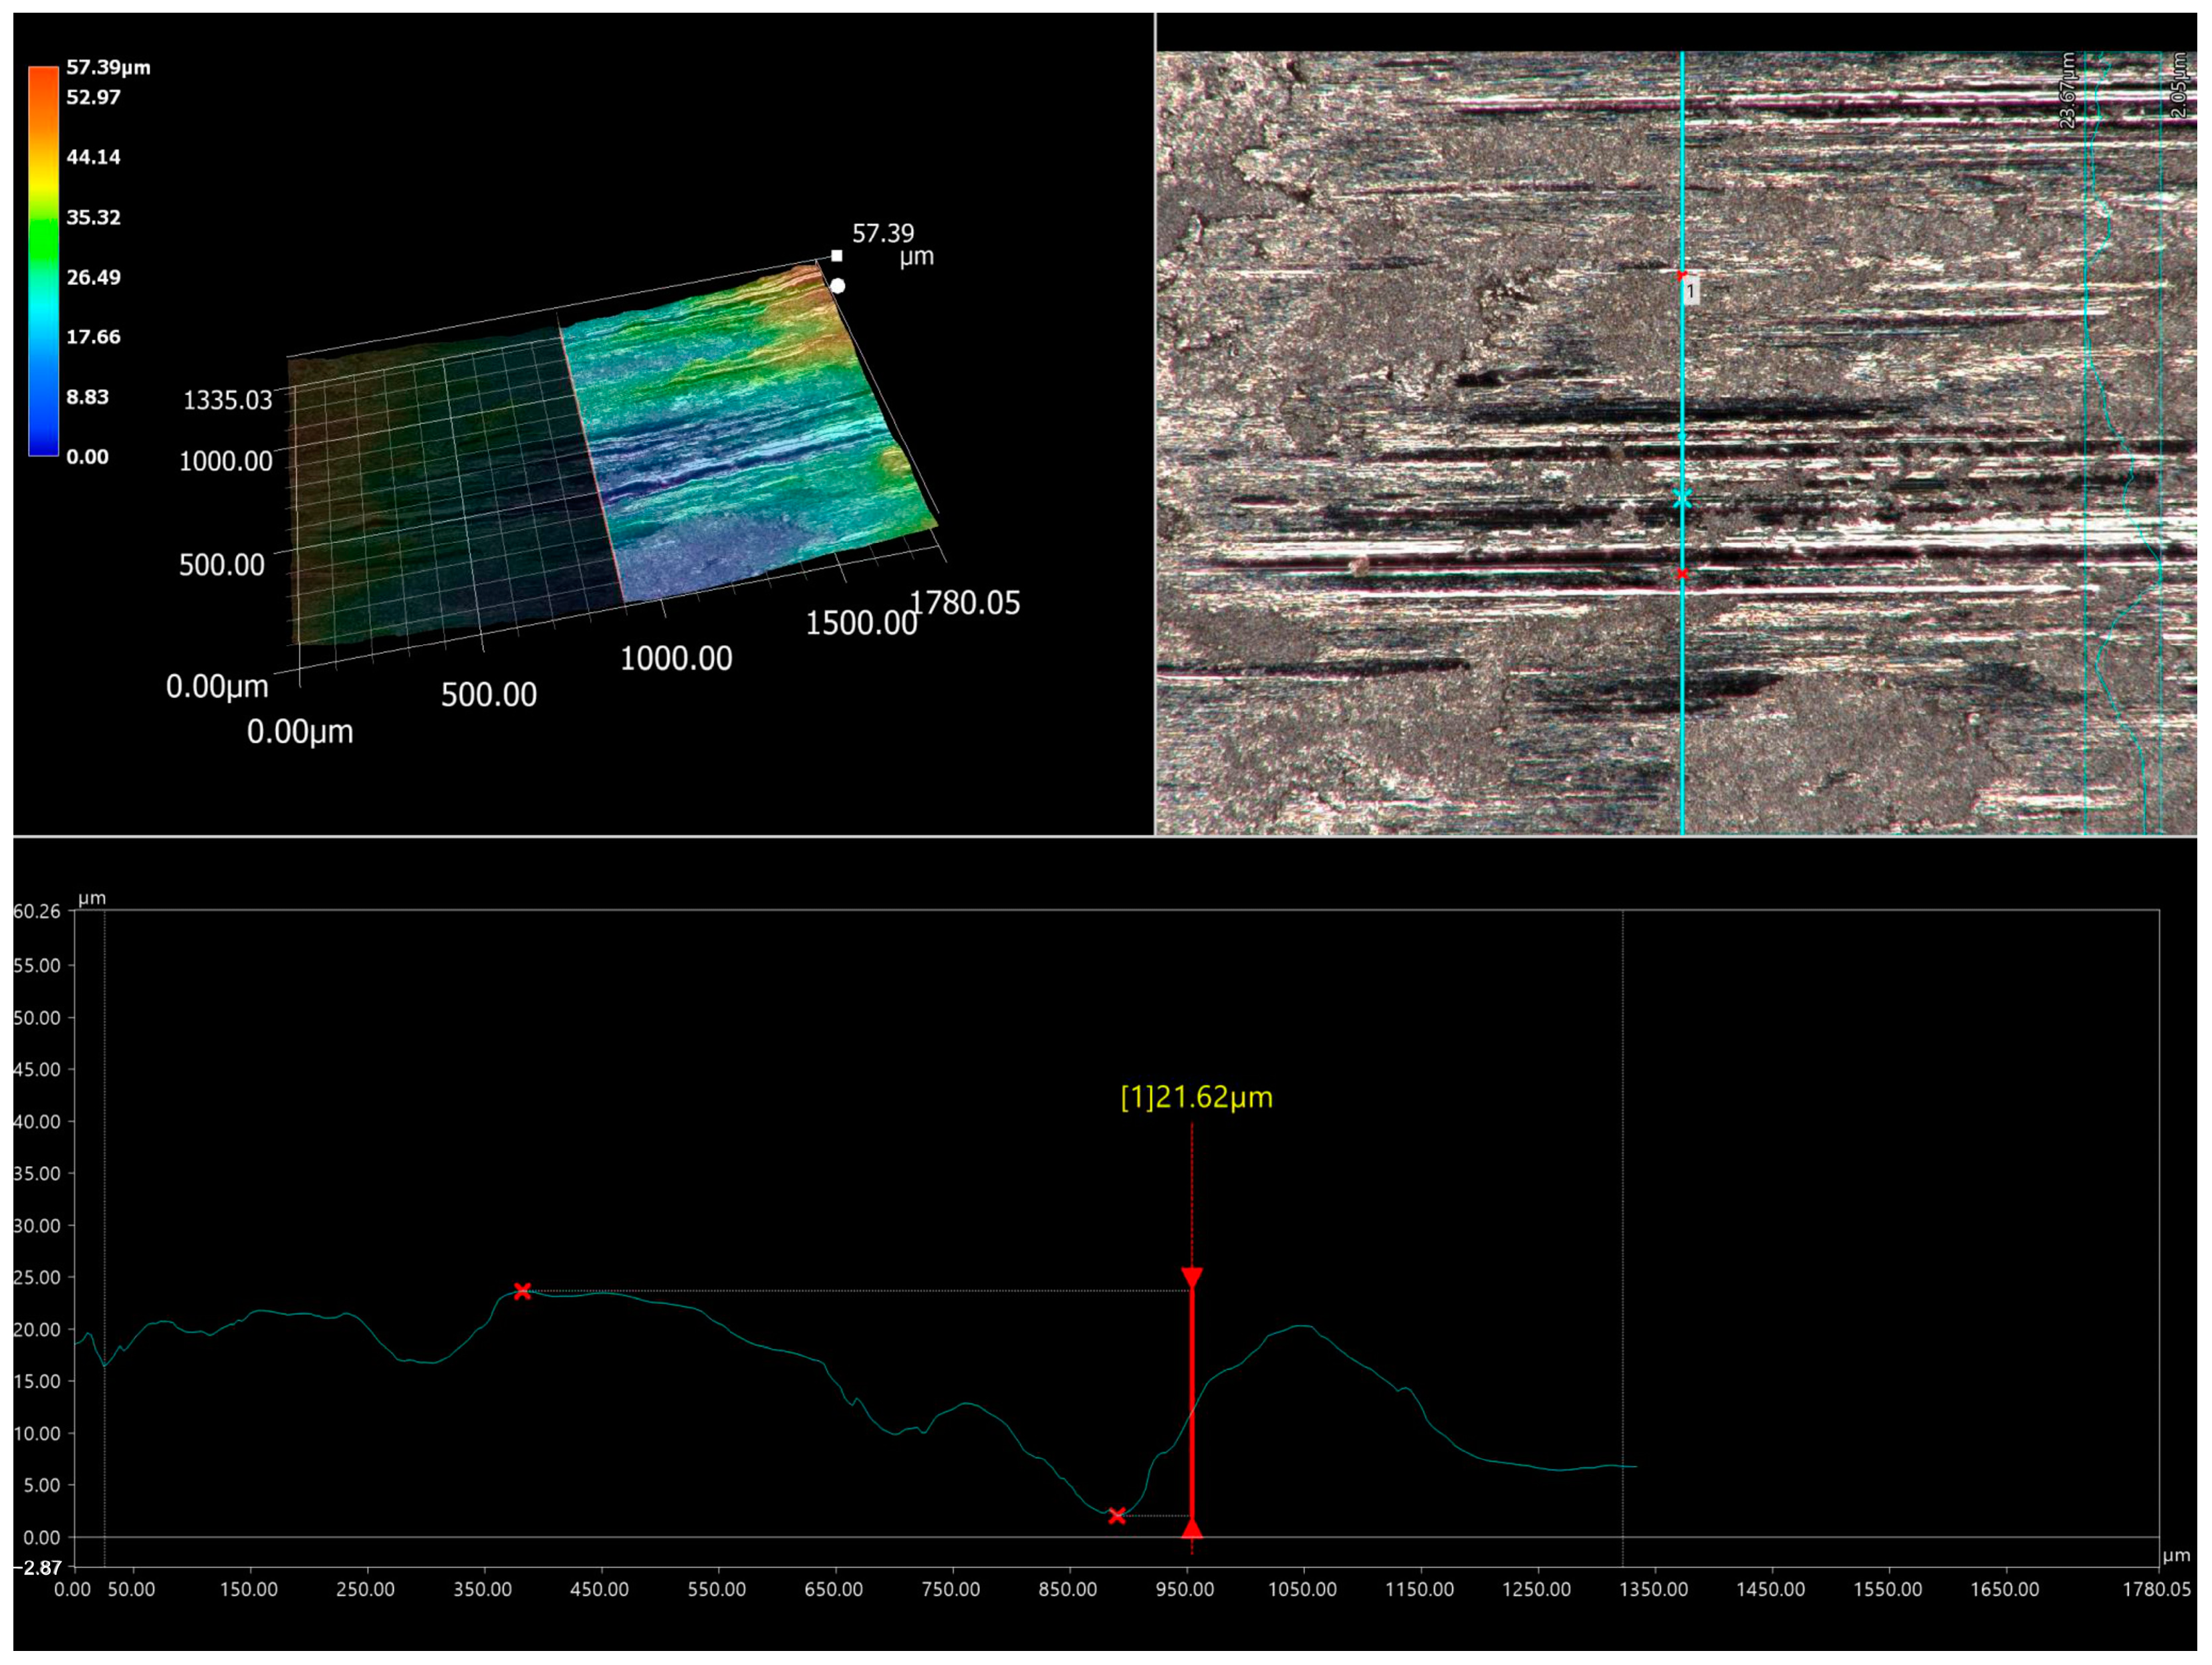
- The wear mechanism of the laser-alloyed layer enriched with WC particles was complex. Due to the protrusion of some WC particles above the nominal surface of the specimen, in the initial stage of wear, these particles were worn and smoothed, while the matrix of the laser-alloyed layer was protected against wear.
- (9)
- Some of the WC particles were broken as a result of a high load used during the wear test. The debris from the broken WC particles was pressed into the low-hardness matrix of the laser-alloyed layer. This phenomenon provided further protection for this matrix against wear.
Author Contributions
Funding
Institutional Review Board Statement
Informed Consent Statement
Data Availability Statement
Conflicts of Interest
References
- Steen, W.M.; Mazumder, J. Laser Material Processing, 4th ed.; Springer: London, UK, 2010. [Google Scholar]
- Burakowski, T.; Wierzchoń, T. Surface Engineering of Metals. Principles, Equipment, Technologies; CRC Press: Boca Raton, FL, USA, 1999. [Google Scholar]
- Staia, M.H.; Cruz, M.; Dahotre, N.B. Wear resistance of a laser alloyed A-356 aluminum/WC composite. Wear 2001, 251, 1459–1468. [Google Scholar] [CrossRef]
- Zeng, M.; Yan, H.; Yu, B.; Hu, Z. Microstructure, microhardness and corrosion resistance of laser cladding Ni−WC coating on AlSi5Cu1Mg alloy. Trans. Nonferrous Met. Soc. China 2021, 31, 2716−2728. [Google Scholar] [CrossRef]
- Yang, X.; Wang, L.; Gao, Z.; Wang, Q.; Du, M.; Zhan, X. WC distribution, microstructure evolution mechanism and microhardness of a developed Ti-6Al-4 V/WC MMC coating fabricated by laser cladding. Opt. Laser Technol. 2022, 153, 108232-1–108232-10. [Google Scholar] [CrossRef]
- Pang, W.; Man, H.C.; Yue, T.M. Laser surface coating of Mo–WC metal matrix composite on Ti6Al4V alloy. Mater. Sci. Eng. A 2005, 390, 144–153. [Google Scholar] [CrossRef]
- Tong, X.; Li, F.; Kuang, M.; Ma, W.; Chen, X.; Liu, M. Effects of WC particle size on the wear resistance of laser surface alloyed medium carbon steel. Appl. Surf. Sci. 2012, 258, 3214–3220. [Google Scholar] [CrossRef]
- Li, C.; Li, S.; Liu, C.; Zhang, Y.; Deng, P.; Guo, Y.; Wang, J.; Wang, Y. Effect of WC addition on microstructure and tribological properties of bimodal aluminum composite coatings fabricated by laser surface alloying. Mater. Chem. Phys. 2019, 234, 9–15. [Google Scholar] [CrossRef]
- Lu, J.Z.; Cao, J.; Lu, H.F.; Zhang, L.Y.; Luo, K.Y. Wear properties and microstructural analyses of Fe-based coatings with various WC contents on H13 die steel by laser cladding. Surf. Coat. Technol. 2019, 369, 228–237. [Google Scholar] [CrossRef]
- Yi, J.; Niu, B.; Pan, L.; Zou, X.; Cao, Y.; Wang, X.; Luo, J.; Hu, Y. Influence of WC grain size on the microstructure and wear property enhancement of 18Ni300 coatings. Surf. Coat. Technol. 2022, 447, 128823-1–128823-12. [Google Scholar] [CrossRef]
- Li, Z.; Teng, B.; Yao, B.; Liu, J. Microstructure and mechanical properties of WC reinforced 18Ni300 composites produced by selective laser melting. Mater. Charact. 2021, 180, 111406-1–111406-14. [Google Scholar] [CrossRef]
- Song, L.; Zeng, G.; Xiao, H.; Xiao, X.; Li, S. Repair of 304 stainless steel by laser cladding with 316 L stainless steel powders followed by laser surface alloying with WC powders. J. Manuf. Process. 2016, 24, 116–124. [Google Scholar] [CrossRef]
- Cao, Q.; Fan, L.; Chen, H.; Hou, Y.; Dong, L.; Ni, Z. Wear behavior of laser cladded WC-reinforced Ni-based coatings under low temperature. Tribol. Int. 2022, 176, 107939-1–107939-12. [Google Scholar] [CrossRef]
- Hu, Z.; Li, Y.; Lu, B.; Tan, N.; Cai, L.; Yong, Q. Effect of WC content on microstructure and properties of high-speed laser cladding Ni-based coating. Opt. Laser Technol. 2022, 155, 108449-1–108449-13. [Google Scholar] [CrossRef]
- He, S.; Park, S.; Shim, D.; Yao, C.; Zhang, W. Study on microstructure and abrasive behaviors of inconel 718-WC composite coating fabricated by laser directed energy deposition. J. Mater. Res. Technol. 2022, 21, 2926–2946. [Google Scholar] [CrossRef]
- Ren, M.; Li, R.; Zhang, X.; Gu, J.; Jiao, C. Effect of WC particles preparation method on microstructure and properties of laser cladded Ni60-WC coatings. J. Mater. Res. Technol. 2023, 22, 605–616. [Google Scholar] [CrossRef]
- Guo, C.; Chen, J.; Zhou, J.; Zhao, J.; Wang, L.; Yu, Y.; Zhou, H. Effects of WC–Ni content on microstructure and wear resistance of laser cladding Ni-based alloys coating. Surf. Coat. Technol. 2012, 206, 2064–2071. [Google Scholar] [CrossRef]
- Hu, Y.; Wang, Z.; Pang, M. Effect of WC content on laser cladding Ni-based coating on the surface of stainless steel. Mater. Today Commun. 2022, 31, 103357-1–103357-11. [Google Scholar] [CrossRef]
- Li, W.; Di, R.; Yuan, R.; Song, H.; Lei, J. Microstructure, wear resistance and electrochemical properties of spherical/non-spherical WC reinforced Inconel 625 superalloy by laser melting deposition. J. Manuf. Process. 2022, 74, 413–422. [Google Scholar] [CrossRef]
- Oliver, W.C.; Pharr, G.M. Measurement of hardness and elastic modulus by instrumented indentation: Advances in understanding and refinements to methodology. J. Mater. Res. Soc. 2004, 19, 3–20. [Google Scholar] [CrossRef]
- Oliver, W.C.; Pharr, G.M. An improved technique for determining hardness and elastic modulus using load and displacement sensing indentation experiments. J. Mater. Res. 1992, 7, 1564–1583. [Google Scholar] [CrossRef]
- Kumar, A.; Rajkumar, K.V.; Jayakumar, T.; Raj, B.; Mishra, B. Ultrasonic measurements for in-service assessment of wrought Inconel 625 cracker tubes of heavy water plants. J. Nucl. Mater. 2006, 350, 284–292. [Google Scholar] [CrossRef]
- Doi, H.; Fujiwara, Y.; Miyake, K.; Oosawa, Y. A systematic investigation of elastic moduli of WC-Co alloys. Metall. Mater. Trans. B 1970, 1, 1417–1425. [Google Scholar] [CrossRef]


| Material | Elements (wt.%) | ||||||||||
|---|---|---|---|---|---|---|---|---|---|---|---|
| Cr | Fe | Mo | Mn | Si | Cu | S | Nb + Ta | C | Ni | W | |
| Inconel®600 | 14.0–17.0 | 6.0–10.0 | - | ≤1.0 | ≤0.5 | ≤0.5 | ≤0.015 | - | ≤0.15 | balance | - |
| Inconel®625 powder | 20.0–23.0 | ≤5.0 | 8.0–10.8 | ≤0.5 | ≤0.5 | - | ≤0.015 | 3.25–4.15 | ≤0.1 | balance | - |
| WC powder | 0.023 | 0.2 | - | - | - | - | - | 0.2 | 3.95 | - | 95.627 |
| Laser Beam Power P (kW) | ||||
|---|---|---|---|---|
| 1.3 | 1.56 | 1.82 | ||
| Area 1 | Total region area (µm2) | 349,140 | 349,140 | 349,140 |
| WC particles’ area (µm2) | 51,708 | 52,476 | 48,146 | |
| Percentage of WC particles | 14.81% | 15.03% | 13.79% | |
| Area 2 | Total region area (µm2) | 349,140 | 349,140 | 349,140 |
| WC particles’ area (µm2) | 105,964 | 31,527 | 13,163 | |
| Percentage of WC particles | 30.35% | 9.03% | 3.77% | |
| Area 3 | Total region area (µm2) | 349,140 | 349,140 | 349,140 |
| WC particles’ area (µm2) | 58,237 | 87,180 | 31,807 | |
| Percentage of WC particles | 16.68% | 24.97% | 9.11% | |
| Area 4 | Total region area (µm2) | 349,140 | 349,140 | 349,140 |
| WC particles’ area (µm2) | 71,644 | 45,595 | 38,964 | |
| Percentage of WC particles | 20.52% | 13.06% | 11.16% | |
| Average percentage of WC particles | 20.59% | 15.52% | 9.46% | |
Disclaimer/Publisher’s Note: The statements, opinions and data contained in all publications are solely those of the individual author(s) and contributor(s) and not of MDPI and/or the editor(s). MDPI and/or the editor(s) disclaim responsibility for any injury to people or property resulting from any ideas, methods, instructions or products referred to in the content. |
© 2023 by the authors. Licensee MDPI, Basel, Switzerland. This article is an open access article distributed under the terms and conditions of the Creative Commons Attribution (CC BY) license (https://creativecommons.org/licenses/by/4.0/).
Share and Cite
Dziarski, P.; Makuch, N.; Kulka, M. The Impact of Laser Beam Power on the Microstructure and Some Mechanical Properties of Laser-Alloyed Inconel®600 with WC Particles. Materials 2023, 16, 2619. https://doi.org/10.3390/ma16072619
Dziarski P, Makuch N, Kulka M. The Impact of Laser Beam Power on the Microstructure and Some Mechanical Properties of Laser-Alloyed Inconel®600 with WC Particles. Materials. 2023; 16(7):2619. https://doi.org/10.3390/ma16072619
Chicago/Turabian StyleDziarski, Piotr, Natalia Makuch, and Michał Kulka. 2023. "The Impact of Laser Beam Power on the Microstructure and Some Mechanical Properties of Laser-Alloyed Inconel®600 with WC Particles" Materials 16, no. 7: 2619. https://doi.org/10.3390/ma16072619
APA StyleDziarski, P., Makuch, N., & Kulka, M. (2023). The Impact of Laser Beam Power on the Microstructure and Some Mechanical Properties of Laser-Alloyed Inconel®600 with WC Particles. Materials, 16(7), 2619. https://doi.org/10.3390/ma16072619