Microstructure and Mechanical Properties of Y4Zr3O12-Added Fe–13.5Cr–2W Oxide-Dispersion-Strengthened Steels, Containing High Contents of C and N, Prepared by Mechanical Alloying and Two-Step Spark Plasma Sintering
Abstract
1. Introduction
2. Materials and Methods
2.1. Materials and Preparation
2.2. Characterization Methods
2.3. Property Tests
3. Results and Discussion
3.1. Microstructure Characterization
3.1.1. Characterization of Y4Zr3O12 Powders
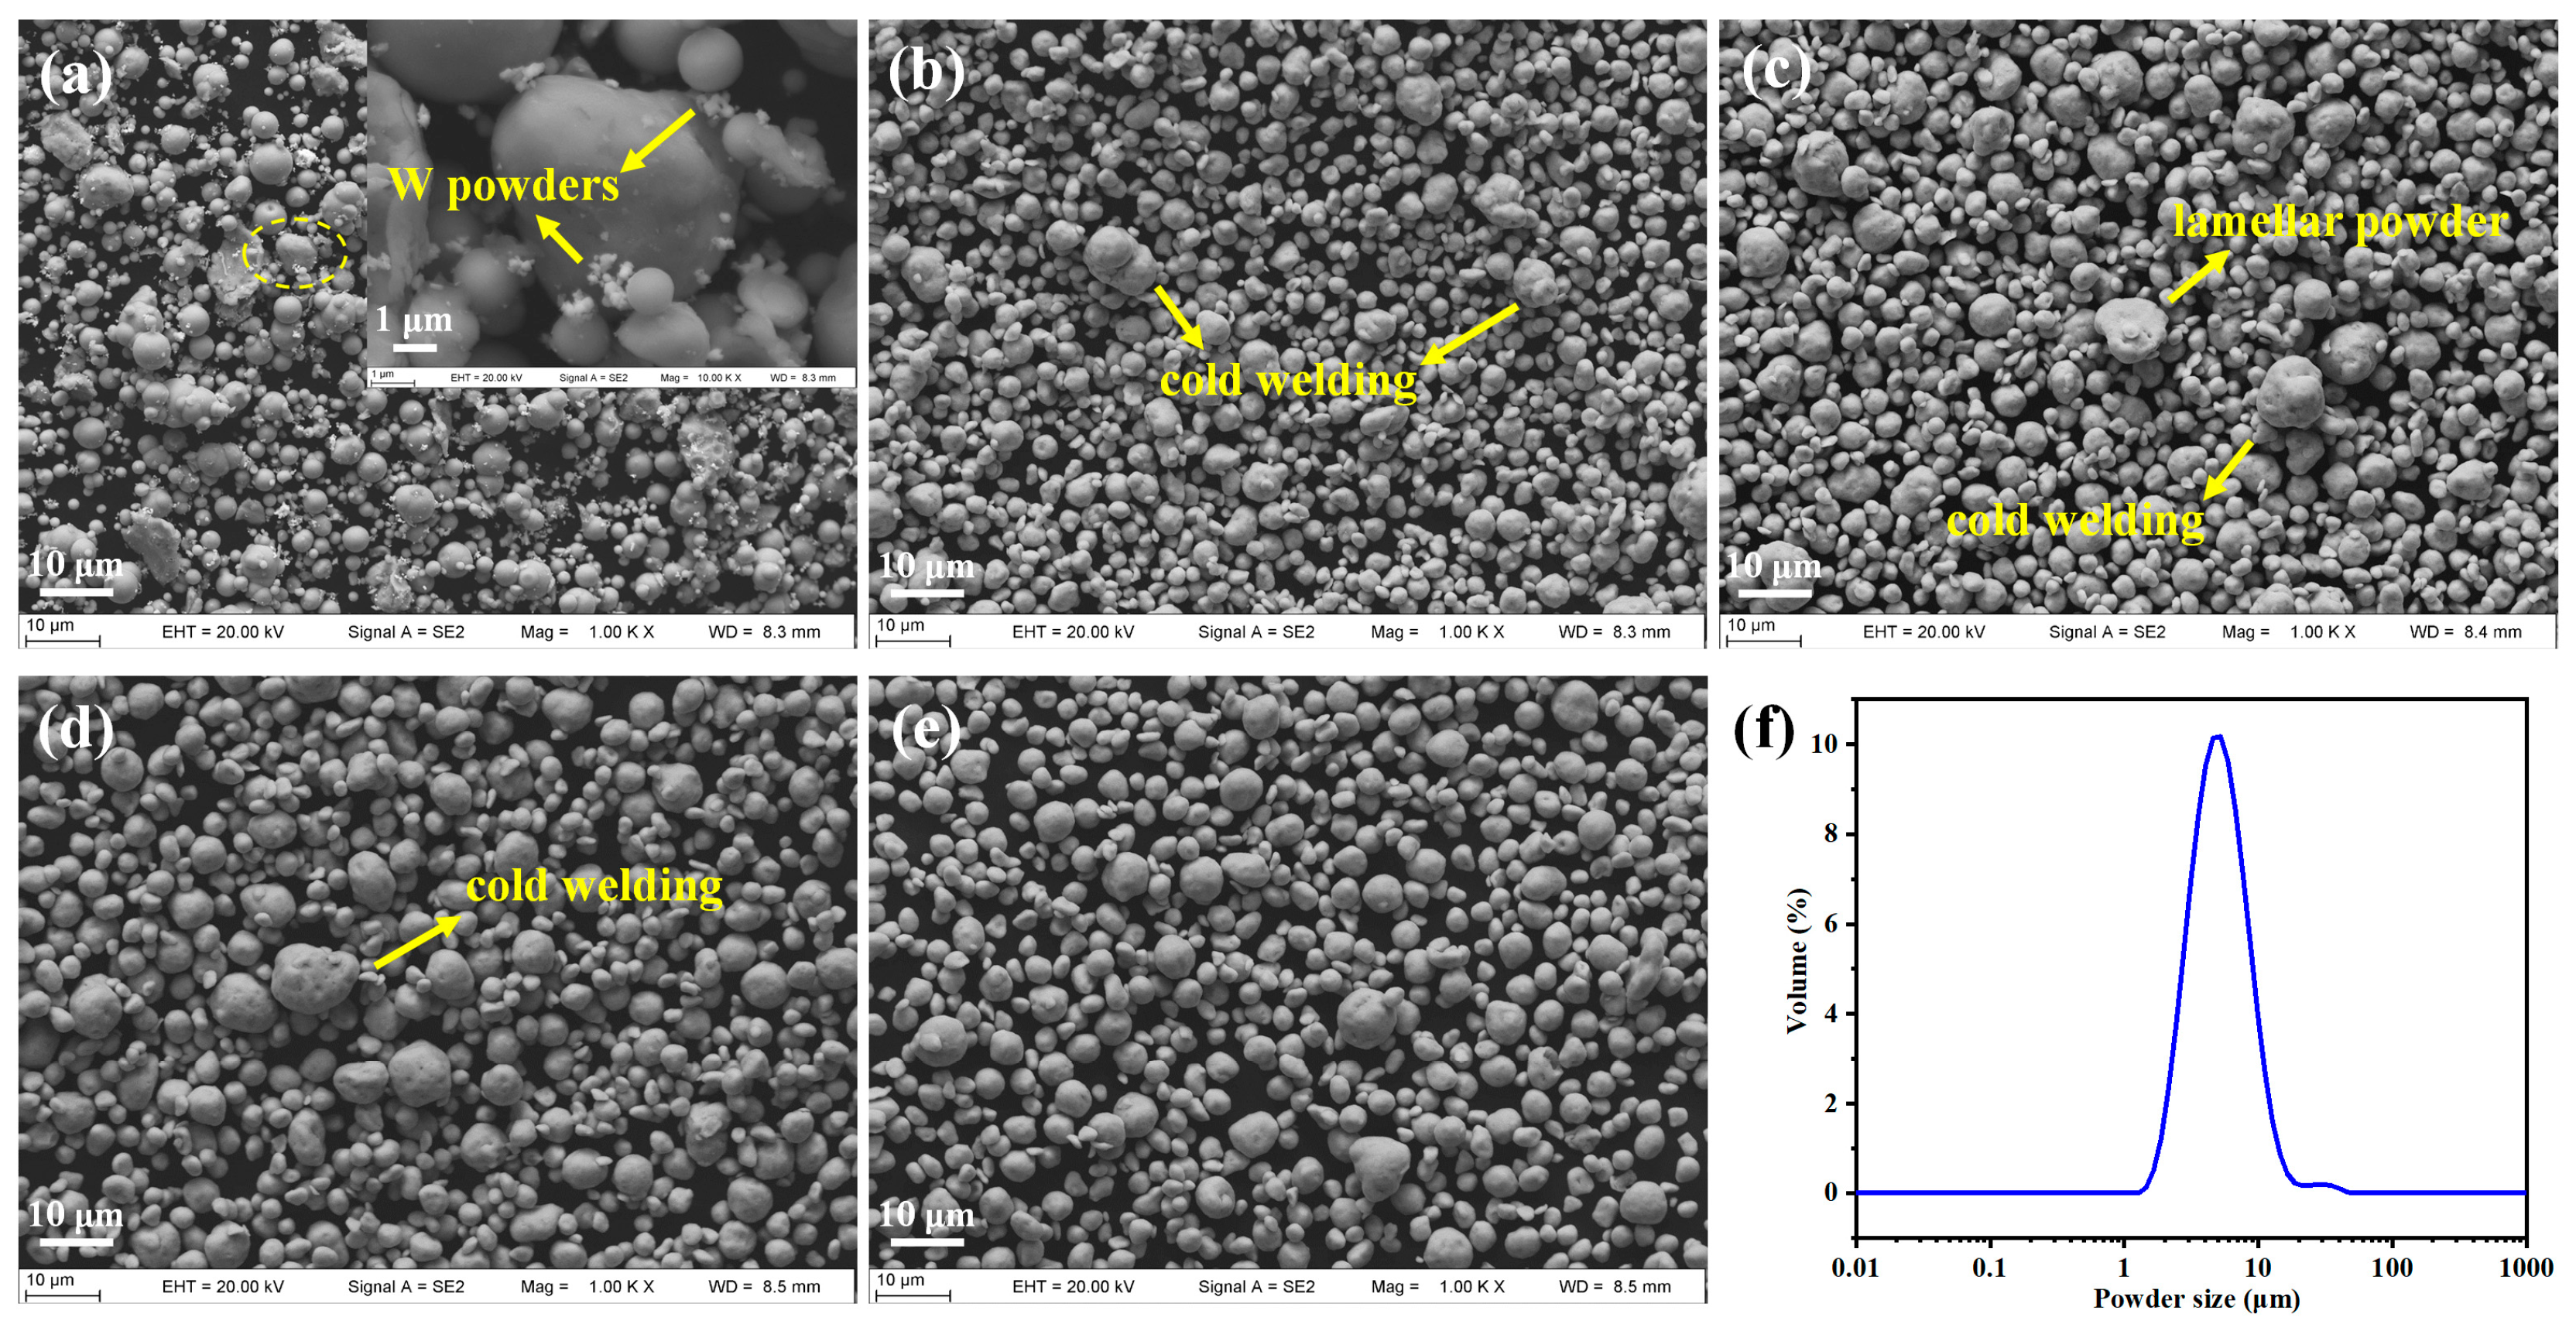
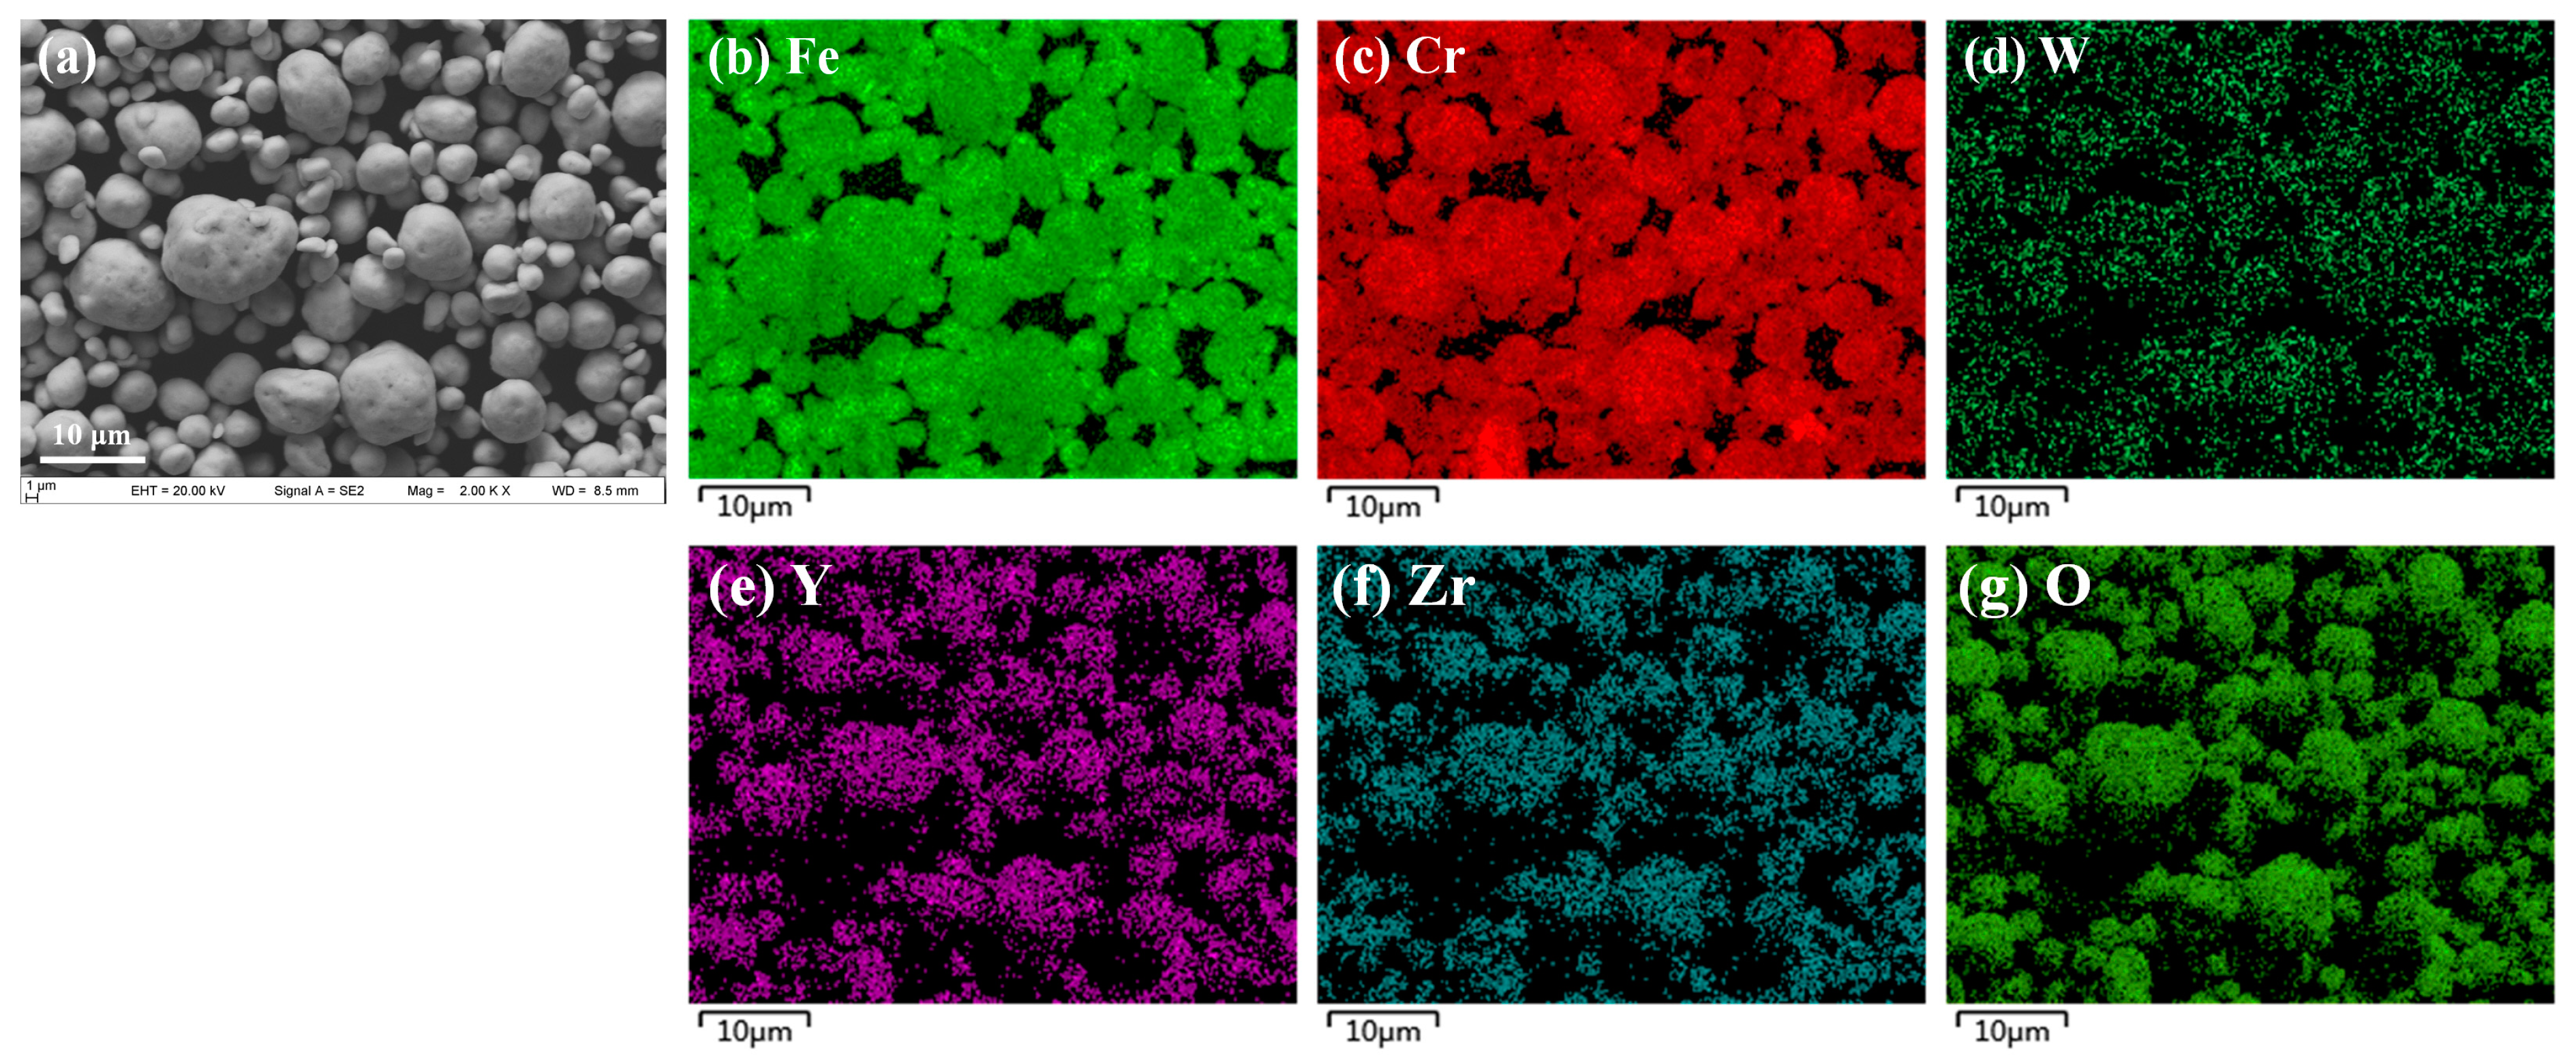
3.1.2. Influence of Milling Time on Microstructure of the MA Powders
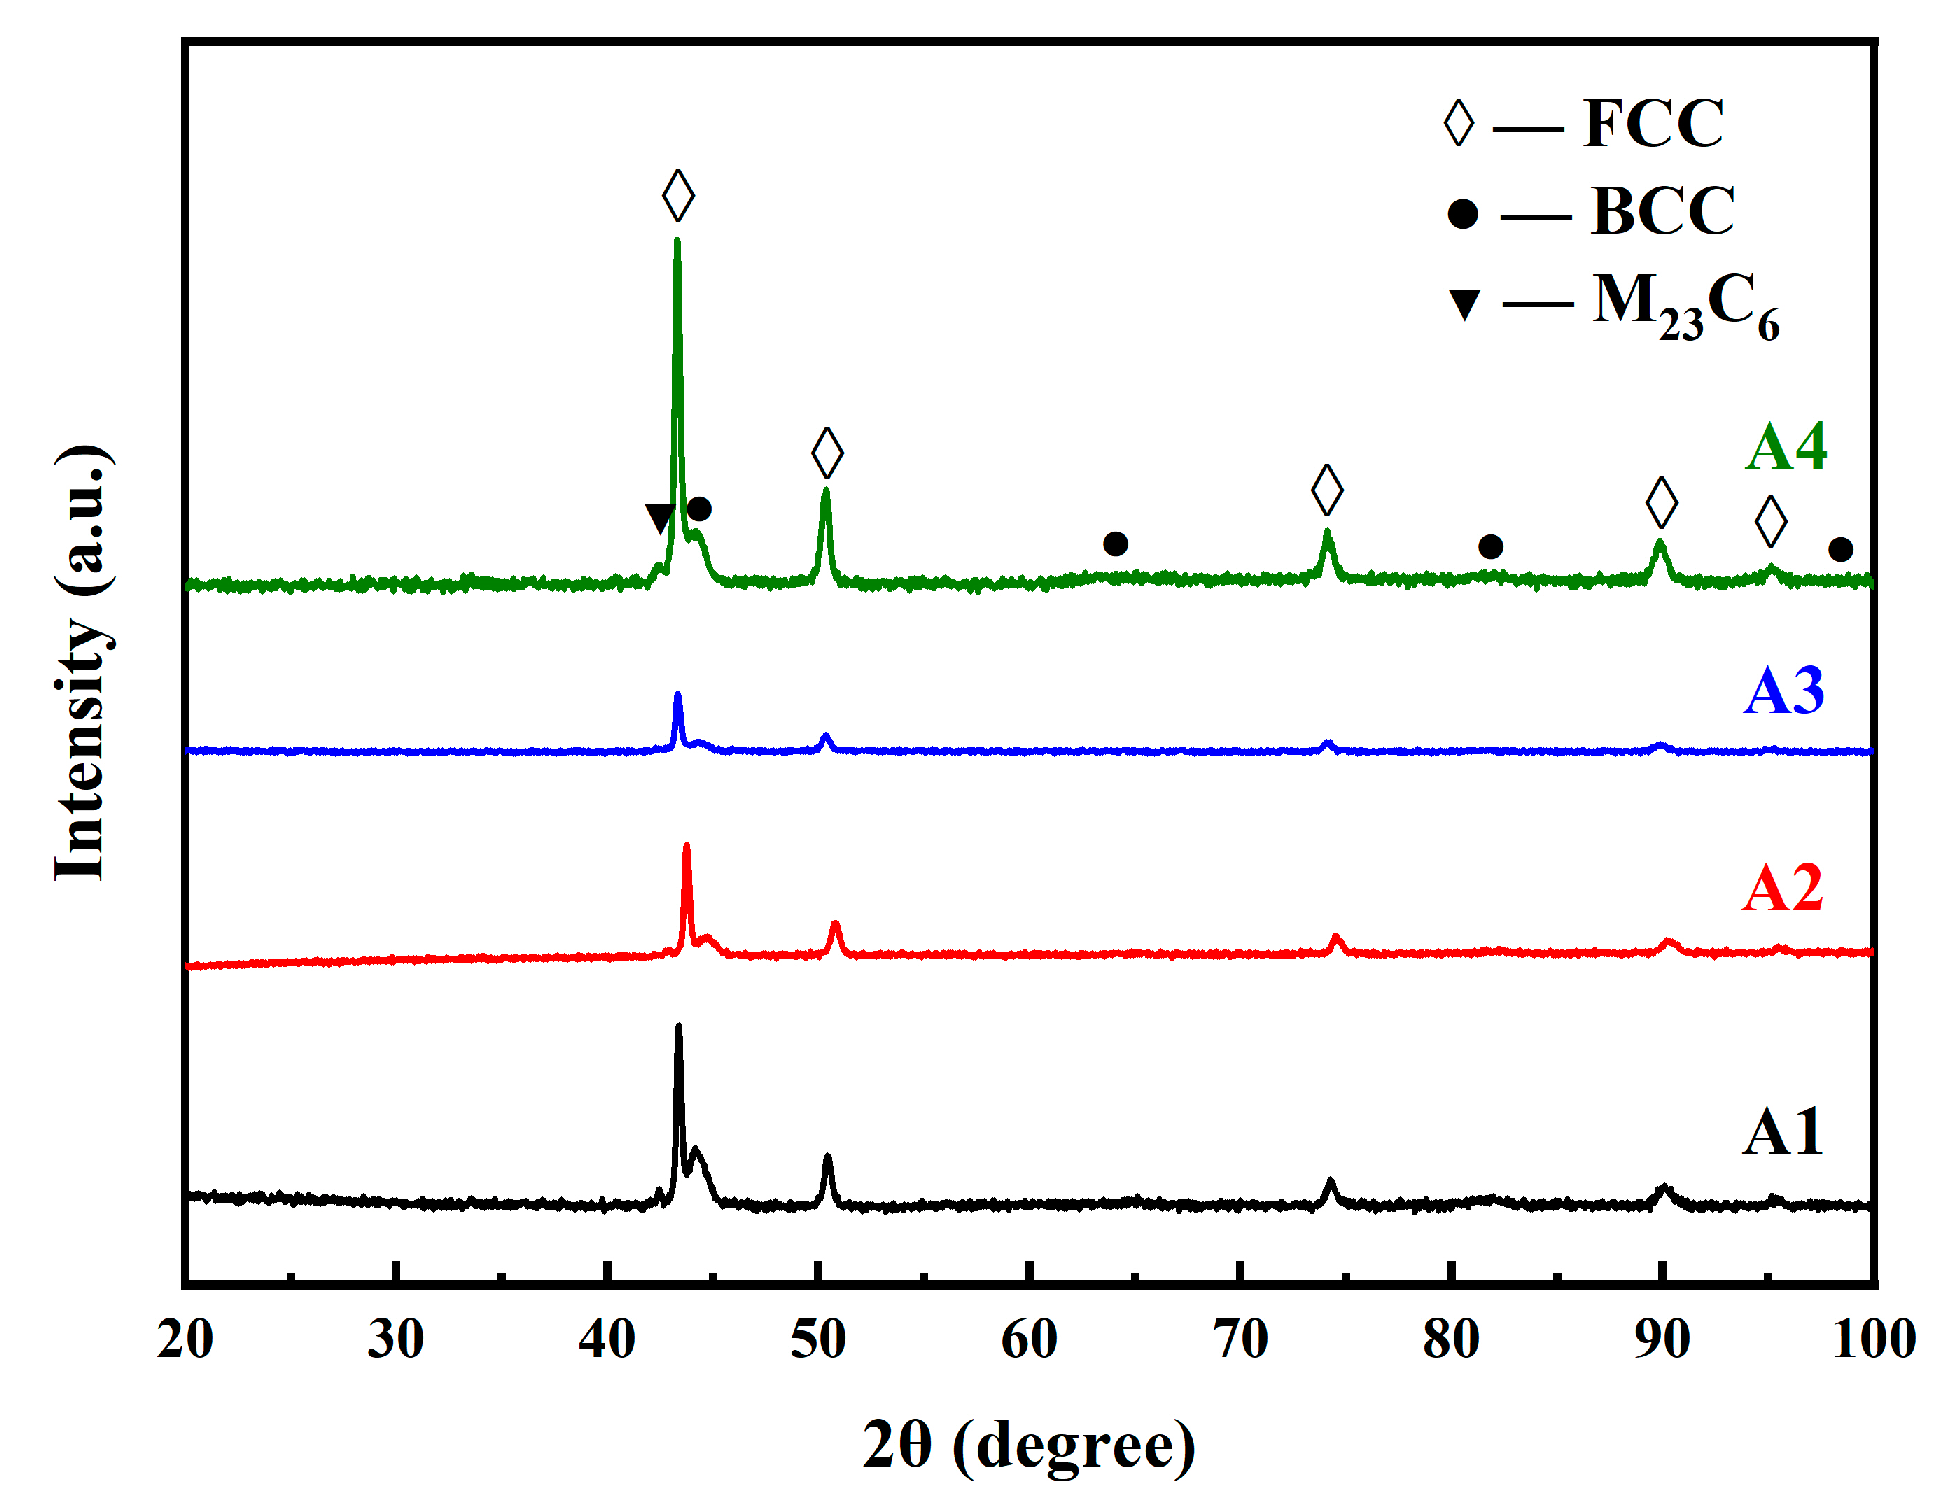
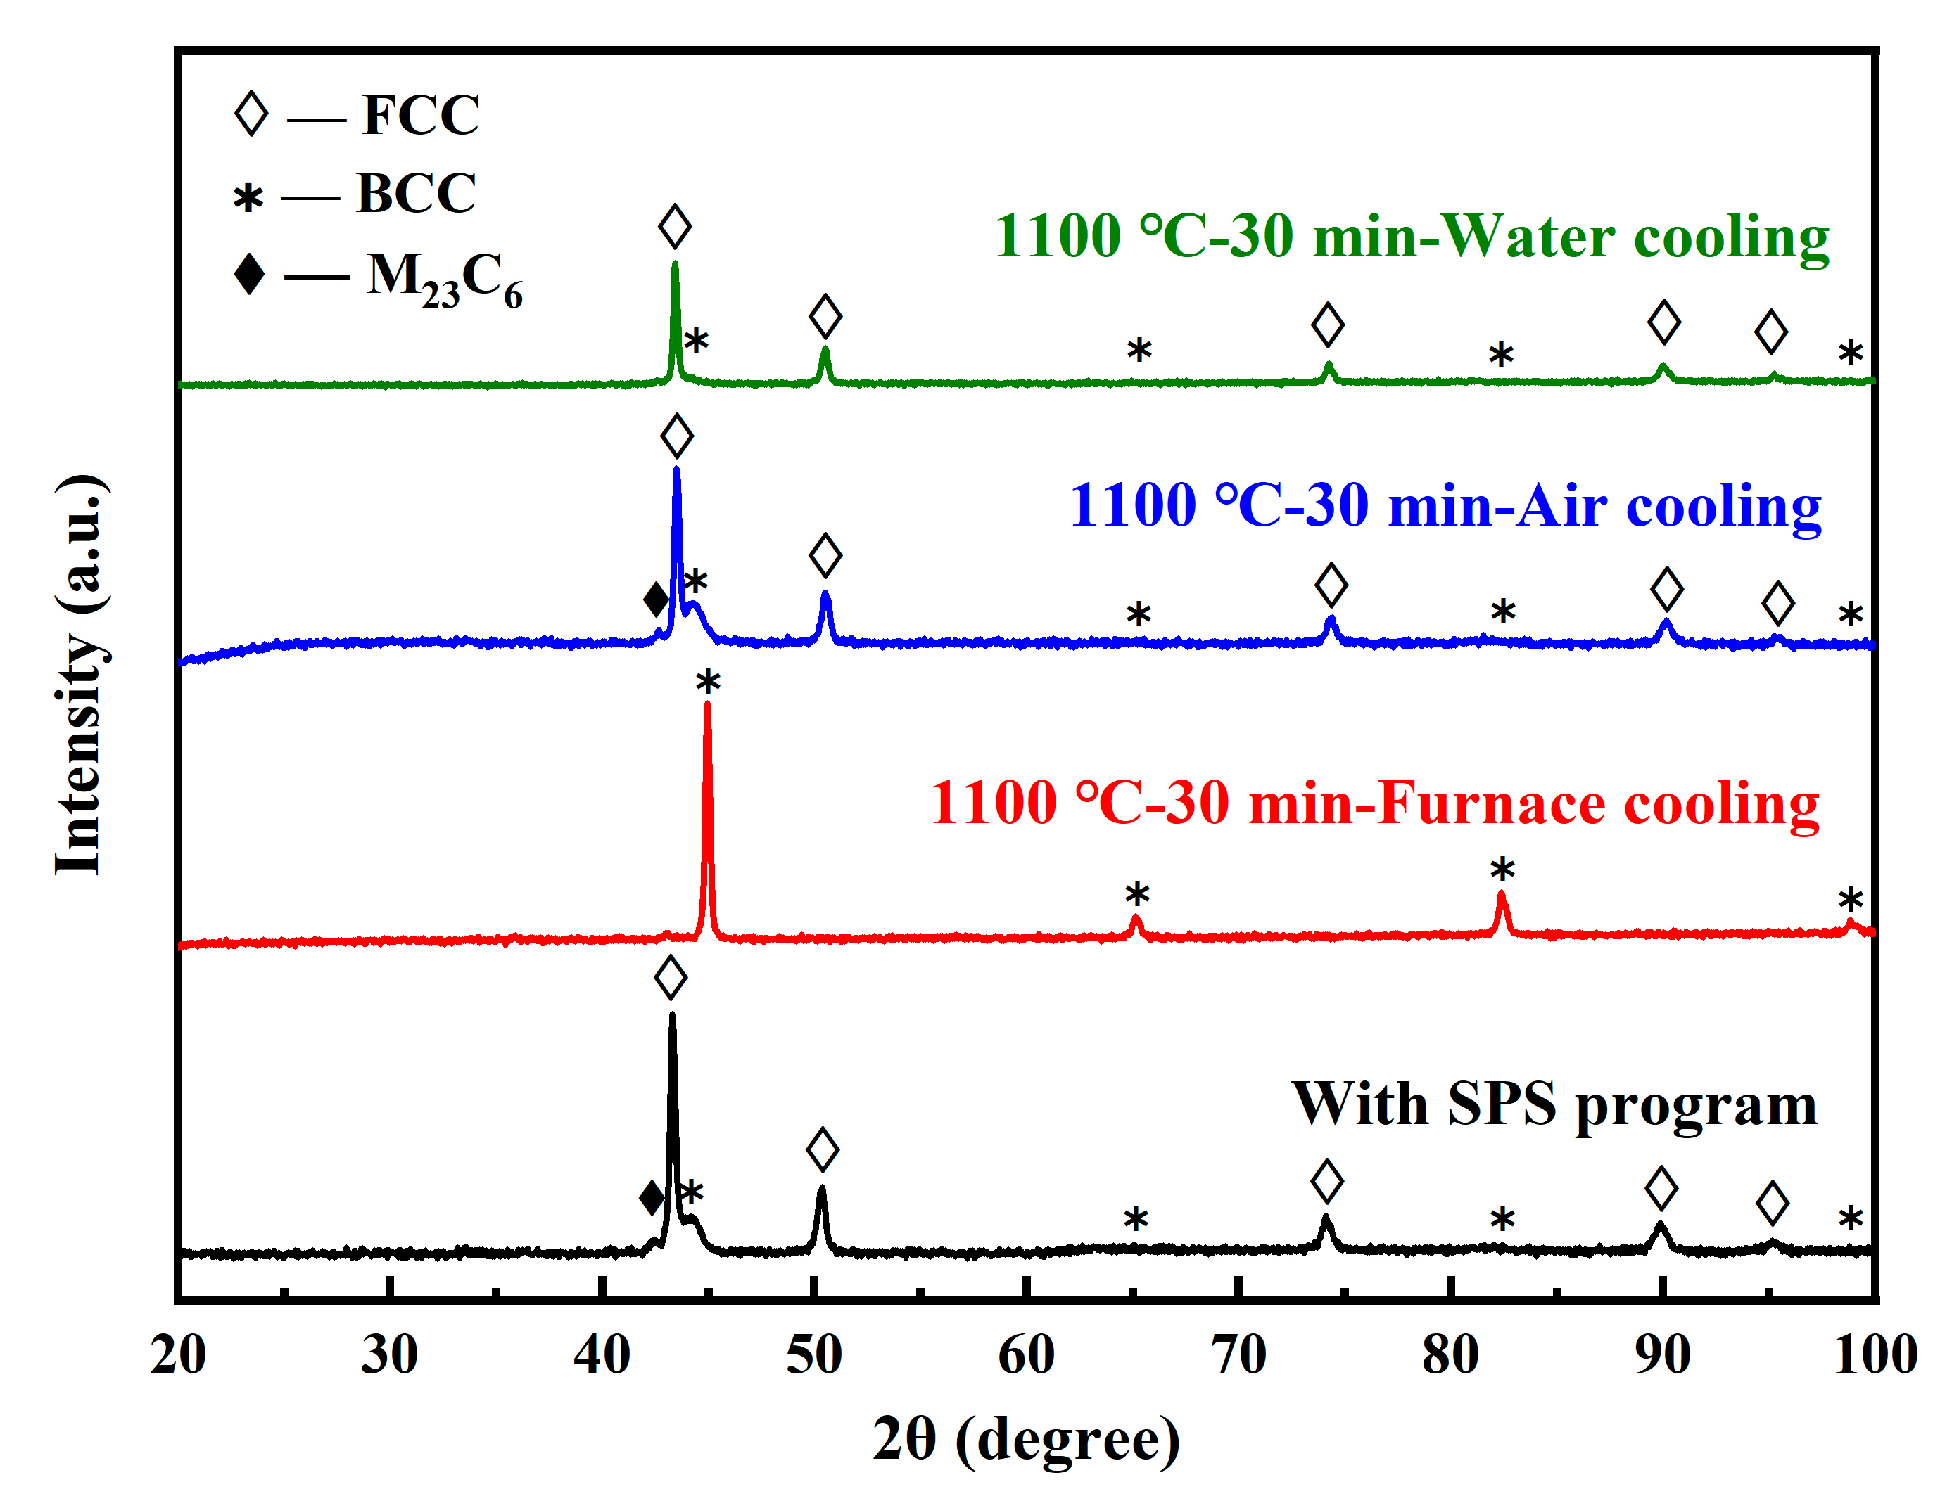
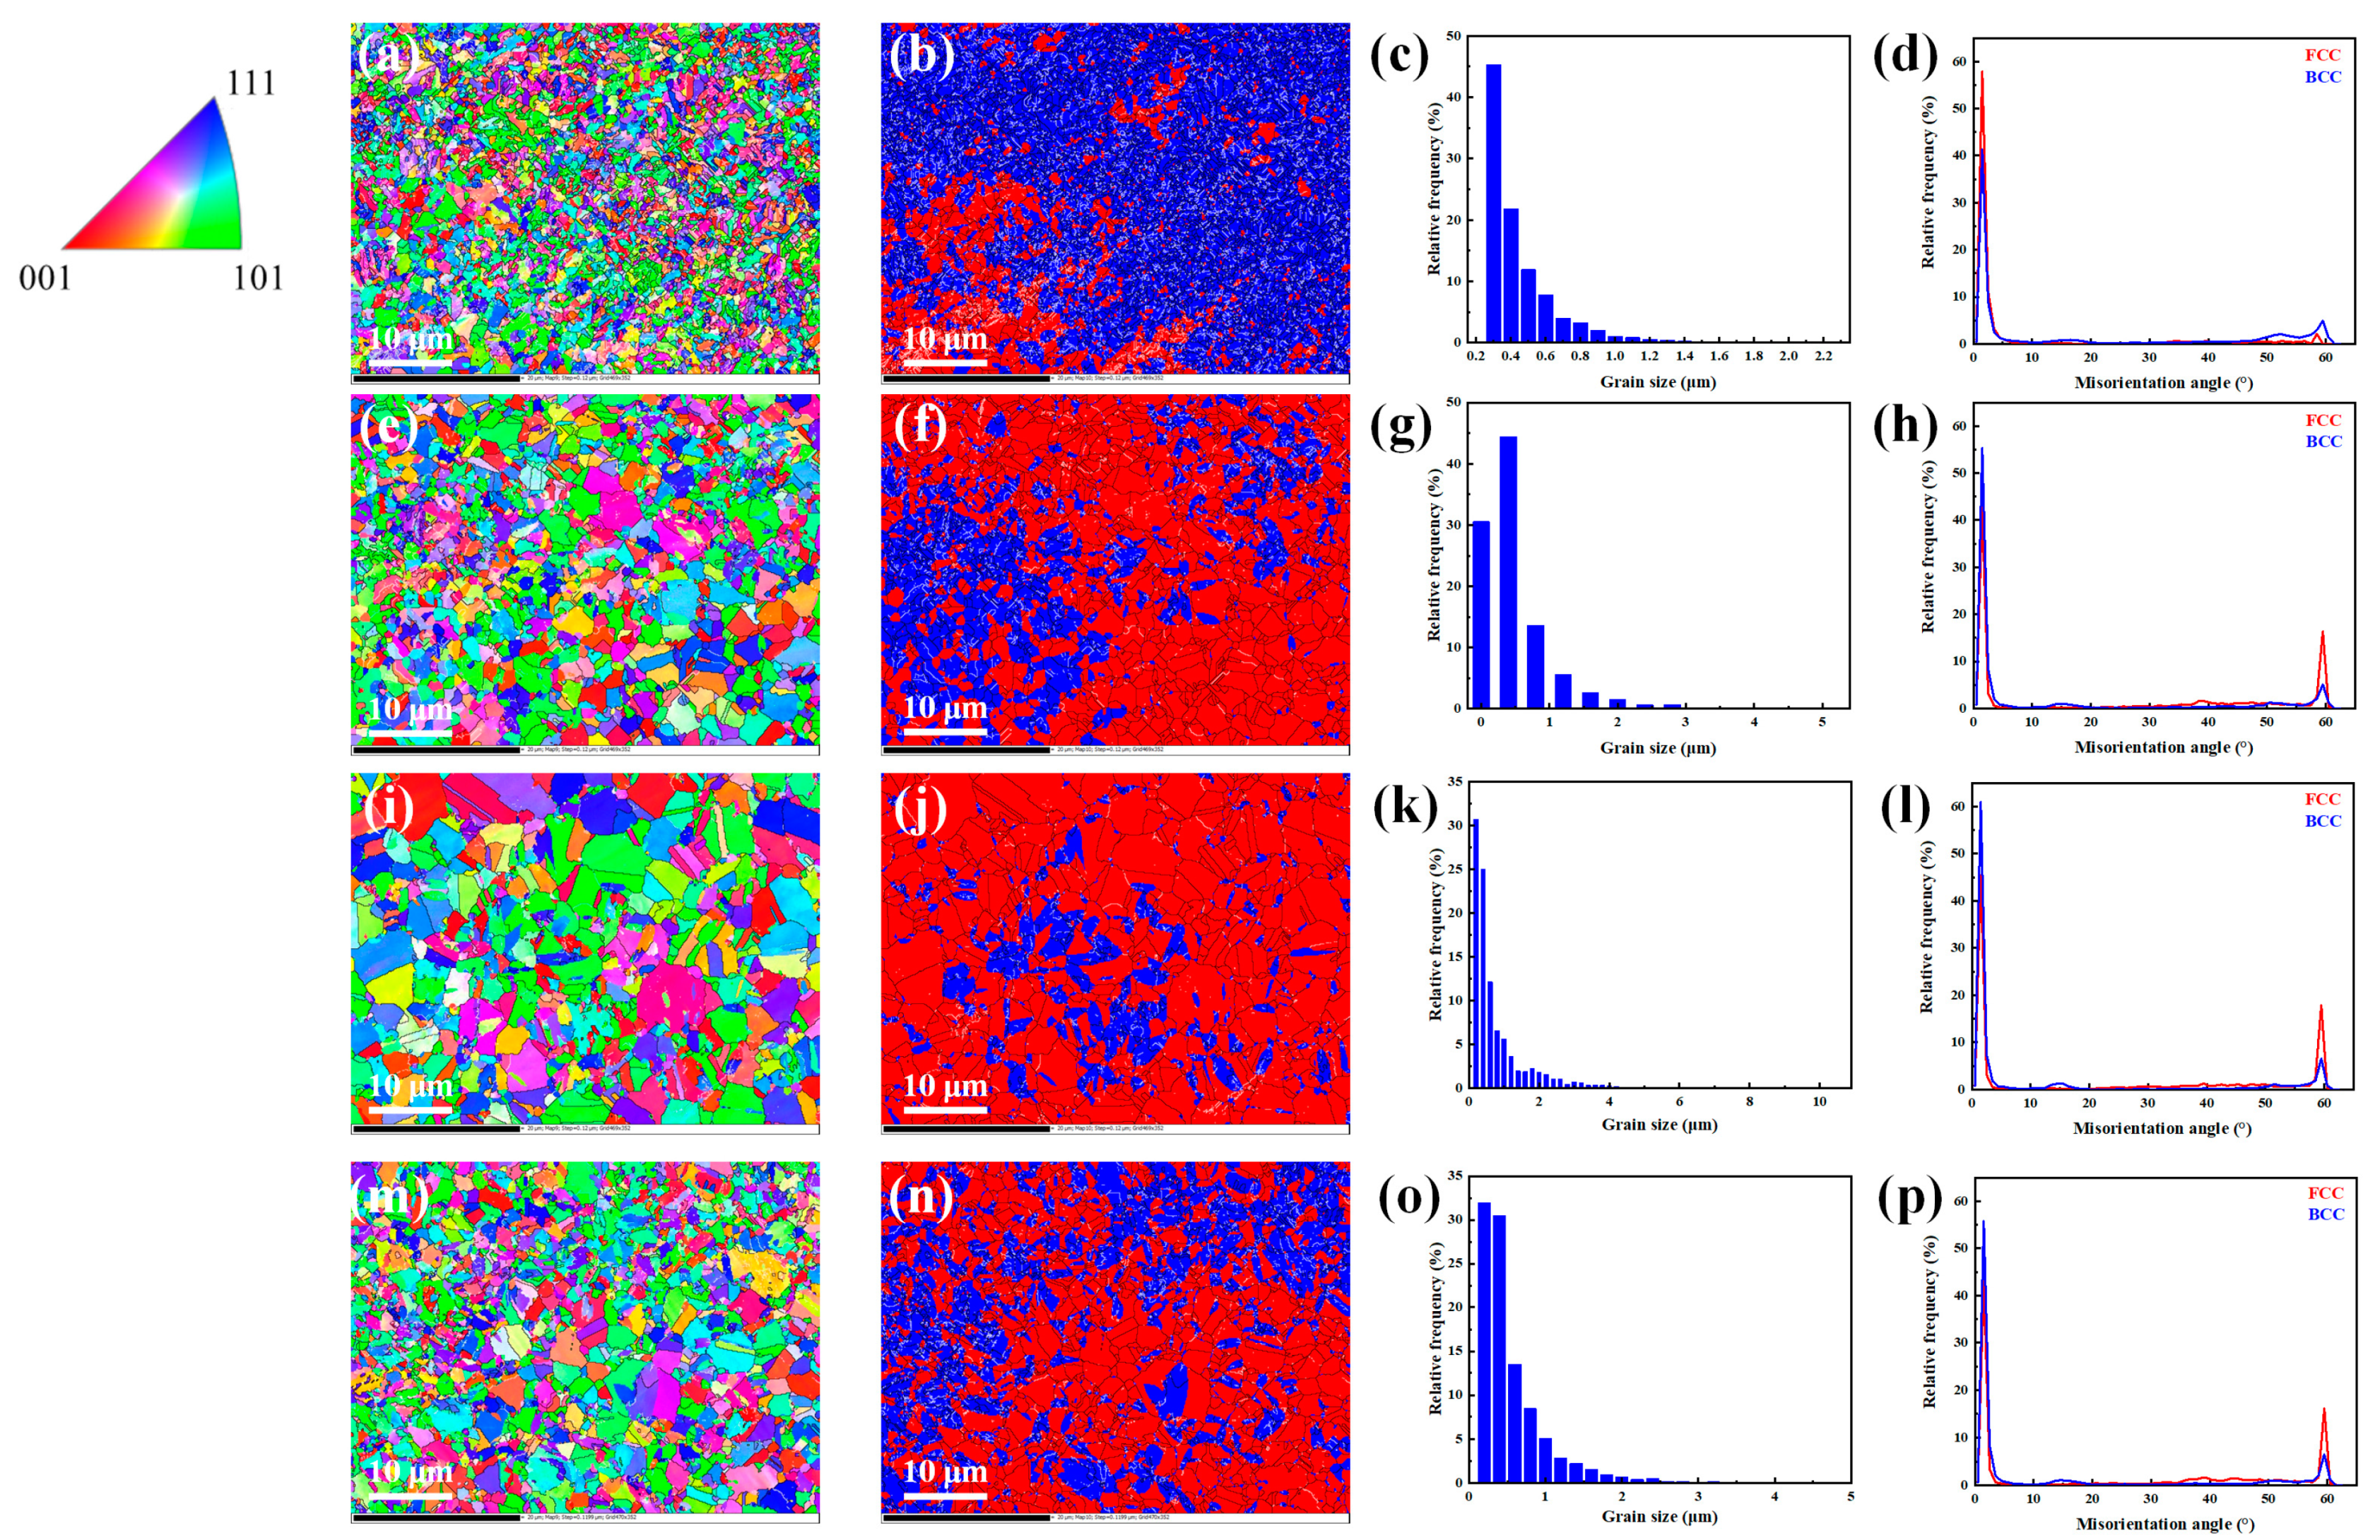
3.1.3. Influence of SPS Temperature Combination on Microstructure of the Sintered Samples
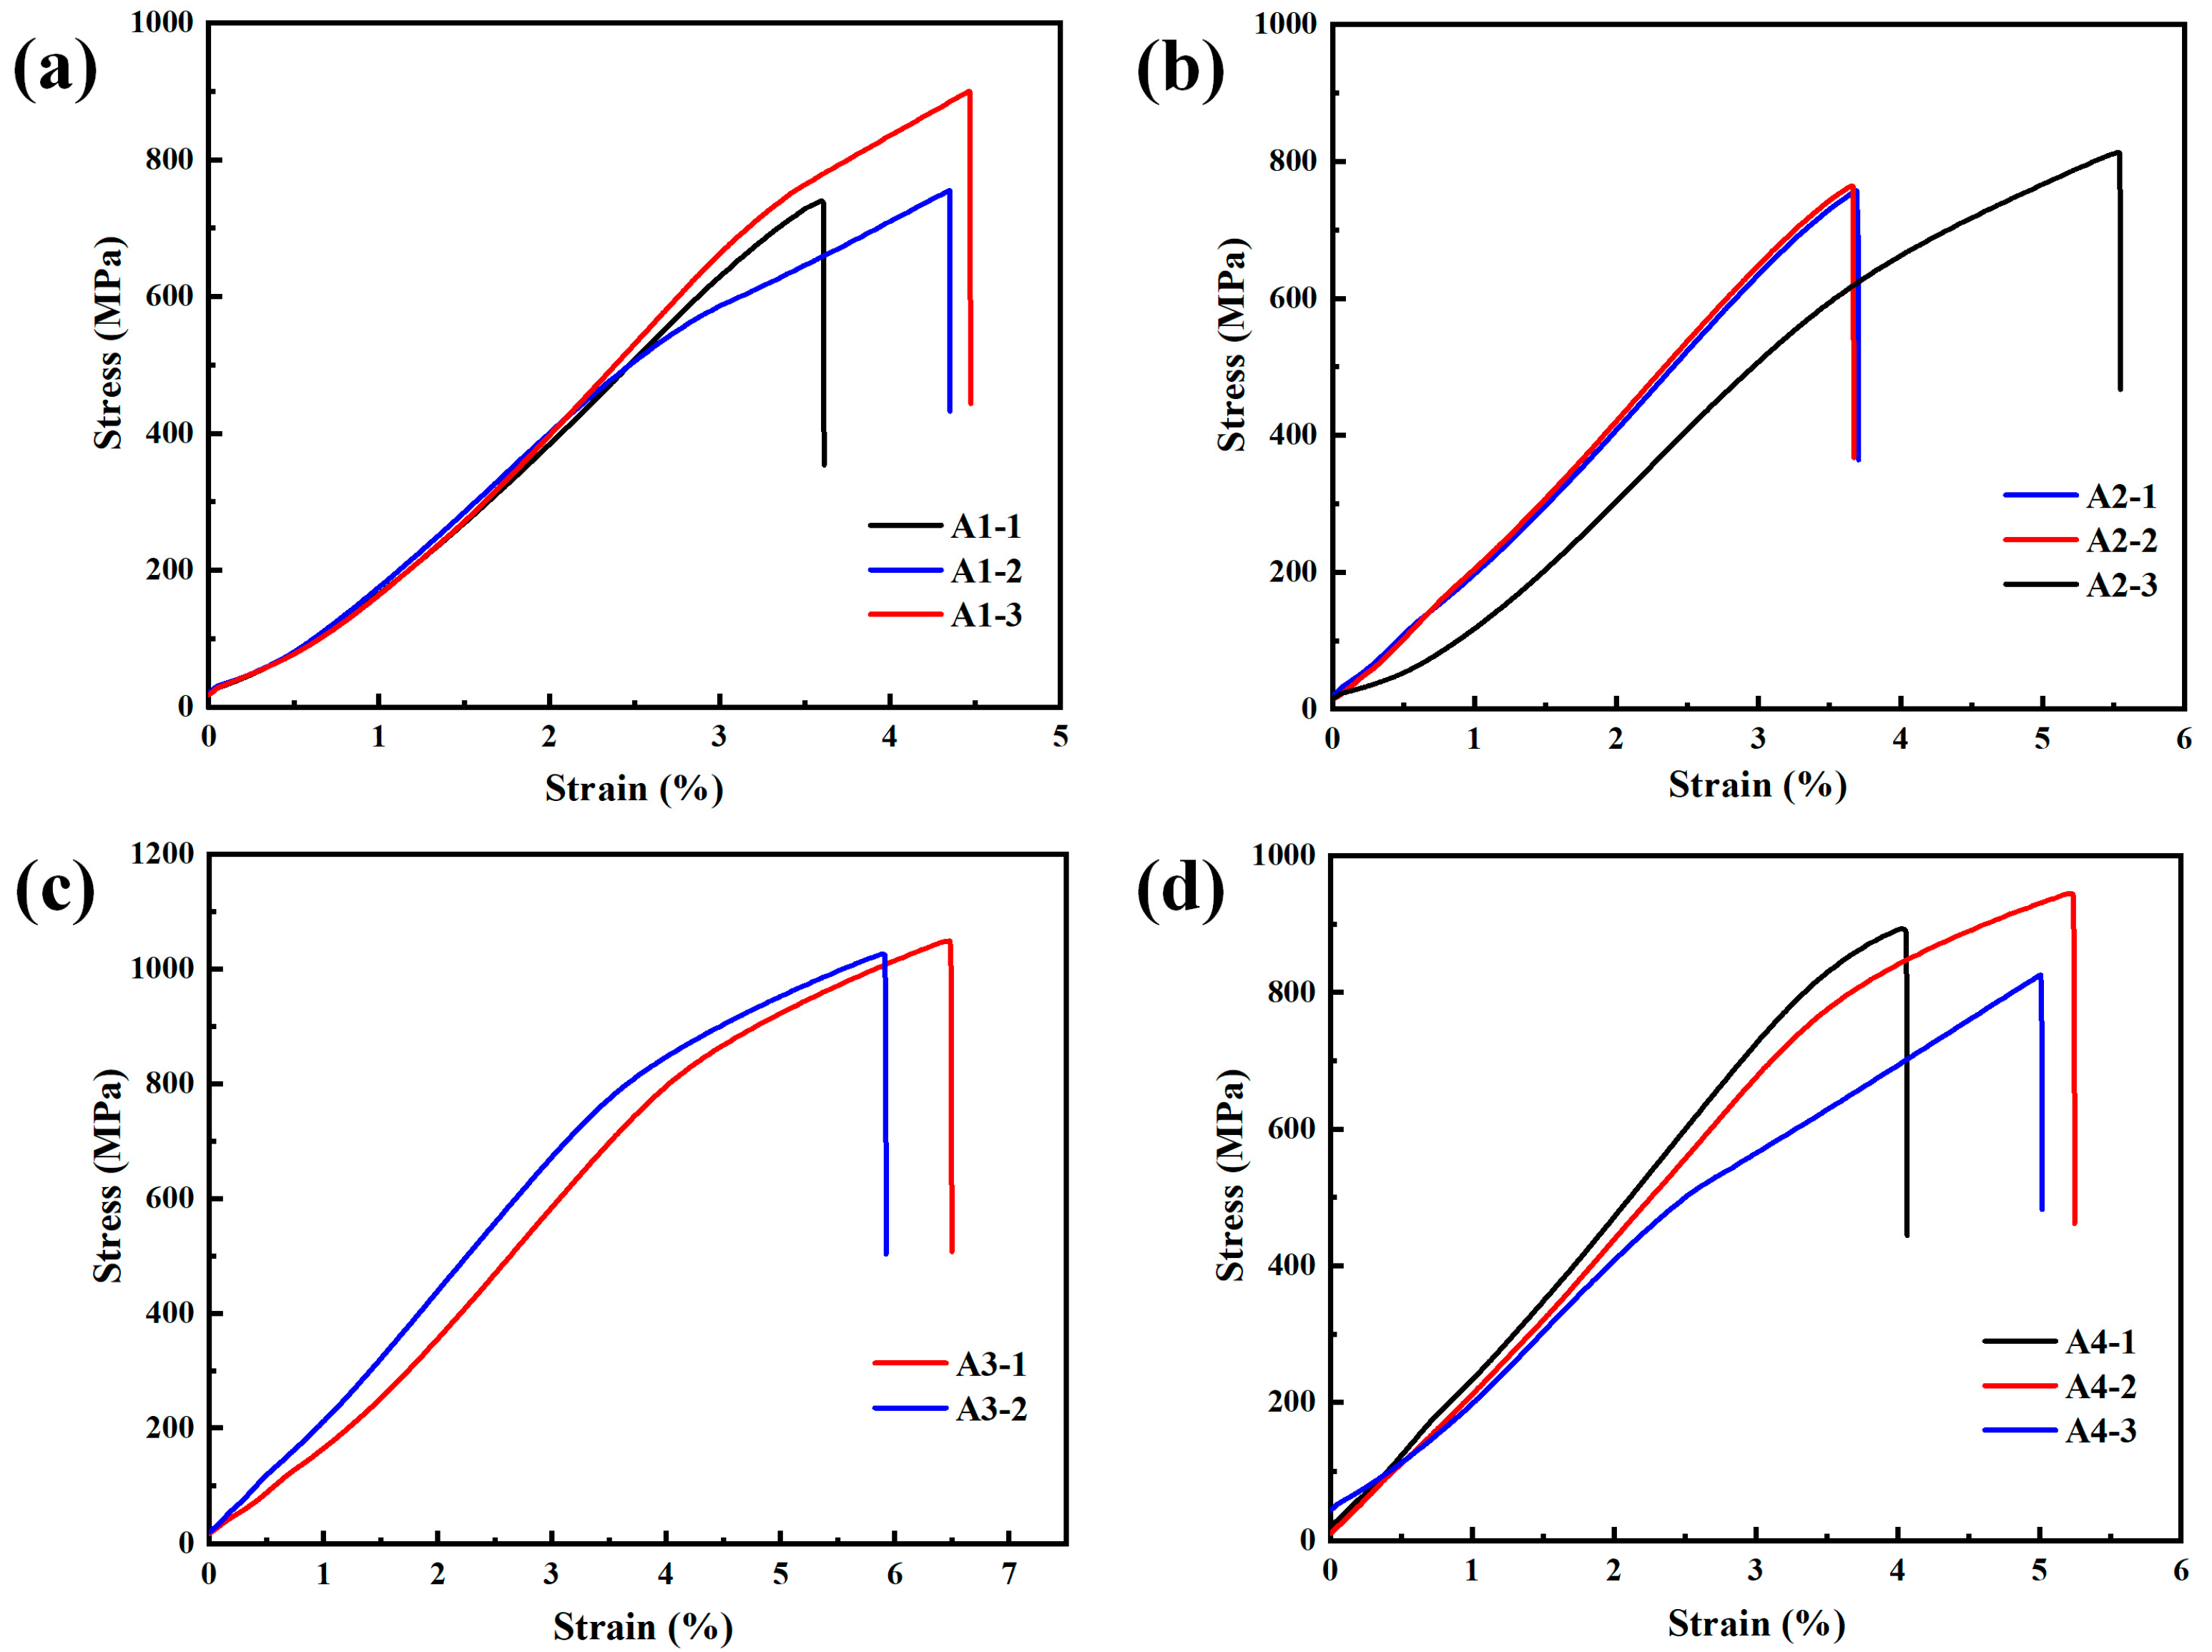
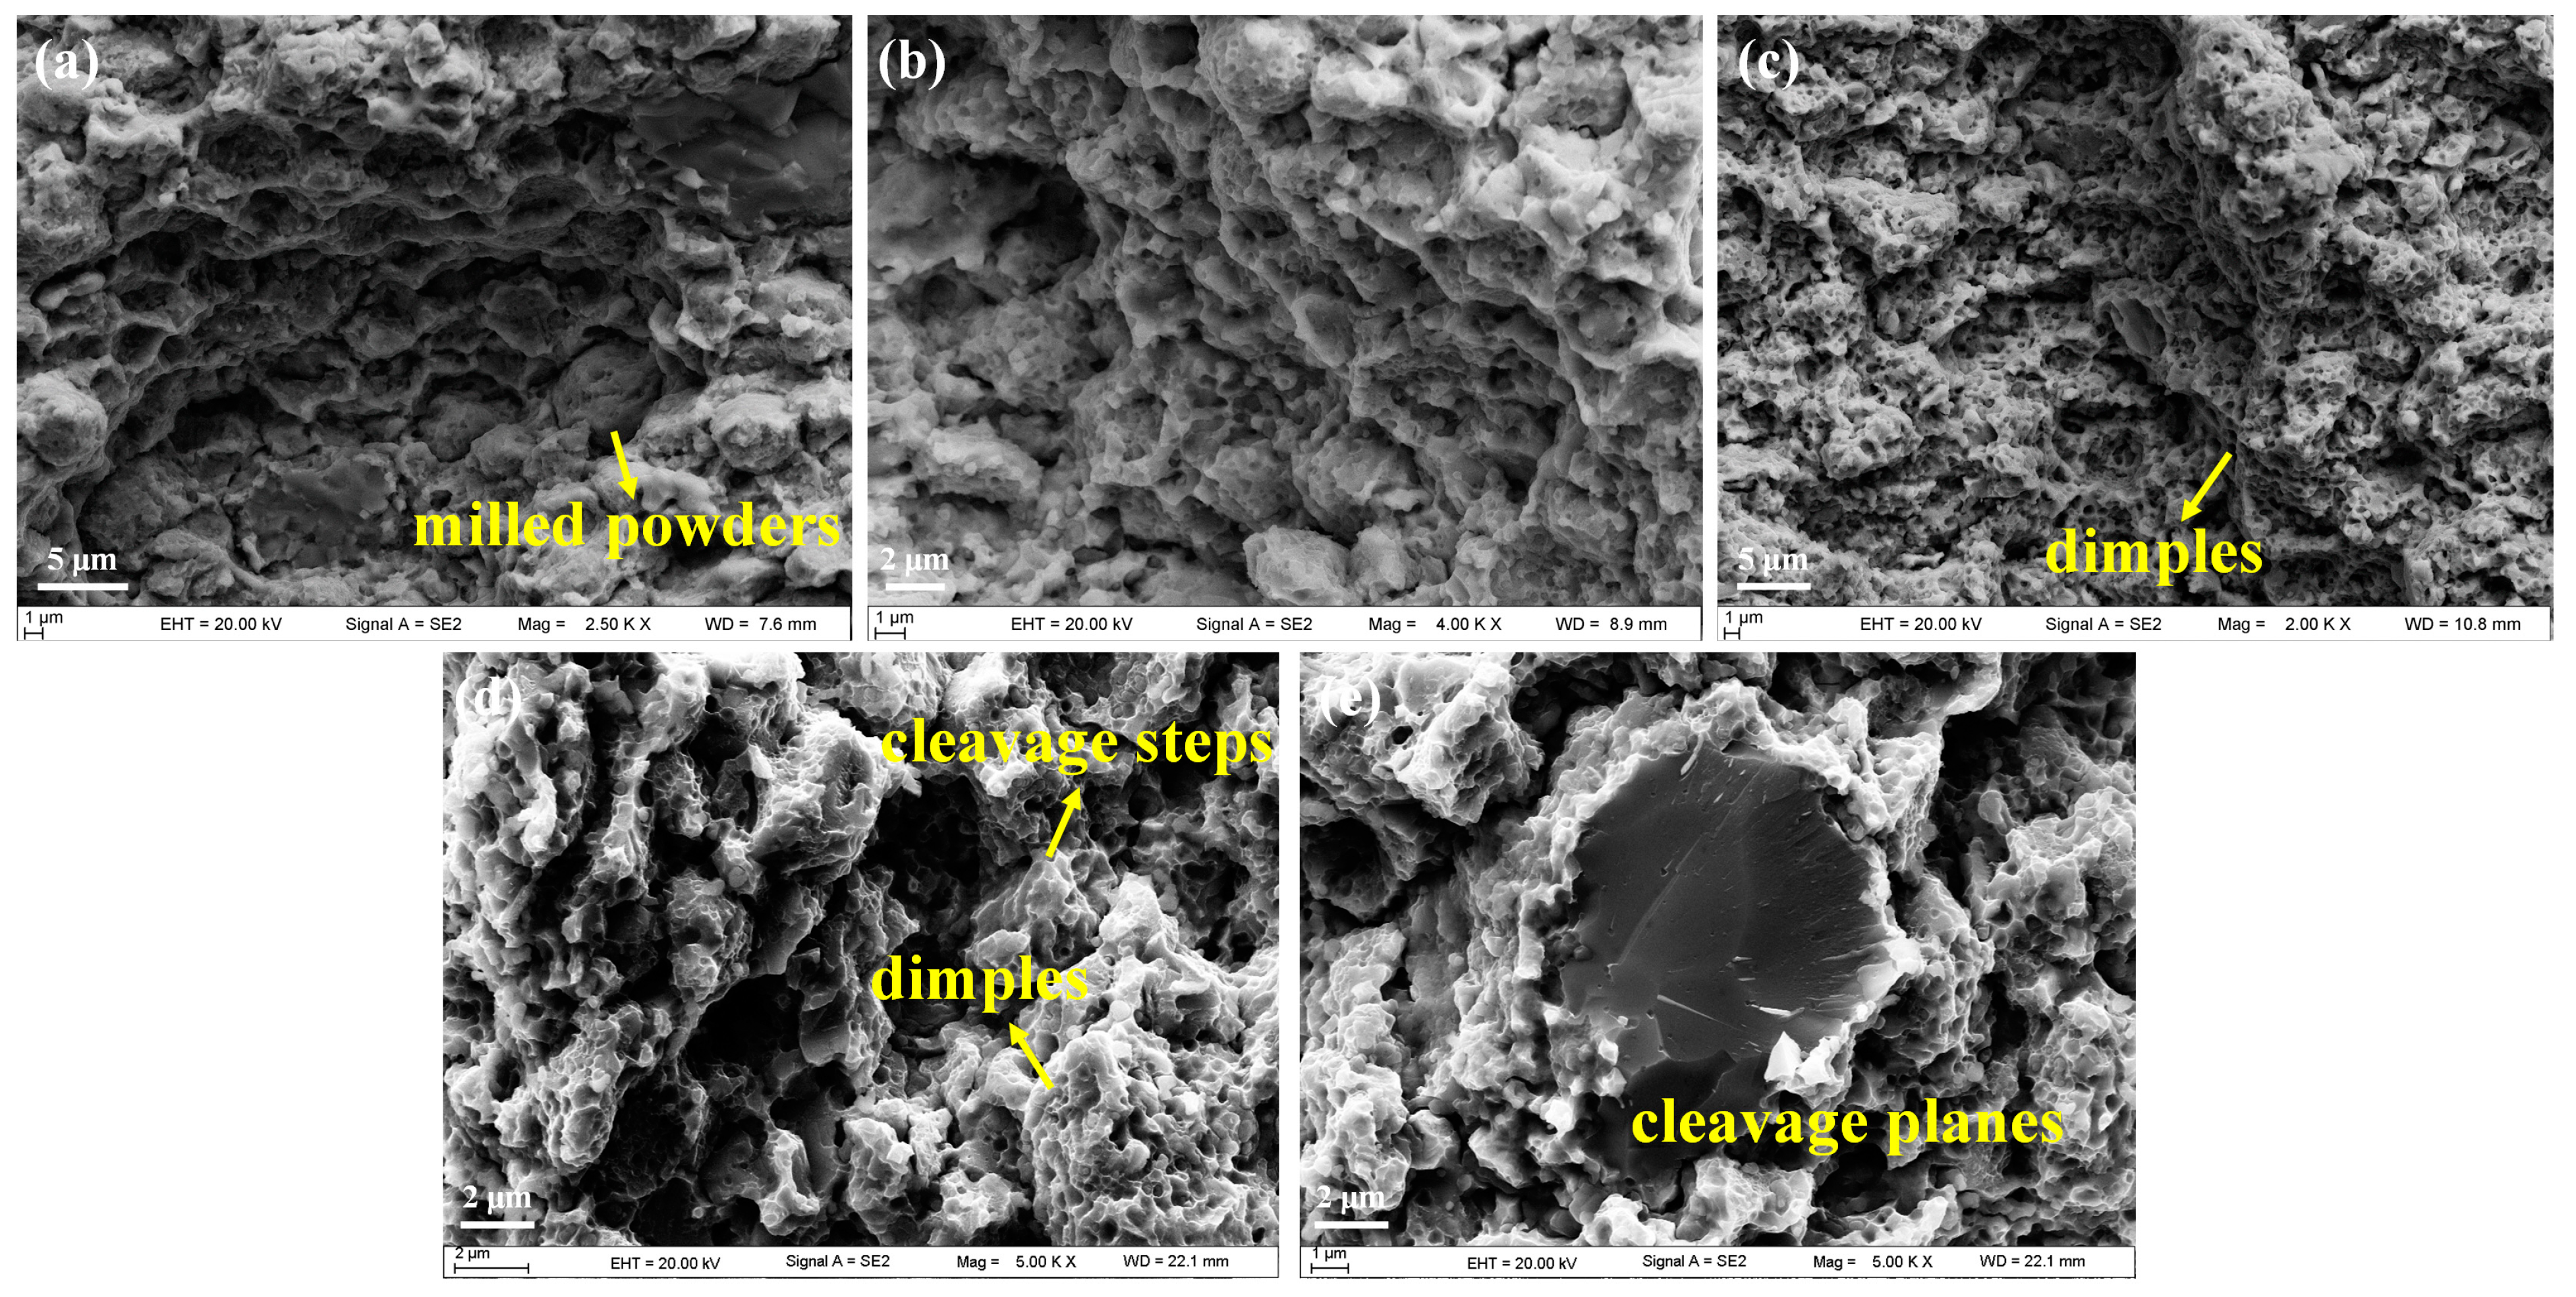
3.2. Mechanical Properties
4. Conclusions
- (1)
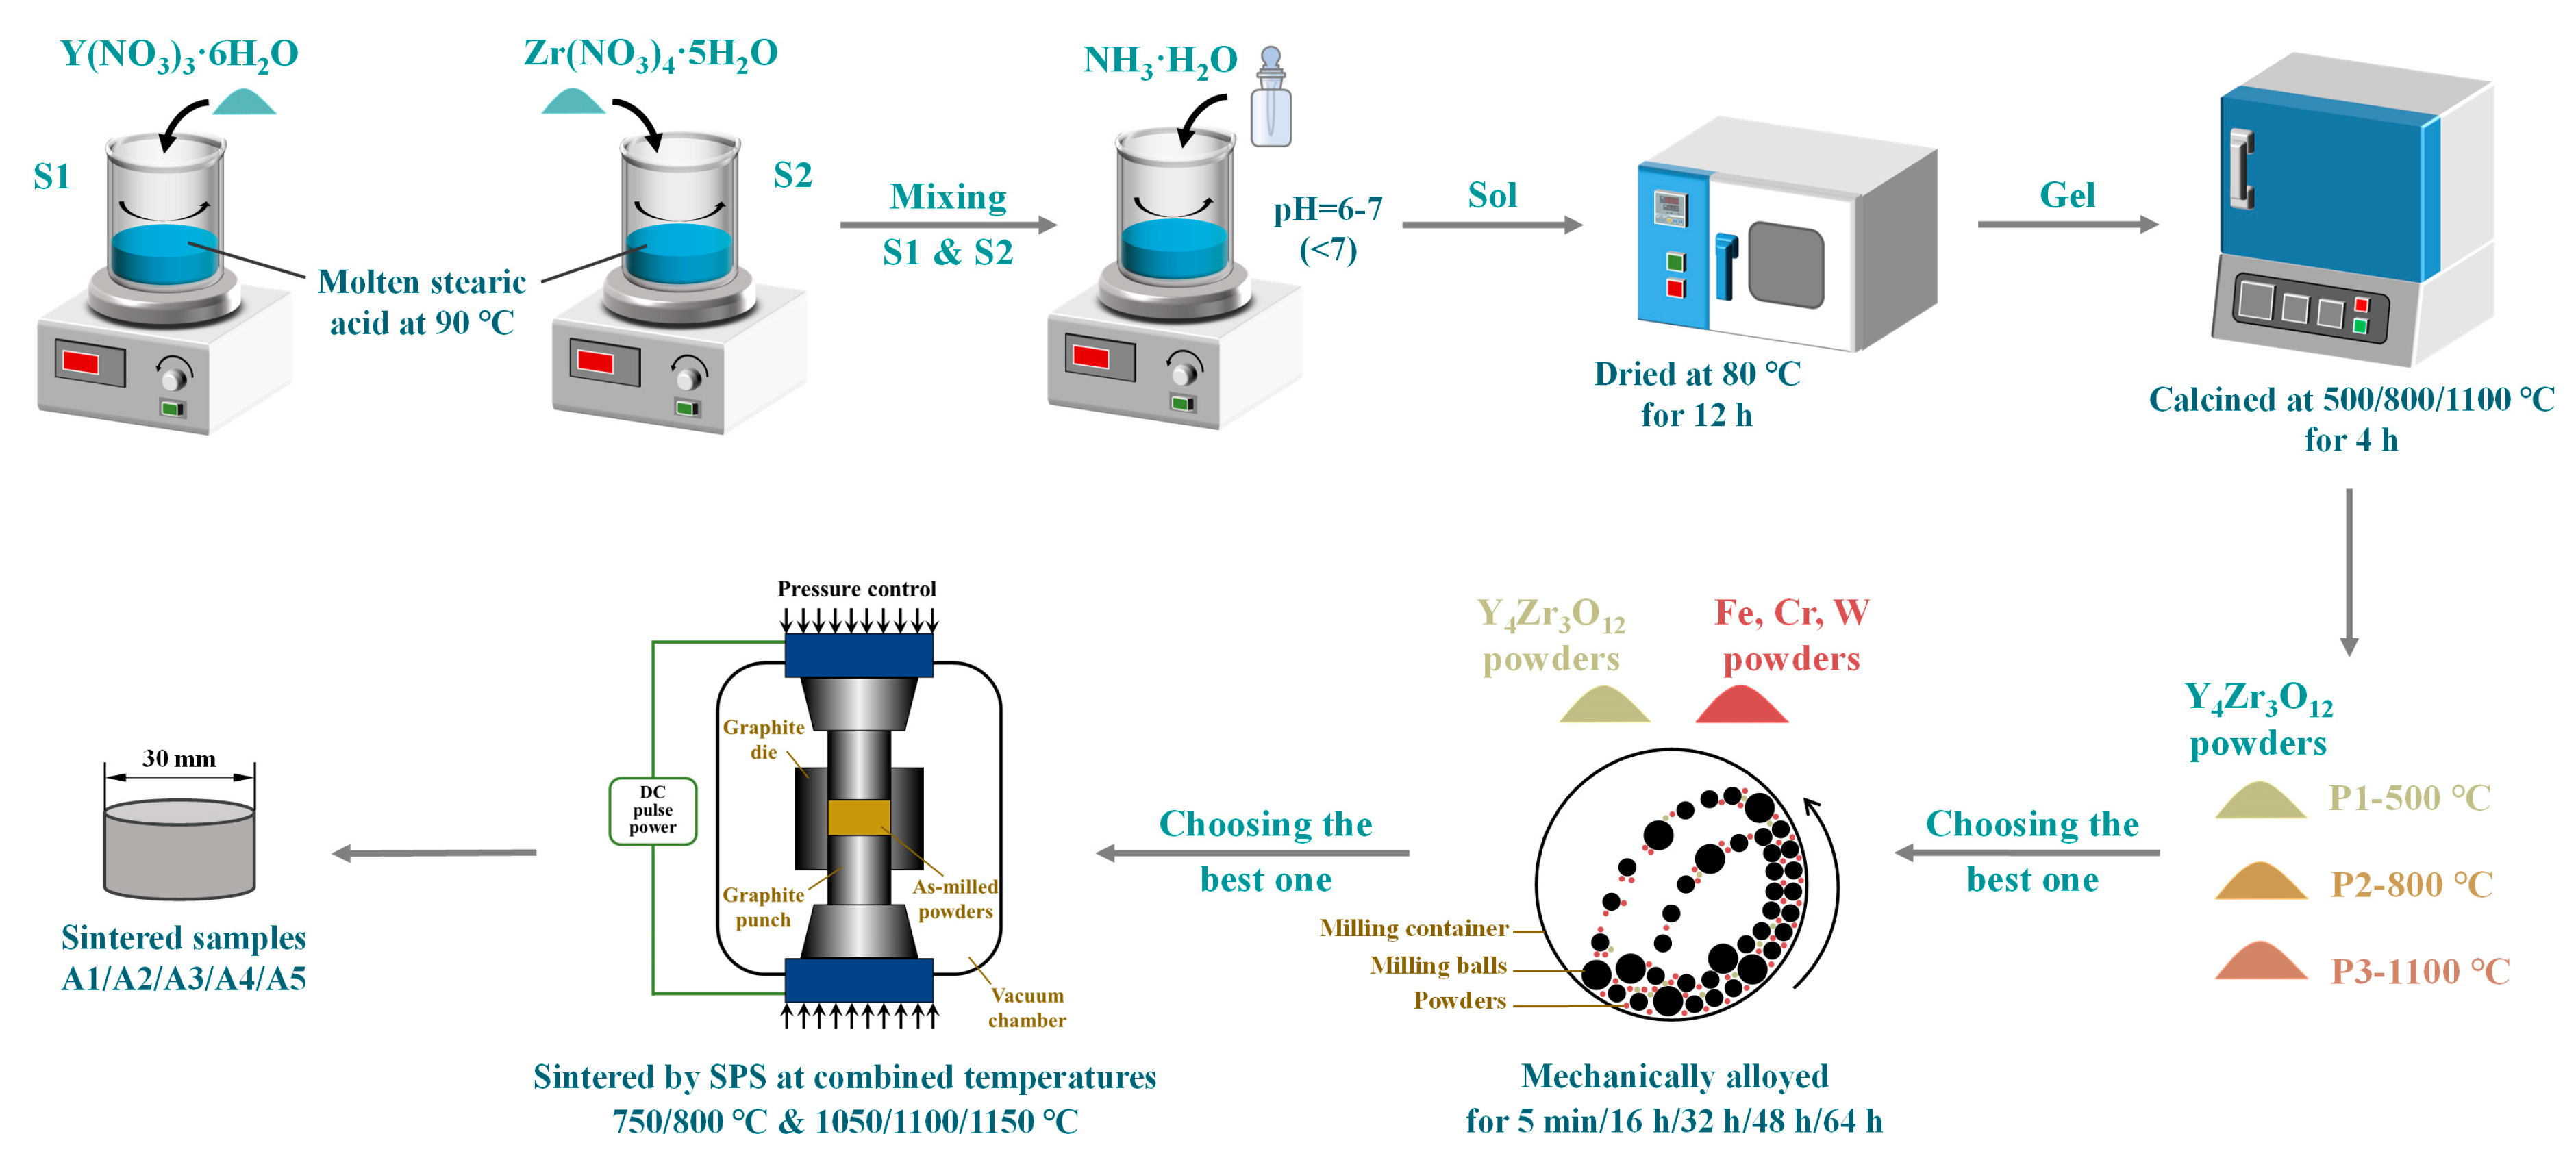
- Y4Zr3O12 powders with a grain size of only 3.5 nm, were well prepared by the sol-gel method. During the preparation process of Y4Zr3O12, NH3·H2O was added, in order to bind Y3+ and Zr4+ after mixing Y(NO3)3·6H2O and Zr(NO3)4·5H2O in the molten stearic acid. Y4Zr3O12 was stable, due to its high binding energy, during the MA and SPS processes.
- (2)
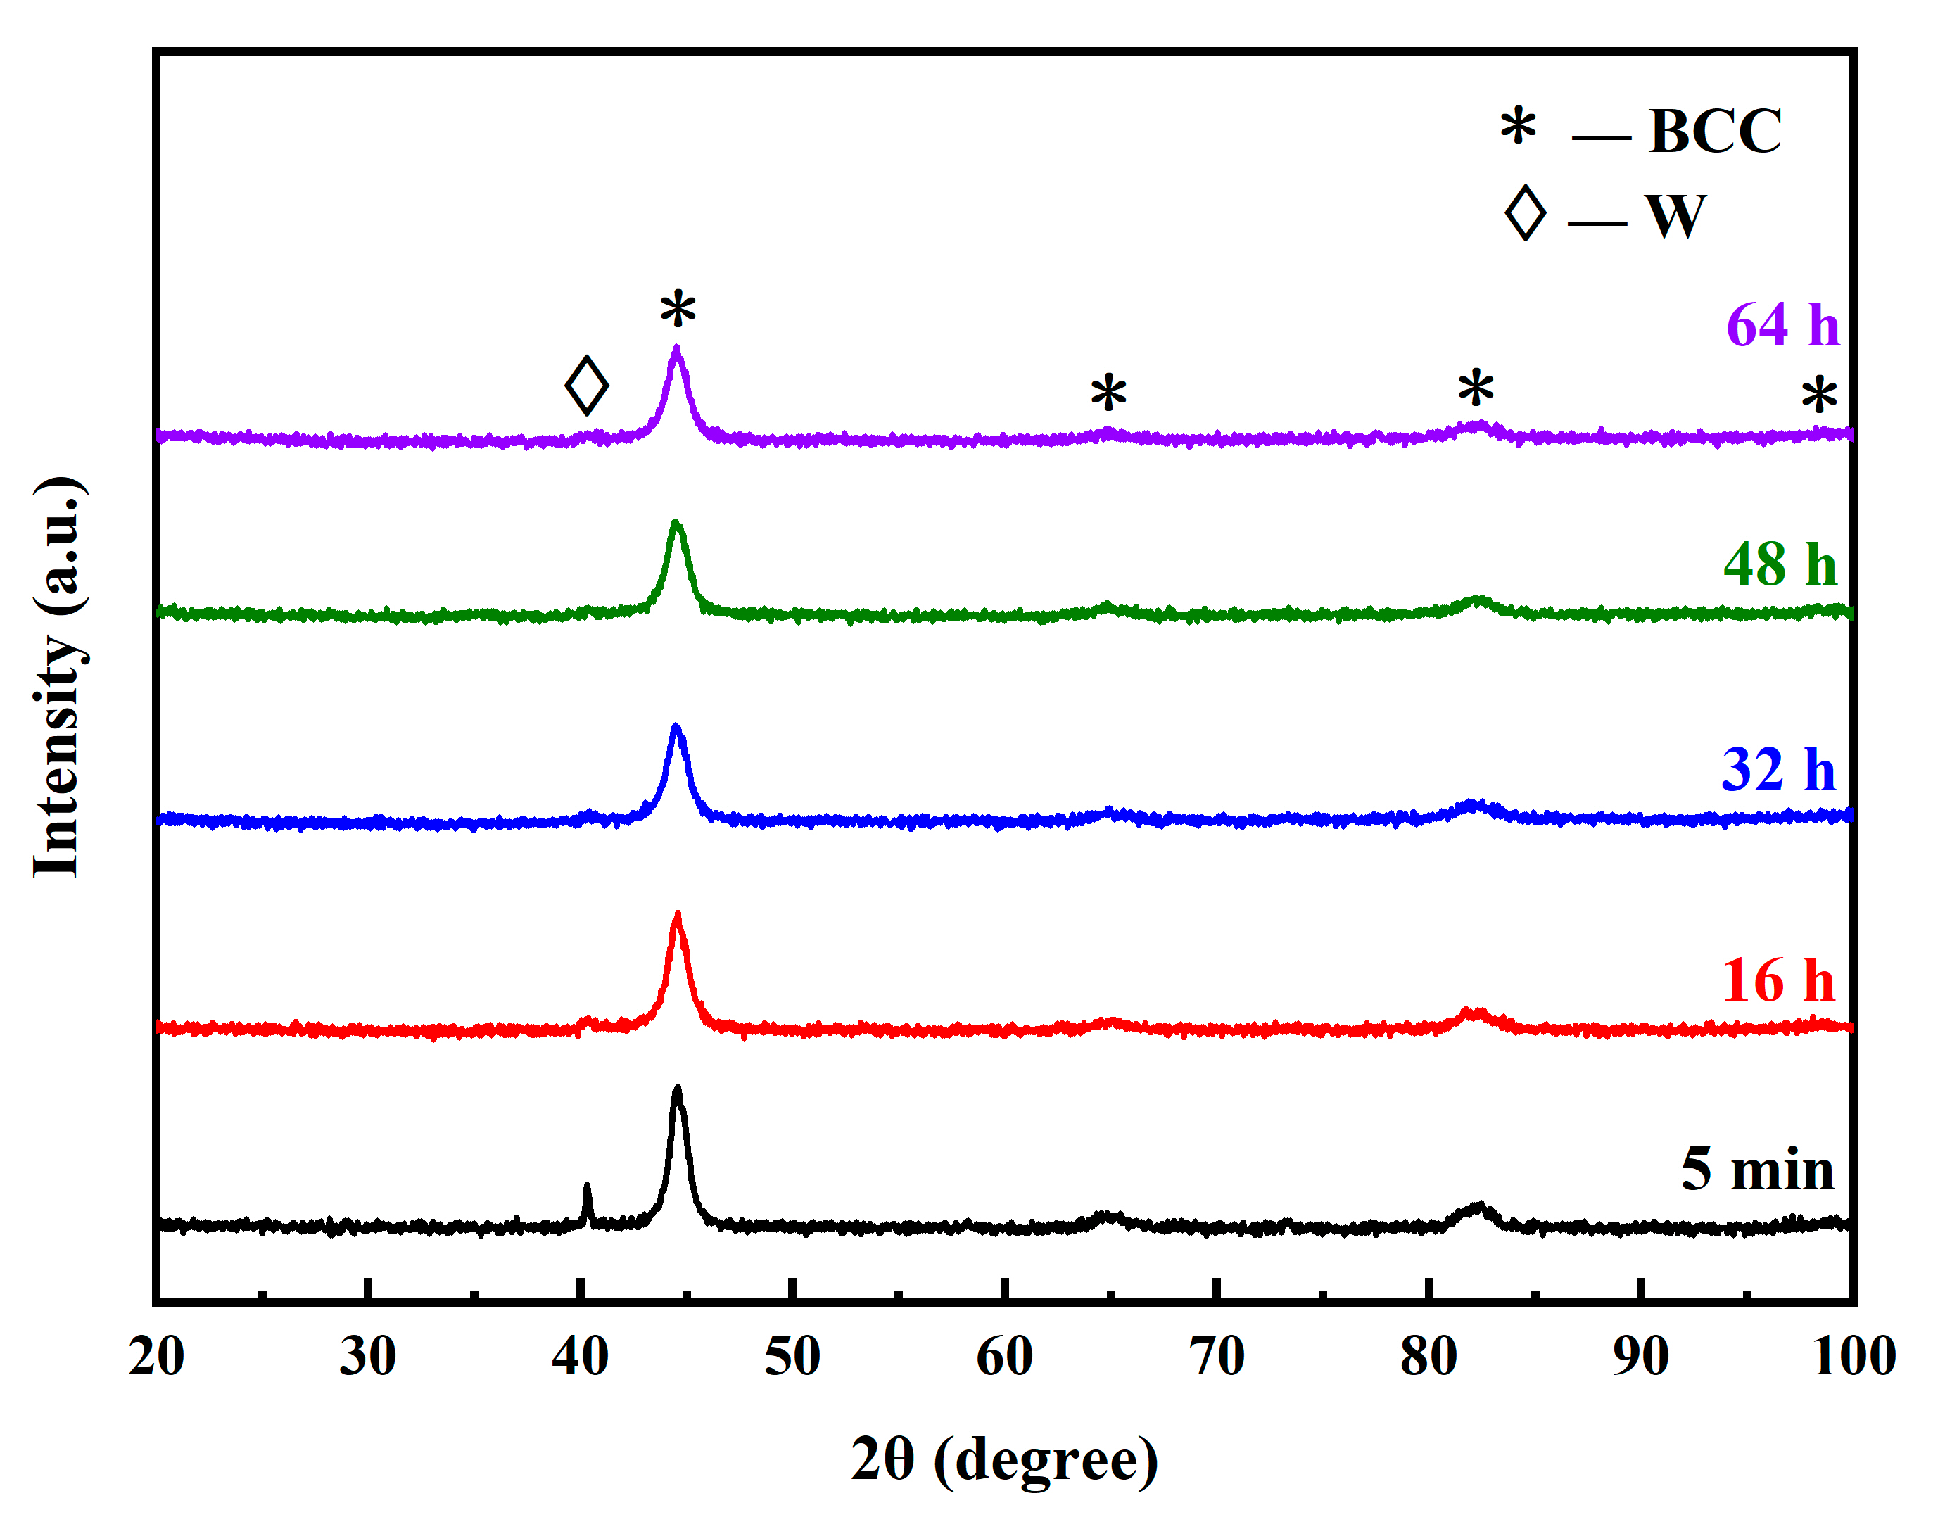
- MA was an effective process to prepare alloyed powders. After 48 h of ball milling at 300 rpm, a homogeneous element distribution was obtained on the surface of the as-milled powders.
- (3)
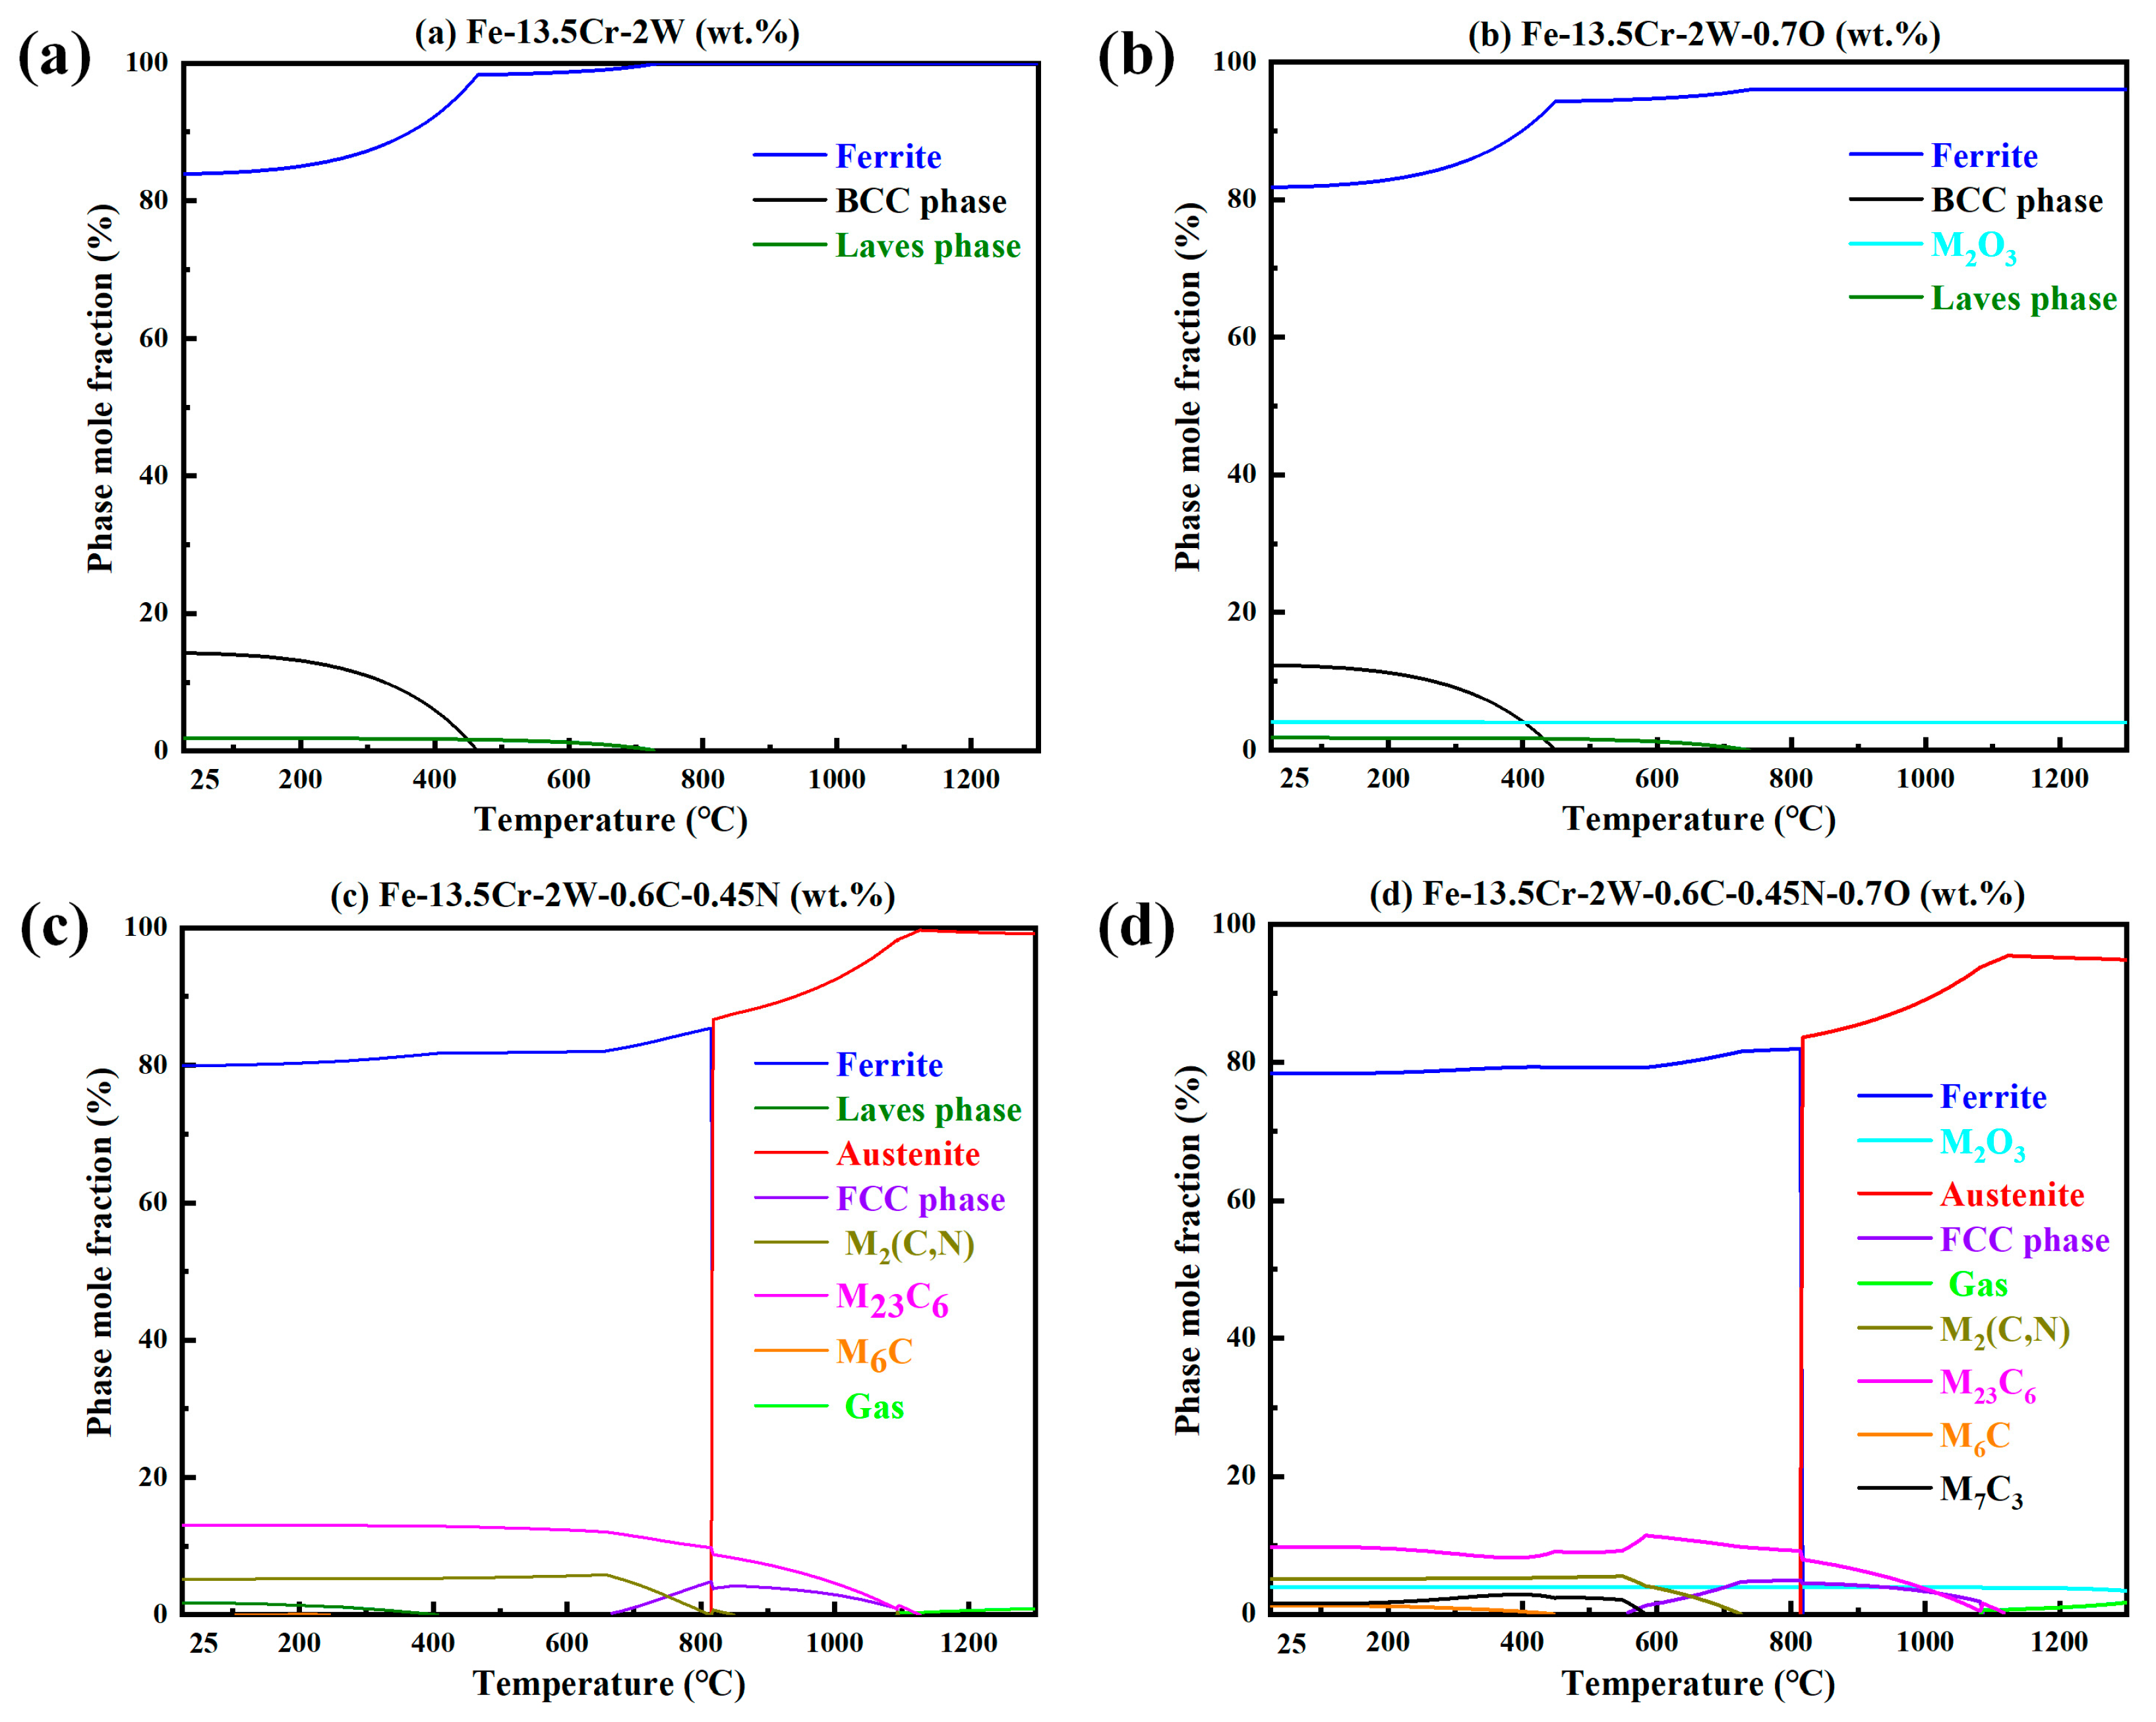
- The presence of C and N led to the α-γ dual-phases in the steels at RT, while the fast-sintering characteristic of SPS, and the inhibitory effect of W on C diffusion, also contributed to this result.
- (4)
- The ODS steels displayed a bimodal microstructure, with fine and coarse grains. The Y4Zr3O12 particles were continuously distributed at the grain boundaries and dispersed within the matrix. Some sub-micron precipitates such as M23C6, Cr2O3, and M2(C,N) were distributed at the grain boundaries and especially at triple junctions. The two temperature platforms of the two-step SPS process, together affected the microstructure and mechanical properties of the steels. When the sintering temperature at platform 1 or platform 2 was increased, the microstructure tended to be more homogeneous. The UTS of specimen A3, sintered with the temperature combination of 750 °C and 1150 °C, reached 1038 MPa, which is similar to the results of other ODS steels with comparable compositions. The designed ODS steel in this study, shows the competitive potential in comprehensive tensile properties, which could be improved by optimizing the SPS process and using purer raw powders.
Author Contributions
Funding
Institutional Review Board Statement
Informed Consent Statement
Data Availability Statement
Acknowledgments
Conflicts of Interest
References
- Odette, G.R.; Alinger, M.J.; Wirth, B.D. Recent developments in irradiation-resistant steels. Annu. Rev. Mater. Res. 2008, 38, 471–503. [Google Scholar] [CrossRef]
- Oksiuta, Z.; Olier, P.; de Carlan, Y.; Baluc, N. Development and characterisation of a new ODS ferritic steel for fusion reactor application. J. Nucl. Mater. 2009, 393, 114–119. [Google Scholar] [CrossRef]
- Zhao, Q.; Yu, L.M.; Liu, Y.C.; Huang, Y.; Ma, Z.Q.; Li, H.J.; Wu, J.F. Microstructure and tensile properties of a 14Cr ODS ferritic steel. Mater. Sci. Eng. A 2017, 680, 347–350. [Google Scholar] [CrossRef]
- Toloczko, M.B.; Gelles, D.S.; Garner, F.A.; Kurtz, R.J.; Abe, K. Irradiation creep and swelling from 400 to 600 °C of the oxide dispersion strengthened ferritic alloy MA957. J. Nucl. Mater. 2004, 329, 352–355. [Google Scholar] [CrossRef]
- Kaito, T.; Narita, T.; Ukai, S.; Matsuda, Y. High temperature oxidation behavior of ODS steels. J. Nucl. Mater. 2004, 329, 1388–1392. [Google Scholar] [CrossRef]
- Hu, H.L.; Zhou, Z.J.; Liao, L.; Zhang, L.F.; Wang, M.; Li, S.F.; Ge, C.C. Corrosion behavior of a 14Cr-ODS steel in supercritical water. J. Nucl. Mater. 2013, 437, 196–200. [Google Scholar] [CrossRef]
- Kondo, K.; Aoki, S.; Yamashita, S.; Ukai, S.; Sakamoto, K.; Hirai, M.; Kimura, A. Ion irradiation effects on FeCrAl-ODS ferritic steel. Nucl. Mater. Energy 2018, 15, 13–16. [Google Scholar]
- Yano, Y.; Ogawa, R.; Yamashita, S.; Ohtsuka, S.; Kaito, T.; Akasaka, N.; Inoue, M.; Yoshitake, T.; Tanaka, K. Effects of neutron irradiation on tensile properties of oxide dispersion strengthened (ODS) steel claddings. J. Nucl. Mater. 2011, 419, 305–309. [Google Scholar] [CrossRef]
- Kimura, A.; Kasada, R.; Iwata, N.; Kishimoto, H.; Zhang, C.H.; Isselin, J.; Dou, P.; Lee, J.H.; Muthukumar, N.; Okuda, T.; et al. Development of Al added high-Cr ODS steels for fuel cladding of next generation nuclear systems. J. Nucl. Mater. 2011, 417, 176–179. [Google Scholar]
- Kimura, A.; Kayano, H.; Misawa, T.; Matsui, H. Designation of alloy composition of reduced-activation martensitic steel. J. Nucl. Mater. 1994, 212, 690–694. [Google Scholar] [CrossRef]
- Ukai, S.; Ohtsuka, S.; Kaito, T.; de Carlan, Y.; Ribis, J.; Malaplate, J. Oxide dispersion-strengthened/ferrite-martensite steels as core materials for Generation IV nuclear reactors. In Structural Materials for Generation IV Nuclear Reactors, 1st ed.; Pascal, Y., Ed.; Woodhead Publishing: Sawston, UK, 2017; pp. 357–414. ISBN 978-0-08-100906-2. [Google Scholar] [CrossRef]
- Mukhopadhyay, D.K.; Froes, F.H.; Gelles, D.S. Development of oxide dispersion strengthened ferritic steels for fusion. J. Nucl. Mater. 1998, 258, 1209–1215. [Google Scholar]
- Olier, P.; Bougault, A.; Alamo, A.; de Carlan, Y. Effects of the forming processes and Y2O3 content on ODS-Eurofer mechanical properties. J. Nucl. Mater. 2009, 386–388, 561–563. [Google Scholar] [CrossRef]
- de Castro, V.; Leguey, T.; Munoz, A.; Monge, M.A.; Pareja, R.; Marquis, E.A.; Lozano-Perez, S.; Jenkins, M.L. Microstructural characterization of Y2O3 ODS-Fe-Cr model alloys. J. Nucl. Mater. 2009, 386–388, 449–452. [Google Scholar]
- Gwalani, B.; Pohan, R.M.; Waseem, O.A.; Alam, T.; Hong, S.H.; Ryu, H.J.; Banerjee, R. Strengthening of Al0.3CoCrFeMnNi-based ODS high entropy alloys with incremental changes in the concentration of Y2O3. Scr. Mater. 2019, 162, 477–481. [Google Scholar]
- Sun, D.J.; Liang, C.Y.; Shang, J.L.; Yin, J.H.; Song, Y.R.; Li, W.Z.; Liang, T.Q.; Zhang, X.H. Effect of Y2O3 contents on oxidation resistance at 1150 °C and mechanical properties at room temperature of ODS Ni-20Cr-5Al alloy. Appl. Surf. Sci. 2016, 385, 587–596. [Google Scholar] [CrossRef]
- Massey, C.R.; Hoelzer, D.T.; Unocic, K.A.; Osetskiy, Y.N.; Edmondson, P.D.; Gault, B.; Zinkle, S.J.; Terrani, K.A. Extensive nanoprecipitate morphology transformation in a nanostructured ferritic alloy due to extreme thermomechanical processing. Acta Mater. 2020, 200, 922–931. [Google Scholar]
- Zhuang, Y.; Zhang, X.; Peng, T.; Fan, H.; Zhang, X.; Yan, Q.; Volinsky, A.A. Effects of yttrium oxides on the microstructure and mechanical properties of 15-15Ti ODS alloy fabricated by casting. Mater. Charact. 2020, 162, 110228. [Google Scholar]
- Wu, Z.F.; Xu, L.D.; Chen, H.Q.; Liang, Y.X.; Du, J.L.; Wang, Y.F.; Zhang, S.L.; Cai, X.C.; Sun, B.R.; Zhang, J.; et al. Significant suppression of void swelling and irradiation hardening in a nanograined/nanoprecipitated 14YWT-ODS steel irradiated by helium ions. J. Nucl. Mater. 2022, 559, 153418. [Google Scholar] [CrossRef]
- Ren, J.; Yu, L.M.; Liu, Y.C.; Liu, C.X.; Li, H.J.; Wu, J.F. Effects of Zr addition on strengthening mechanisms of Al-alloyed high-Cr ODS steels. Materials 2018, 11, 118. [Google Scholar] [CrossRef]
- Zhao, Q.; Yu, L.M.; Ma, Z.Q.; Li, H.J.; Wang, Z.M.; Liu, Y.C. Hot deformation behavior and microstructure evolution of 14Cr ODS steel. Materials 2018, 11, 1044. [Google Scholar] [CrossRef]
- Song, L.L.; Yang, X.Y.; Zhao, Y.Y.; Wang, W.; Mao, X.D. Si-containing 9Cr ODS steel designed for high temperature application in lead-cooled fast reactor. J. Nucl. Mater. 2019, 519, 22–29. [Google Scholar] [CrossRef]
- Xu, Z.Y.; Song, L.L.; Zhao, Y.Y.; Liu, S.J. The formation mechanism and effect of amorphous SiO2 on the corrosion behaviour of Fe-Cr-Si ODS alloy in LBE at 550 °C. Corros. Sci. 2021, 190, 109634. [Google Scholar] [CrossRef]
- Wang, Y.; Zhou, Z.J.; Jia, H.D.; Gao, R.; Ran, M.R.; Zheng, W.Y.; Zhang, M.C.; Li, H.; Zhang, J.Q.; Zeng, X.Q.; et al. Understanding the excellent corrosion resistance of Fe-12Cr ODS alloys with and without Si in supercritical CO2 through advanced characterization. Corros. Sci. 2023, 210, 110827. [Google Scholar] [CrossRef]
- Husak, R.; Hadraba, H.; Chlup, Z.; Heczko, M.; Kruml, T.; Puchy, V. ODS Eurofer steel strengthened by Y-(Ce, Hf, La, Sc, and Zr) complex oxides. Metals 2019, 9, 1148. [Google Scholar] [CrossRef]
- Yan, P.Y.; Yu, L.M.; Liu, Y.C.; Liu, C.X.; Huijun, L.J.; Wu, J.F. Effects of Hf addition on the thermal stability of 16Cr-ODS steels at elevated aging temperatures. J. Alloys Compd. 2018, 739, 368–379. [Google Scholar] [CrossRef]
- He, S.Y.; Qian, Q.; Huang, Z.; Gong, Y.X.; Chen, J.J.; Wang, Y.R.; Jiang, Y. Nucleation of Y-Si-O nano-clusters in multi-microalloyed nano-structured ferritic alloys: A first-principles study. Acta Metall. Sin.-Engl. Lett. 2021, 34, 955–962. [Google Scholar] [CrossRef]
- Jiang, Y.; Smith, J.R.; Odette, G.R. Formation of Y-Ti-O nanoclusters in nanostructured ferritic alloys: A first-principles study. Phys. Rev. B 2009, 79, 064103. [Google Scholar] [CrossRef]
- Murali, D.; Panigrahi, B.K.; Valsakumar, M.C.; Chandra, S.; Sundar, C.S.; Raj, B. The role of minor alloying elements on the stability and dispersion of yttria nanoclusters in nanostructured ferritic alloys: An ab initio study. J. Nucl. Mater. 2010, 403, 113–116. [Google Scholar]
- Dou, P.; Kimura, A.; Kasada, R.; Okuda, T.; Inoue, M.; Ukai, S.; Ohnuki, S.; Fujisawa, T.; Abe, F. TEM and HRTEM study of oxide particles in an Al-alloyed high-Cr oxide dispersion strengthened steel with Zr addition. J. Nucl. Mater. 2014, 444, 441–453. [Google Scholar] [CrossRef]
- Dou, P.; Qiu, L.L.; Jiang, S.M.; Kimura, A. Crystal and metal/oxide interface structures of nanoparticles in Fe-16Cr-0.1Ti-0.35Y2O3 ODS steel. J. Nucl. Mater. 2019, 523, 320–332. [Google Scholar]
- Jiang, Y.; Smith, J.R.; Odette, G.R. Prediction of structural, electronic and elastic properties of Y2Ti2O7 and Y2TiO5. Acta Mater. 2010, 58, 1536–1543. [Google Scholar] [CrossRef]
- Hirata, A.; Fujita, T.; Wen, Y.R.; Schneibel, J.H.; Liu, C.T.; Chen, M.W. Atomic structure of nanoclusters in oxide-dispersion-strengthened steels. Nat. Mater. 2011, 10, 922–926. [Google Scholar] [CrossRef]
- Hin, C.; Wirth, B.D. Formation of Y2O3 nanoclusters in nano-structured ferritic alloys: Modeling of precipitation kinetics and yield strength. J. Nucl. Mater. 2010, 402, 30–37. [Google Scholar] [CrossRef]
- Pazos, D.; Suarez, M.; Fernandez, A.; Fernandez, P.; Iturriza, I.; Ordas, N. Microstructural comparison of Oxide Dispersion Strengthened Fe-14Cr steels produced by HIP and SPS. Fusion Eng. Des. 2019, 146, 2328–2333. [Google Scholar] [CrossRef]
- Zhang, L.Y.; Yu, L.M.; Liu, Y.C.; Liu, C.X.; Li, H.J.; Wu, J.F. Influence of Zr addition on the microstructures and mechanical properties of 14Cr ODS steels. Mater. Sci. Eng. A 2017, 695, 66–73. [Google Scholar] [CrossRef]
- Simondon, E.; Giroux, P.F.; Chaffron, L.; Fitch, A.; Castany, P.; Gloriant, T. Mechanical synthesis of nanostructured Y2Ti2O7 pyrochlore oxides. Solid State Sci. 2018, 85, 54–59. [Google Scholar] [CrossRef]
- Liu, T.; Wang, L.B.; Wang, C.X.; Shen, H.L.; Zhang, H.T. Feasibility of using Y2Ti2O7 nanoparticles to fabricate high strength oxide dispersion strengthened Fe-Cr-Al steels. Mater. Des. 2015, 88, 862–870. [Google Scholar] [CrossRef]
- Wu, Y.; Zhao, H.Z.; Li, J.K.; Zhang, Y.Y.; Liu, T. Effects of Y4Zr3O12 addition on the microstructure and mechanical properties of Fe-15Cr-2W-0.35Ti ODS steels. Mater. Sci. Eng. A 2021, 804, 140734. [Google Scholar] [CrossRef]
- Sun, Q.X.; Fang, Q.F.; Zhou, Y.; Xia, Y.P.; Zhang, T.; Wang, X.P.; Liu, C.S. Development of oxide dispersion strengthened ferritic steel prepared by chemical reduction and mechanical milling. J. Nucl. Mater. 2013, 439, 103–107. [Google Scholar] [CrossRef]
- Mazumder, B.; Parish, C.M.; Bei, H.; Miller, M.K. The role of processing route on the microstructure of 14YWT nanostructured ferritic alloy. J. Nucl. Mater. 2015, 465, 204–211. [Google Scholar] [CrossRef]
- Suryanarayana, C. Mechanical alloying and milling. Prog. Mater. Sci. 2001, 46, 1–184. [Google Scholar] [CrossRef]
- Auger, M.A.; de Castro, V.; Leguey, T.; Munoz, A.; Pareja, R. Microstructure and mechanical behavior of ODS and non-ODS Fe-14Cr model alloys produced by spark plasma sintering. J. Nucl. Mater. 2013, 436, 68–75. [Google Scholar] [CrossRef]
- Guillon, O.; Gonzalez-Julian, J.; Dargatz, B.; Kessel, T.; Schierning, G.; Rathel, J.; Herrmann, M. Field-assisted sintering technology/spark plasma sintering: Mechanisms, materials, and technology developments. Adv. Eng. Mater. 2014, 16, 830–849. [Google Scholar] [CrossRef]
- Matizamhuka, W.R. Spark plasma sintering (SPS)-An advanced sintering technique for structural nanocomposite materials. J. South. Afr. Inst. Min. Metall. 2016, 116, 1171–1180. [Google Scholar] [CrossRef]
- Munir, Z.A.; Anselmi-Tamburini, U.; Ohyanagi, M. The effect of electric field and pressure on the synthesis and consolidation of materials: A review of the spark plasma sintering method. J. Mater. Sci. 2006, 41, 763–777. [Google Scholar] [CrossRef]
- Fu, J.; Brouwer, J.C.; Richardson, I.M.; Hermans, M.J.M. Effect of mechanical alloying and spark plasma sintering on the microstructure and mechanical properties of ODS Eurofer. Mater. Des. 2019, 177, 107849. [Google Scholar] [CrossRef]
- Peng, S.B.; Lu, Z.; Li, X.L.; Yu, L. A comparative study of microstructure and mechanical properties of ODS CrFeNi-based medium- and high-entropy alloys. J. Alloys Compd. 2022, 924, 166518. [Google Scholar] [CrossRef]
- Frelek-Kozak, M.; Kurpaska, L.; Wyszkowska, E.; Jagielski, J.; Jozwik, I.; Chmielewski, M. Evaluation of consolidation method on mechanical and structural properties of ODS RAF steel. Appl. Surf. Sci. 2018, 446, 215–221. [Google Scholar] [CrossRef]
- Shi, W.Z.; Yu, L.M.; Liu, C.X.; Ma, Z.Q.; Li, H.J.; Wang, Z.M.; Liu, Y.C.; Gao, Q.Z.; Wang, H. Evolution of Y2O3 precipitates in ODS-316 L steel during reactive-inspired ball-milling and spark plasma sintering processes. Powder Technol. 2022, 398, 117072. [Google Scholar] [CrossRef]
- Lóh, N.J.; Simão, L.; Faller, C.A.; De Noni, A.; Montedo, O.R.K. A review of two-step sintering for ceramics. Ceram. Int. 2016, 42, 12556–12572. [Google Scholar] [CrossRef]
- Mihalache, V.; Mercioniu, I.; Velea, A.; Palade, P. Effect of the process control agent in the ball-milled powders and SPS-consolidation temperature on the grain refinement, density and Vickers hardness of Fe14Cr ODS ferritic alloys. Powder Technol. 2019, 347, 103–113. [Google Scholar] [CrossRef]
- Diouf, S.; Molinari, A. Densification mechanisms in spark plasma sintering: Effect of particle size and pressure. Powder Technol. 2012, 221, 220–227. [Google Scholar] [CrossRef]
- Oksiuta, Z.; Baluc, N. Optimization of the chemical composition and manufacturing route for ODS RAF steels for fusion reactor application. Nucl. Fusion 2009, 49, 055003. [Google Scholar] [CrossRef]
- Song, L.L.; Liu, S.J.; Mao, X.D. Microstructure evolution of the oxide dispersion strengthened CLAM steel during mechanical alloying process. Fusion Eng. Des. 2016, 112, 460–467. [Google Scholar] [CrossRef]
- Macía, E.; Garcia-Junceda, A.; Serrano, M.; Hong, S.J.; Campos, M. Effect of mechanical alloying on the microstructural evolution of a ferritic ODS steel with (Y-Ti-Al-Zr) addition processed by Spark Plasma Sintering (SPS). Nucl. Eng. Technol. 2021, 53, 2582–2590. [Google Scholar] [CrossRef]
- Garcia-Cabezon, C.; Blanco, Y.; Rodriguez-Mendez, M.L.; Martin-Pedrosa, F. Characterization of porous nickel-free austenitic stainless steel prepared by mechanical alloying. J. Alloys Compd. 2017, 716, 46–55. [Google Scholar] [CrossRef]
- Suehiro, M.; Liu, Z.K.; Agren, J. Effect of niobium on massive transformation in ultra low carbon steels: A solute drag treatment. Acta Mater. 1996, 44, 4241–4251. [Google Scholar] [CrossRef]
- Fossaert, C.; Rees, G.; Maurickx, T.; Bhadeshia, H. The effect of niobium on the hardenability of microalloyed austenite. Metall. Mater. Trans. A 1995, 26, 21–30. [Google Scholar] [CrossRef]
- Simielli, E.A.; Yue, S.; Jonas, J.J. Recrystallization kinetics of microalloyed steels deformed in the intercritical region. Metall. Trans. A 1992, 23, 597–608. [Google Scholar] [CrossRef]
- Bradley, J.R.; Aaronson, H.I. Growth kinetics of grain boundary ferrite allotriomorphs in Fe-C-X alloys. Metall. Trans. A 1981, 12, 1729–1741. [Google Scholar] [CrossRef]
- Purdy, G.R.; Brechet, Y.J.M. A solute drag treatment of the effects of alloying elements on the rate of the proeutectoid ferrite transformation in steels. Acta Metall. Mater. 1995, 43, 3763–3774. [Google Scholar] [CrossRef]
- Durand, A.; Sornin, D.; Tache, O.; Guilbert, T.; Brisset, F.; Delbes, L.; Baptiste, B.; Baudin, T.; Loge, R. Stability of untransformed ferrite in 10Cr ODS steel. J. Nucl. Mater. 2023, 574, 154146. [Google Scholar] [CrossRef]
- Durand, A.; Sornin, D.; Carlan, Y.d.; Spartacus, G.; Brisset, F.; Delbes, L.; Baptiste, B.; Baudin, T.; Logé, R. Characterization of untransformed ferrite in 10Cr and 12Cr ODS steels. Materialia 2021, 16, 101066. [Google Scholar] [CrossRef]
- Tokita, M. Development of large-size ceramic/metal bulk FGM fabricated by spark plasma sintering. Mater. Sci. Forum 1999, 308–311, 83–88. [Google Scholar] [CrossRef]
- Sulima, I.; Putyra, P.; Hyjek, P.; Tokarski, T. Effect of SPS parameters on densification and properties of steel matrix composites. Adv. Powder Technol. 2015, 26, 1152–1161. [Google Scholar] [CrossRef]
- Gottstein, G.; Shvindlerman, L.S.; Zhao, B. Thermodynamics and kinetics of grain boundary triple junctions in metals: Recent developments. Scr. Mater. 2010, 62, 914–917. [Google Scholar] [CrossRef]
- Chen, C.R.; Li, S.X.; Wen, J.L.; Jia, W.P. Finite element analysis about effects of stiffness distribution on stresses and elastic strain energy near the triple junction in a tricrystal. Mater. Sci. Eng. A 2000, 282, 170–176. [Google Scholar] [CrossRef]
- Miura, H.; Andiarwanto, S.; Sato, K.; Sakai, T. Preferential dynamic nucleation at triple junction in copper tricrystal during high-temperature deformation. Mater. Trans. 2002, 43, 494–500. [Google Scholar] [CrossRef]
- Hallberg, H.; Ristinmaa, M. Microstructure evolution influenced by dislocation density gradients modeled in a reaction-diffusion system. Comput. Mater. Sci. 2013, 67, 373–383. [Google Scholar] [CrossRef]
- Yoo, M.H.; Trinkaus, H. Crack and cavity nucleation at interfaces during creep. Metall. Trans. A 1983, 14, 547–561. [Google Scholar] [CrossRef]
- Allahar, K.N.; Burns, J.; Jaques, B.; Wu, Y.Q.; Charit, I.; Cole, J.; Butt, D.P. Ferritic oxide dispersion strengthened alloys by spark plasma sintering. J. Nucl. Mater. 2013, 443, 256–265. [Google Scholar] [CrossRef]
- Meza, A.; Macía, E.; Chekhonin, P.; Altstadt, E.; Rabanal, M.E.; Torralba, J.M.; Campos, M. The effect of composition and microstructure on the creep behaviour of 14 Cr ODS steels consolidated by SPS. Mater. Sci. Eng. A 2022, 849, 143441. [Google Scholar] [CrossRef]
- Ninawe, P.S.; Ganesh, S.; Sai Karthik, P.; Chandrasekhar, S.B.; Vijay, R. Microstructure and mechanical properties of spark plasma sintered austenitic ODS steel. Adv. Powder Technol. 2022, 33, 103584. [Google Scholar] [CrossRef]
- Macía, E.; García-Junceda, A.; Serrano, M.; Hernández-Mayoral, M.; Diaz, L.A.; Campos, M. Effect of the heating rate on the microstructure of a ferritic ODS steel with four oxide formers (Y-Ti-Al-Zr) consolidated by spark plasma sintering (SPS). J. Nucl. Mater. 2019, 518, 190–201. [Google Scholar] [CrossRef]
- Garcia-Junceda, A.; Macia, E.; Garbiec, D.; Serrano, M.; Torralba, J.M.; Campos, M. Effect of small variations in Zr content on the microstructure and properties of ferritic ODS steels consolidated by SPS. Metals 2020, 10, 348. [Google Scholar] [CrossRef]
- Li, W.; Xu, H.; Sha, X.; Meng, J.; Wang, W.; Kang, C.; Zhang, X.; Wang, Z. Microstructural characterization and strengthening mechanisms of a 15Cr-ODS steel produced by mechanical alloying and Spark Plasma Sintering. Fusion Eng. Des. 2018, 137, 71–78. [Google Scholar] [CrossRef]
- Steckmeyer, A.; Praud, M.; Fournier, B.; Malaplate, J.; Garnier, J.; Béchade, J.L.; Tournié, I.; Tancray, A.; Bougault, A.; Bonnaillie, P. Tensile properties and deformation mechanisms of a 14Cr ODS ferritic steel. J. Nucl. Mater. 2010, 405, 95–100. [Google Scholar] [CrossRef]
- Li, Y.; Zhang, L.; Long, D.; Yu, L.; Li, H. The Precipitated Particle Refinement in High-Cr ODS Steels by Microalloying Element Addition. Materials 2021, 14, 7767. [Google Scholar] [CrossRef] [PubMed]
- Li, Z.; Lu, Z.; Xie, R.; Lu, C.; Liu, C. Effect of spark plasma sintering temperature on microstructure and mechanical properties of 14Cr-ODS ferritic steels. Mater. Sci. Eng. A 2016, 660, 52–60. [Google Scholar] [CrossRef]


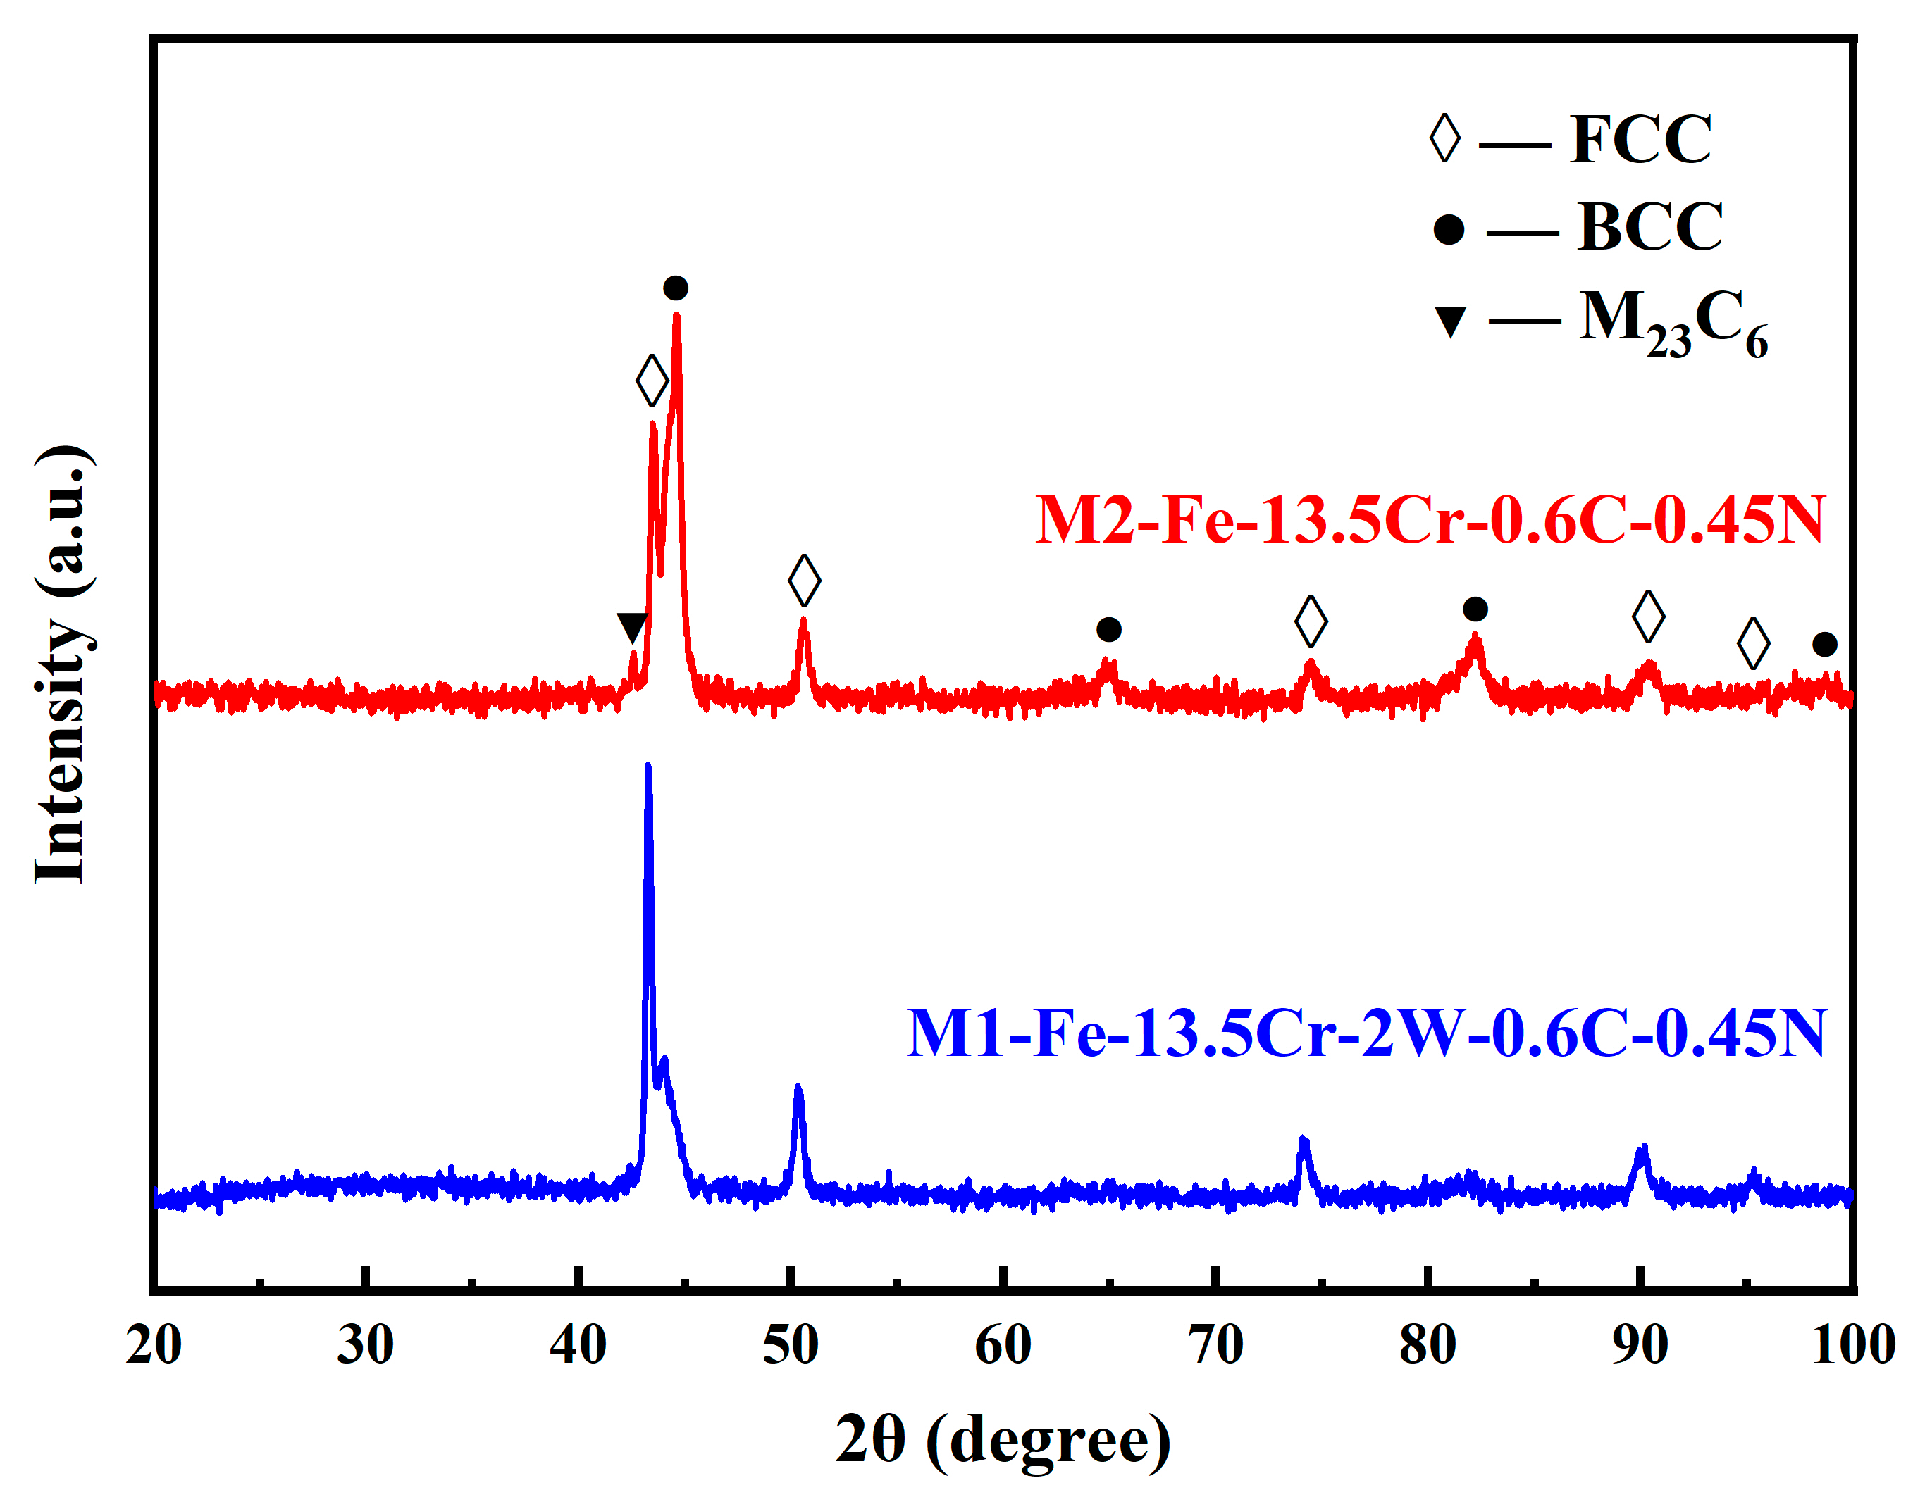
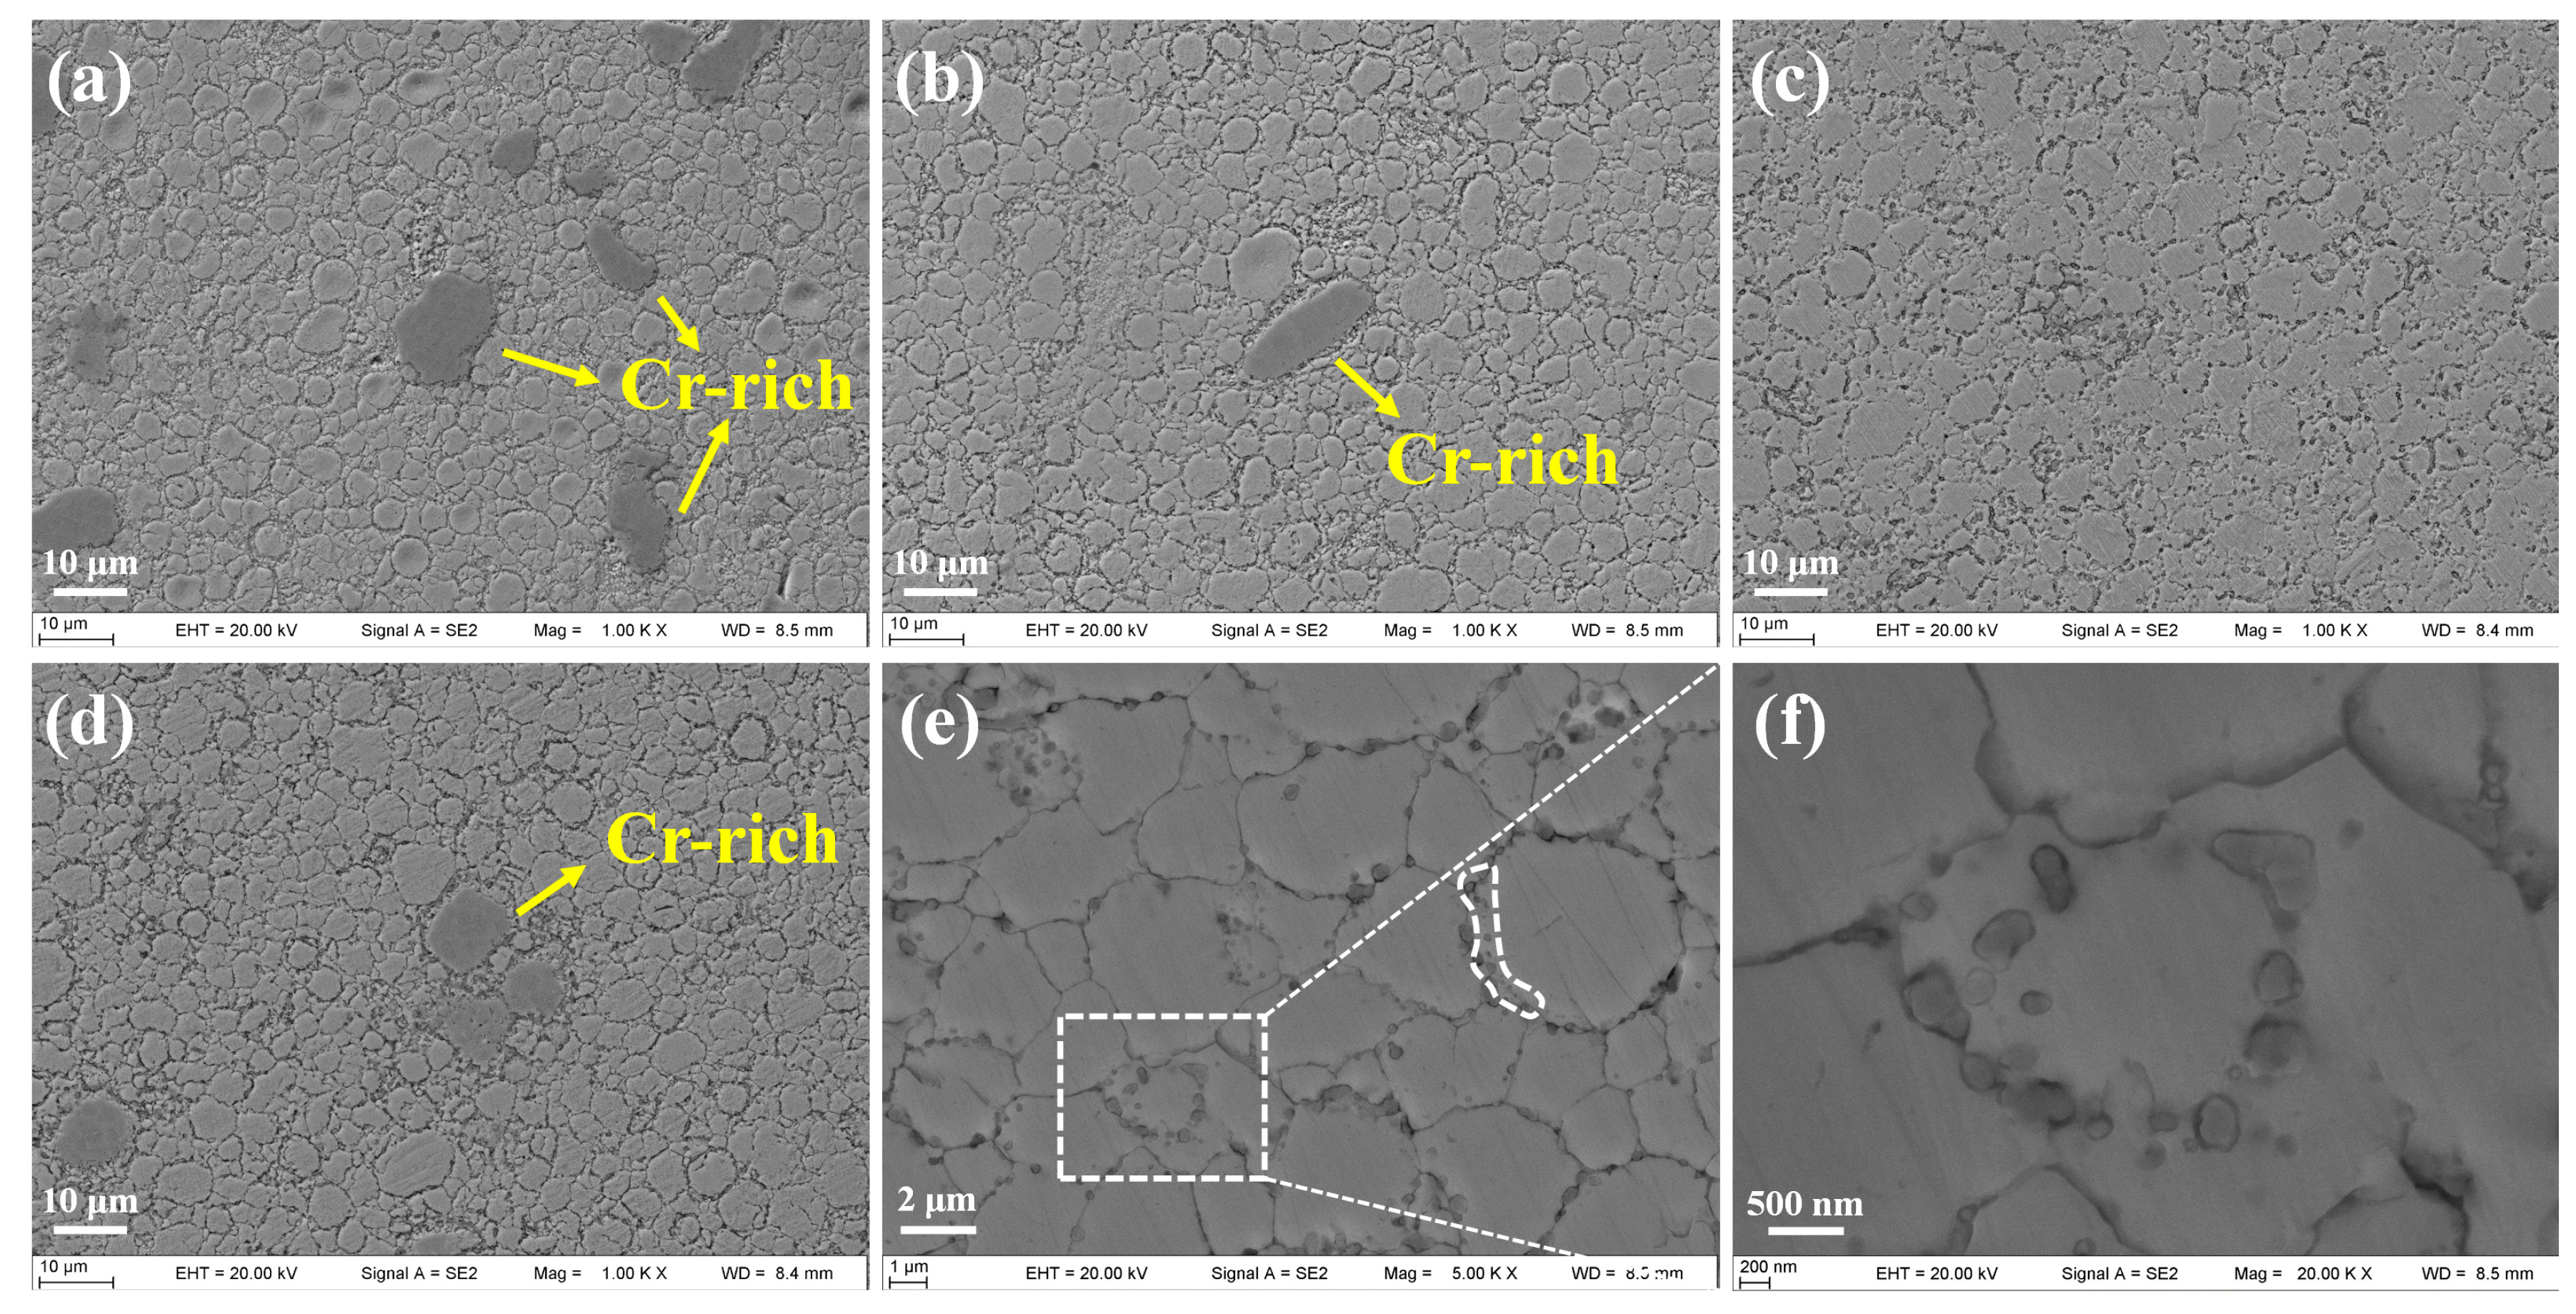
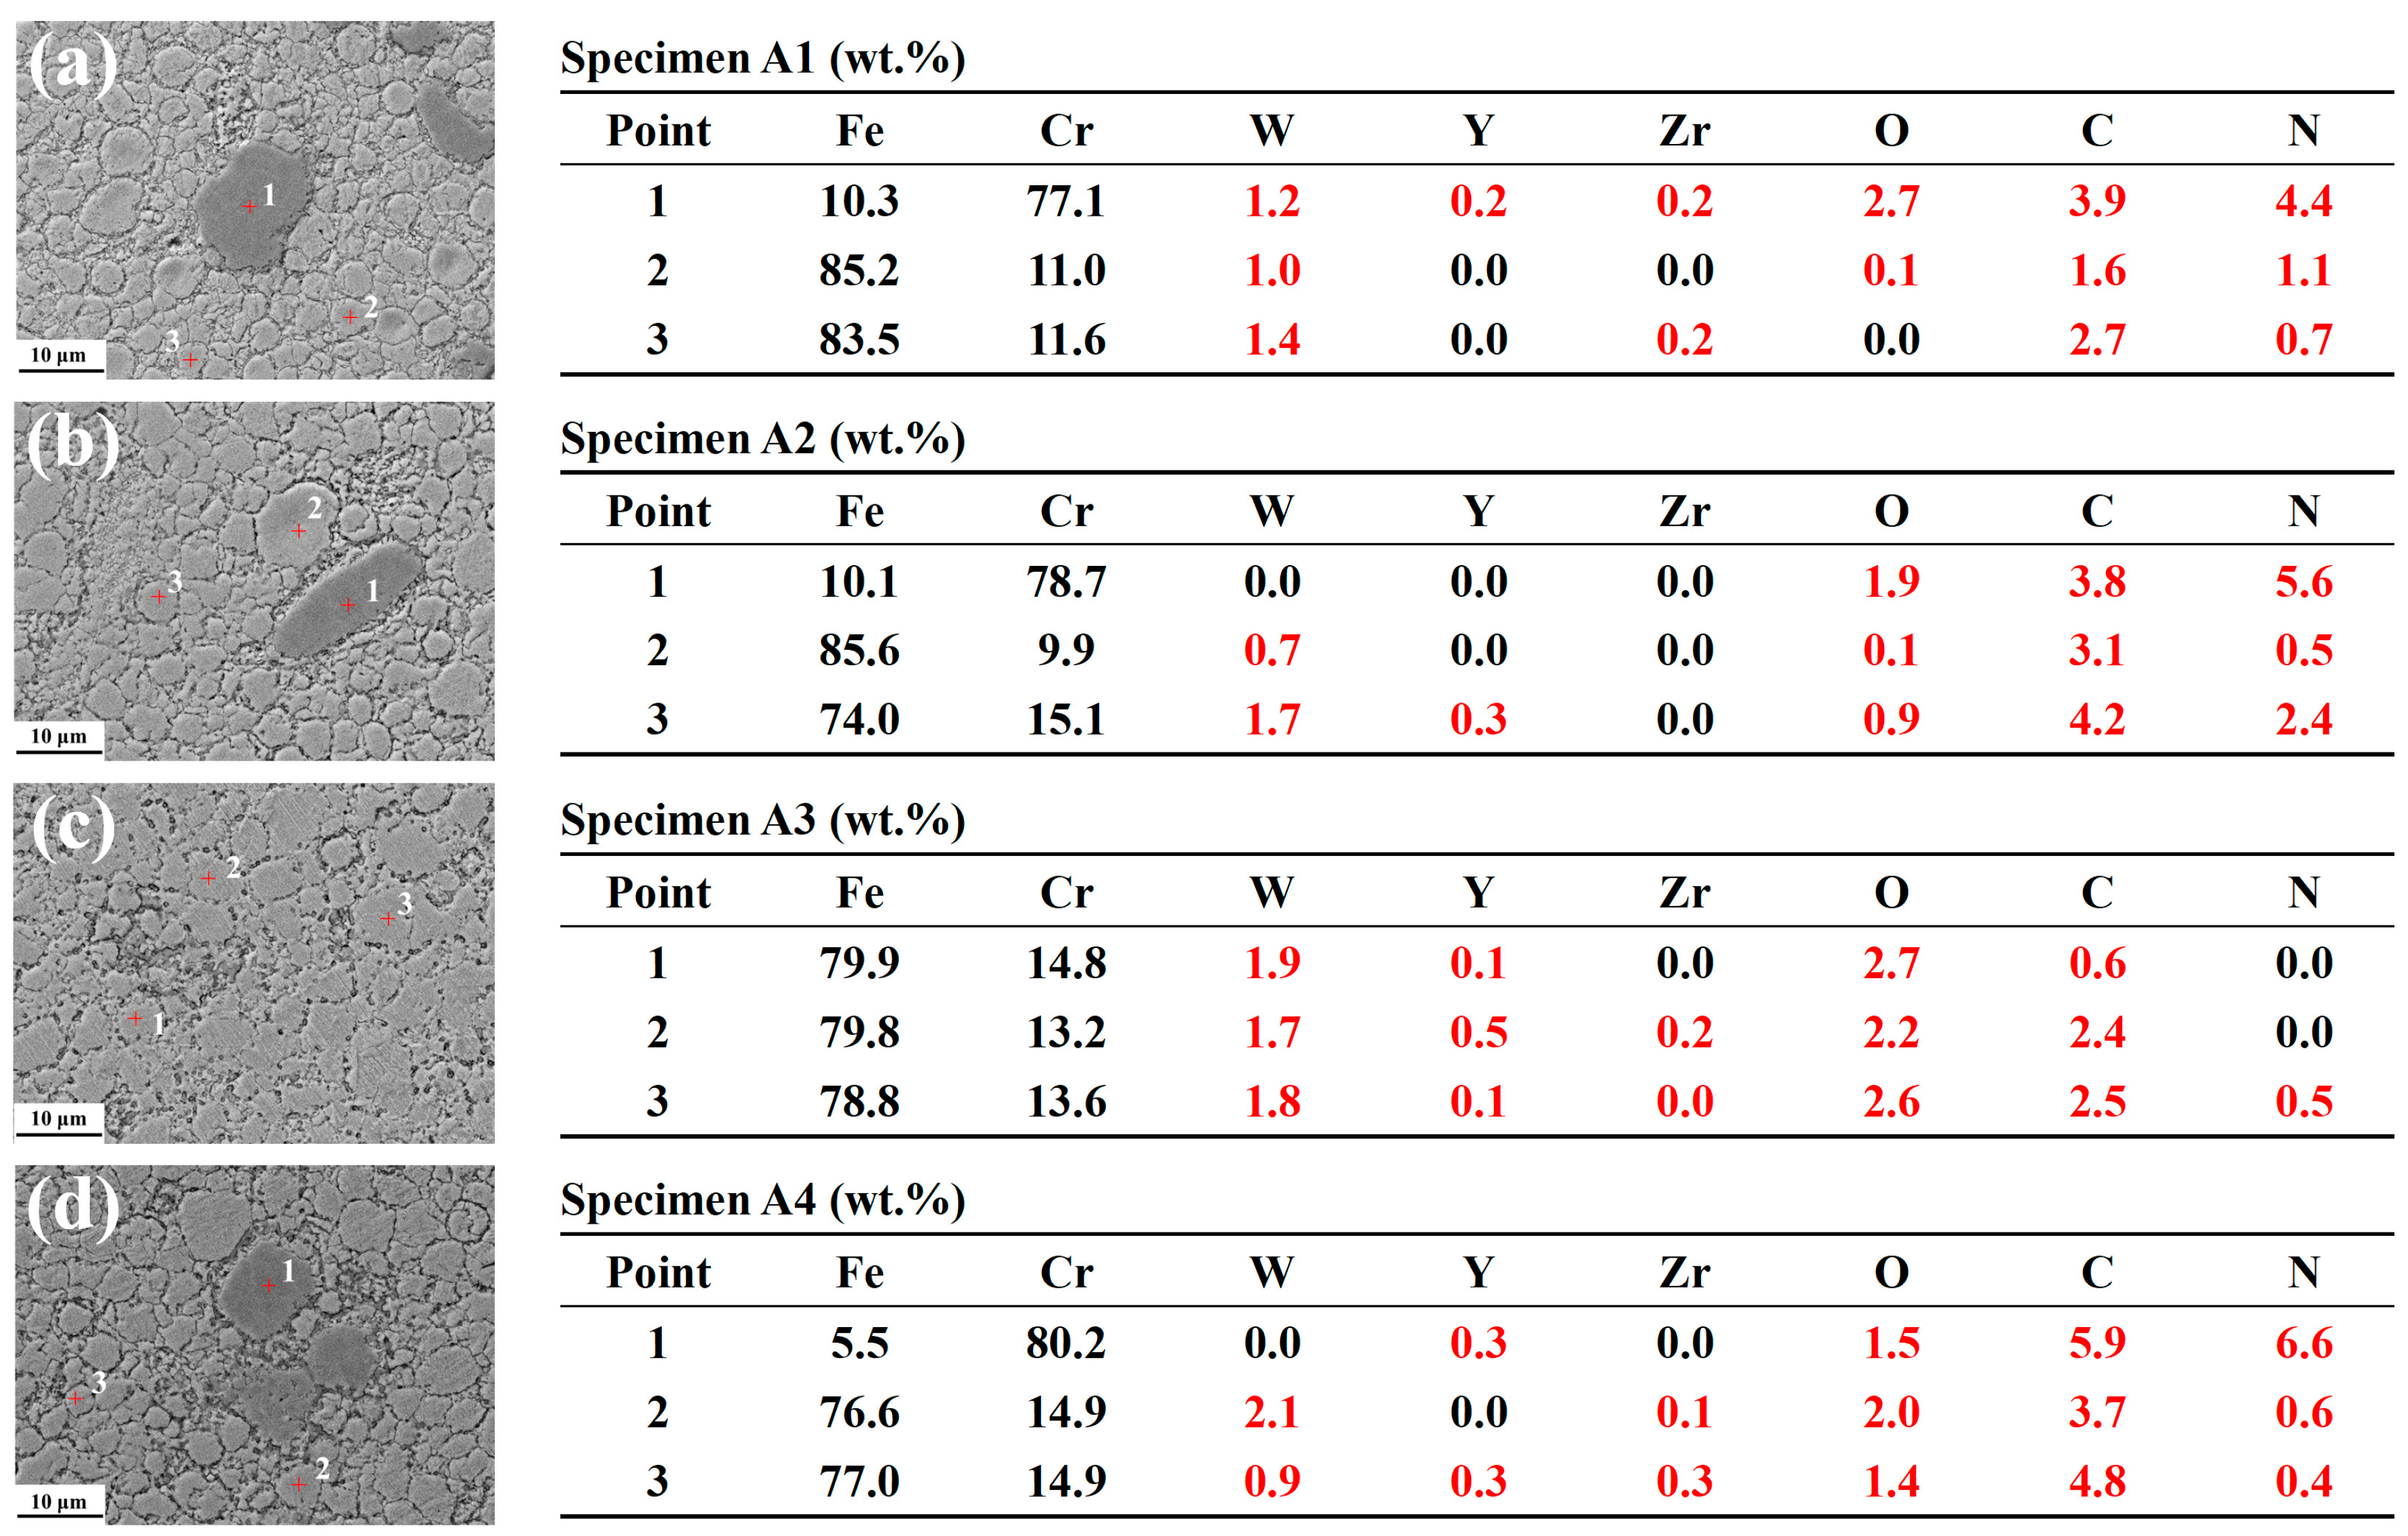
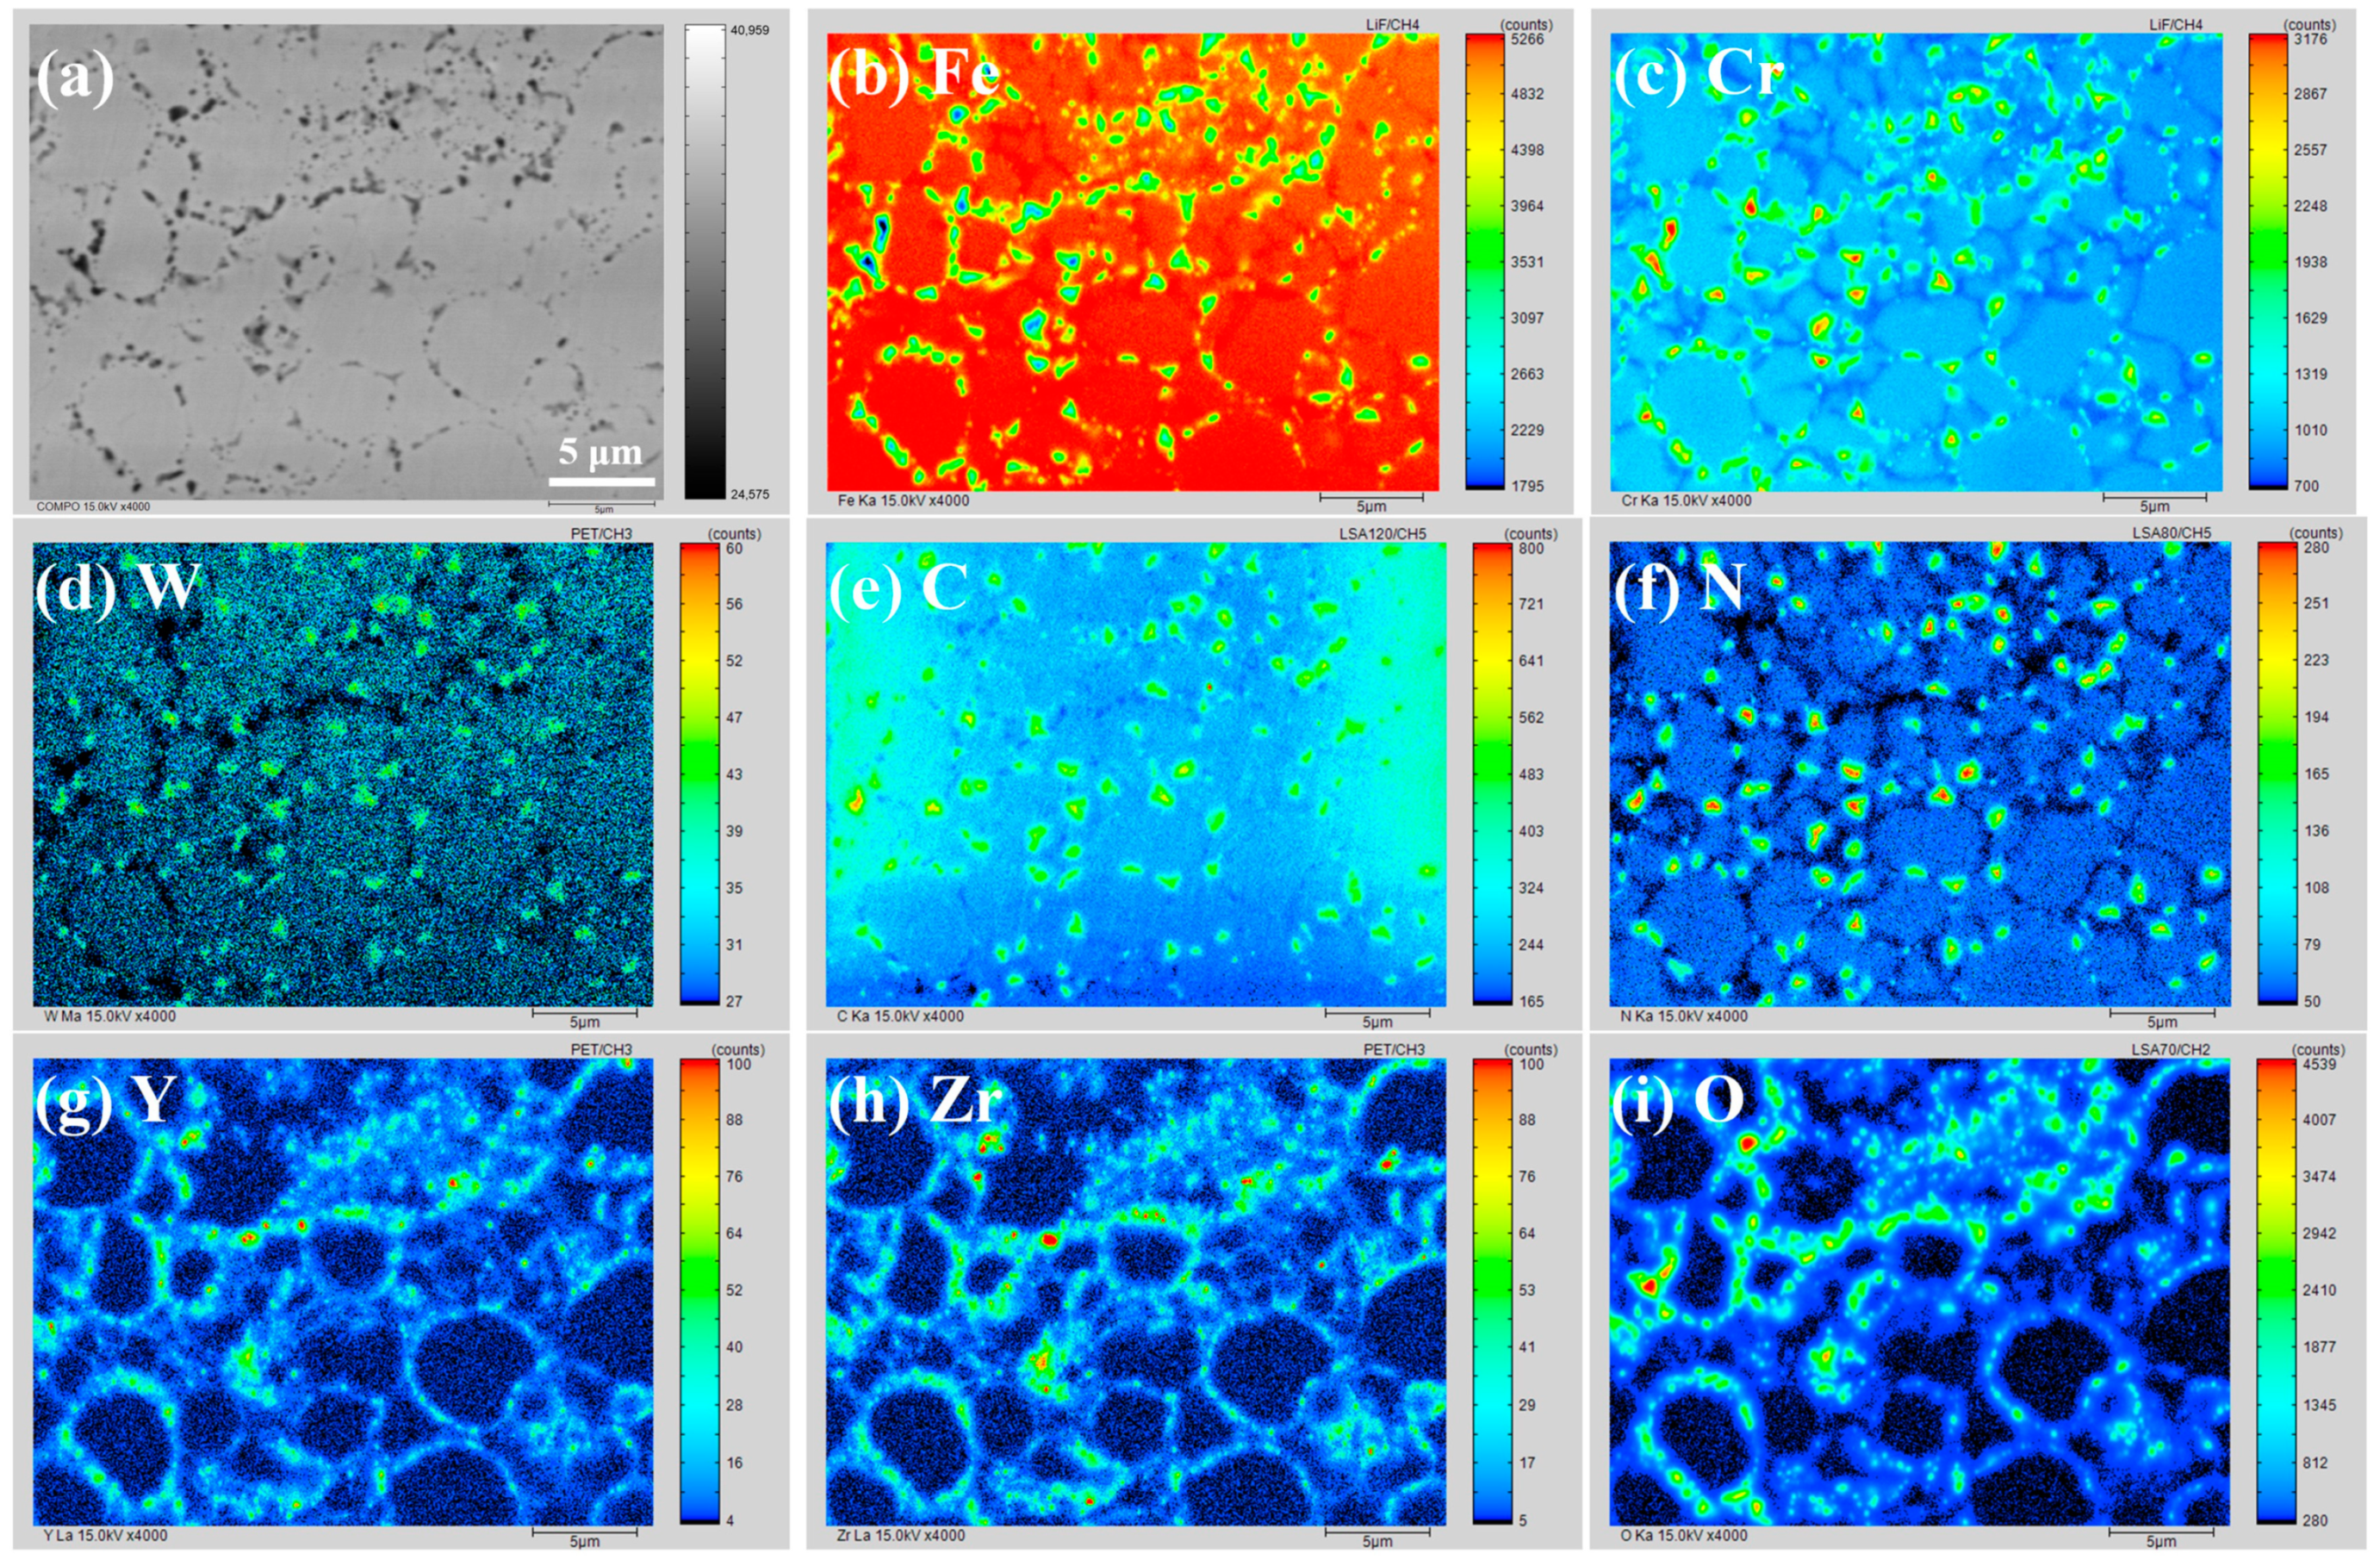

| Fe | Cr | W | Y–Zr–O | C | N | Ni | Mn | |||
|---|---|---|---|---|---|---|---|---|---|---|
| Y | Zr | O | ||||||||
| Nominal composition | Bal. | 13.50 | 2.00 | 0.26 | 0.20 | 0.14 | / | |||
| Tested composition | Bal. | 13.46 | 1.77 | 0.14 | 0.18 | 0.73 | 0.61 | 0.45 | 0.052 | 0.0051 |
| Powder size | 5 | 1 | 0.05 | / | / | |||||
| Specimen No. | Temperature Platform 1 (°C) | Dwelling Time 1 (min) | Temperature Platform 2 (°C) | Dwelling Time 2 (min) | Maximum Pressure (MPa) | Relative Density (%) |
|---|---|---|---|---|---|---|
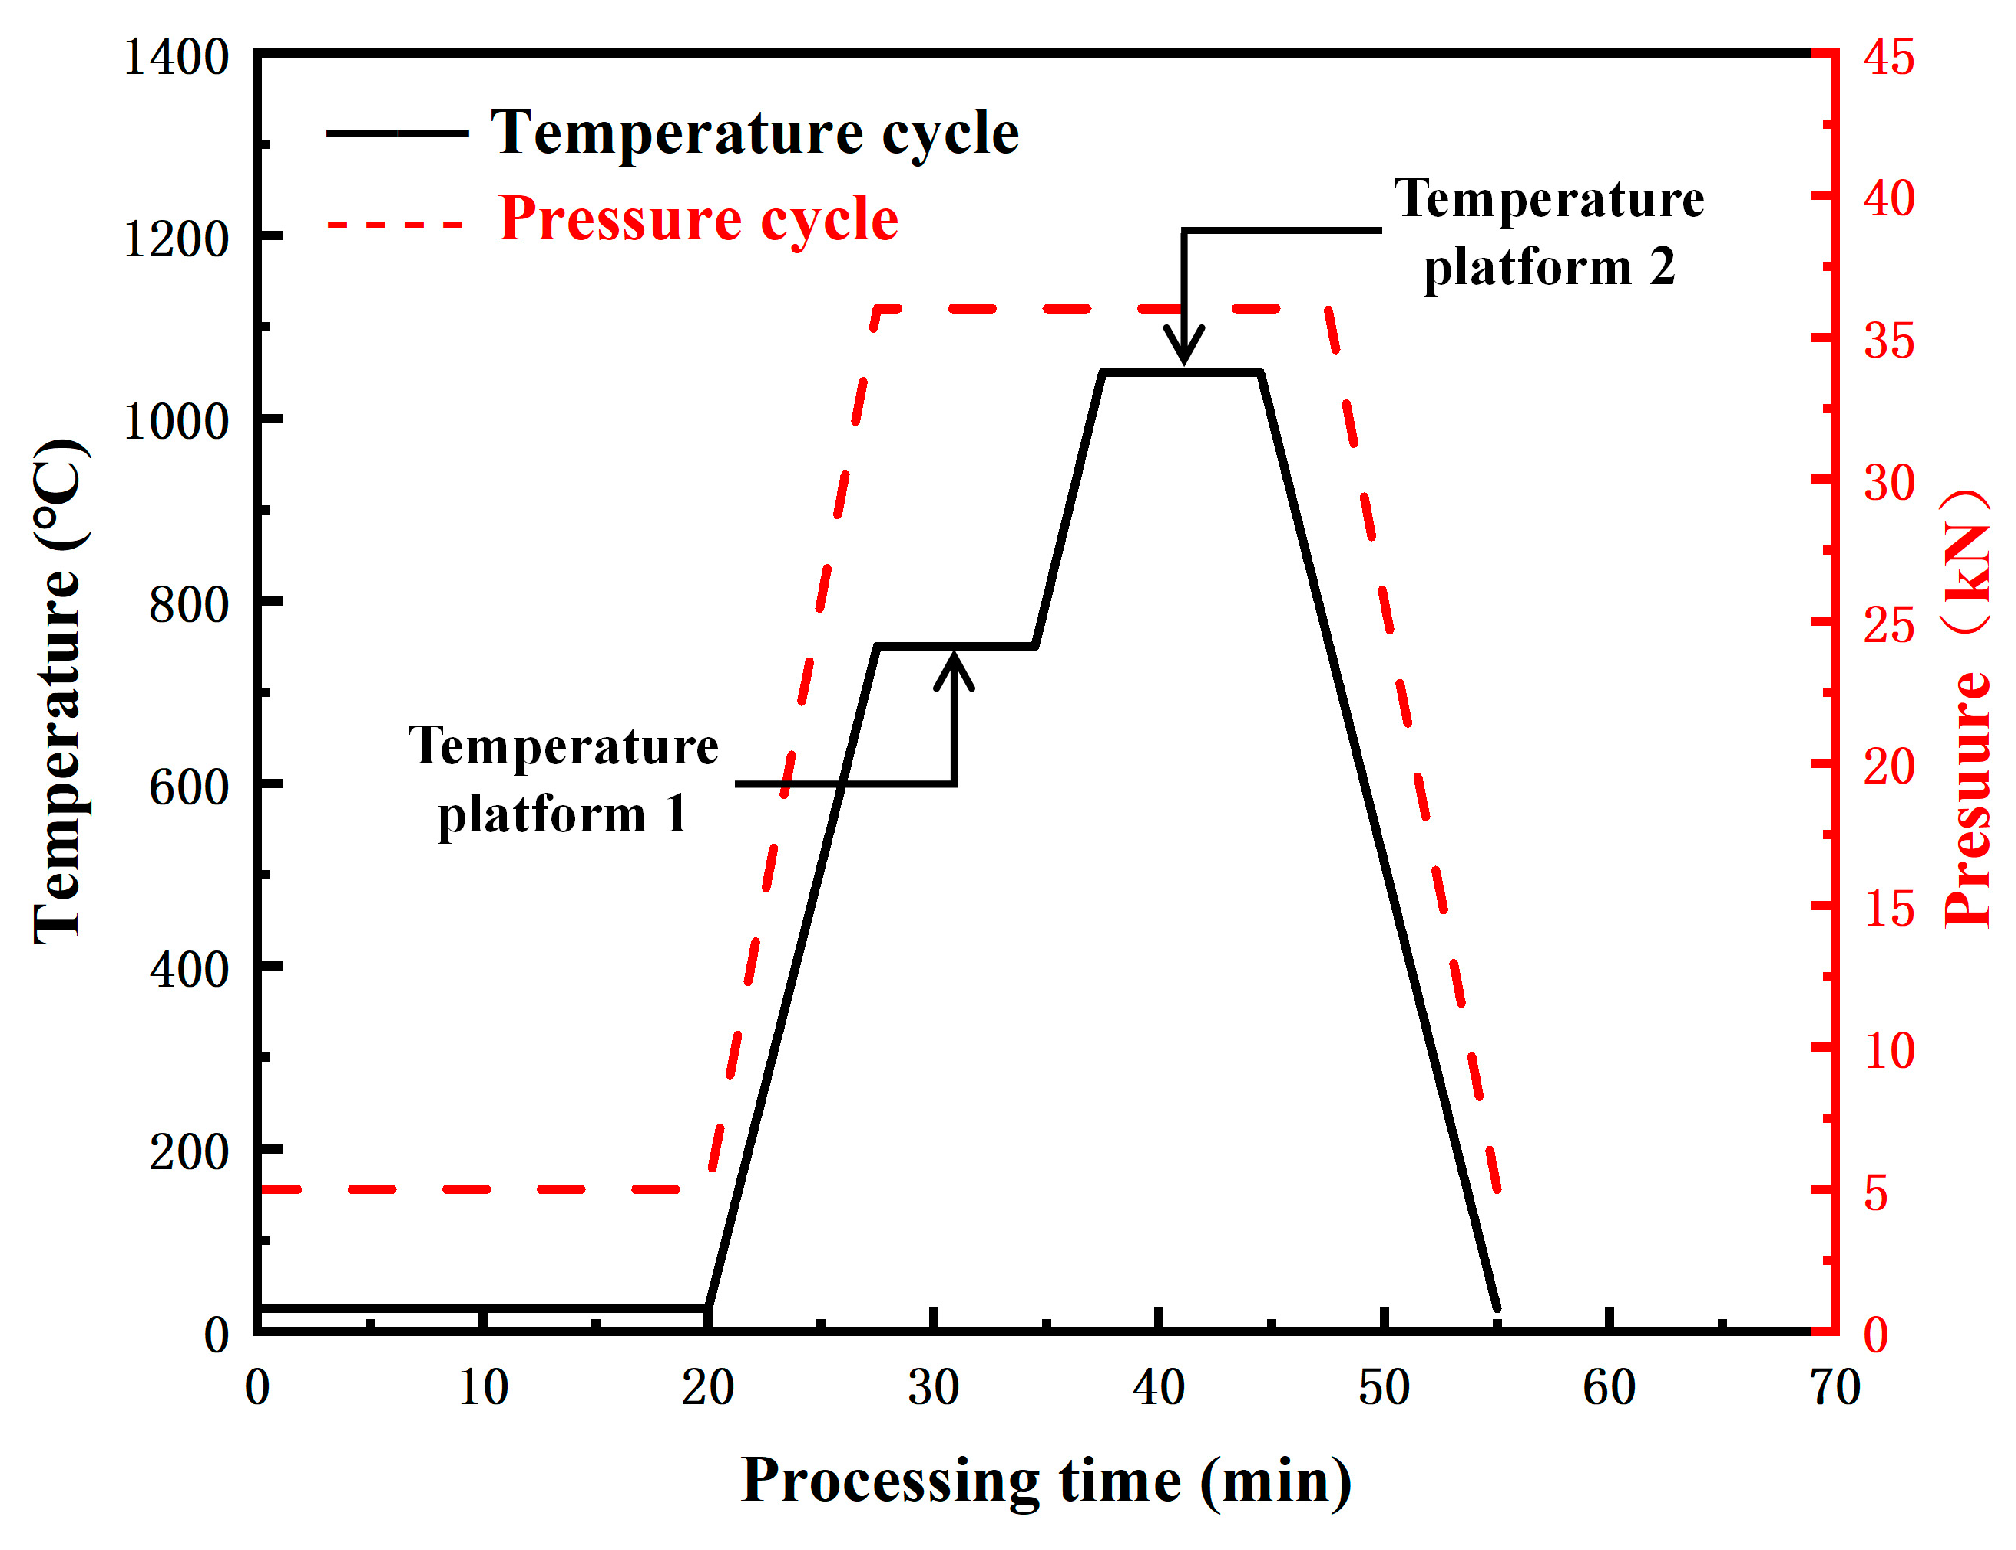
| A1 | 750 | 7 | 1050 | 7 | 50 | 97.1 |
| A2 | 750 | 1100 | 99.1 | |||
| A3 | 750 | 1150 | 99.3 (locally melted) | |||
| A4 | 800 | 1100 | 99.7 | |||
| A5 | 800 | 1150 | Melted |
| C | N | |
|---|---|---|
| Fe powders | 0.70 | 0.52 |
| Cr powders | 0.016 | 0.0071 |
| W powders | 0.019 | 0.054 |
| As-produced Y–Zr–O powders | 1.12 | 0.11 |
| As-sintered steel | 0.61 | 0.45 |
| C | N | |
|---|---|---|
| Atomized Fe powders | 0.70 | 0.52 |
| Electrolytic Fe powders | 0.66 | 0.60 |
| Specimen No. | Heating Rate (°C/min) | Maximum Temperature (°C) | Holding Time (min) | Cooling Condition | Phase Structure at RT |
|---|---|---|---|---|---|
| H1 (as-sintered specimen) | / | / | / | With SPS program | γ + α |
| H2 | 10 | 1100 | 30 | Furnace cooling (<10 °C/min) | α |
| H3 | Air cooling | γ + α | |||
| H4 | Water cooling | γ + α |
| Specimen No. | Temperature Platform 1 (°C) | Temperature Platform 2 (°C) | Hardness (HV) | UTS (MPa) | UE (%) |
|---|---|---|---|---|---|
| A1 | 750 | 1050 | 598 ± 35 | 799 ± 72 | 4.1 ± 0.4 |
| A2 | 750 | 1100 | 522 ± 24 | 779 ± 25 | 4.3 ± 0.9 |
| A3 | 750 | 1150 | 543 ± 44 | 1038 ± 12 | 6.2 ± 0.3 |
| A4 | 800 | 1100 | 480 ± 16 | 888 ± 49 | 4.8 ± 0.5 |
Disclaimer/Publisher’s Note: The statements, opinions and data contained in all publications are solely those of the individual author(s) and contributor(s) and not of MDPI and/or the editor(s). MDPI and/or the editor(s) disclaim responsibility for any injury to people or property resulting from any ideas, methods, instructions or products referred to in the content. |
© 2023 by the authors. Licensee MDPI, Basel, Switzerland. This article is an open access article distributed under the terms and conditions of the Creative Commons Attribution (CC BY) license (https://creativecommons.org/licenses/by/4.0/).
Share and Cite
Wu, Y.; Huang, Q.; Zhang, L.; Jiang, Y.; Zhu, G.; Shen, J. Microstructure and Mechanical Properties of Y4Zr3O12-Added Fe–13.5Cr–2W Oxide-Dispersion-Strengthened Steels, Containing High Contents of C and N, Prepared by Mechanical Alloying and Two-Step Spark Plasma Sintering. Materials 2023, 16, 2433. https://doi.org/10.3390/ma16062433
Wu Y, Huang Q, Zhang L, Jiang Y, Zhu G, Shen J. Microstructure and Mechanical Properties of Y4Zr3O12-Added Fe–13.5Cr–2W Oxide-Dispersion-Strengthened Steels, Containing High Contents of C and N, Prepared by Mechanical Alloying and Two-Step Spark Plasma Sintering. Materials. 2023; 16(6):2433. https://doi.org/10.3390/ma16062433
Chicago/Turabian StyleWu, Yiheng, Qunying Huang, Ligang Zhang, Yong Jiang, Gaofan Zhu, and Jingjie Shen. 2023. "Microstructure and Mechanical Properties of Y4Zr3O12-Added Fe–13.5Cr–2W Oxide-Dispersion-Strengthened Steels, Containing High Contents of C and N, Prepared by Mechanical Alloying and Two-Step Spark Plasma Sintering" Materials 16, no. 6: 2433. https://doi.org/10.3390/ma16062433
APA StyleWu, Y., Huang, Q., Zhang, L., Jiang, Y., Zhu, G., & Shen, J. (2023). Microstructure and Mechanical Properties of Y4Zr3O12-Added Fe–13.5Cr–2W Oxide-Dispersion-Strengthened Steels, Containing High Contents of C and N, Prepared by Mechanical Alloying and Two-Step Spark Plasma Sintering. Materials, 16(6), 2433. https://doi.org/10.3390/ma16062433


