Article

Tuning the Red-to-Green-Upconversion Luminescence Intensity Ratio of Na3ScF6: 20% Yb3+, 2% Er3+ Particles by Changes in Size

1
School of Chemistry and Pharmaceutical Engineering, Jilin Institute of Chemical Technology, Jilin 132022, China
2
College of Information & Technology, Jilin Normal University, Siping 136000, China
*
Author to whom correspondence should be addressed.
Materials 2023, 16(6), 2247; https://doi.org/10.3390/ma16062247
Submission received: 6 February 2023 / Revised: 3 March 2023 / Accepted: 7 March 2023 / Published: 10 March 2023

Abstract

:
Na3ScF6: 20% Yb3+, 2% Er3+ samples were synthesized with different reaction times and reaction temperatures using the solvothermal method. We carried out a series of tests on Na3ScF6 crystals. The XRD patterns showed that the monoclinic phases of the Na3ScF6 samples could be synthesized under different reaction conditions, and doping with Yb3+ ions and Er3+ ions did not change the crystal structures. The SEM images showed that the sizes of the samples gradually increased with reaction time and reaction temperature. The fluorescence spectra showed that the emission peaks of the prepared samples under 980 nm near-infrared (NIR) excitation were centered at 520 nm/543 nm and 654 nm, corresponding to the 2H11/2/4S3/24I15/2 and 4F9/24I15/2 transitions, respectively. With the increasing size of the samples, the emission intensities at 654 nm increased and the luminescence colors changed from green to red; at the same time, the red-to-green luminescence intensity ratios (IR/IG ratios) increased from 0.435 to 15.106—by as much as ~34.7 times. Therefore, this paper provides a scheme for tuning the IR/IG ratios of Na3ScF6: 20% Yb3+, 2% Er3+ samples by changing their sizes, making it possible to enhance the intensity of red upconversion, which has great potential for the study of color displays and lighting.

1. Introduction

Lanthanide-doped nanomaterials enable the conversion from near-infrared light to visible light due to the anti-Stokes effect when two or more low-energy photons are sequentially absorbed and higher-energy photons are emitted [1,2,3,4]. These nanomaterials have the advantages of long luminescence lifetimes, narrow emission bands, high penetration abilities and chemical stability, making them suitable for potential applications in bioimaging, infrared photothermal therapy, fluorescent biomarkers, anti-counterfeiting, photocatalysis, photodetectors, optoelectronic devices, sensors and other fields [5,6,7,8,9,10,11,12,13,14,15,16,17,18,19]. In particular, red-upconversion-luminescence nanomaterials can be better suited to biological applications. The wavelength range of red light is 620–750 nm, which is more conducive to applications, such as biomarkers, biological probes and the study of biological tissues, due to its strong penetration depth and small light-scattering range compared to green and blue light [5,6,7,20,21,22]. Over the past few years, various methods for synthesizing nanomaterials that produce red-upconversion luminescence have been investigated. Hao Dong et al. increased the red–green luminescence intensity ratio of Er3+ by 2 to 100 times by designing a local structure of the luminescence center of the nanocrystal that kept the Yb3+/Er3+ luminescence center unchanged and by changing the molar ratio of Na+/Re3+ and F/Re3+, and further increased it by 450 times by the epitaxial growth of CaF2 shells [23]. Gan Tian et al. obtained NaYF4:Yb3+/Er3+ nanocrystals with pure red-upconversion luminescence by doping Mn2+ ions [24]. Sc, as a special rare earth element different from other lanthanide elements, has a unique electronic configuration and a smaller ionic radius (0.83 Å) such that it can more easily produce red-upconversion luminescence, and so people began to turn to Sc3+ as a matrix in materials research. Therefore, in recent years there has been an increasing amount of research on NaScF4 nanocrystals co-doped with Yb3+ and Er3+, which can readily produce red-upconversion luminescence [2,5,25,26,27,28,29,30]. Min Pang et al. directly synthesized water-soluble hexagonal NaScF4: Yb3+/Er3+ nanocrystals with strong red-upconversion luminescence by a hydrothermal method; afterwards, an active shell layer containing Yb3+ was wrapped around the NaScF4: Yb3+, Er3+ core nanocrystals, which further increased the intensity of the upconversion luminescence by a factor of 6.8 [6]. Mingshun Yang et al. synthesized water-soluble NaScF4: Yb3+, Er3+ nanocrystals with strong red-upconversion luminescence by a hydrothermal method and controlled red–green luminescence intensity ratios by varying the doping concentrations of Yb3+ ions, obtaining more intense red-upconversion luminescence at a relatively low doping concentration [8]. Ding et al. synthesized nanorods with orthogonal crystal-phase KSc2F7: 20% Yb3+, 2% Er3+, and strong red-upconversion luminescence was observed [31]. Jingning Shan et al. synthesized NaYF4: Yb, Er nanoparticles with sizes ranging from 18 nm to 200 nm and studied the effect of size on their luminescence properties. The results showed that the upconversion luminescence intensity of the nanoparticles was proportional to their size [32]. Zhai et al. synthesized NaYF4: 20%Yb, 2%Tm nanoparticles with sizes of 9 nm and 20 nm and tested the fluorescence spectra under 980 nm excitation. The results showed that the upconversion luminescence intensities of the nanocrystals of large size were stronger than those of the nanocrystals of small size [33]. However, the effect of the size of Na3ScF6 nanocrystals on the ratio of red–green luminescence intensities in Yb3+-Er3+ co-doped systems is rarely reported.
In this article, we synthesized Yb3+-Er3+ co-doped Na3ScF6 samples by the solvent thermal method using ethanol, oleic acid and deionized water. We adjusted the sizes of the Na3ScF6: 20% Yb3+, 2% Er3+ samples by controlling the reaction times and the reaction temperatures to investigate the effect of size on the luminescence properties of these samples.

2. Experimental

2.1. Chemicals

All of the chemical medicines were analytical reagents and were used without further purification. Scandium chloride hexahydrate (ScCl3·6H2O), erbium chloride anhydrous hexahydrate (ErCl3·6H2O) and oleic acid (OA) were purchased from Alfa Aesar Co., Ltd., Shanghai, China. Ytterbium chloride hexahydrate (YbCl3·6H2O) was purchased from Shaoyuan Chemical Technology Co., Ltd., Shanghai, China. Potassium fluoride (KF·2H2O) was purchased from Tianjin Guangfu Technology Development Co., Ltd., Tianjin, China. Sodium hydroxide (NaOH) and ethyl alcohol (CH3CH2OH) were purchased from Tianli Chemical Reagent Co., Ltd., Tianjin, China. Cyclohexane (C6H12) was purchased from Tianjin Kaixin Chemical Industry Co., Ltd., Tianjin, China.

2.2. Synthetic Procedures

Na3ScF6 samples co-doped with Yb3+-Er3+ were synthesized by the solvothermal method. First, 5 mmol ScCl3·6H2O, 2 mmol YbCl3·6H2O and 1 mmol ErCl3·6H2O were separately dissolved in 10 mL deionized water to form a 0.5 mol L−1 ScCl3·6H2O aqueous solution, a 0.2 mol L−1 YbCl3·6H2O aqueous solution and a 0.1 mol L−1 ErCl3·6H2O aqueous solution for standby application. Next, 20 mL OA, 10 mL ethanol and 2 mL deionized water were added to the beakers in turn. After that, 0.6 g NaOH was dissolved in 2.5 mL deionized water, which was poured into the above mixtures; the mixtures were then stirred for 30 min until dissolution. Then, 800 μL ScCl3·6H2O aqueous solution, 450 μL YbCl3·6H2O aqueous solution and 100 μL ErCl3·6H2O aqueous solution were respectively absorbed by pipette and slowly dropped into the above mixtures successively, followed by stirring for 30 min until dissolution. Following this, 2 mmol KF·2H2O (4 times the amount of rare earth ions) was dissolved in 4 mL deionized water and slowly dropped into the above mixed solutions, which were then stirred continuously for 30 min. After the above steps, the mixed solutions were poured into a 50 mL polytetrafluoroethylene (PTFE) lined reactor and the temperature was set to 160 °C and maintained for 4 h. When the reaction time was over and the mixtures had cooled to room temperature, the products were washed several times with cyclohexane and ethanol and centrifuged before, finally, being dried and preserved. Afterwards, the above operations were repeated and the reaction conditions (reaction temperature and reaction time) were changed: 160 °C, 8 h; 180 °C, 4 h; 180 °C, 8 h; 200 °C, 4 h; and 200 °C, 8 h. In this way, Na3ScF6: 20% Yb3+, 2% Er3+ samples were obtained.

2.3. Characteristics

X-ray diffraction (XRD) patterns: The crystalline phases of the products were measured using a Model Rigaku Ru-200b X-ray powder analyzer produced by the Rigaku Corporation, Japan (λ = 1.5406 Å, scanning range from 10° to 70°).
Scanning Electron Microscopy (SEM): The morphologies, including size and shape, were measured with a JSM-7500F scanning electron microscope produced by JEOL, Tokyo, Japan.
Spectroscopic measurements: The spectra of the upconversion particles were measured using a Hitachi F-4500 fluorescence spectrophotometer produced in Japan.

3. Results and Discussion

Our experimental results showed the morphologies and fluorescence intensities of the Na3ScF6: 20% Yb3+, 2% Er3+ samples. By varying the reaction time and temperature, the sizes of the samples were changed, as were the luminescence colors, and the changes in the sizes of the samples led to changes in their red–green luminescence intensity ratios (IR/IG ratios), which has rarely been seen in rare-earth-doped upconversion particles.
The crystal phases of Na3ScF6: 20% Yb3+, 2% Er3+ particles prepared under different reaction conditions were analyzed by X-ray diffraction (XRD). The XRD patterns are shown in Figure 1. It can be seen that the diffraction peaks of the prepared samples correspond well to the standard card of the monoclinic-phase Na3ScF6 (JCPDS card no. 20-1153), and no other impurities could be detected when the temperature was 160 °C and the reaction time was 4 h. When the reaction temperature was constant and the reaction time was increased to 8 h, the diffraction peaks could also be indexed to the standard card of the monoclinic-phase Na3ScF6. This shows that the samples we prepared were monoclinic-phase Na3ScF6. With a temperature of 180 °C and a reaction time of 4 h or 8 h, the XRD patterns of the prepared samples corresponded well to the monoclinic-phase Na3ScF6 (JCPDS card no. 20-1153). The above results show that the prepared samples were pure monoclinic-phase Na3ScF6. When the temperature reached 200 °C and the reaction time was 4 h or 8 h, similarly, the prepared samples also corresponded to the standard card of monoclinic-phase Na3ScF6. The above results show that at 200 °C and with a reaction time of 4 h or 8 h, the samples were monoclinic-phase Na3ScF6. Therefore, it can be seen that when both the temperature and reaction time were varied, the crystal phases of the samples did not change, such that monoclinic-phase Na3ScF6 could be synthesized, nor did the doping with Yb3+ ions and Er3+ ions change the crystal structures. However, it can be seen that as the temperature increased and the reaction time increased, the relative peak intensity increased and the diffraction peaks sharpened, indicating that temperature and reaction time can have an effect on the size of samples. The higher the temperature and the longer the reaction time, the higher the degree of the sharpening of the diffraction peaks and the larger the size of the samples. When the reaction temperature was 160 °C and the reaction time was 4 h, the size of the Na3ScF6 particles was the smallest—only about tens of nanometers—and the shape was spherical; the particles clustered together and they did not form obvious crystals; in other words, the crystallinity was not high and the crystal grains were small, which led to a significant reduction in peak intensity, and some of the peaks even disappeared.
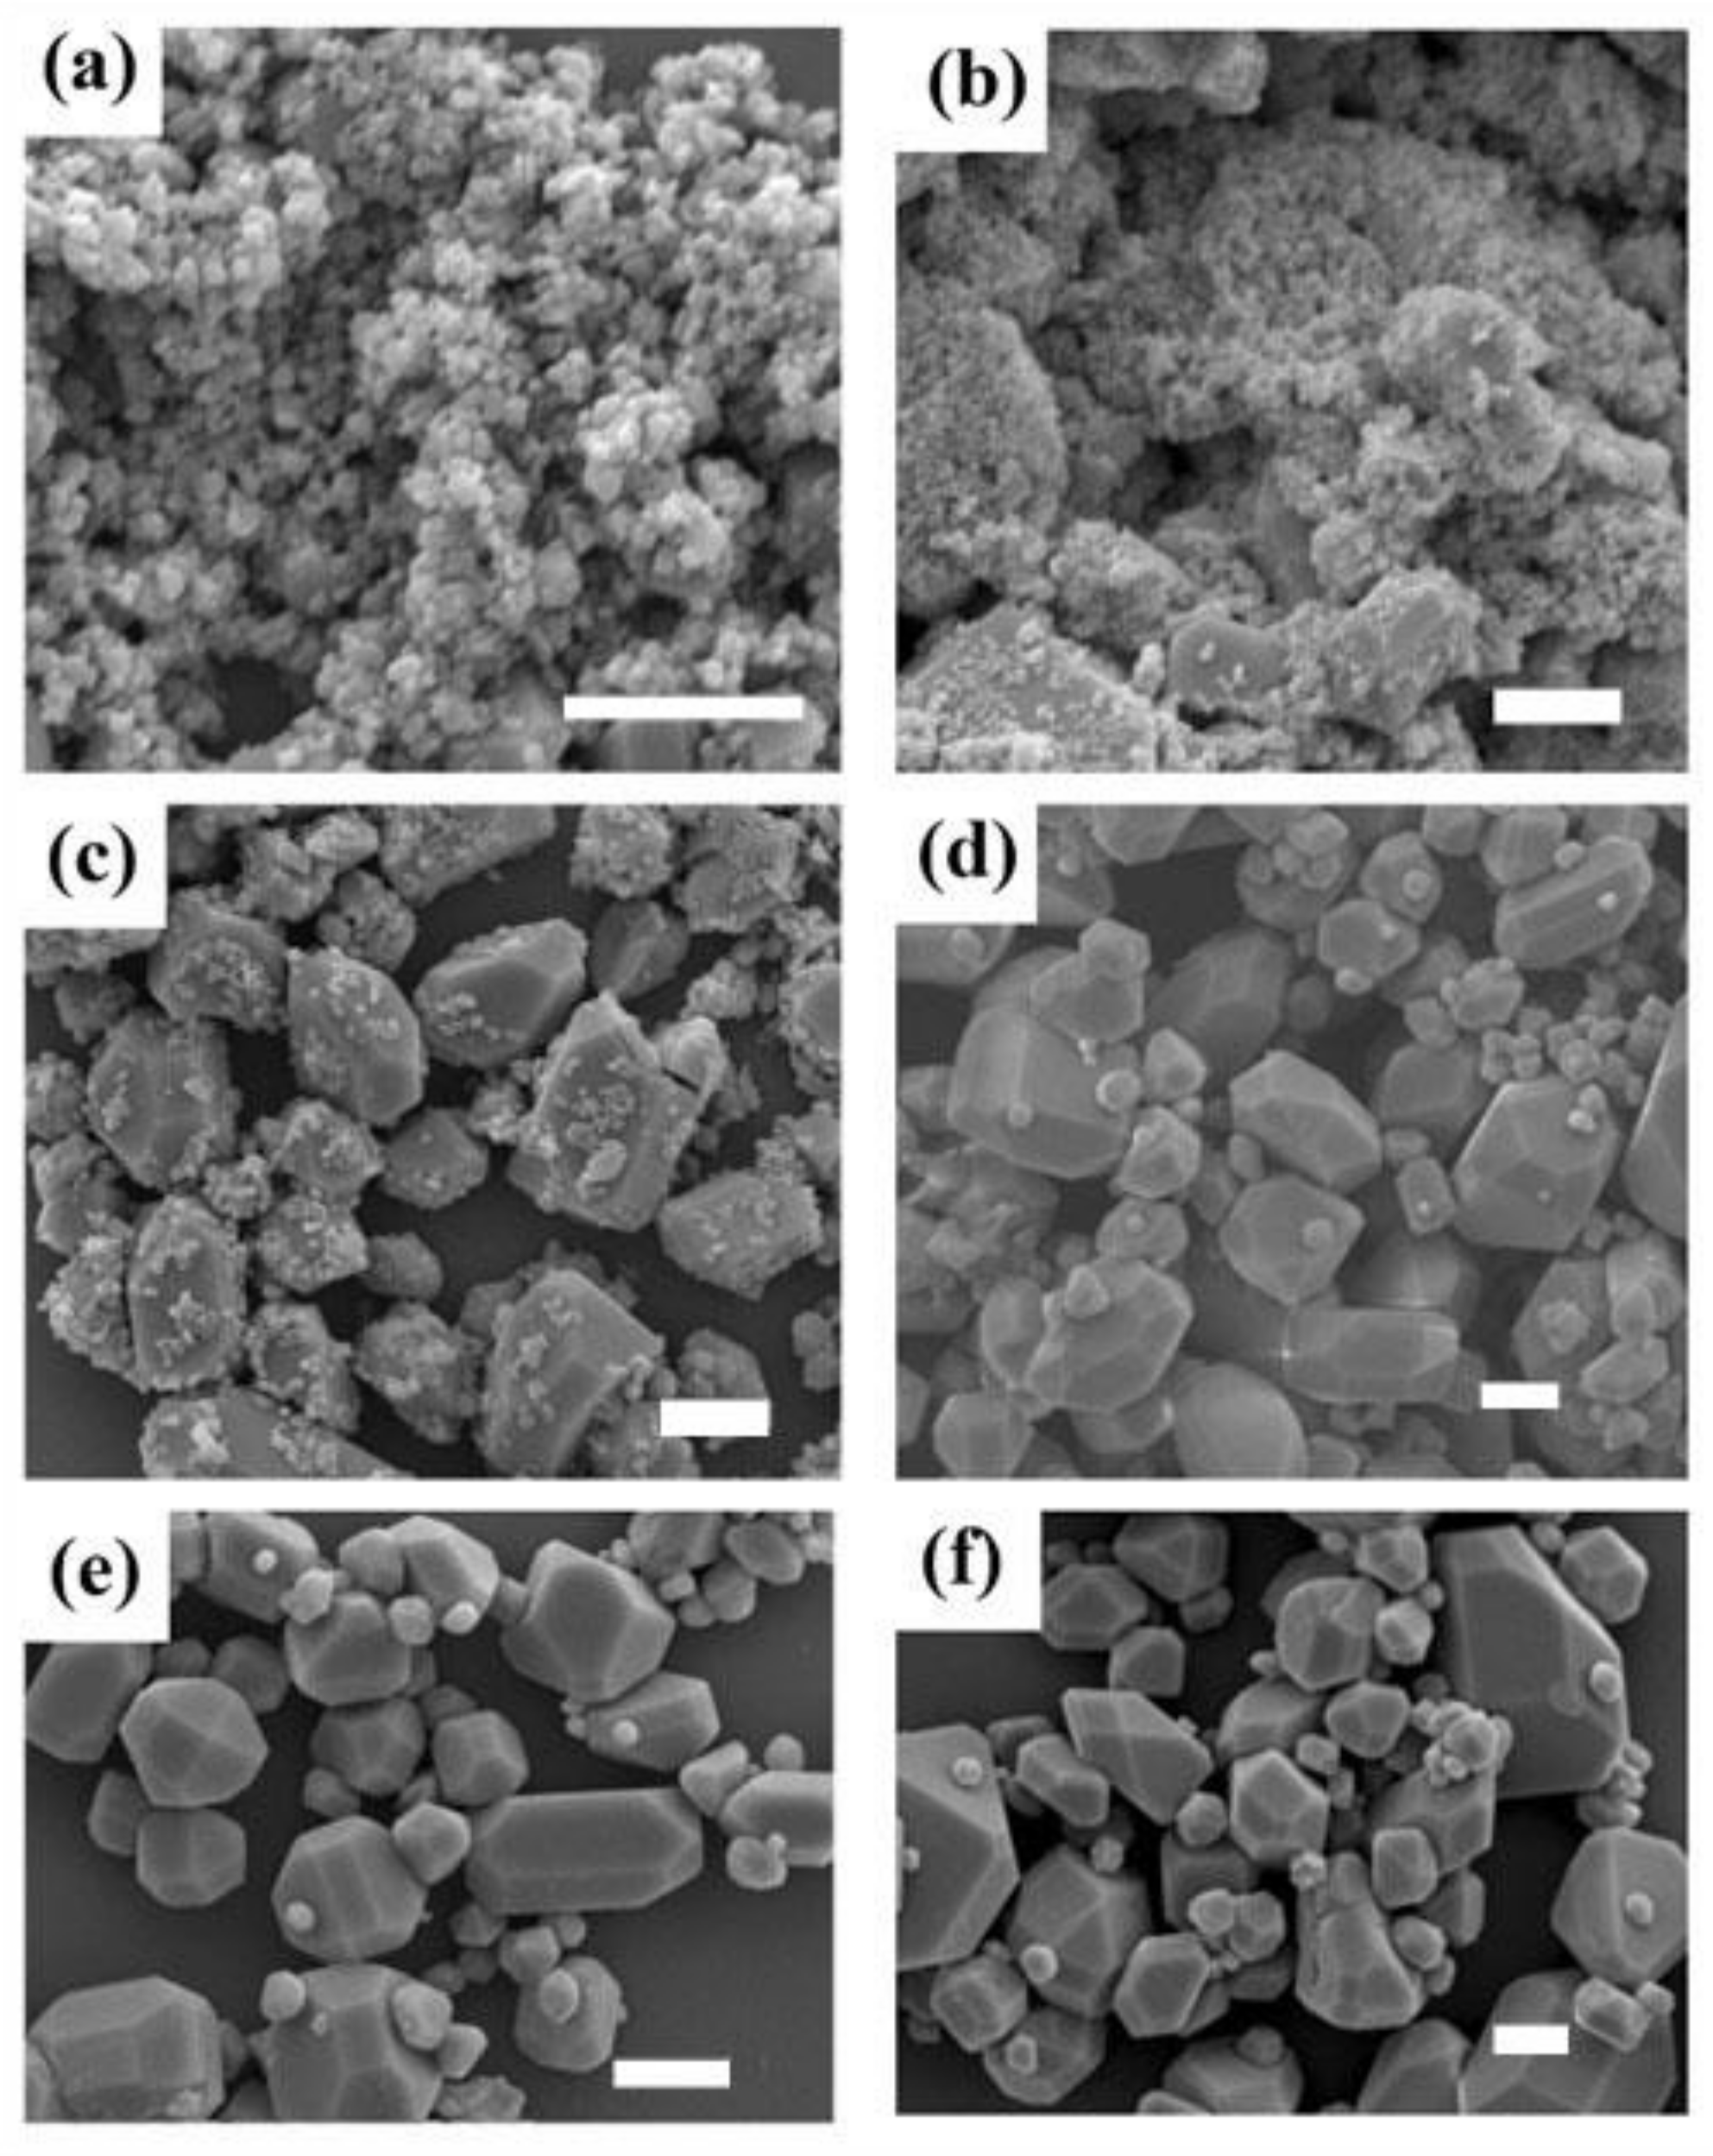
Figure 2 shows the SEM images of the Na3ScF6: 20% Yb3+, 2% Er3+ particles prepared under different reaction conditions. As shown in Figure 2a, when the reaction temperature was 160 °C and the reaction time was 4 h, the resulting size of the prepared samples was small, the minimum diameter was 28 nm and the maximum diameter reached up to 153 nm; when the temperature was kept constant and the reaction time was increased to 8 h, it could be seen that the size of the prepared samples became larger, with minimum diameters of 61 nm and maximum diameters of 162 nm, as shown in Figure 2b; comparing the results with those obtained with a reaction time of 4 h, the size of the samples increased gradually. It can be seen from Figure 2a,b that the sizes of the samples we prepared were nanometric. As shown in Figure 2c, when the reaction temperature was 180 °C and the reaction time was 4 h, the sample shapes were polyhedral and the sizes of the prepared samples became micrometric. The maximum diameter of the samples was 1.8 μm, and many small particles with an average diameter of about 300 nm were attached to the surfaces. At this temperature, as the reaction time increased to 8 h, the small particles attached to the surfaces gradually grew into small nanocrystals with diameters of about 500 nm; the maximum diameter of the large particles was 2.2 μm, and the surfaces tended to be smooth, as shown in Figure 2d. As shown in Figure 2e, when the temperature was 200 °C and the reaction time was 4 h, the surfaces of the samples were smooth, with an average diameter of 2 μm. At this temperature, the reaction time was increased to 8 h and the size of the nanocrystals was almost the same as the size of the large nanocrystals; the average diameter of the samples was 2.4 μm.
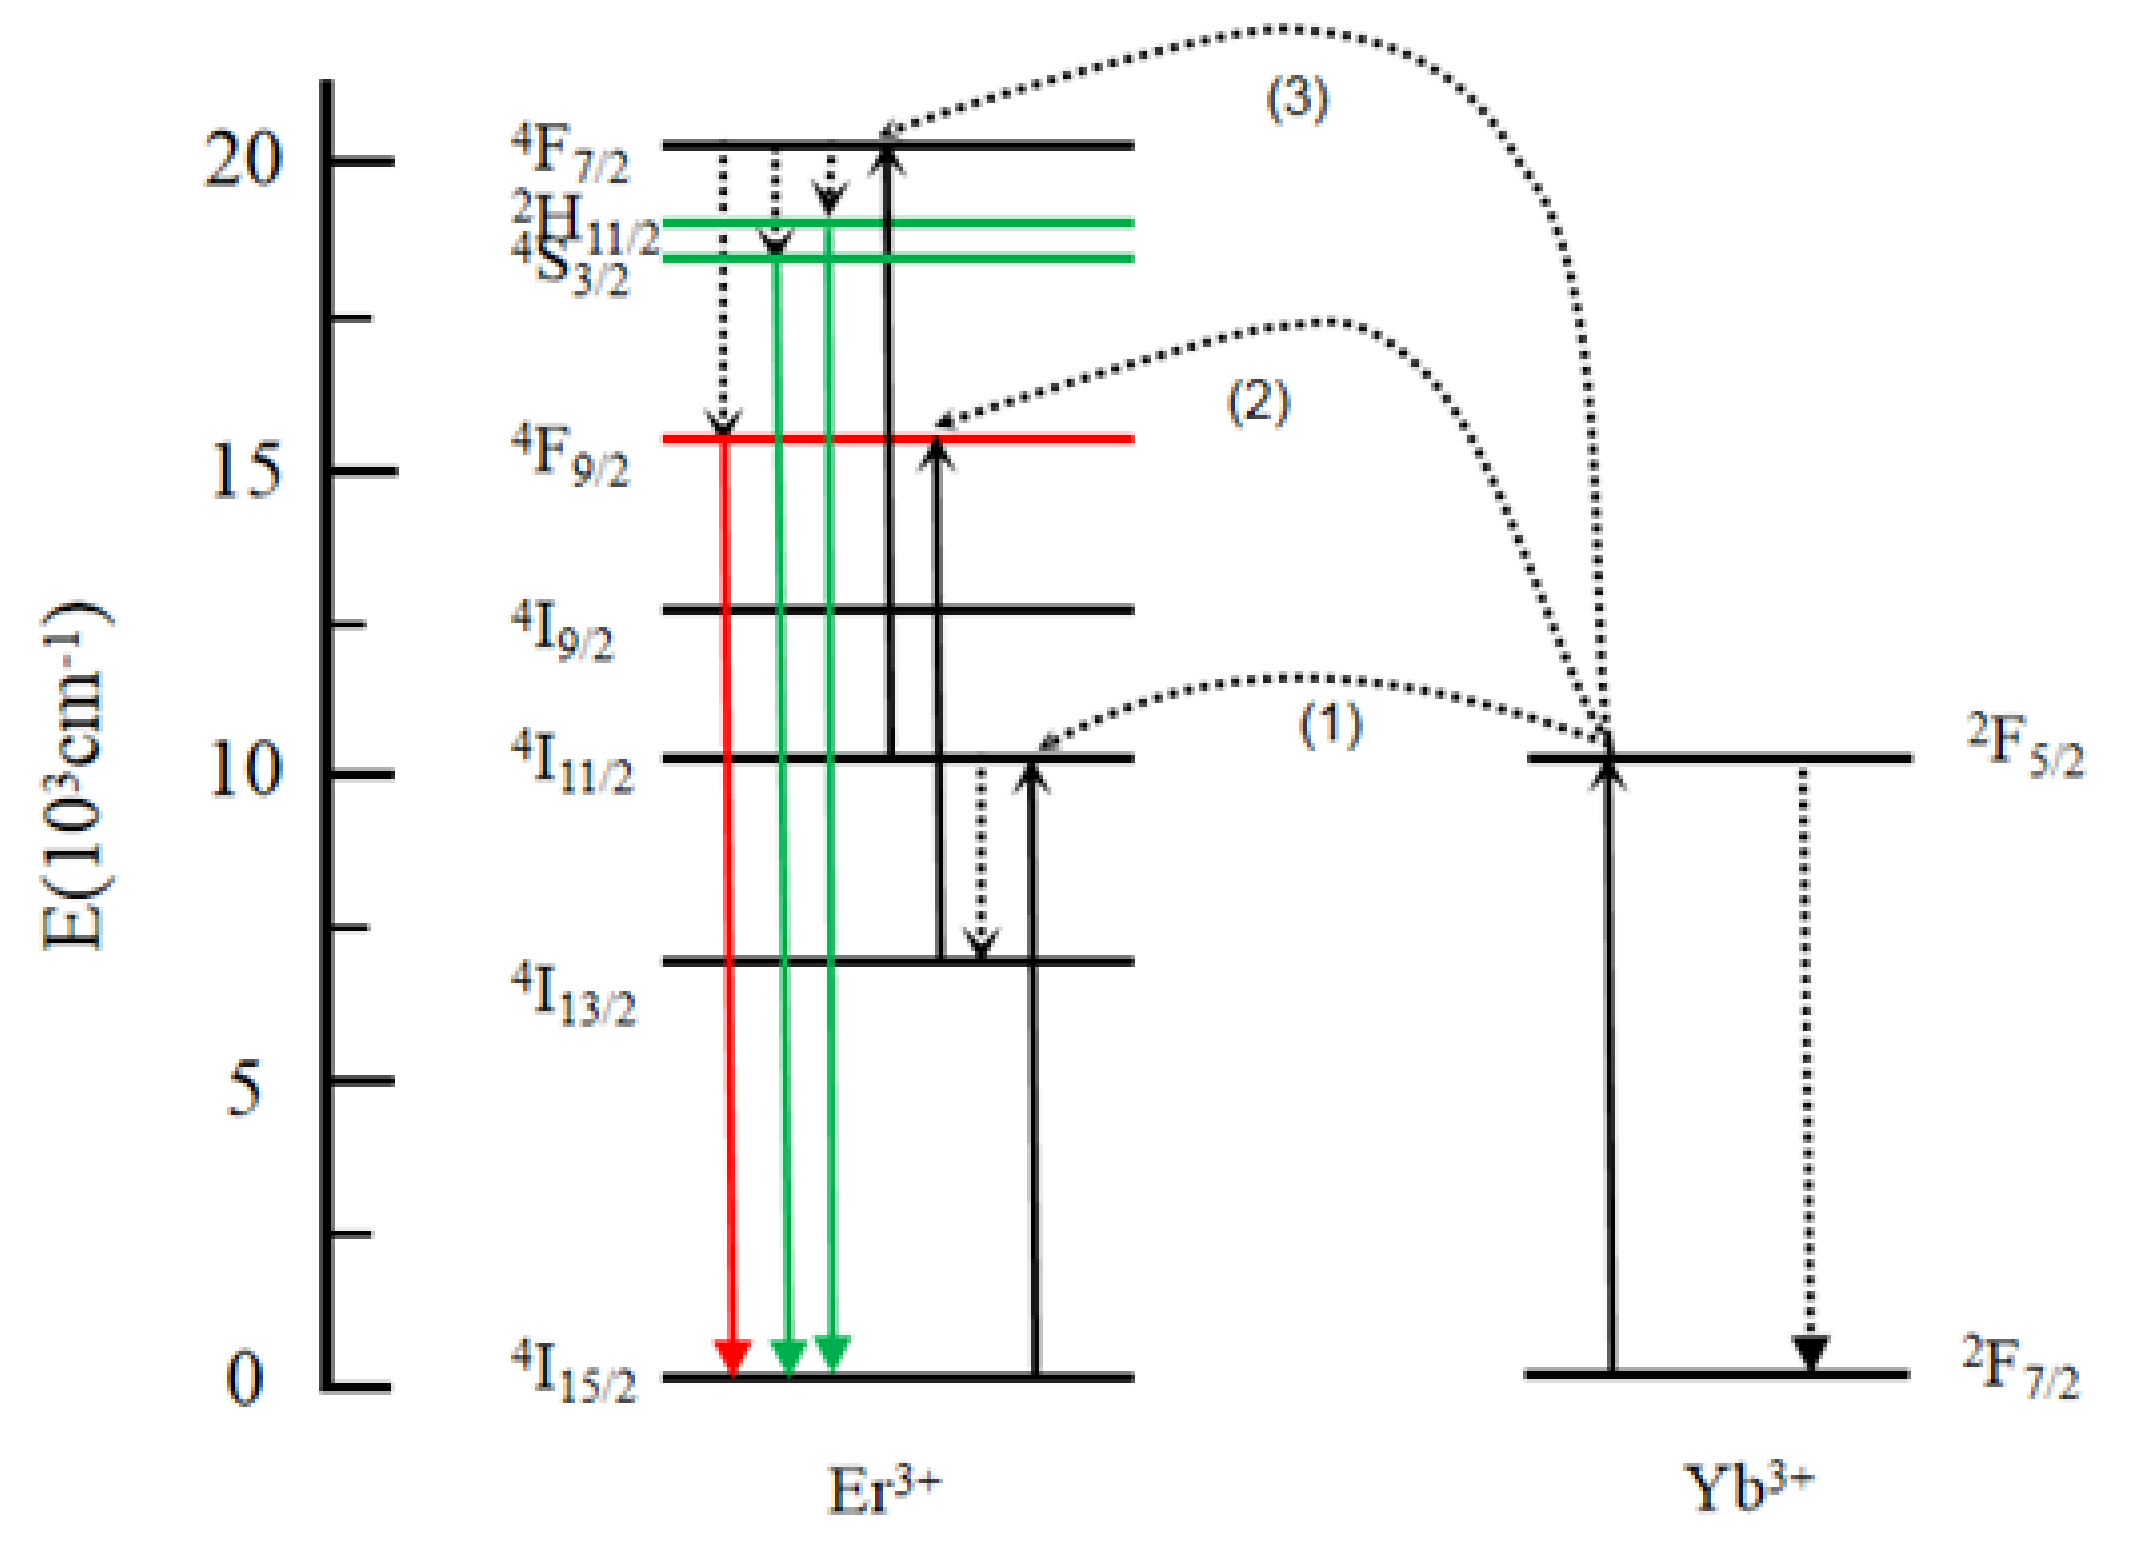
Figure 3 shows the energy-transfer process in the Yb3+-Er3+ co-doped Na3ScF6 systems. To the best of our knowledge, the Yb3+ ions have a large absorption cross section at 980 nm, which allows the Yb3+ ions to continuously absorb photons to be transferred to the adjacent Er3+ ions, so we chose Yb3+-Er3+ co-doped systems as the research objects. We chose Na3ScF6 as the matrix material because the radius of Sc3+ ions is small. In the A-body system, Yb3+ ions and Er3+ ions take the positions of the Sc3+ ions in the lattice. This makes the distance between Yb3+ ions and Er3+ ions closer, and the energy-transfer efficiency between them is higher. The possible upconversion processes are as follows: (1) Yb3+ ions absorb the energy of the 980 nm pump light and the electrons from the 2F7/2 energy level transition to the 2F5/2 energy level, and the energy is transferred from Yb3+ ions to Er3+ ions, the electron layout changing to the 4I11/2 level of the Er3+ ions. (2) The electrons on the 4I11/2 level of the Er3+ ions are arranged at the 4I13/2 level of the Er3+ ions through nonradiative transition. Then, the following energy-transfer process occurs between Yb3+ ions and Er3+ ions: 2F5/2(Yb3+) + 4I13/2(Er3+) → 2F7/2(Yb3+) + 4F9/2(Er3+). The radiative transition of electrons from the 4F9/2 level of Er3+ ions to the 4I15/2 level of the ground state of Er3+ ions produces red-upconversion luminescence. (3) Due to the close spacing between Yb3+ and Er3+ ions and the appropriate energy matching between 4I11/24F7/2 (Er3+) and 2F7/22F5/2 (Yb3+), the energy-transfer process occurs between Er3+ and Yb3+ ions. The electrons at the 4F7/2 level of the Er3+ ions are arranged at the 2H11/2, 4S3/2 and 4F9/2 level of the Er3+ ions through nonradiative transition. The radiative transition of electrons from the 2H11/2/4S3/2 level of Er3+ ions to the 4I15/2 level of the ground state of Er3+ ions produces green-upconversion luminescence. Simultaneously, the radiative transition of electrons from the 4F9/2 level of Er3+ ions to the 4I15/2 level of the ground state of Er3+ ions produce red-upconversion luminescence. Analytically, we determined that when the reaction time and temperature increased, the size of the Na3ScF6 nanocrystals increased and the Yb3+ ions and Er3+ ions that occupied the positions of the Sc3+ ions in the Na3ScF6 nanocrystal systems became closer, leading to an increase in energy-transfer efficiency.
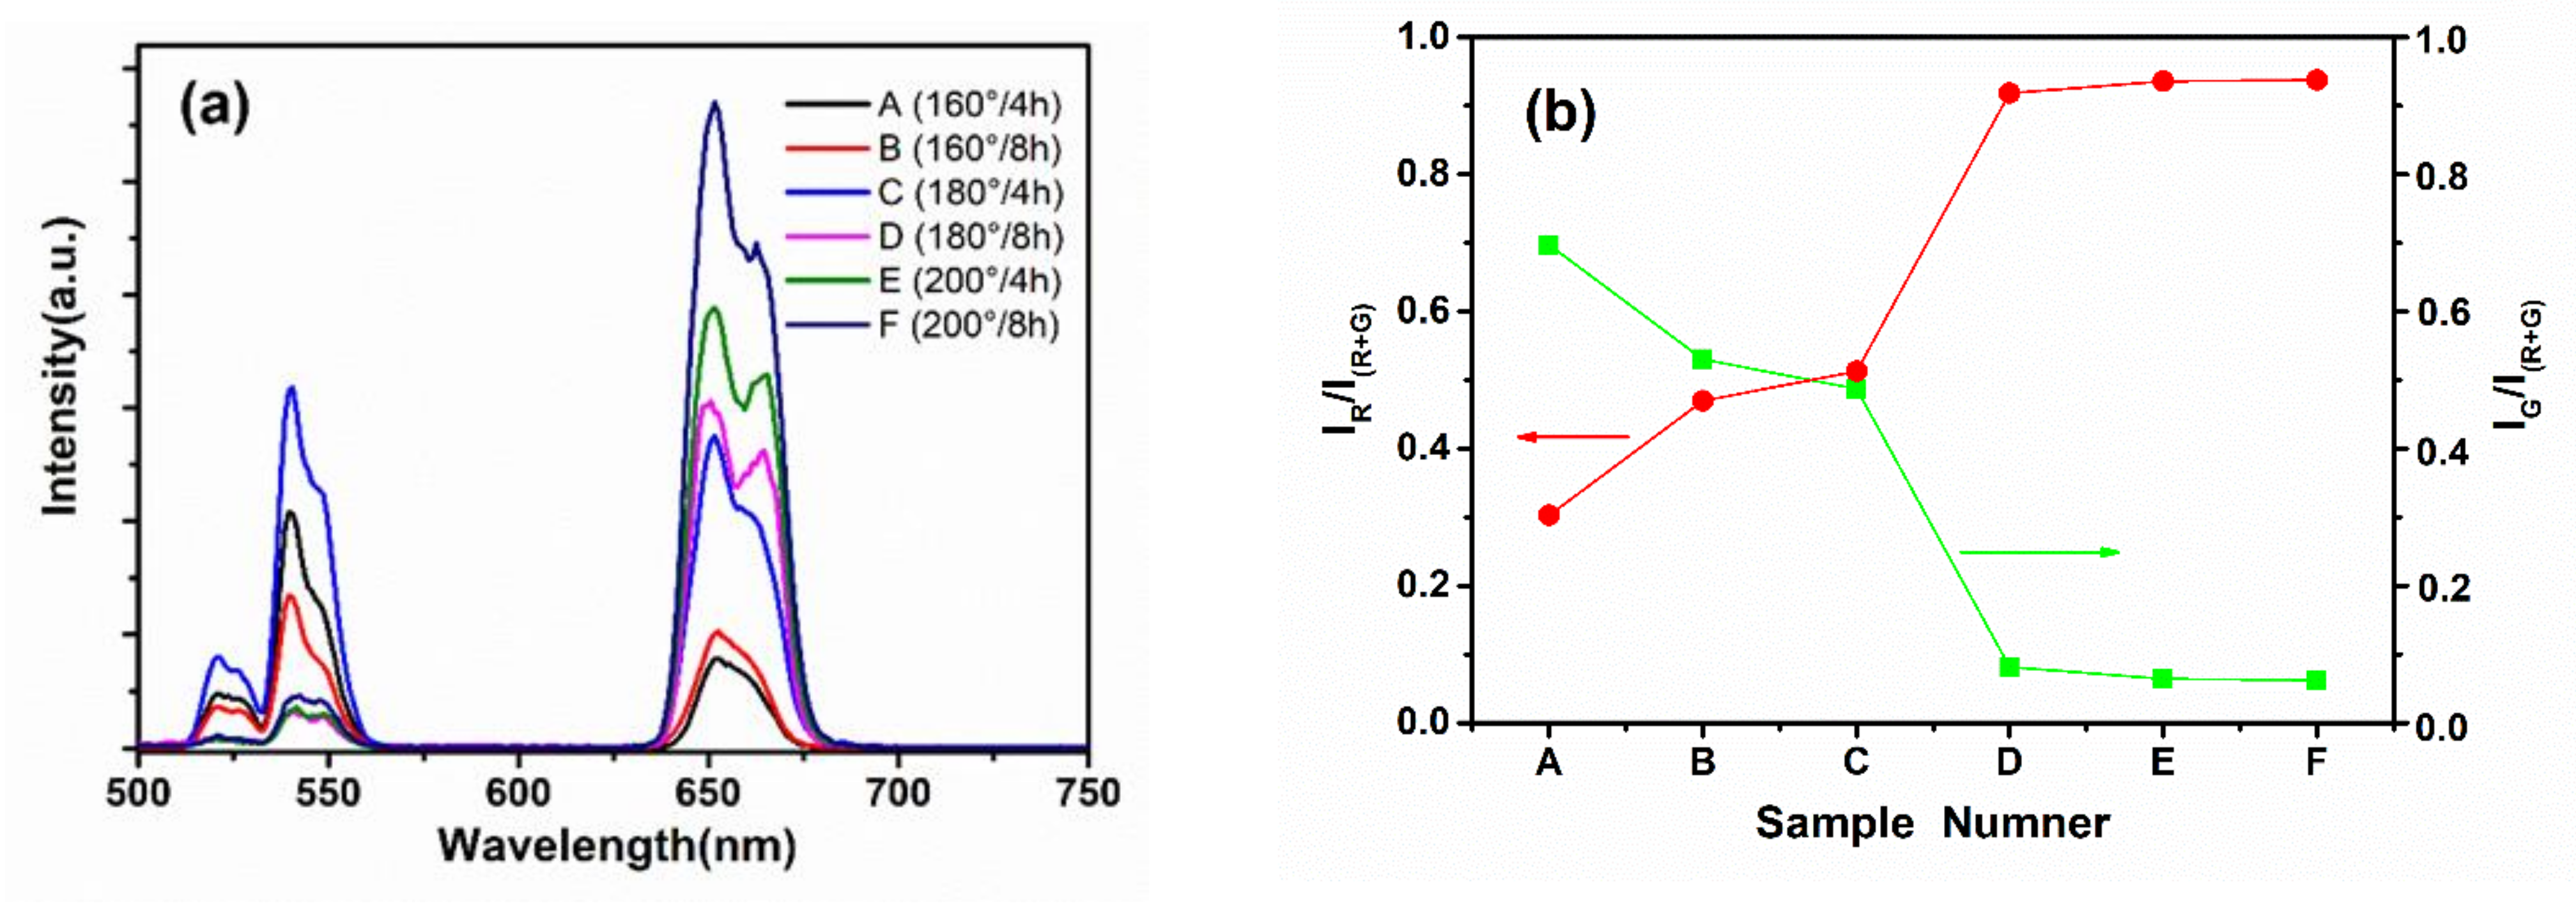
Figure 4b shows the ratios of green emission intensity IG and red emission intensity IR to the total integrated intensity I(G+R) of sample A (160 °C, 4 h), sample B (160 °C, 8 h), sample C (180 °C, 4 h), sample D (180 °C, 8 h), sample E (200 °C, 4 h) and sample F (200 °C, 8 h) under different reaction conditions in the range of 500–750 nm. It can be seen from Figure 4b that when the reaction temperature was 160 °C and the reaction time was 4 h (sample A), the green emission intensity IG accounted for 70% of the total integrated intensity I(G+R), while the red emission intensity IR accounted for 30%. When the reaction temperature was 160 °C and the reaction time was 8 h (sample B) and when the reaction temperature was 180 °C and the reaction time was 4 h (sample C), the green emission intensity IG was not much different from the red emission intensity IR, which was about 50%, but when the reaction temperature was 180 °C and the reaction time was 8 h (sample D) and when the reaction temperature was 200 °C and the reaction time was 4 h (sample E) and when the reaction temperature was 200 °C and the reaction time was 8 h (sample F), the green emission intensity IG only accounted for 5% of the total integrated intensity, while the red emission intensity IR was as high as 95%. It was found that with increases in temperature and time, the ratio of IG in I(G+R) gradually decreased, while IR accounted for I(G+R) gradually increasing, and the color of the corresponding samples changed from green to red. As can be seen in Figure 3a, which shows the fluorescence spectra, the emission peaks were centered at 520 nm/543 nm and 654 nm, corresponding to the 2H11/2/4S3/24I15/2 (green-upconversion luminescence) and 4F9/24I15/2 (red-upconversion luminescence) transitions, respectively. When the temperature was 160 °C, the size of our samples was at the nanometer level; as the reaction time increased from 4 h to 8 h, the size of the nanocrystals increased slightly and it was found that the green emission decreased and the red emission increased, as can be seen in Figure 3b. When the temperature was 180 °C and the reaction time was 4 h, the samples we prepared had both nanometric and micrometric sizes, the green fluorescence intensity of the samples was weakened and the red fluorescence intensity of the samples was enhanced, compared with the samples prepared when the reaction temperature was 160 °C. When the temperature was 180 °C, as the reaction time increased from 4 h to 8 h, a sharp decrease in green emission at 520 nm/543 nm and a sharp increase in red emission at 654 nm were observed. The above results can be seen in Figure 4b. When the reaction temperature was 200 °C, as the reaction time increased from 4 h to 8 h, the size of the samples increased slightly, and it was found that both had low green emission at 541 nm and slightly higher red emission at 654 nm for the reaction time of 8 h. When the reaction time was kept constant at 4 h or 8 h, the red emission at 654 nm increased gradually as the temperature increased, as was observed in the fluorescence spectra corresponding to the green-luminescence intensity of the samples decreasing gradually and the red-luminescence intensity of the samples increasing gradually. This was due to the small radius of the Sc3+ ions, which is only 0.83 Å., making the distance between Sc3+-Sc3+ in the Na3ScF6 host shorter, so that when the doped Yb3+ ions and Er3+ ions enter the host to occupy the position of the Sc3+ ions, the distance between the Yb3+ ions and Er3+ ions is reduced, increasing the probability of cross-relaxation, making it easier for Er3+ ions to jump to higher energy levels, such as 4F9/2; in addition, as the temperature and reaction time increase, the surface defects decrease in the wake of the size of the nanocrystal increase, and the energy-transfer upconversion efficiency is much higher than the surface-defect effect, so the green fluorescence intensity of a sample shows a gradual weakening trend, and the red l fluorescence intensity of a sample shows a gradual weakening trend.
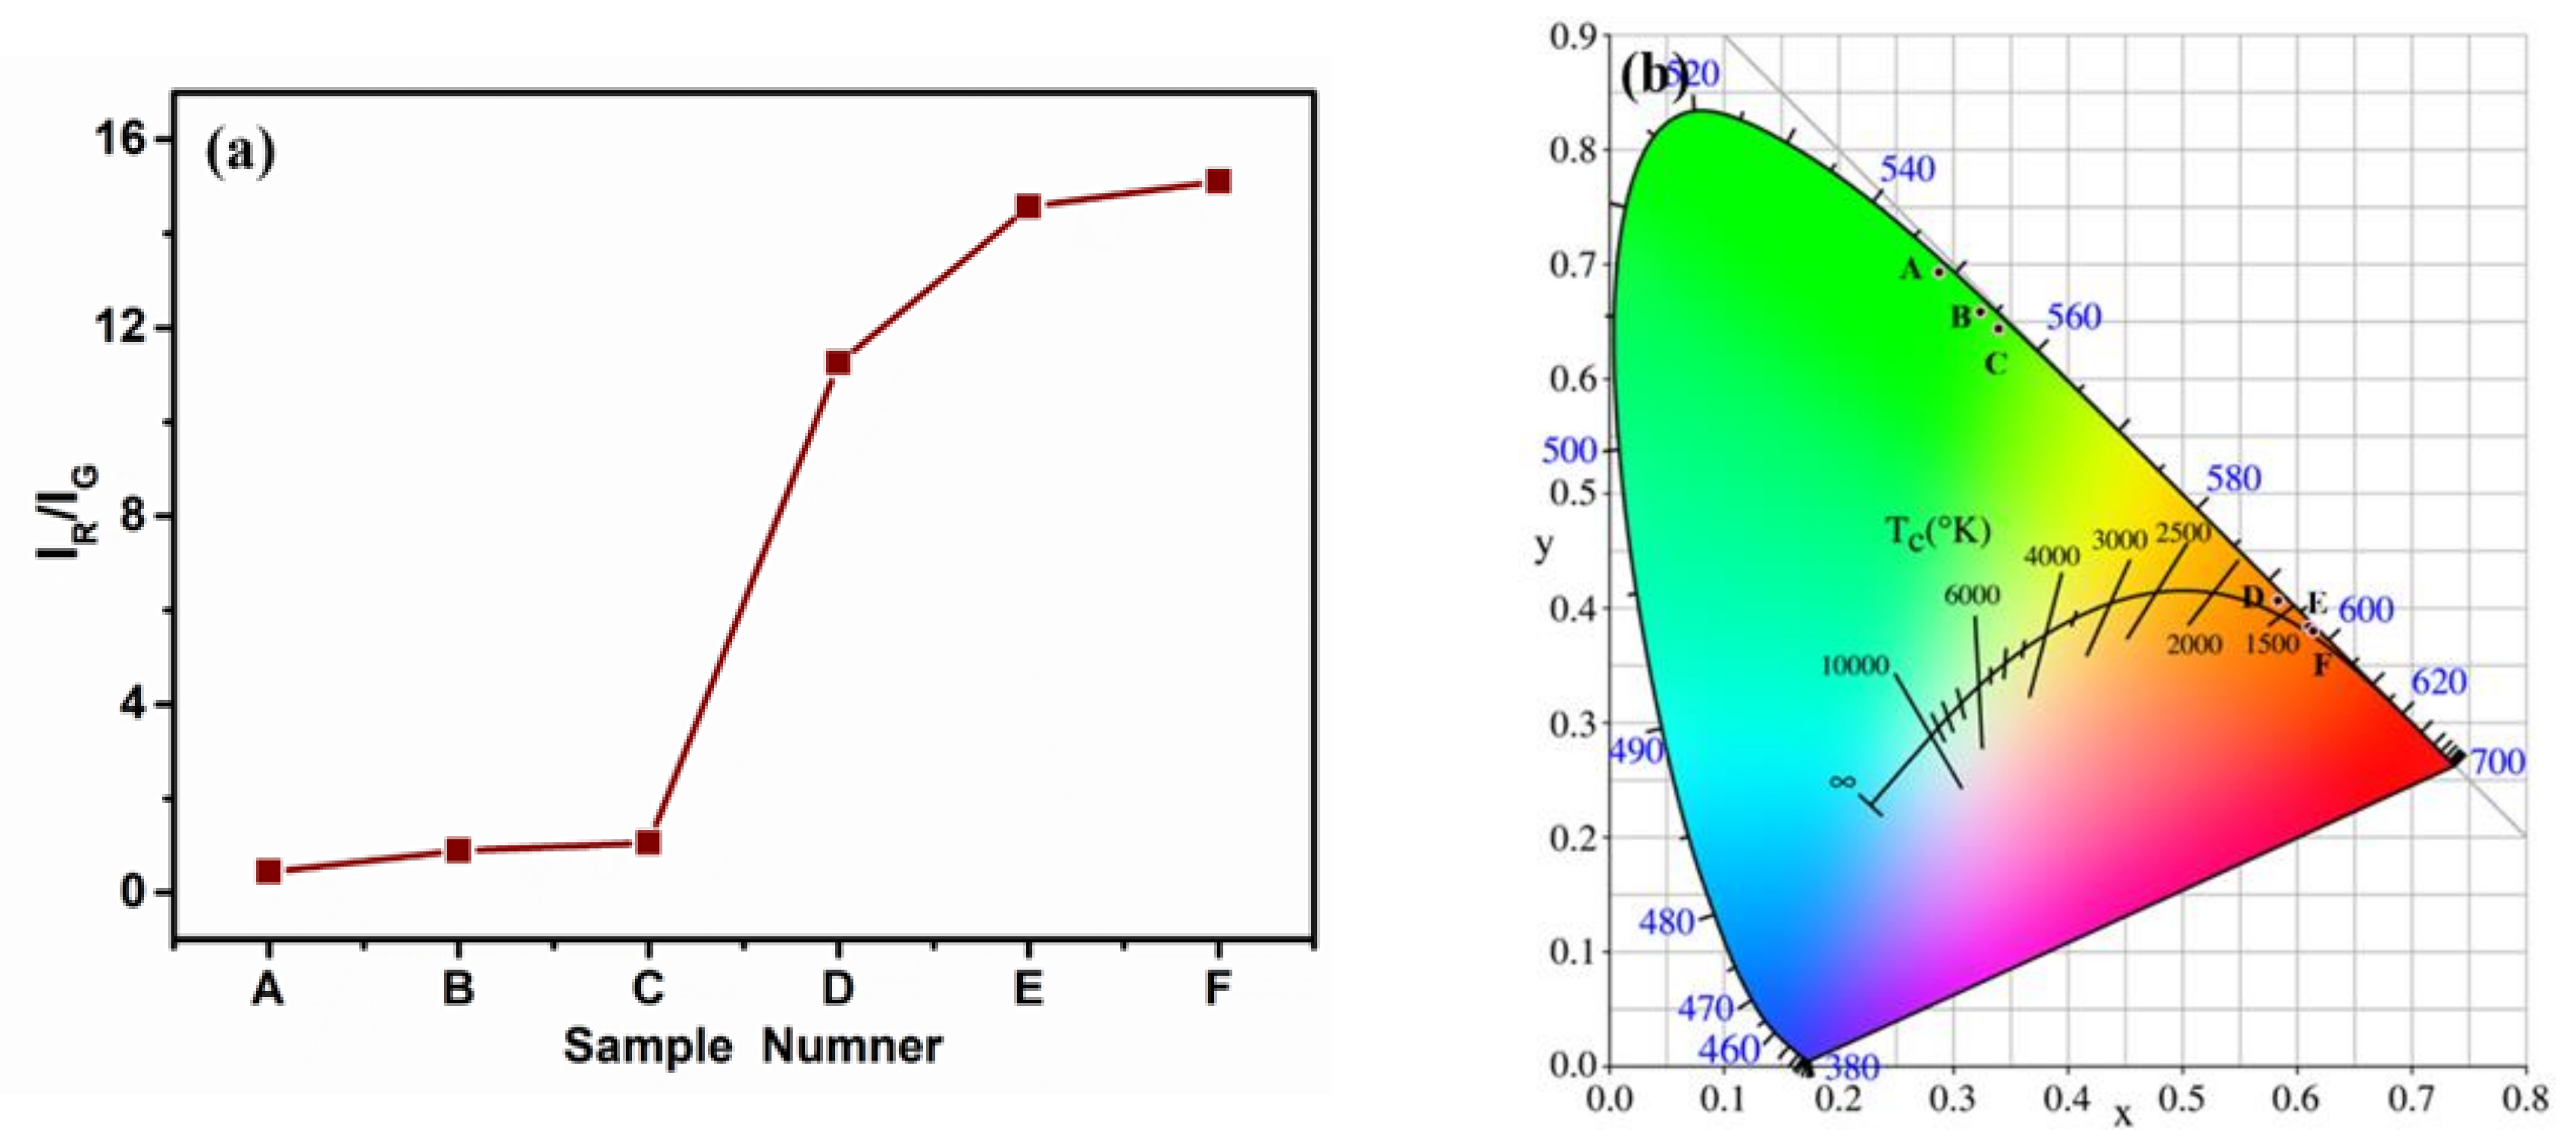
Figure 5a shows the ratios of red emission intensity IR to green emission intensity IG of Na3ScF6: 20% Yb3+, 2% Er3+ samples under different reaction conditions in the range of 500–750 nm. Figure 5b shows the CIE color chromaticity coordinates of Na3ScF6: 20% Yb3+, 2% Er3+ samples under different reaction conditions. When the temperature was 160 °C and the reaction time was 4 h, the size of the Na3ScF6: 20% Yb3+, 2% Er3+ samples was the smallest; at this point in time, the IR/IG ratio was about 0.435 (as shown in Figure 5a), and the sample produced green-upconversion luminescence, which could be shown by Figure 5b. When the temperature remained constant and the reaction time increased to 8 h, the size of the Na3ScF6: 20% Yb3+, 2% Er3+ samples increased slightly; at this point in time, the IR/IG ratio was about 0.885 (as shown in Figure 5a), and from this it can be seen that when the temperature was 160 °C, the size of the samples increased and the IR/IG ratio expanded by a factor of ~2 as the reaction time increased. The calculated CIE color coordinates were slightly offset away from the green area, as can be seen in Figure 5b. When the temperature was 180 °C and the reaction time was 4 h, the sample size increased but the surfaces attached to many small particles; at this time, the IR/IG ratio was ~1.053 (as shown in Figure 5a) and the calculated CIE color coordinates were further shifted away from the green area (as shown in Figure 5b). When the temperature was 180 °C and the reaction time was 8 h, the size of the samples increased, and the diameters of the small particles attached to the surfaces also increased; at this point, it was clear that the IR/IG ratio was ~11.248. Therefore, we found that when the temperature was 180 °C, with an increase in reaction time, the size of the samples increased and the IR/IG ratio expanded ~25 times, compared with 160 °C reaction temperature and the 4 h reaction time. It also can be seen from Figure 5a that when the reaction temperature was 180 °C and the reaction time was 8 h, the IR/IG ratio of the samples was about 10.6 times that when the reaction temperature was 180 °C and the reaction time was 4 h. As can be seen from Figure 5b, when the temperature was 180 °C and the reaction time was 8 h, the sample produced orange-upconversion luminescence and the calculated CIE color coordinates were located in the red region. As can be seen in Figure 5a, when the reaction temperature was 200 °C and the reaction time was 4 h or 8 h, the IR/IG ratios of the samples were ~14.571 and ~15.106, respectively. The calculated CIE color coordinates almost overlapped and were located in the red area. These two samples produced red-upconversion luminescence, and the results can be seen in Figure 5b.

4. Conclusions

In summary, a series of Na3ScF6: 20% Yb3+, 2% Er3+ samples were synthesized by a solvothermal method. The samples prepared by adjusting the reaction time and temperature can produce green- and red-upconversion luminescence when excited by 980 nm near-infrared light. In addition, we also found that by controlling the size of the samples we could adjust the IR/IG ratio. When the size of a sample was small, it exhibited green-upconversion luminescence, and when the size gradually increased, the upconversion luminescence gradually changed to red and the IR/IG ratio also gradually increased. These results have great potential for research on color displays and lighting.

Author Contributions

Y.Z. and X.L. conceived and designed the experiments; Y.Z. and X.L. performed the experiments; Y.Z., M.S. and Z.Q. analyzed the data and contributed reagents/materials/analysis tools. X.L. wrote the paper. All authors have read and agreed to the published version of the manuscript.

Funding

This research was funded by the Science and Technology Development Plan Project of Jilin Province of China No. YDZJ202201ZYTS425.

Institutional Review Board Statement

Not applicable.

Informed Consent Statement

Not applicable.

Data Availability Statement

Not applicable.

Conflicts of Interest

The authors declare no conflict of interest.

References

  1. Zhang, L.G.; Zhao, S.L.; Liang, Z.Q.; Zhang, J.J.; Zhu, W. The colour tuning of upconversion emission from green to red in NaScF4:Yb3+/Er3+ nanocrystals by adjusting the reaction time. J. Alloys Compd. 2017, 699, 1–6. [Google Scholar] [CrossRef]
  2. Anbharasi, L.; Gunaseelan, M.; Adusumalli, V.N.K.B.; Yamini, S.; Mahalingam, V.; Senthilselvan, J. Structural and Optical Studies of Strong Red Emitting NaxScF3+x: Yb3+, Er3+ Upconversion Nanoparticles. AIP Conf. Proc. 2019, 2115, 030179. [Google Scholar]
  3. Auzel, F. Upconversion and Anti-Stokes Processes with f and d Ions in Solids. Chem. Rev. 2004, 104, 139–173. [Google Scholar] [CrossRef] [PubMed]
  4. Ren, P.; Zheng, X.L.; Zhang, J.; Camillis, S.D.; Jia, J.G.; Wang, H.; Liao, X.Z.; Piper, J.A.; Lu, Y.Q. Quantifying the Influence of Inert Shell Coating on Luminescence Brightness of Lanthanide Upconversion Nanoparticles. ACS Photonics 2022, 9, 758–764. [Google Scholar] [CrossRef]
  5. Pei, W.B.; Wang, L.L.; Wu, J.S.; Chen, B.; Wei, W.; Lau, R.; Huang, L.; Huang, W. Controlled Synthesis of Uniform NaxScF3+x Nanopolyhedrons, Nanoplates, Nanorods and Nanospheres Using Solvents. Cryst. Growth Des. 2015, 15, 2988–2993. [Google Scholar] [CrossRef]
  6. Pang, M.; Zhai, X.S.; Feng, J.; Song, S.Y.; Deng, R.P.; Wang, Z.; Yao, S.; Ge, X.; Zhang, H.J. One-step synthesis of water-soluble hexagonal NaScF4:Yb/Er nanocrystals with intense red Emission. Dalton Trans. 2014, 43, 10202. [Google Scholar] [CrossRef]
  7. Ai, Y.; Tu, D.T.; Zheng, W.; Liu, Y.S.; Kong, J.T.; Hu, P.; Chen, Z.; Huang, M.D.; Chen, X.Y. Lanthanide-doped NaScF4 nanoprobes: Crystal structure, optical spectroscopy and biodetection. Nanoscale 2013, 5, 6430. [Google Scholar] [CrossRef]
  8. Yang, M.S.; Ren, J.J.; Zhang, R.L. Preparation, upconversion luminescence, and solid-state NMR studies of water-soluble hexagonal NaScF4:Yb/Er microcrystals. J. Alloys Compd. 2017, 714, 160–167. [Google Scholar] [CrossRef]
  9. Cheng, L.; Wang, C.; Liu, Z. Upconversion nanoparticles and their composite nanostructures for biomedical imaging and cancer therapy. Nanoscale 2013, 5, 23–37. [Google Scholar] [CrossRef]
  10. Li, L.L.; Wu, P.W.; Hwang, K.; Lu, Y. An Exceptionally Simple Strategy for DNA-Functionalized Up-Conversion Nanoparticles as Biocompatible Agents for Nanoassembly, DNA Delivery, and Imaging. J. Am. Chem. Soc. 2013, 135, 2411–2414. [Google Scholar] [CrossRef] [Green Version]
  11. Qiao, X.F.; Zhou, J.C.; Xiao, J.W.; Wang, Y.F.; Sun, L.D.; Yan, C.H. Triple-functional core–shell structured upconversion luminescent nanoparticles covalently grafted with photosensitizer for luminescent, magnetic resonance imaging and photodynamic therapy in vitro. Nanoscale 2012, 4, 4611–4623. [Google Scholar] [CrossRef] [Green Version]
  12. Wang, F.; Banerjee, D.; Liu, Y.S.; Chen, X.Y.; Liu, X.G. Upconversion nanoparticles in biological labeling, imaging, and therapy. Analyst 2010, 135, 1839–1854. [Google Scholar] [CrossRef]
  13. Chen, X.L.; Chen, X.Y.; Zhai, X.S.; Li, Y.; Zhao, W.; Sun, W.; Zhang, Q.F.; Feng, J. Remarkably Enhanced Red Upconversion Emission in β-NaLuF4:Er,Tm Microcrystals via Ion Exchange. Inorg. Chem. 2022, 61, 10713–10721. [Google Scholar] [CrossRef]
  14. Zhai, X.S.; Chen, X.L.; Wang, S.Q.; Sun, W.; Du, J.Z.; Zhang, C.C.; Ren, T.; Zhang, Q.; Feng, J. Synthesis of small-sized hexagonal NaREF4 (RE = Yb, Lu) nanocrystals through accelerating phase transformation. J. Lumin. 2022, 244, 118694. [Google Scholar] [CrossRef]
  15. Zheng, X.L.; Zhu, X.J.; Lu, Y.Q.; Zhao, J.B.; Feng, W.; Jia, G.H.; Wang, F.; Li, F.Y.; Jin, D.Y. High-contrast visualization of upconversion luminescence in mice using time-gating approach. Anal. Chem. 2016, 88, 3449–3454. [Google Scholar] [CrossRef] [Green Version]
  16. Jakoby, M.; Beil, C.; Nazari, P.; Richards, B.S.; Seitz, M.; Turshatov, A.; Howard, I.A. Rare-earth coordination polymers with multimodal luminescence on the nano-, micro-, and milli-second time scales. iScience 2021, 24, 102207. [Google Scholar] [CrossRef]
  17. Zhao, Y.; Yang, X.G.; Lu, X.M.; Yang, C.D.; Fan, N.N.; Yang, Z.T.; Wang, L.Y.; Ma, L.F. {Zn6} Cluster Based Metal–Organic Framework with Enhanced Room-Temperature Phosphorescence and Optoelectronic Performances. Inorg. Chem. 2019, 58, 6215–6221. [Google Scholar] [CrossRef]
  18. Del-Castillo, J.; Méndez-Ramos, J.; Acosta-Mora, P.; Yanes, A.C. Upconversion photonics in solvothermal Sr2YbF7: Tm3+@Sr2YF7 core-shell nanocrystals for enhanced photocatalytic degradation of pollutants. J. Lumin. 2022, 241, 118490. [Google Scholar] [CrossRef]
  19. Liu, Y.; Li, Z.Y.; Li, G.H.; Tang, L. Friction and wear behavior of Ni-based alloy coatings with different amount of WC–TiC ceramic particles. J. Mater. Sci. 2023, 58, 1116–1126. [Google Scholar] [CrossRef]
  20. Yin, W.Y.; Esposito, D.V.; Yang, S.Z.; Ni, C.Y.; Chen, J.G.G.; Zhao, G.L.; Zhang, Z.J.; Hu, C.W.; Cao, M.H.; Wei, B. Controlling Novel Red-Light Emissions by Doping In2O3 Nano/Microstructures with Interstitial Nitrogen. Phys. Chem. C 2010, 114, 13234–13240. [Google Scholar] [CrossRef]
  21. Yin, W.Y.; Zhao, L.N.; Zhou, L.J.; Gu, Z.J.; Liu, X.X.; Tian, G.; Jin, S.; Yan, L.; Ren, W.L.; Xing, G.M.; et al. Enhanced Red Emission from GdF3:Yb3+,Er3+ Upconversion Nanocrystals by Li+ Doping and Their Application for Bioimaging. Chem. Eur. J. 2012, 18, 9239. [Google Scholar] [CrossRef] [PubMed]
  22. Niu, W.B.; Wu, S.L.; Zhang, S.F. A facile and general approach for the multicolor tuning of lanthanide-ion doped NaYF4 upconversion nanoparticles within a fixed composition. J. Mater. Chem. 2010, 20, 9113–9117. [Google Scholar] [CrossRef]
  23. Dong, H.; Sun, L.D.; Wang, Y.F.; Ke, J.; Si, R.; Xiao, J.W.; Lv, G.M.; Shi, S.; Yan, C.H. Efficient Tailoring of Upconversion Selectivity by Engineering Local Structure of Lanthanides in NaxREF3+x Nanocrystals. J. Am. Chem. Soc. 2015, 137, 6569–6576. [Google Scholar] [CrossRef] [PubMed]
  24. Tian, G.; Gu, Z.J.; Zhou, L.J.; Yin, W.Y.; Liu, X.X.; Yan, L.; Jin, S.; Ren, W.L.; Xing, G.M.; Li, S.J.; et al. Mn2+ Dopant-Controlled Synthesis of NaYF4: Yb/Er Upconversion Nanoparticles for in vivo Imaging and Drug Delivery. Adv. Mater. 2012, 24, 1226–1231. [Google Scholar] [CrossRef]
  25. Mao, Y.N.; Xian, P.F.; Jiang, L.; Hu, S.S.; Tang, J.F.; Yang, J. Temperature sensing performance based on up-conversion luminescence in hydrothermally synthesized Yb3+, Er3+ co-doped NaScF4 phosphors. Dalton Trans. 2020, 49, 7862–7871. [Google Scholar] [CrossRef]
  26. He, E.J.; Chen, S.F.; Zhang, M.L. Simultaneous morphology evolution and upconversion emission tuning of single Y-based fluoride microcrystal induced by Sc3+ co-doping. Mater. Res. Bull. 2017, 87, 61–71. [Google Scholar] [CrossRef] [Green Version]
  27. Zhao, B.; Yang, J.; Shen, D.Y.; Hu, S.S.; Zhou, X.J.; Tang, J.F. Lanthanide-doped Sr2ScF7 nanocrystals: Controllable hydrothermal synthesis, growing mechanism and tunable up/down conversion luminescence properties. J. Mater. Chem. C 2017, 5, 3264–3275. [Google Scholar] [CrossRef]
  28. Teng, X.; Zhu, Y.H.; Wei, W.; Wang, S.C.; Huang, J.F.; Naccache, R.; Hu, W.B.; Tok, A.I.Y.; Han, Y.; Zhang, Q.C.; et al. Lanthanide-Doped NaxScF3+x Nanocrystals: Crystal Structure Evolution and Multicolor Tuning. J. Am. Chem. Soc. 2012, 134, 8340–8343. [Google Scholar] [CrossRef]
  29. Liang, Z.Q.; Zhao, S.L.; Xu, Z.; Qia, B.; Yang, Y.X.; Zhu, W.; Xu, X.R. Controllable synthesis of tetragonal LiScF4:Yb3+, Er3+ nanocrystals and its upconversion photoluminescence properties Lithium scandium fluoride nanocrystals. Opt. Mater. 2016, 62, 255–260. [Google Scholar] [CrossRef]
  30. Chatterjeea, D.K.; Rufaihaha, A.J.; Zhang, Y. Upconversion fluorescence imaging of cells and small animals using lanthanide doped nanocrystals. Biomaterials 2008, 29, 937–943. [Google Scholar] [CrossRef]
  31. Ding, Y.J.; Teng, X.; Zhu, H.; Wang, L.L.; Pei, W.B.; Zhu, J.J.; Huang, L.; Huang, W. Orthorhombic KSc2F7:Yb/Er Nanorods: Controlled Synthesis and Strong Red Upconversion Emission. Nanoscale 2013, 5, 11928–11932. [Google Scholar] [CrossRef]
  32. Shan, J.N.; Ju, Y.G. A single-step synthesis and the kinetic mechanism for monodisperse and hexagonal-phase NaYF4: Yb, Er upconversion nanophosphors. Nanotechnology 2009, 20, 275603. [Google Scholar] [CrossRef] [Green Version]
  33. Zhai, X.s.; Liu, S.S.; Zhang, Y.L.; Qin, G.S.; Qin, W.P. Controlled synthesis of ultrasmall hexagonal NaTm0.02Lu0.98-xYbxF4 nanocrystals with enhanced upconversion luminescence. J. Mater. Chem. C 2014, 2, 2037–2044. [Google Scholar] [CrossRef]
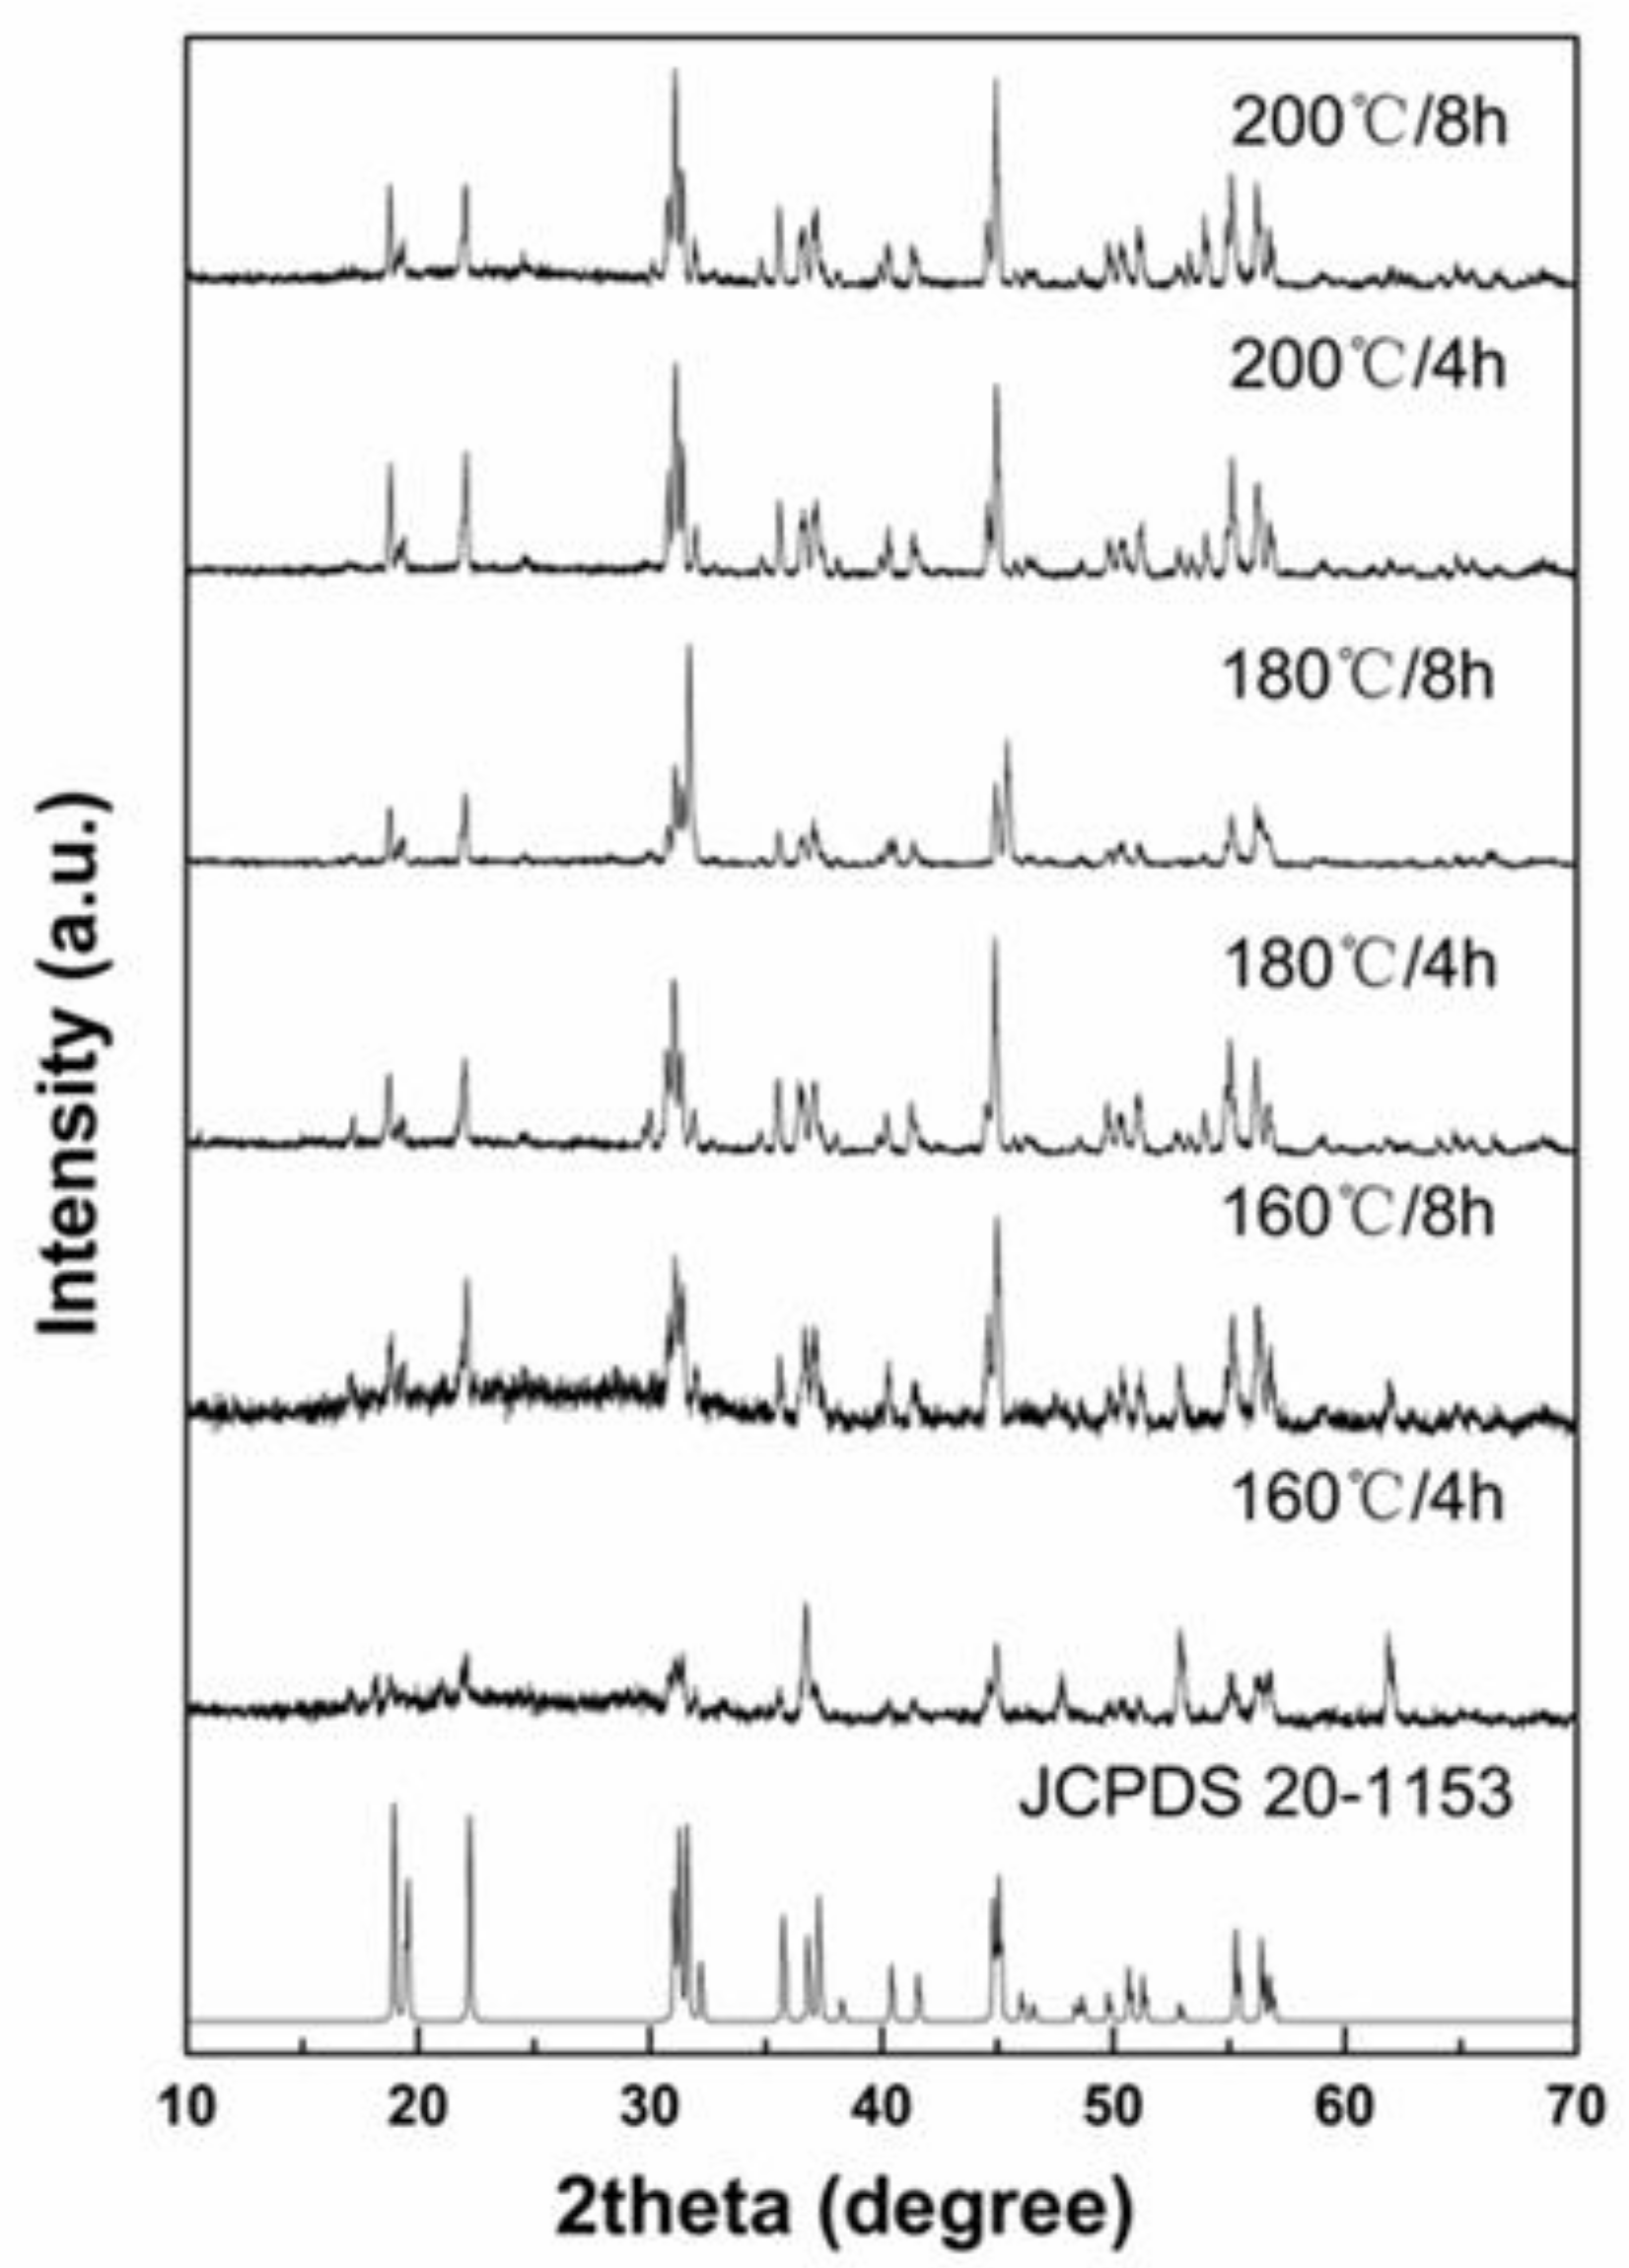
Figure 1. The XRD standard card of Na3ScF6 (JCPDS-20-1153) and the XRD patterns of Na3ScF6: 20% Yb3+, 2% Er3+ samples prepared with different temperatures and reaction times.
Materials 16 02247 g001
Figure 2. SEM images of Na3ScF6: 20% Yb3+, 2% Er3+ particles under different reaction conditions: (a) 160 °C, 4 h; (b) 160 °C, 8 h; (c) 180 °C, 4 h; (d) 180 °C, 8 h; (e) 200 °C, 4 h; and (f) 200 °C, 8 h. The scale bars in the figures represent 1 μm.
Materials 16 02247 g002
Figure 3. Schematic diagram of the energy-transfer process of the Na3ScF6: Yb3+, Er3+ system.
Materials 16 02247 g003
Figure 4. (a) Under the excitation of a 980 nm laser, the fluorescence spectra of Na3ScF6: 20% Yb3+, 2% Er3+ particles under different reaction conditions. (b) The ratio of green emission intensity IG and red emission intensity IR to the total integrated intensity I(G+R) of sample A (160 °C, 4 h), sample B (160 °C, 8 h), sample C (180 °C, 4 h), sample D (180 °C, 8 h), sample E (200 °C, 4 h) and sample F (200 °C, 8 h) under different reaction conditions in the range of 500–750 nm.
Materials 16 02247 g004
Figure 5. (a) The ratio of red emission intensity IR to green emission intensity IG of sample A (160 °C, 4 h), sample B (160 °C, 8 h), sample C (180 °C, 4 h), sample D (180 °C, 8 h), sample E (200 °C, 4 h) and sample F (200 °C, 8 h) under different reaction conditions in the range of 500–750 nm. (b) CIE color chromaticity coordinates of Na3ScF6: 20% Yb3+, 2% Er3+ particles under different reaction conditions: sample A (160 °C, 4 h), sample B (160 °C, 8 h), sample C (180 °C, 4 h), sample D (180 °C, 8 h), sample E (200 °C, 4 h) and sample F (200 °C, 8 h).
Materials 16 02247 g005
Disclaimer/Publisher’s Note: The statements, opinions and data contained in all publications are solely those of the individual author(s) and contributor(s) and not of MDPI and/or the editor(s). MDPI and/or the editor(s) disclaim responsibility for any injury to people or property resulting from any ideas, methods, instructions or products referred to in the content.