
Zinc Oxide Films Fabricated via Sol-Gel Method and Dip-Coating Technique–Effect of Sol Aging on Optical Properties, Morphology and Photocatalytic Activity

 , ,
, ,  ,
,  ,
, 
Abstract
1. Introduction
2. Materials and Methods
2.1. Materials
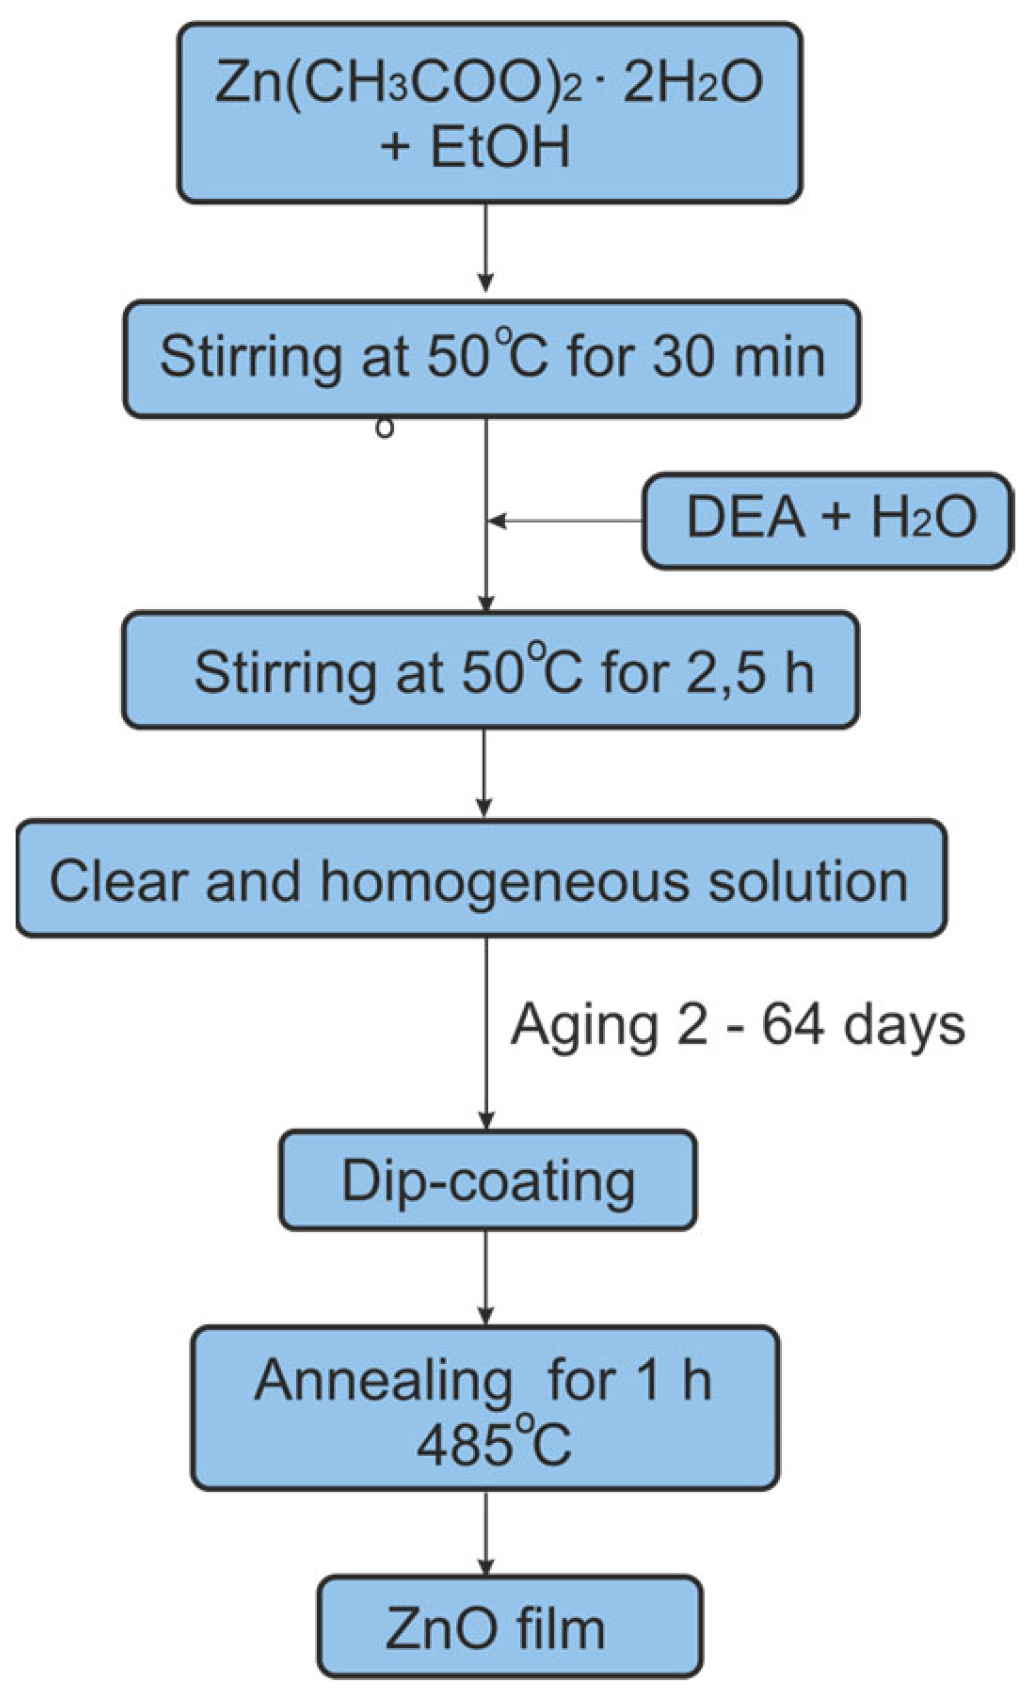
2.2. Methods
3. Results and Discussion
3.1. Sol Properties
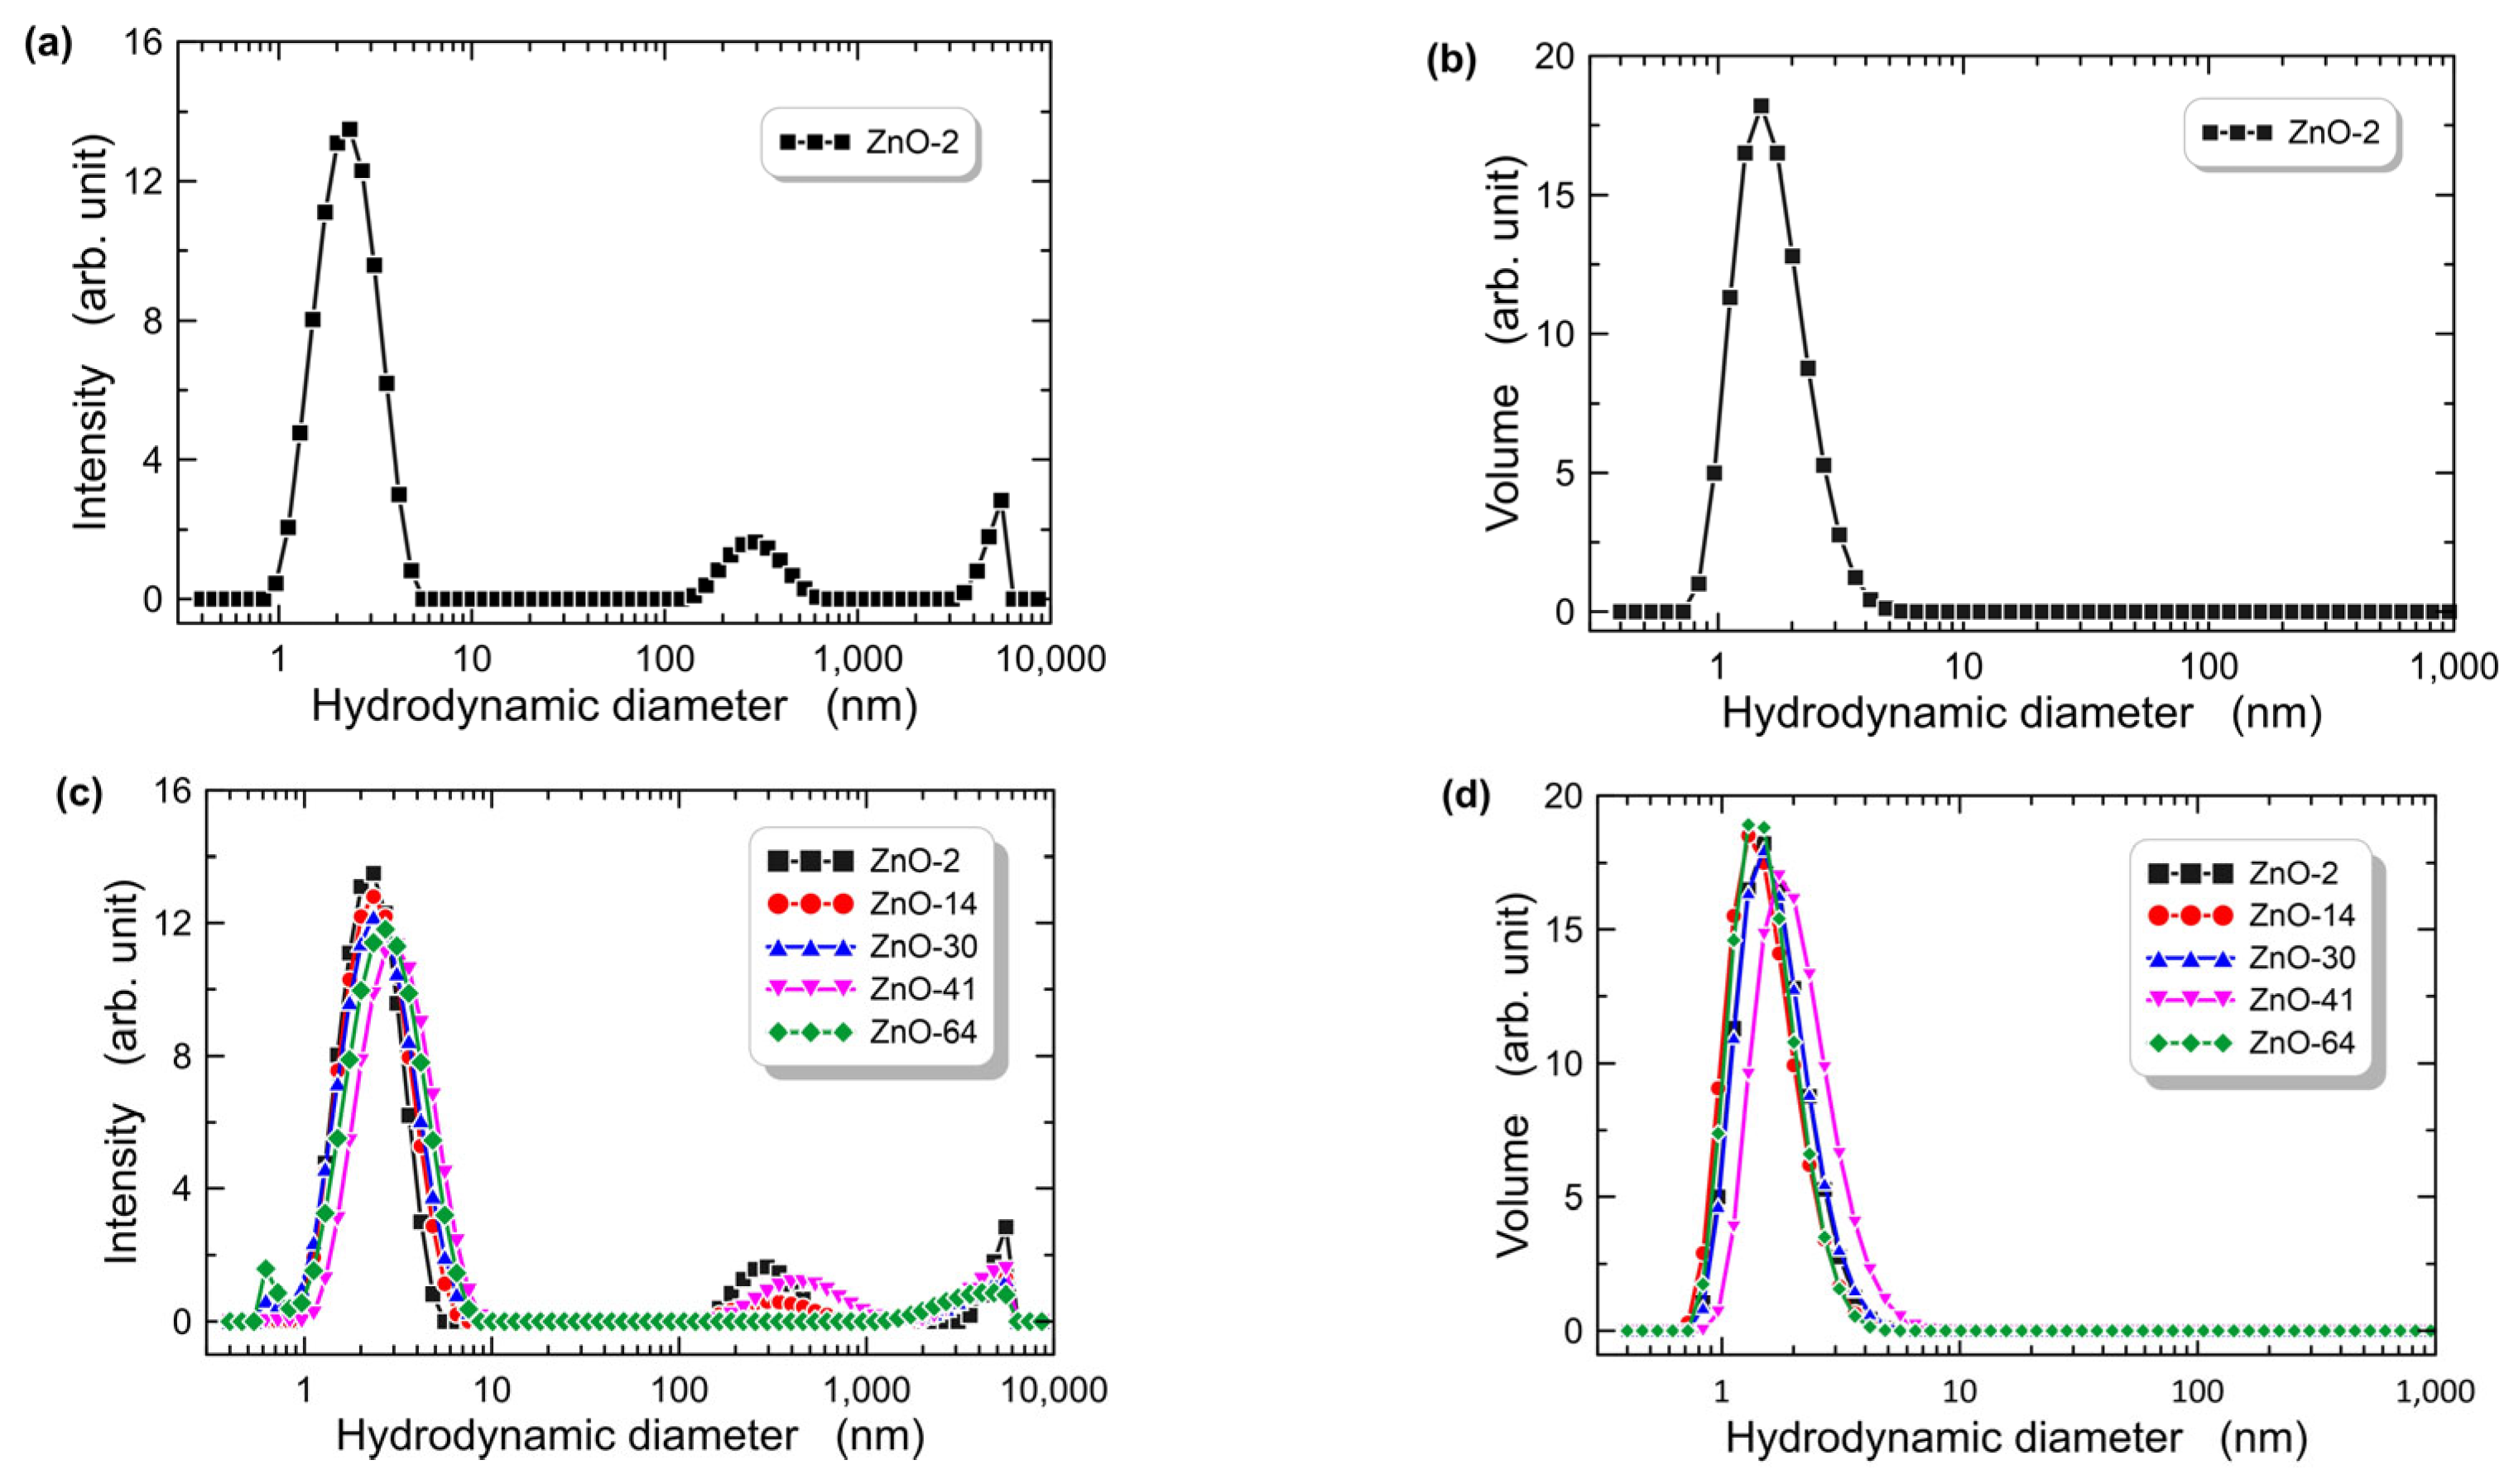
3.1.1. DLS
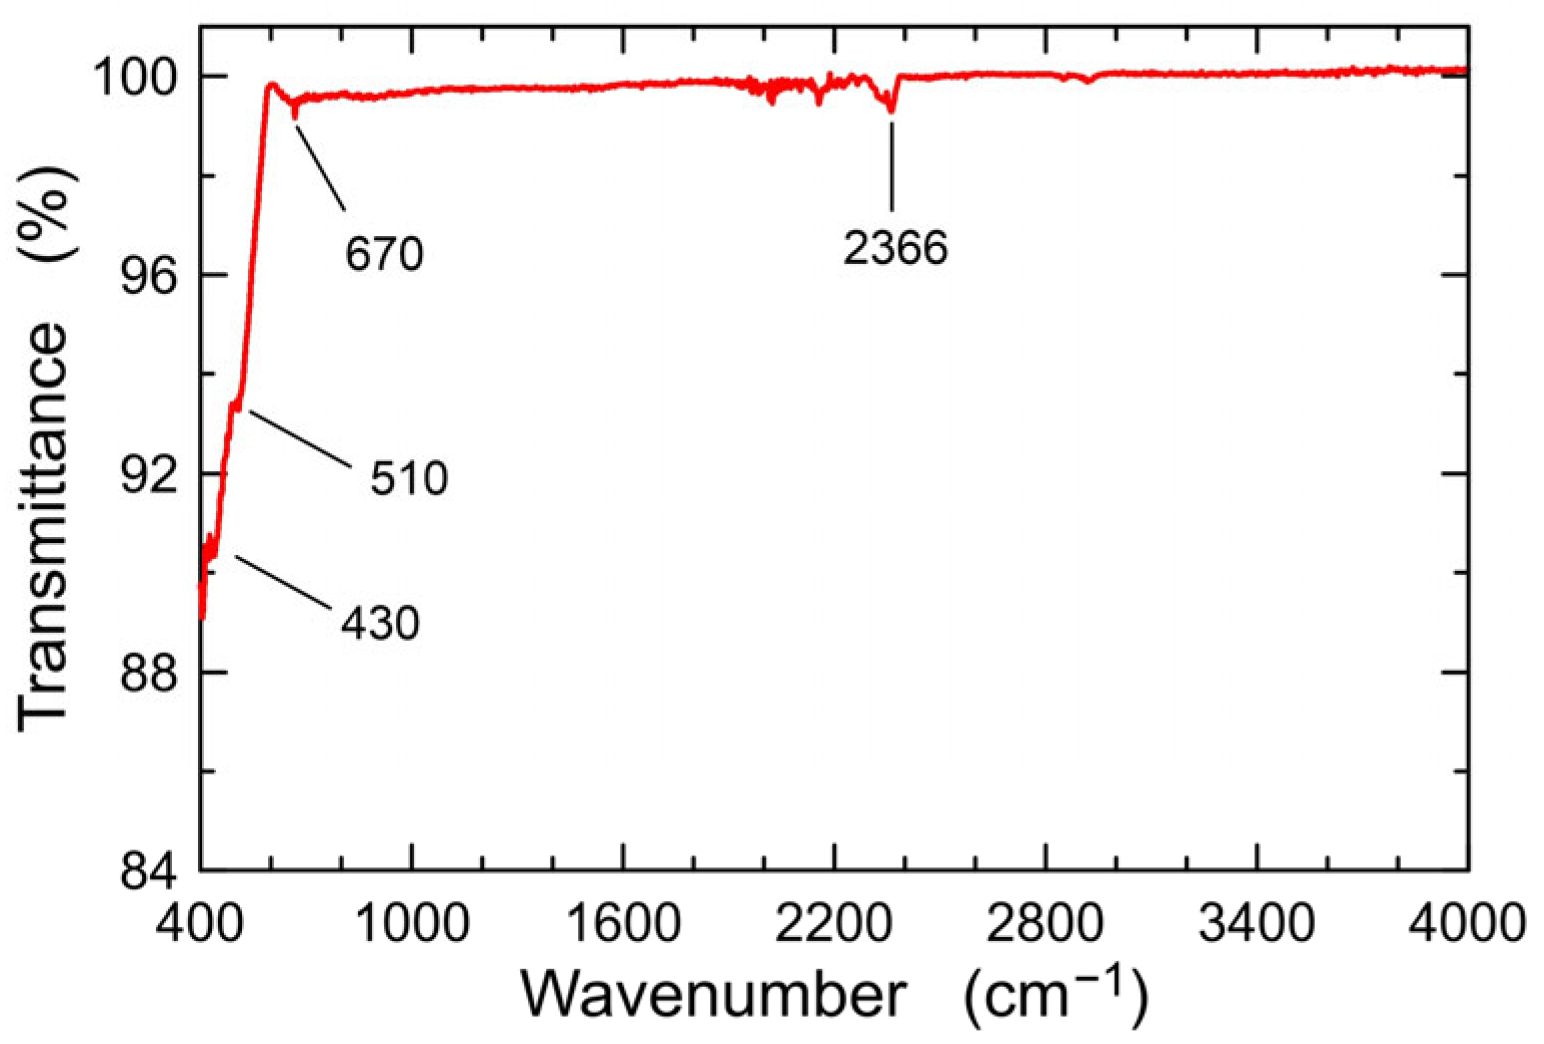
3.1.2. FTIR
3.2. ZnO Layers
3.2.1. Optical Properties
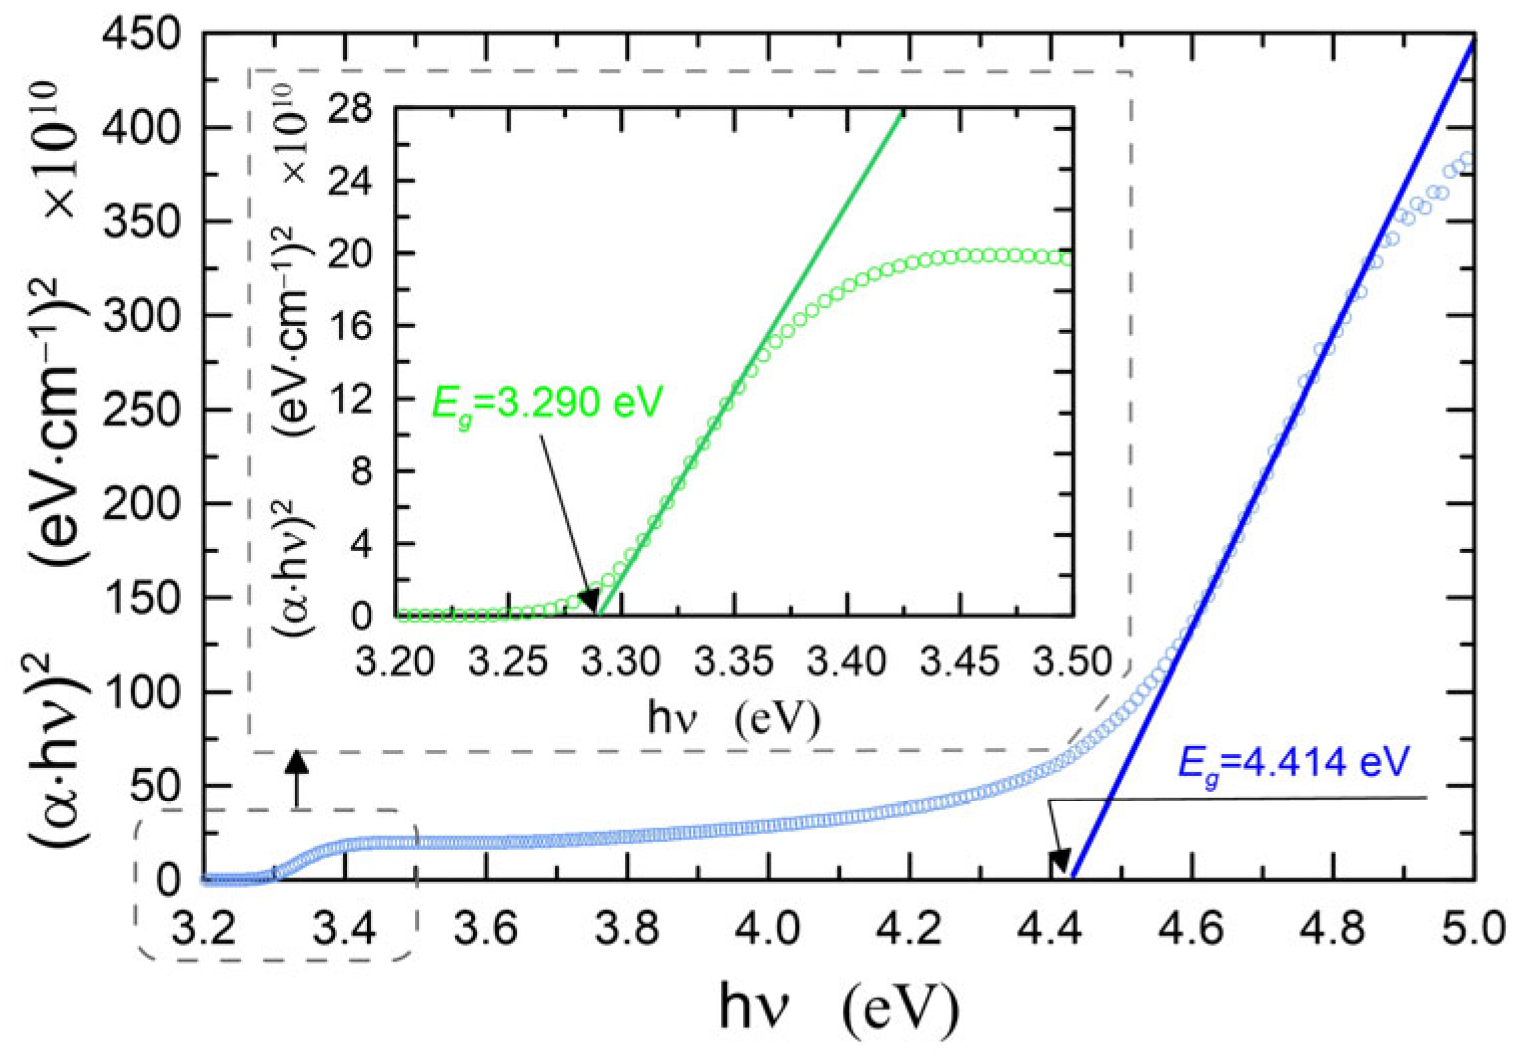
3.2.2. Quantum Size Effect
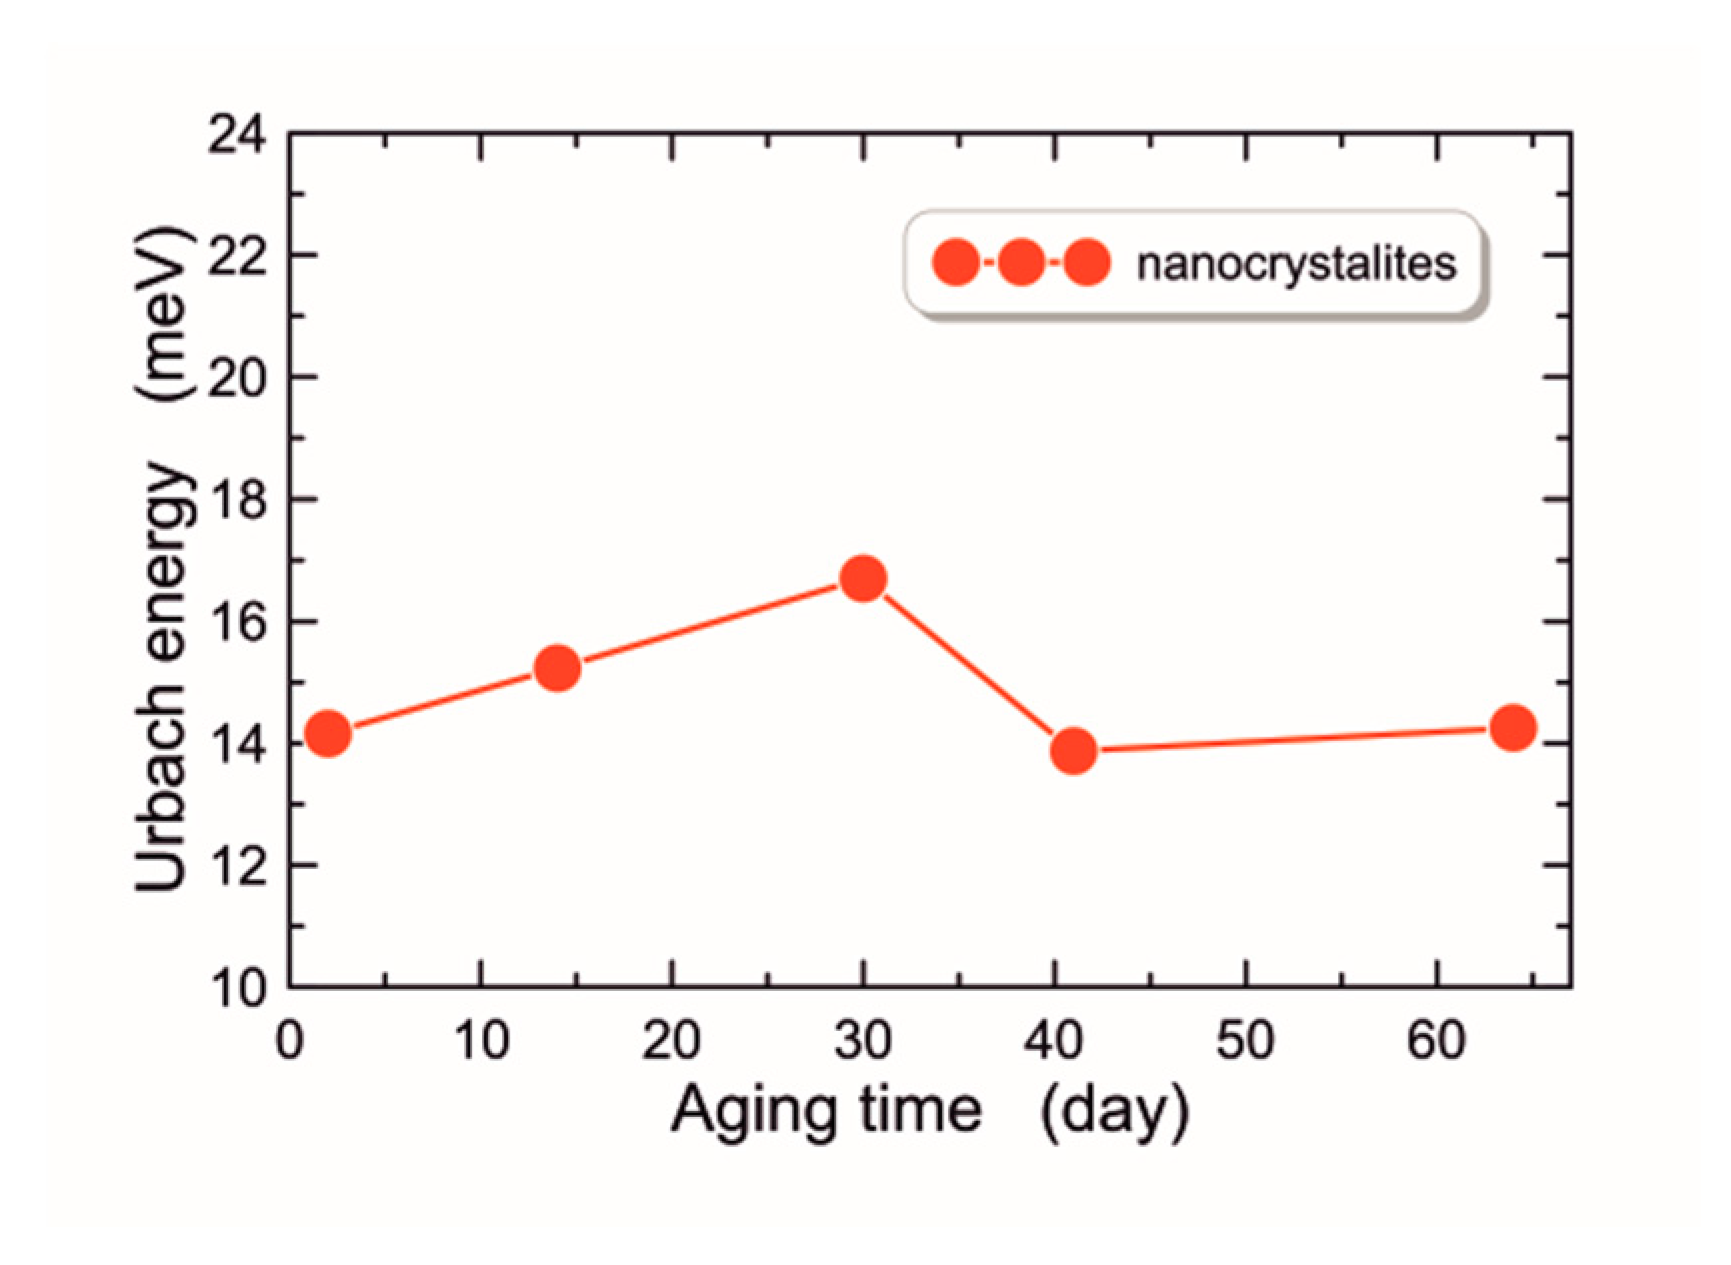
3.2.3. Urbach Energy
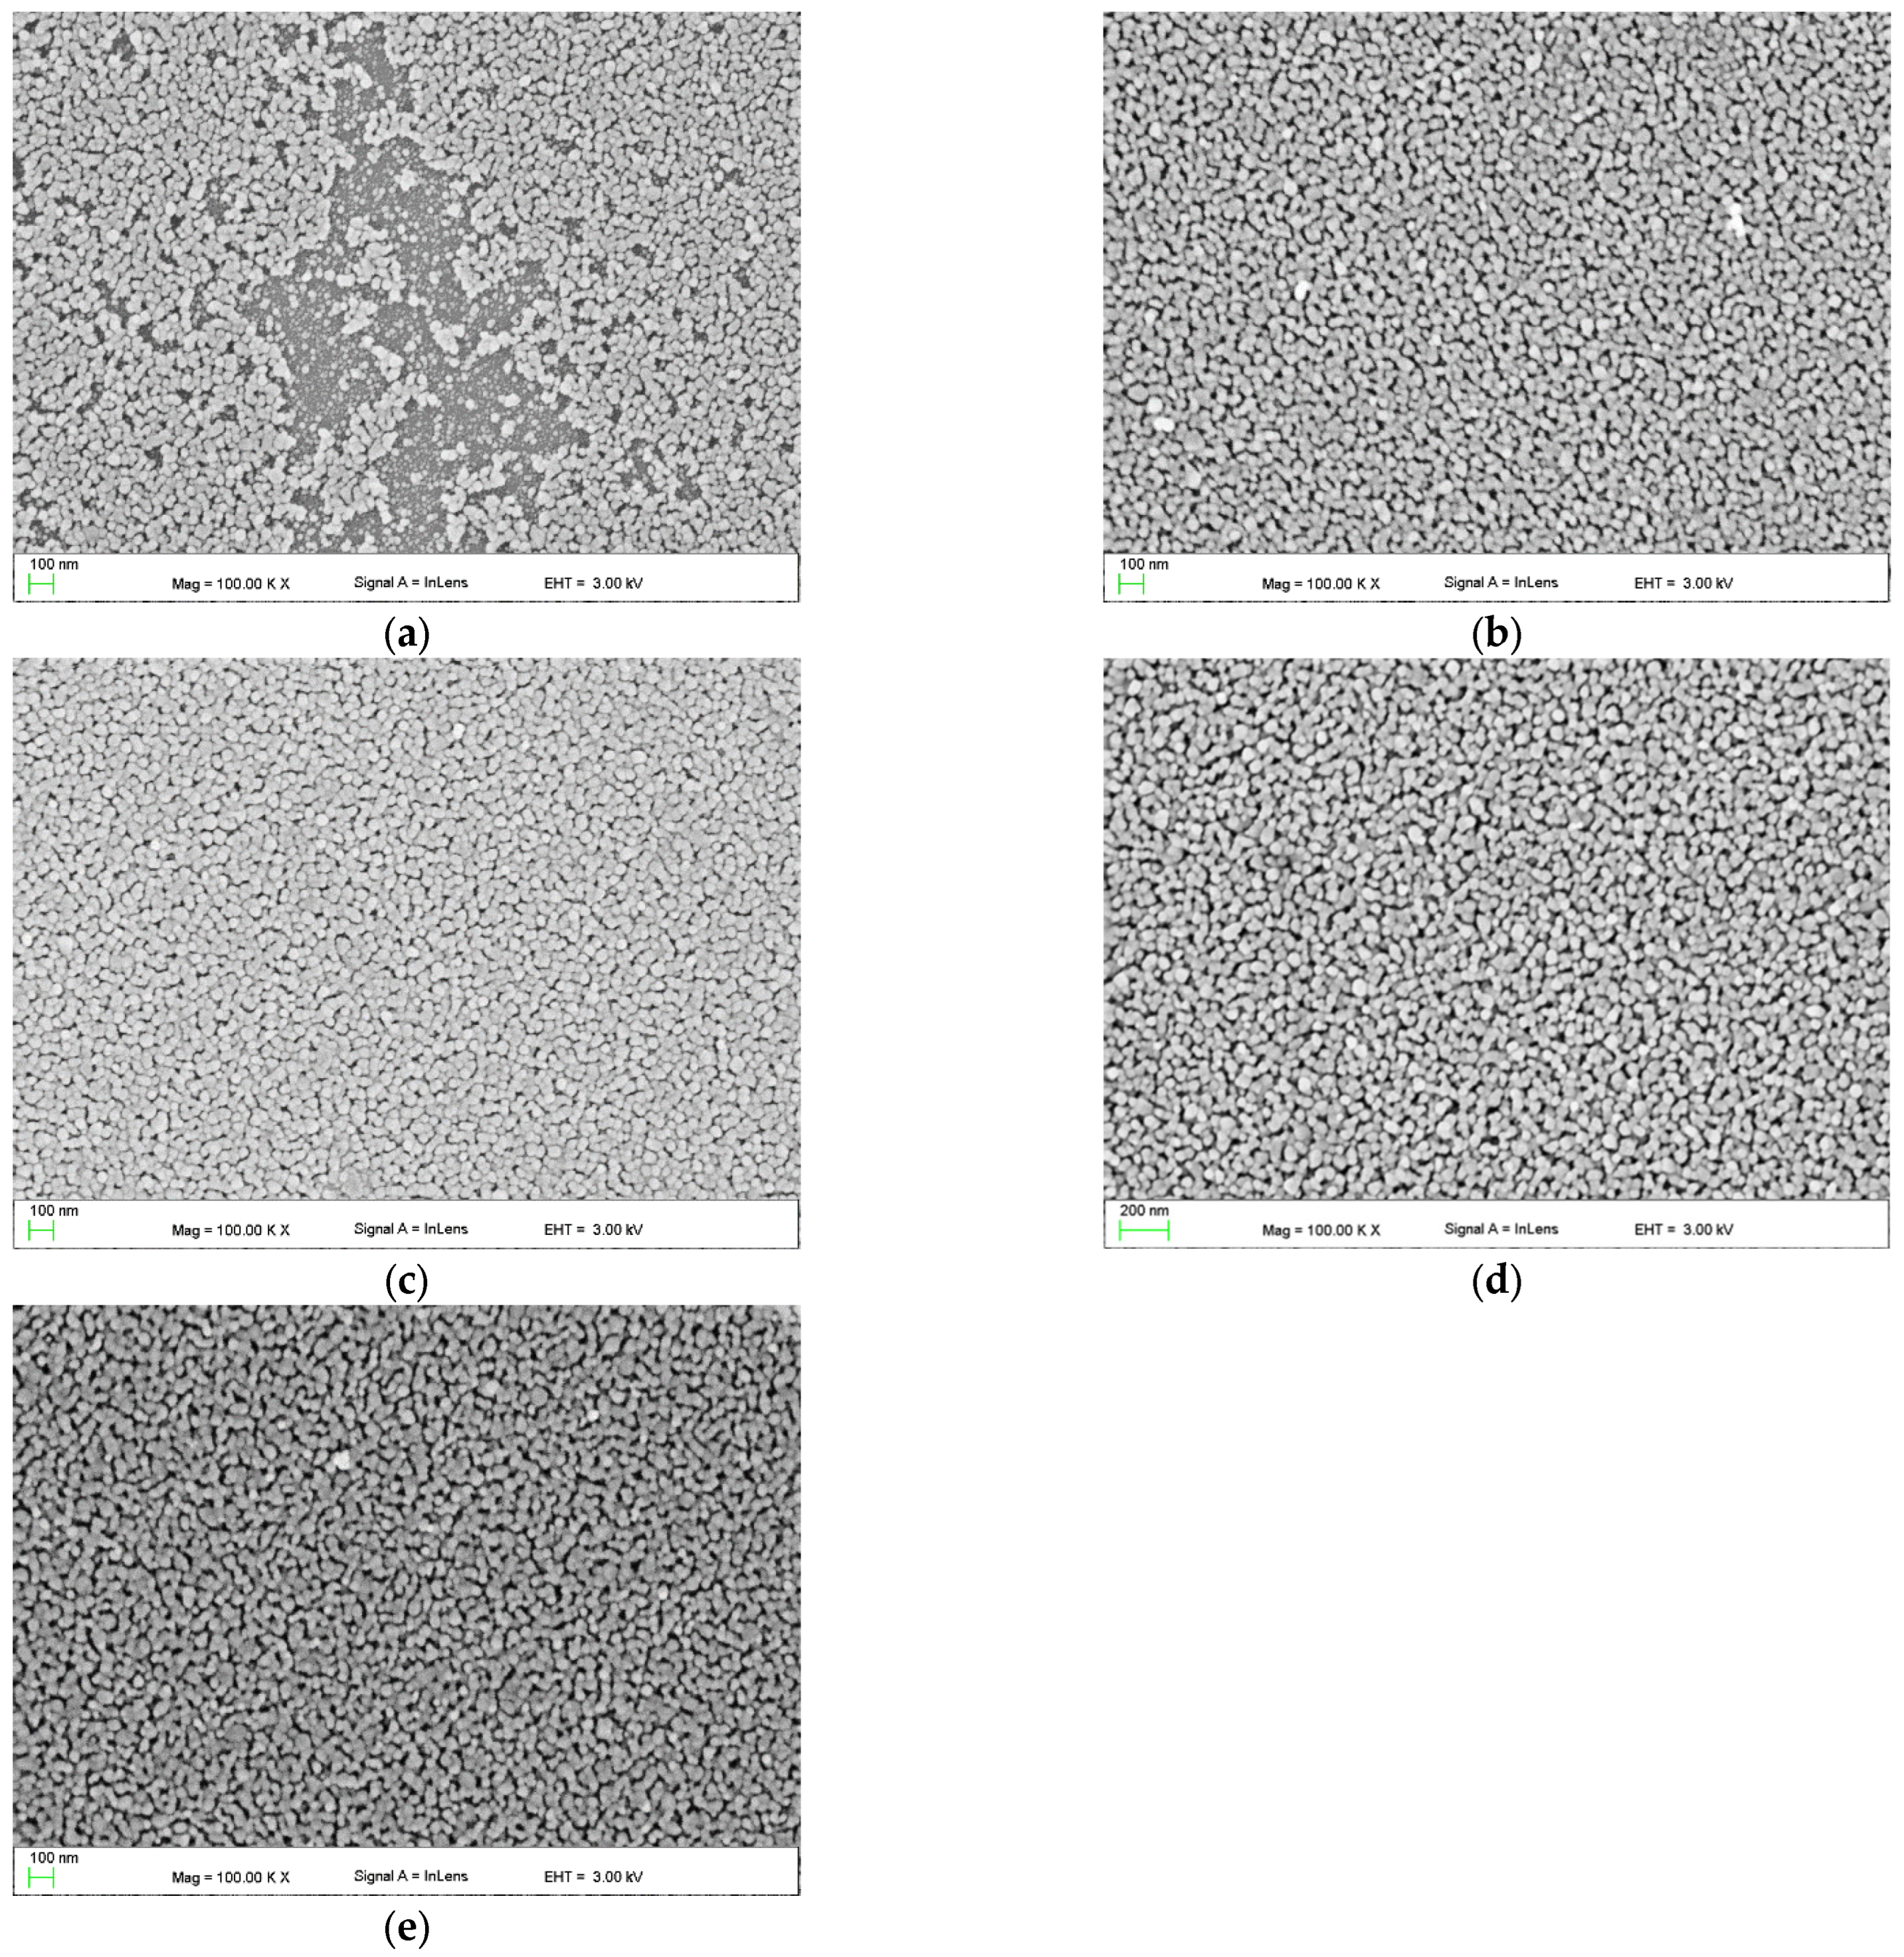
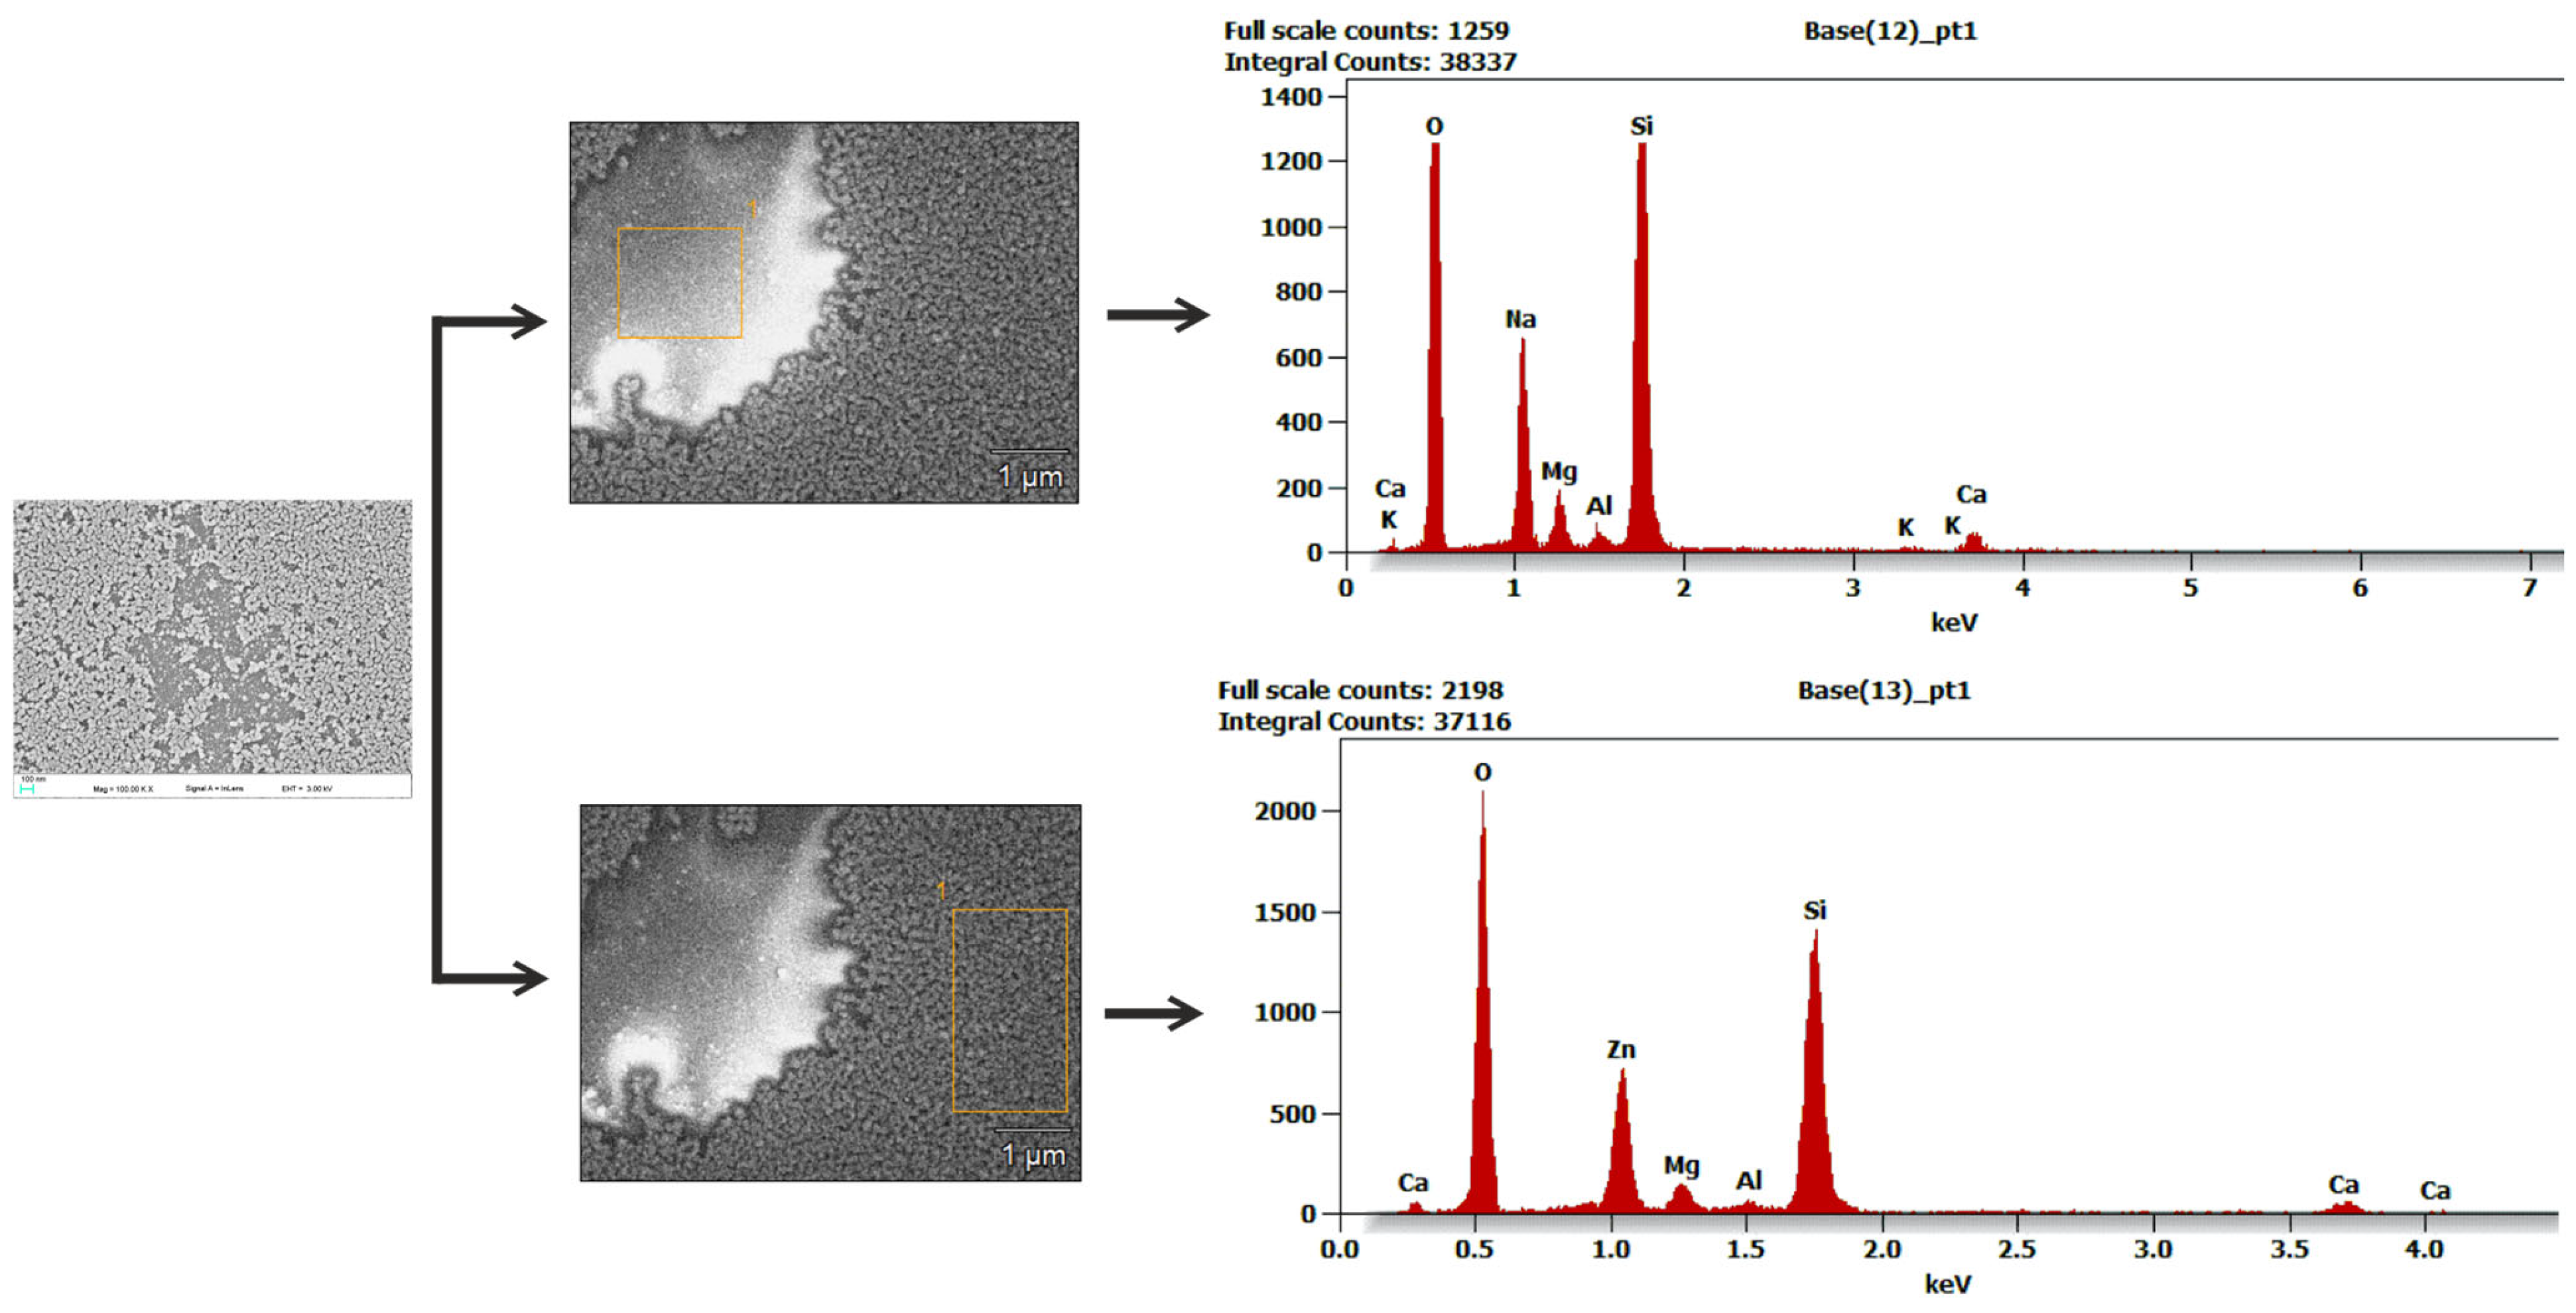
3.2.4. SEM and EDS
3.2.5. AFM
3.2.6. Contact Angles
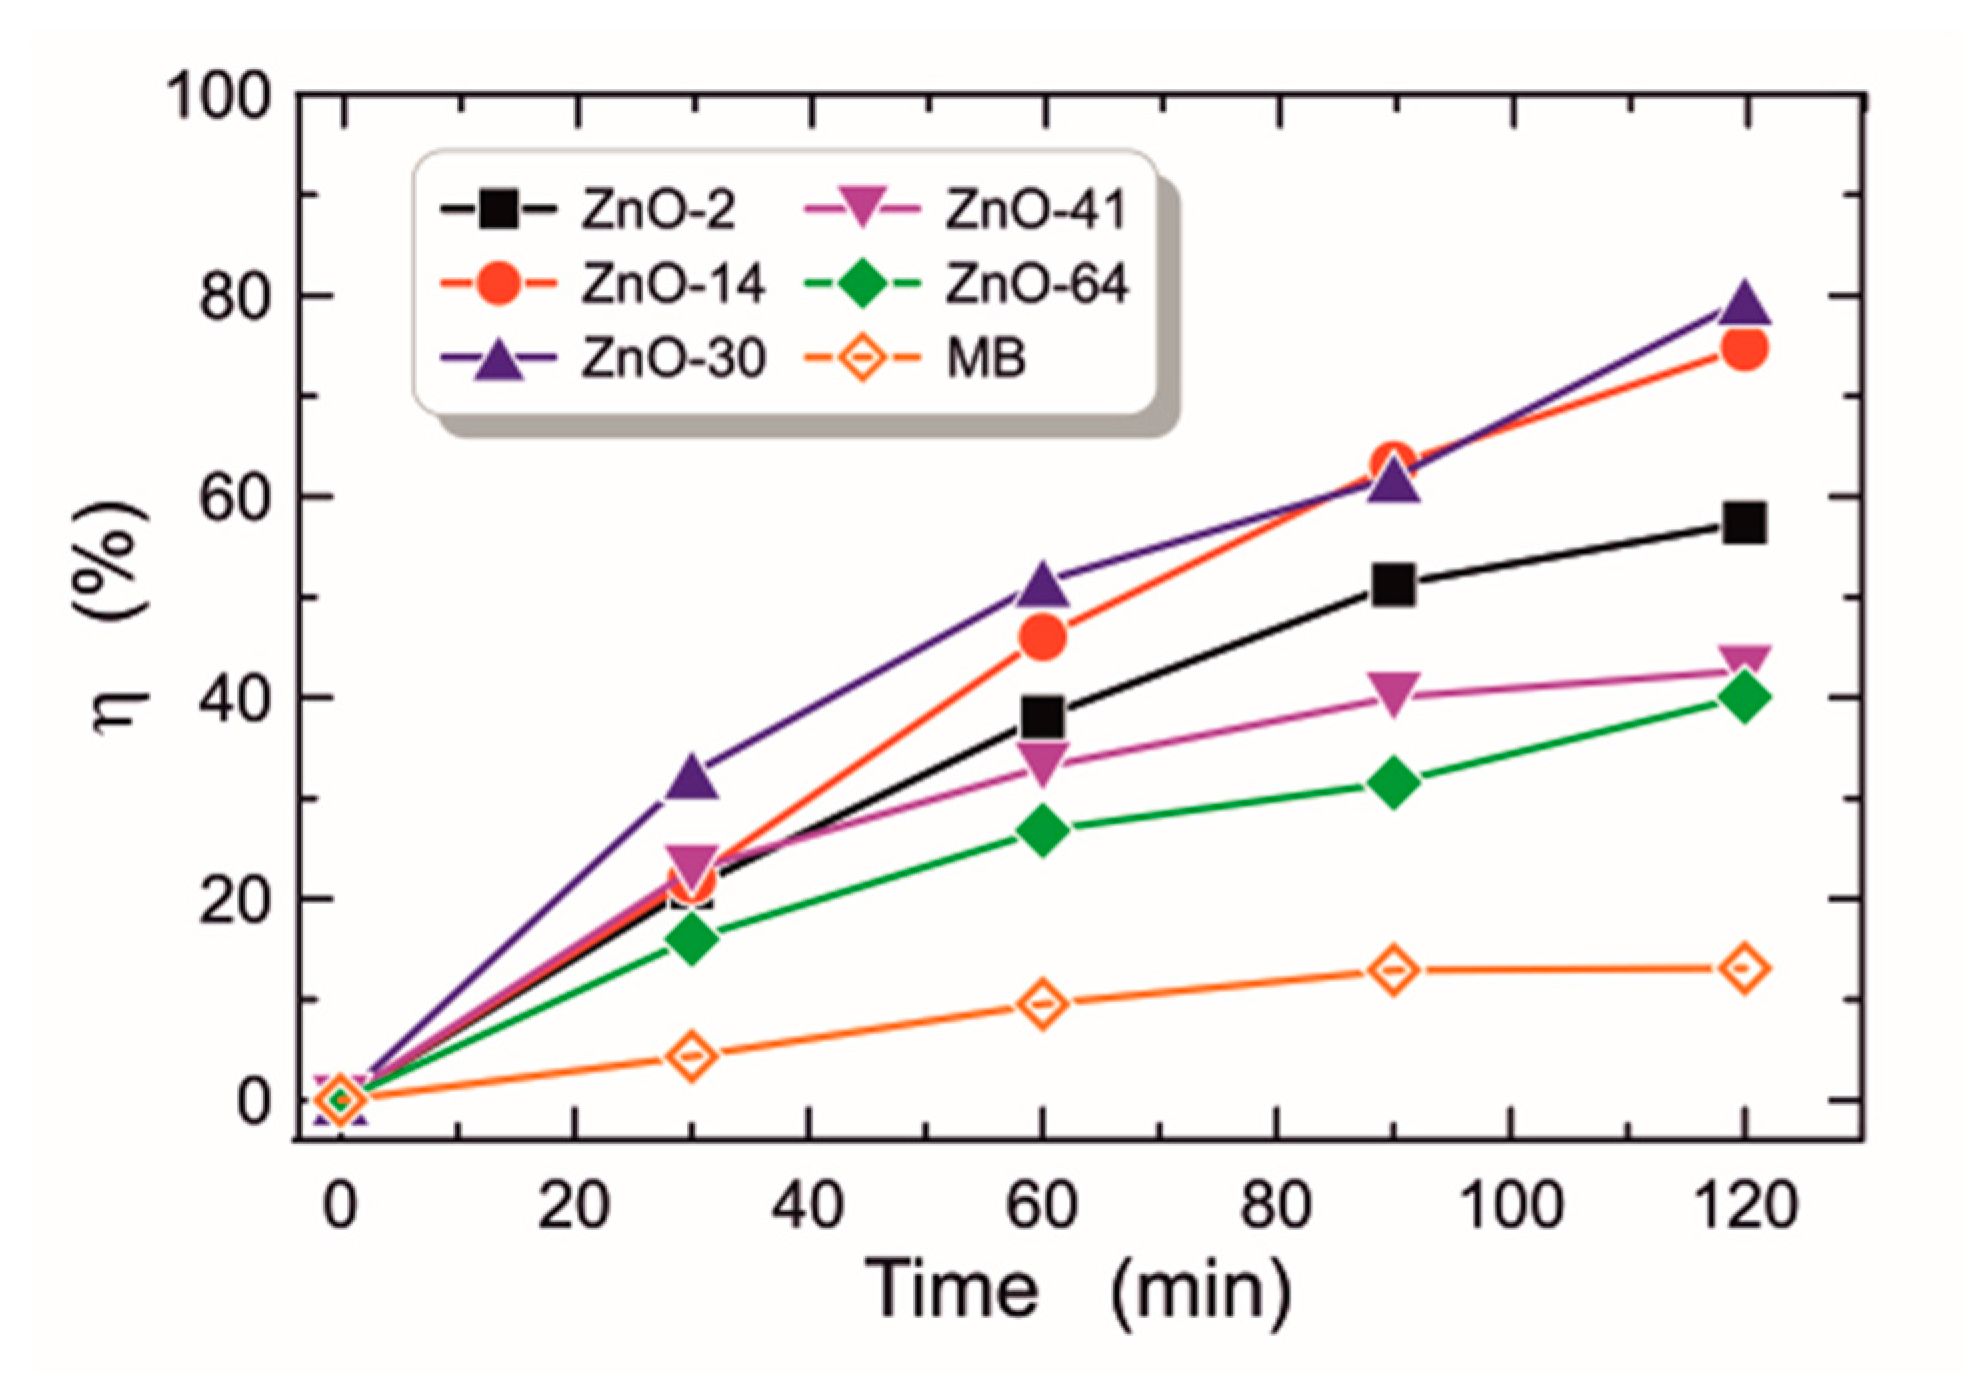
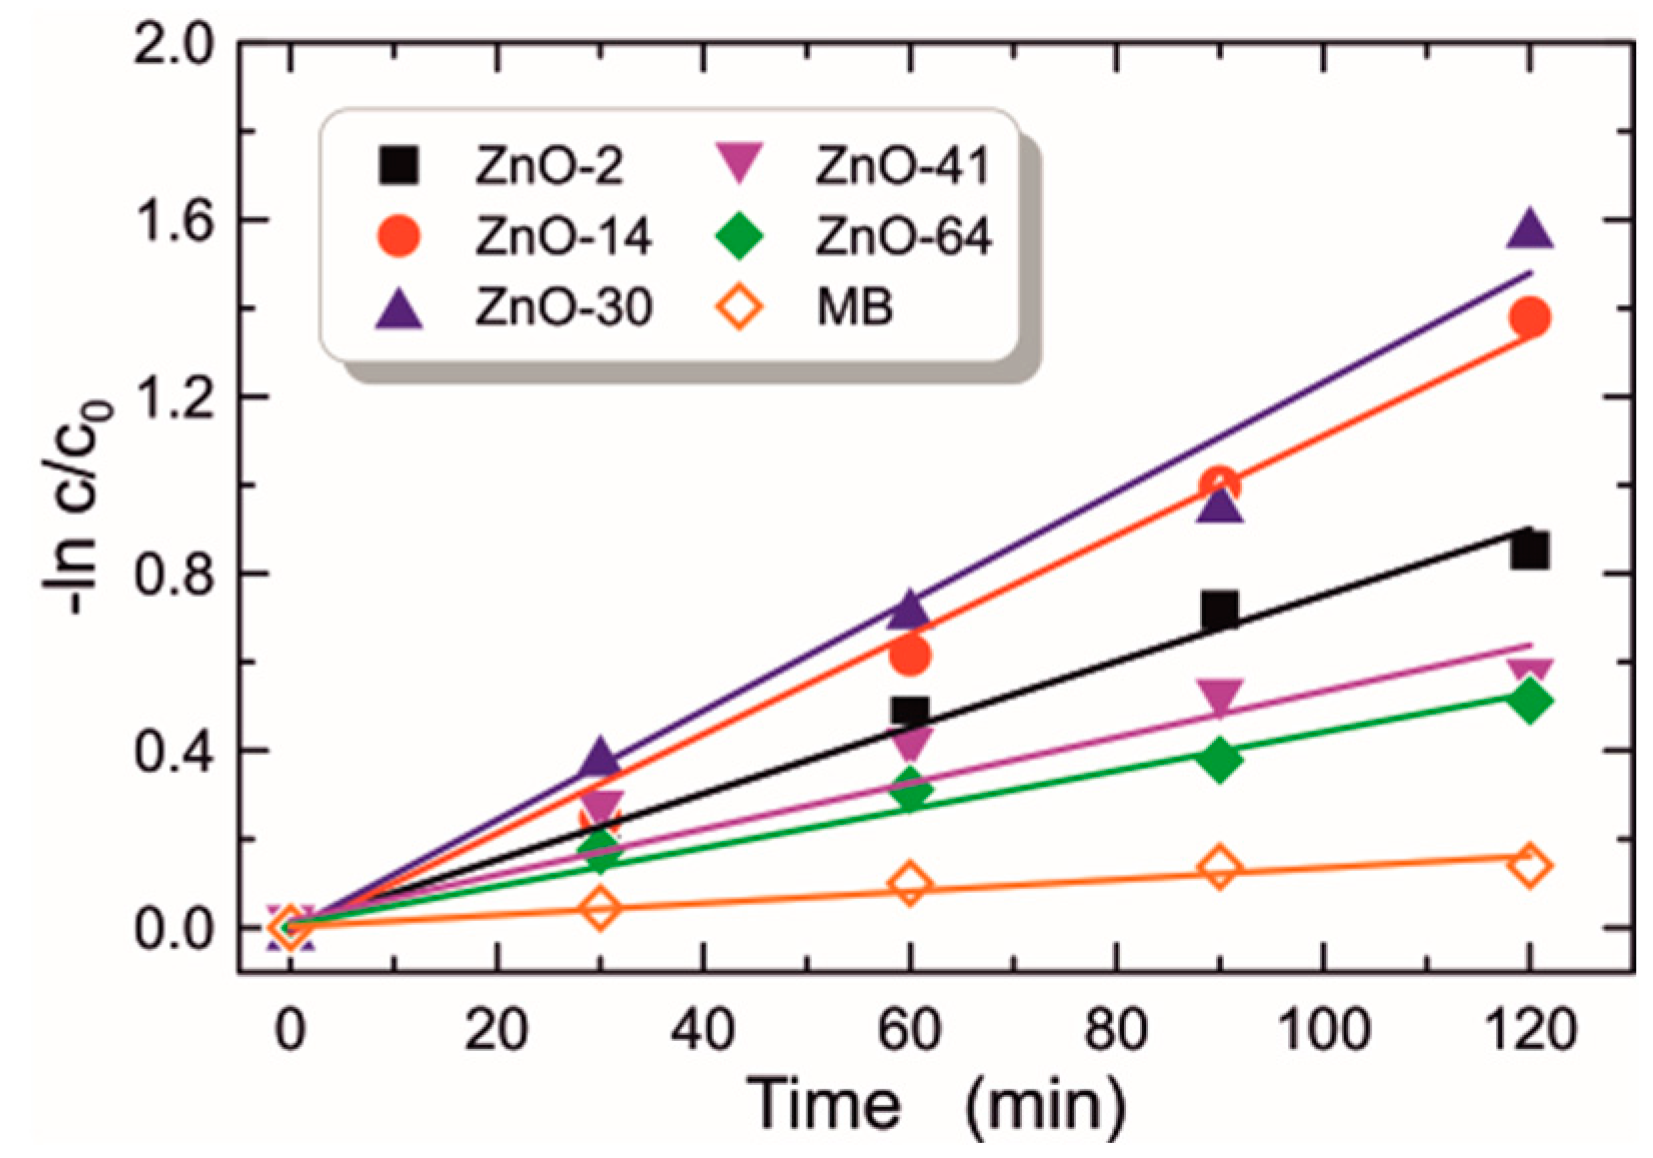
3.2.7. Photocatalytic Activity
4. Conclusions
Author Contributions
Funding
Institutional Review Board Statement
Informed Consent Statement
Data Availability Statement
Conflicts of Interest
References
- Znaidi, L. Sol-gel-deposited ZnO thin films: A review. In Materials Science and Engineering B: Solid-State Materials for Advanced Technology; Elsevier: Amsterdam, The Netherlands, 2010; Volume 174, pp. 18–30. [Google Scholar] [CrossRef]
- Mirzaei, A.; Chen, Z.; Haghighat, F.; Yerushalmi, L. Removal of pharmaceuticals and endocrine disrupting compounds from water by zinc oxide-based photocatalytic degradation: A review. Sustain. Cities Soc. 2016, 27, 407–418. [Google Scholar] [CrossRef]
- Li, Z.; Yu, X.; Zhu, Y.; Liu, S.; Wen, X.; Lu, H.; Wang, C.; Li, X.; Li, M.-Y.; Yang, Y. High performance ZnO quantum dot (QD)/ magnetron sputtered ZnO homojunction ultraviolet photodetectors. Appl. Surf. Sci. 2022, 582, 152352. [Google Scholar] [CrossRef]
- Gowthaman, N.; Chen, J.-W.; Dee, C.F.; Chai, S.-P.; Chang, W.S. Nanostructural dimension and oxygen vacancy synergistically induced photoactivity across high surface area monodispersed AuNPs/ZnO nanorods heterojunction. J. Alloy Compd. 2022, 920, 165836. [Google Scholar] [CrossRef]
- Yu, L.; Cai, W.; Wang, L.; Lee, C.-Y.; Sun, S.; Xiao, Y.; Shen, K.-C.; Chen, C. Three-Dimensional crystallized ZnO crosslinked nanowire structure. Inorg. Chem. Commun. 2022, 140, 109413. [Google Scholar] [CrossRef]
- Foumani, I.R.; Pat, S. Optical and surface properties of Gd-doped ZnO thin films deposited by thermionic vacuum arc deposition technology. Inorg. Chem. Commun. 2022, 144, 109831. [Google Scholar] [CrossRef]
- Malik, G.; Mourya, S.; Jaiswal, J.; Chandra, R. Effect of annealing parameters on optoelectronic properties of highly ordered ZnO thin films. Mater. Sci. Semicond. Process 2019, 100, 200–213. [Google Scholar] [CrossRef]
- Kaur, M.; Shaheera, M.; Pathak, A.; Gadkari, S.C.; Debnath, A.K. Highly sensitive NO2 sensor based on ZnO nanostructured thin film prepared by SILAR technique. Sens. Actuators B Chem. 2021, 335, 129678. [Google Scholar] [CrossRef]
- Ennaceri, H.; Erfurt, D.; Wang, L.; Köhler, T.; Taleb, A.; Khaldoun, A.; El Kenz, A.; Benyoussef, A.; Ennaoui, A. Deposition of multifunctional TiO2 and ZnO top-protective coatings for CSP application. Surf. Coatings Technol. 2016, 298, 103–113. [Google Scholar] [CrossRef]
- Jiang, C.Y.; Sun, X.; Lo, G.Q.; Kwong, D.L.; Wang, J.X. Improved dye-sensitized solar cells with a ZnO-nanoflower photoanode. Appl. Phys. Lett. 2007, 90, 263501. [Google Scholar] [CrossRef]
- Tiwari, A.; Sahay, P. Modification in the physical properties of nanocrystalline ZnO thin films by Sn/Ni co-doping for transparent conductive oxide applications. Phys. B Condens. Matter 2022, 629, 413638. [Google Scholar] [CrossRef]
- Ahmadi, S.H.; Ghaffarkani, M.; Ameri, M.; Safari, N.; Mohajerani, E. Solvent selection for fabrication of low temperature ZnO electron transport layer in perovskite solar cells. Opt. Mater. 2020, 106, 109977. [Google Scholar] [CrossRef]
- Szindler, M.; Szindler, M.; Basiaga, M.; Łoński, W.; Kaim, P. Application of ALD Thin Films on the Surface of the Surgical Scalpel Blade. Coatings 2021, 11, 1096. [Google Scholar] [CrossRef]
- Kaim, P.; Lukaszkowicz, K.; Szindler, M.; Szindler, M.M.; Basiaga, M.; Hajduk, B. The Influence of Magnetron Sputtering Process Temperature on ZnO Thin-Film Properties. Coatings 2021, 11, 1507. [Google Scholar] [CrossRef]
- Pelicano, C.M.; Yanagi, H. Effect of rubrene:P3HT bilayer on photovoltaic performance of perovskite solar cells with electrodeposited ZnO nanorods. J. Energy Chem. 2018, 27, 455–462. [Google Scholar] [CrossRef]
- Luo, L.; Rossell, M.D.; Xie, D.; Erni, R.; Niederberger, M. Microwave-Assisted Nonaqueous Sol–Gel Synthesis: From Al:ZnO Nanoparticles to Transparent Conducting Films. ACS Sustain. Chem. Eng. 2013, 1, 152–160. [Google Scholar] [CrossRef]
- Amakali, T.; Daniel, L.; Uahengo, V.; Dzade, N.; de Leeuw, N.H. Structural and Optical Properties of ZnO Thin Films Sol–Gel Methods. Crystals 2020, 10, 132. [Google Scholar] [CrossRef]
- Pelicano, C.M.; Yanagi, H. Enhanced charge transport in Al-doped ZnO nanotubes designed via simultaneous etching and Al doping of H2O-oxidized ZnO nanorods for solar cell applications. J. Mater. Chem. C 2019, 7, 4653–4661. [Google Scholar] [CrossRef]
- Laurenti, M.; Cauda, V. Porous Zinc Oxide Thin Films: Synthesis Approaches and Applications. Coatings 2018, 8, 67. [Google Scholar] [CrossRef]
- Darvishi, M.; Jamali-Paghaleh, F.; Jamali-Paghaleh, M.; Seyed-Yazdi, J. Facile synthesis of ZnO/rGO hybrid by microwave irradiation method with improved photoactivity. Surfaces Interfaces 2017, 9, 167–172. [Google Scholar] [CrossRef]
- Brinker, C.J.; Scherer, G.W. Sol-Gel Science: The Physics and Chemistry of Sol-Gel Processing; Academic Press: Cambridge, MA, USA, 2013. [Google Scholar] [CrossRef]
- Chaitra, U.; Kekuda, D.; Rao, K.M. Effect of annealing temperature on the evolution of structural, microstructural, and optical properties of spin coated ZnO thin films. Ceram. Int. 2017, 43, 7115–7122. [Google Scholar] [CrossRef]
- Toubane, M.; Tala-Ighil, R.; Bensouici, F.; Bououdina, M.; Cai, W.; Liu, S.; Souier, M.; Iratni, A. Structural, optical and photocatalytic properties of ZnO nanorods: Effect of aging time and number of layers. Ceram. Int. 2016, 42, 9673–9685. [Google Scholar] [CrossRef]
- Sheikhi, S.; Aliannezhadi, M.; Tehrani, F.S. Effect of precursor material, pH, and aging on ZnO nanoparticles synthesized by one-step sol–gel method for photodynamic and photocatalytic applications. Eur. Phys. J. Plus 2022, 137, 60. [Google Scholar] [CrossRef]
- Benramache, S.; Rahal, A.; Benhaoua, B. The effects of solvent nature on spray-deposited ZnO thin film prepared from Zn (CH3COO)2, 2H2O. Optik 2014, 125, 663–666. [Google Scholar] [CrossRef]
- Varol, S.F.; Babür, G.; Çankaya, G.; Kölemen, U. Synthesis of sol–gel derived nano-crystalline ZnO thin films as TCO window layer: Effect of sol aging and boron. RSC Adv. 2014, 4, 56645–56653. [Google Scholar] [CrossRef]
- Marouf, S.; Beniaiche, A.; Guessas, H.; Azizi, A. Morphological, Structural and Optical Properties of ZnO Thin Films Deposited by Dip Coating Method. Mater. Res. 2017, 20, 88–95. [Google Scholar] [CrossRef]
- Ibrahim, N.; Al-Shomar, S.; Ahmad, S.H. Effect of aging time on the optical, structural and photoluminescence properties of nanocrystalline ZnO films prepared by a sol–gel method. Appl. Surf. Sci. 2013, 283, 599–602. [Google Scholar] [CrossRef]
- Pérez-González, M.; Tomás, S.; Morales-Luna, M.; Arvizu, M.; Tellez-Cruz, M. Optical, structural, and morphological properties of photocatalytic TiO2–ZnO thin films synthesized by the sol–gel process. Thin Solid Films 2015, 594, 304–309. [Google Scholar] [CrossRef]
- Aghkonbad, E.M.; Aghgonbad, M.M.; Sedghi, H. A Study on Effect of Sol Aging Time on Optical Properties of ZnO Thin Films: Spectroscopic Ellipsometry Method. Micro Nanosyst. 2019, 11, 100–108. [Google Scholar] [CrossRef]
- Mancuso, A.; Sacco, O.; Mottola, S.; Pragliola, S.; Moretta, A.; Vaiano, V.; De Marco, I. Synthesis of Fe-doped ZnO by supercritical antisolvent precipitation for the degradation of azo dyes under visible light. Inorganica Chim. Acta 2023, 549, 121407. [Google Scholar] [CrossRef]
- Rini, N.P.; Istiqomah, N.I.; Sunarta; Suharyadi, E. Enhancing photodegradation of methylene blue and reusability using CoO/ZnO composite nanoparticles. Case Stud. Chem. Environ. Eng. 2023, 7, 100301. [Google Scholar] [CrossRef]
- Sher, M.; Javed, M.; Shahid, S.; Hakami, O.; Qamar, M.A.; Iqbal, S.; Al-Anazy, M.M.; Baghdadi, H.B. Designing of highly active g-C3N4/Sn doped ZnO heterostructure as a photocatalyst for the disinfection and degradation of the organic pollutants under visible light irradiation. J. Photochem. Photobiol. A Chem. 2021, 418, 113393. [Google Scholar] [CrossRef]
- Qamar, M.A.; Javed, M.; Shahid, S.; Iqbal, S.; Abubshait, S.A.; Abubshait, H.A.; Ramay, S.M.; Mahmood, A.; Ghaithan, H.M. Designing of highly active g-C3N4/Co@ZnO ternary nanocomposites for the disinfection of pathogens and degradation of the organic pollutants from wastewater under visible light. J. Environ. Chem. Eng. 2021, 9, 105534. [Google Scholar] [CrossRef]
- Naghani, M.E.; Neghabi, M.; Zadsar, M.; Ahangar, H.A. Synthesis and characterization of linear/nonlinear optical properties of graphene oxide and reduced graphene oxide-based zinc oxide nanocomposite. Sci. Rep. 2023, 13, 1496. [Google Scholar] [CrossRef]
- Maiti, M.; Sarkar, M.; Maiti, S.; Liu, D. Gold decorated shape-tailored zinc oxide-rGO nanohybrids: Candidate for pathogenic microbe destruction and hazardous dye degradation. Colloids Surfaces A: Physicochem. Eng. Asp. 2022, 641, 128465. [Google Scholar] [CrossRef]
- Liu, Z.; Jin, Z.; Li, W.; Qiu, J. Preparation of ZnO porous thin films by sol–gel method using PEG template. Mater. Lett. 2005, 59, 3620–3625. [Google Scholar] [CrossRef]
- Wang, X.-H.; Shi, J.; Dai, S.; Yang, Y. A sol-gel method to prepare pure and gold colloid doped ZnO films. Thin Solid Films 2003, 429, 102–107. [Google Scholar] [CrossRef]
- Znaidi, L.; Illia, G.S.; Le Guennic, R.; Sanchez, C.; Kanaev, A. Elaboration of ZnO Thin Films with Preferential Orientation by a Soft Chemistry Route. J. Sol-Gel Sci. Technol. 2003, 26, 817–821. [Google Scholar] [CrossRef]
- Khan, Z.R.; Khan, M.S.; Zulfequar, M. Optical and Structural Properties of ZnO Thin Films Fabricated by Sol-Gel Method. Mater. Sci. Appl. 2011, 02, 340–345. [Google Scholar] [CrossRef]
- Bindu, P.; Thomas, S. Estimation of lattice strain in ZnO nanoparticles: X-ray peak profile analysis. J. Theor. Appl. Phys. 2014, 8, 123–134. [Google Scholar] [CrossRef]
- Kayani, Z.N.; Iqbal, M.; Riaz, S.; Zia, R.; Naseem, S. Fabrication and properties of zinc oxide thin film prepared by sol-gel dip coating method. Mater. Sci. 2015, 33, 515–520. [Google Scholar] [CrossRef]
- Tauc, J. Amorphous and Liquid Semiconductors; Springer Science & Business Media: Berlin/Heidelberg, Germany, 2012. [Google Scholar]
- Karasiński, P.; Gondek, E.; Drewniak, S.; Kajzer, A.; Waczyńska-Niemiec, N.; Basiaga, M.; Izydorczyk, W.; Kouari, Y.E. Porous titania films fabricated via sol gel rout—Optical and AFM characterization. Opt. Mater. 2016, 56, 64–70. [Google Scholar] [CrossRef]
- Millán, C.; Santonja, C.; Domingo, M.; Luna, R.; Satorre, M.Á. An experimental test for effective medium approximations (EMAs). Astron. Astrophys. 2019, 628, A63. [Google Scholar] [CrossRef]
- Ozgür, Ü.; Alivov, Y.I.; Liu, C.; Teke, A.; Reshchikov, M.A.; Doğan, S.; Avrutin, V.; Cho, S.-J.; Morkoç, H. A comprehensive review of ZnO materials and devices. J. Appl. Phys. 2005, 98, 041301. [Google Scholar] [CrossRef]
- Sokolov, P.; Baranov, A.; Bell, A.; Solozhenko, V. Low-temperature thermal expansion of rock-salt ZnO. Solid State Commun. 2014, 177, 65–67. [Google Scholar] [CrossRef]
- Hamby, D.W.; Lucca, D.A.; Klopfstein, M.J.; Cantwell, G. Temperature dependent exciton photoluminescence of bulk ZnO. J. Appl. Phys. 2003, 93, 3214. [Google Scholar] [CrossRef]
- Travnikov, V.; Freiberg, A.; Savikhin, S. Surface excitons in ZnO crystals. J. Lumin 1990, 47, 107–112. [Google Scholar] [CrossRef]
- Rai, R.C.; Guminiak, M.; Wilser, S.; Cai, B.; Nakarmi, M.L. Elevated temperature dependence of energy band gap of ZnO thin films grown by e-beam deposition. J. Appl. Phys. 2012, 111, 073511. [Google Scholar] [CrossRef]
- Davis, K.; Yarbrough, R.; Froeschle, M.; White, J.; Rathnayake, H. Band gap engineered zinc oxide nanostructures via a sol–gel synthesis of solvent driven shape-controlled crystal growth. RSC Adv. 2019, 9, 14638–14648. [Google Scholar] [CrossRef]
- Brus, L.E. Electron–electron and electron-hole interactions in small semiconductor crystallites: The size dependence of the lowest excited electronic state. J. Chem. Phys. 1984, 80, 4403–4409. [Google Scholar] [CrossRef]
- Tan, S.T.; Chen, B.J.; Sun, X.W.; Fan, W.J.; Kwok, H.S.; Zhang, X.H.; Chua, S.J. Blueshift of optical band gap in ZnO thin films grown by metal-organic chemical-vapor deposition. J. Appl. Phys. 2005, 98, 013505. [Google Scholar] [CrossRef]
- Üzar, N. Investigation of detailed physical properties and solar cell performances of various type rare earth elements doped ZnO thin films. J. Mater. Sci. Mater. Electron. 2018, 29, 10471–10479. [Google Scholar] [CrossRef]
- Speaks, D.T. Effect of concentration, aging, and annealing on sol gel ZnO and Al-doped ZnO thin films. Int. J. Mech. Mater. Eng. 2020, 15, 2. [Google Scholar] [CrossRef]
- Chala, S.; Bdirina, M.; Elbar, M.; Naoui, Y.; Benbouzid, Y.; Taouririt, T.E.; Labed, M.; Boumaraf, R.; Bouhdjar, A.F.; Sengouga, N.; et al. Dependence of Structural and Optical Properties of ZnO Thin Films Grown by Sol–Gel Spin-Coating Technique on Solution Molarity. Trans. Electr. Electron. Mater. 2022, 1, 3. [Google Scholar] [CrossRef]
- Bhujel, K.; Ningthoujam, S.S.; Singh, L.R.; Rai, S. Effect of solution aging on properties of spin coated zinc oxide thin films. Mater. Today Proc. 2019, 46, 6419–6422. [Google Scholar] [CrossRef]
- El Hallani, G.; Fazouan, N.; Liba, A.; Khuili, M. The effect of sol aging time on Structural and Optical properties of sol gel ZnO doped Al. J. Physics Conf. Ser. 2016, 758, 012021. [Google Scholar] [CrossRef]
- Gao, D.-G.; Chen, C.; Ma, J.-Z.; Lv, B.; Jia, X.-L. Preparation, characterization and application of ZnO sol containing quaternary ammonium salts. J. Sol-Gel Sci. Technol. 2013, 65, 336–343. [Google Scholar] [CrossRef]
- Poddighe, M.; Innocenzi, P. Hydrophobic Thin Films from Sol–Gel Processing: A Critical Review. Materials 2021, 14, 6799. [Google Scholar] [CrossRef]
- Islam, M.R.; Rahman, M.; Farhad, S.; Podder, J. Structural, optical and photocatalysis properties of sol–gel deposited Al-doped ZnO thin films. Surfaces Interfaces 2019, 16, 120–126. [Google Scholar] [CrossRef]


| Sol Aging Time (Day) | Name | d (nm) | n (λ = 632.8 nm) | P (%) | (eV) | (eV) | ΔEgI | D (nm) | Contact Angle (°) | k (min−1) × 10−3 |
|---|---|---|---|---|---|---|---|---|---|---|
| 1 | 2 | 3 | 4 | 5 | 6 | 7 | 8 | 9 | 10 | 11 |
| 2 | ZnO-2 | 42 | 1.631 | 28.2 | 3.293 | 4.455 | 1.085 | 0.64 | 65.27 | 7.5 |
| 14 | ZnO-14 | 45 | 1.605 | 30.6 | 3.290 | 4.431 | 1.061 | 0.65 | 59.99 | 11.1 |
| 30 | ZnO-30 | 52 | 1.537 | 37.1 | 3.300 | 4.485 | 1.115 | 0.61 | 68.53 | 12.3 |
| 41 | ZnO-41 | 46.5 | 1.572 | 33.7 | 3.282 | 4.428 | 1.058 | 0.65 | 63.35 | 5.4 |
| 64 | ZnO-64 | 45.5 | 1.570 | 33.9 | 3.290 | 4.414 | 1.044 | 0.68 | 49.61 | 4.4 |
| Sol Aging Time | Sol Composition | Methods, T (°C), Substrates | Results | Ref. |
|---|---|---|---|---|
| 0–36 h | zinc acetate dihydrate, monoethanolamine, 2-methoxyethanol | spin-coating, 300, 500, glass substrates | the optimal aging time is 24 h, the ZnO films were of high quality and had the best properties (transmission in the UV-Vis range, bandgap broadening) | [30] |
| 0–13 days | zinc acetate dihydrate, methanol | dip-coating (multilayers), 500, glass substrates | the optimal aging time is 7 days, the layers were characterized by high transmittance (above 70% in the visible range) and a smooth surface | [27] |
| 0–30 days | zinc acetate dihydrate, diethanolamine, ethanol | dip-coating, 450, glass substrates | the longer the sol aging time, the ZnO layers having better transmittance in the UV-Vis range (up to 96%), increased optical band gap Eg, and improved smoothness | [23] |
| 2–64 days | zinc acetate dihydrate, diethanolamine, ethanol | dip-coating (monolayer), 485, glass substrates | the optimal sol aging time is 30 days, the ZnO layers are characterized by the best optical and photocatalytic properties, after this time the layers have weaker optical and photocatalytic properties | this work |
Disclaimer/Publisher’s Note: The statements, opinions and data contained in all publications are solely those of the individual author(s) and contributor(s) and not of MDPI and/or the editor(s). MDPI and/or the editor(s) disclaim responsibility for any injury to people or property resulting from any ideas, methods, instructions or products referred to in the content. |
© 2023 by the authors. Licensee MDPI, Basel, Switzerland. This article is an open access article distributed under the terms and conditions of the Creative Commons Attribution (CC BY) license (https://creativecommons.org/licenses/by/4.0/).
Share and Cite
Wojtasik, K.; Zięba, M.; Tyszkiewicz, C.; Pakieła, W.; Żak, G.; Jeremiasz, O.; Gondek, E.; Drabczyk, K.; Karasiński, P. Zinc Oxide Films Fabricated via Sol-Gel Method and Dip-Coating Technique–Effect of Sol Aging on Optical Properties, Morphology and Photocatalytic Activity. Materials 2023, 16, 1898. https://doi.org/10.3390/ma16051898
Wojtasik K, Zięba M, Tyszkiewicz C, Pakieła W, Żak G, Jeremiasz O, Gondek E, Drabczyk K, Karasiński P. Zinc Oxide Films Fabricated via Sol-Gel Method and Dip-Coating Technique–Effect of Sol Aging on Optical Properties, Morphology and Photocatalytic Activity. Materials. 2023; 16(5):1898. https://doi.org/10.3390/ma16051898
Chicago/Turabian StyleWojtasik, Katarzyna, Magdalena Zięba, Cuma Tyszkiewicz, Wojciech Pakieła, Grażyna Żak, Olgierd Jeremiasz, Ewa Gondek, Kazimierz Drabczyk, and Paweł Karasiński. 2023. "Zinc Oxide Films Fabricated via Sol-Gel Method and Dip-Coating Technique–Effect of Sol Aging on Optical Properties, Morphology and Photocatalytic Activity" Materials 16, no. 5: 1898. https://doi.org/10.3390/ma16051898
APA StyleWojtasik, K., Zięba, M., Tyszkiewicz, C., Pakieła, W., Żak, G., Jeremiasz, O., Gondek, E., Drabczyk, K., & Karasiński, P. (2023). Zinc Oxide Films Fabricated via Sol-Gel Method and Dip-Coating Technique–Effect of Sol Aging on Optical Properties, Morphology and Photocatalytic Activity. Materials, 16(5), 1898. https://doi.org/10.3390/ma16051898