
Phase Equilibria of the In–Pd–Sn System at 500 °C and 800 °C: Experimental Study and CALPHAD Modeling

 ,
,
Abstract
:1. Introduction
- -
- -
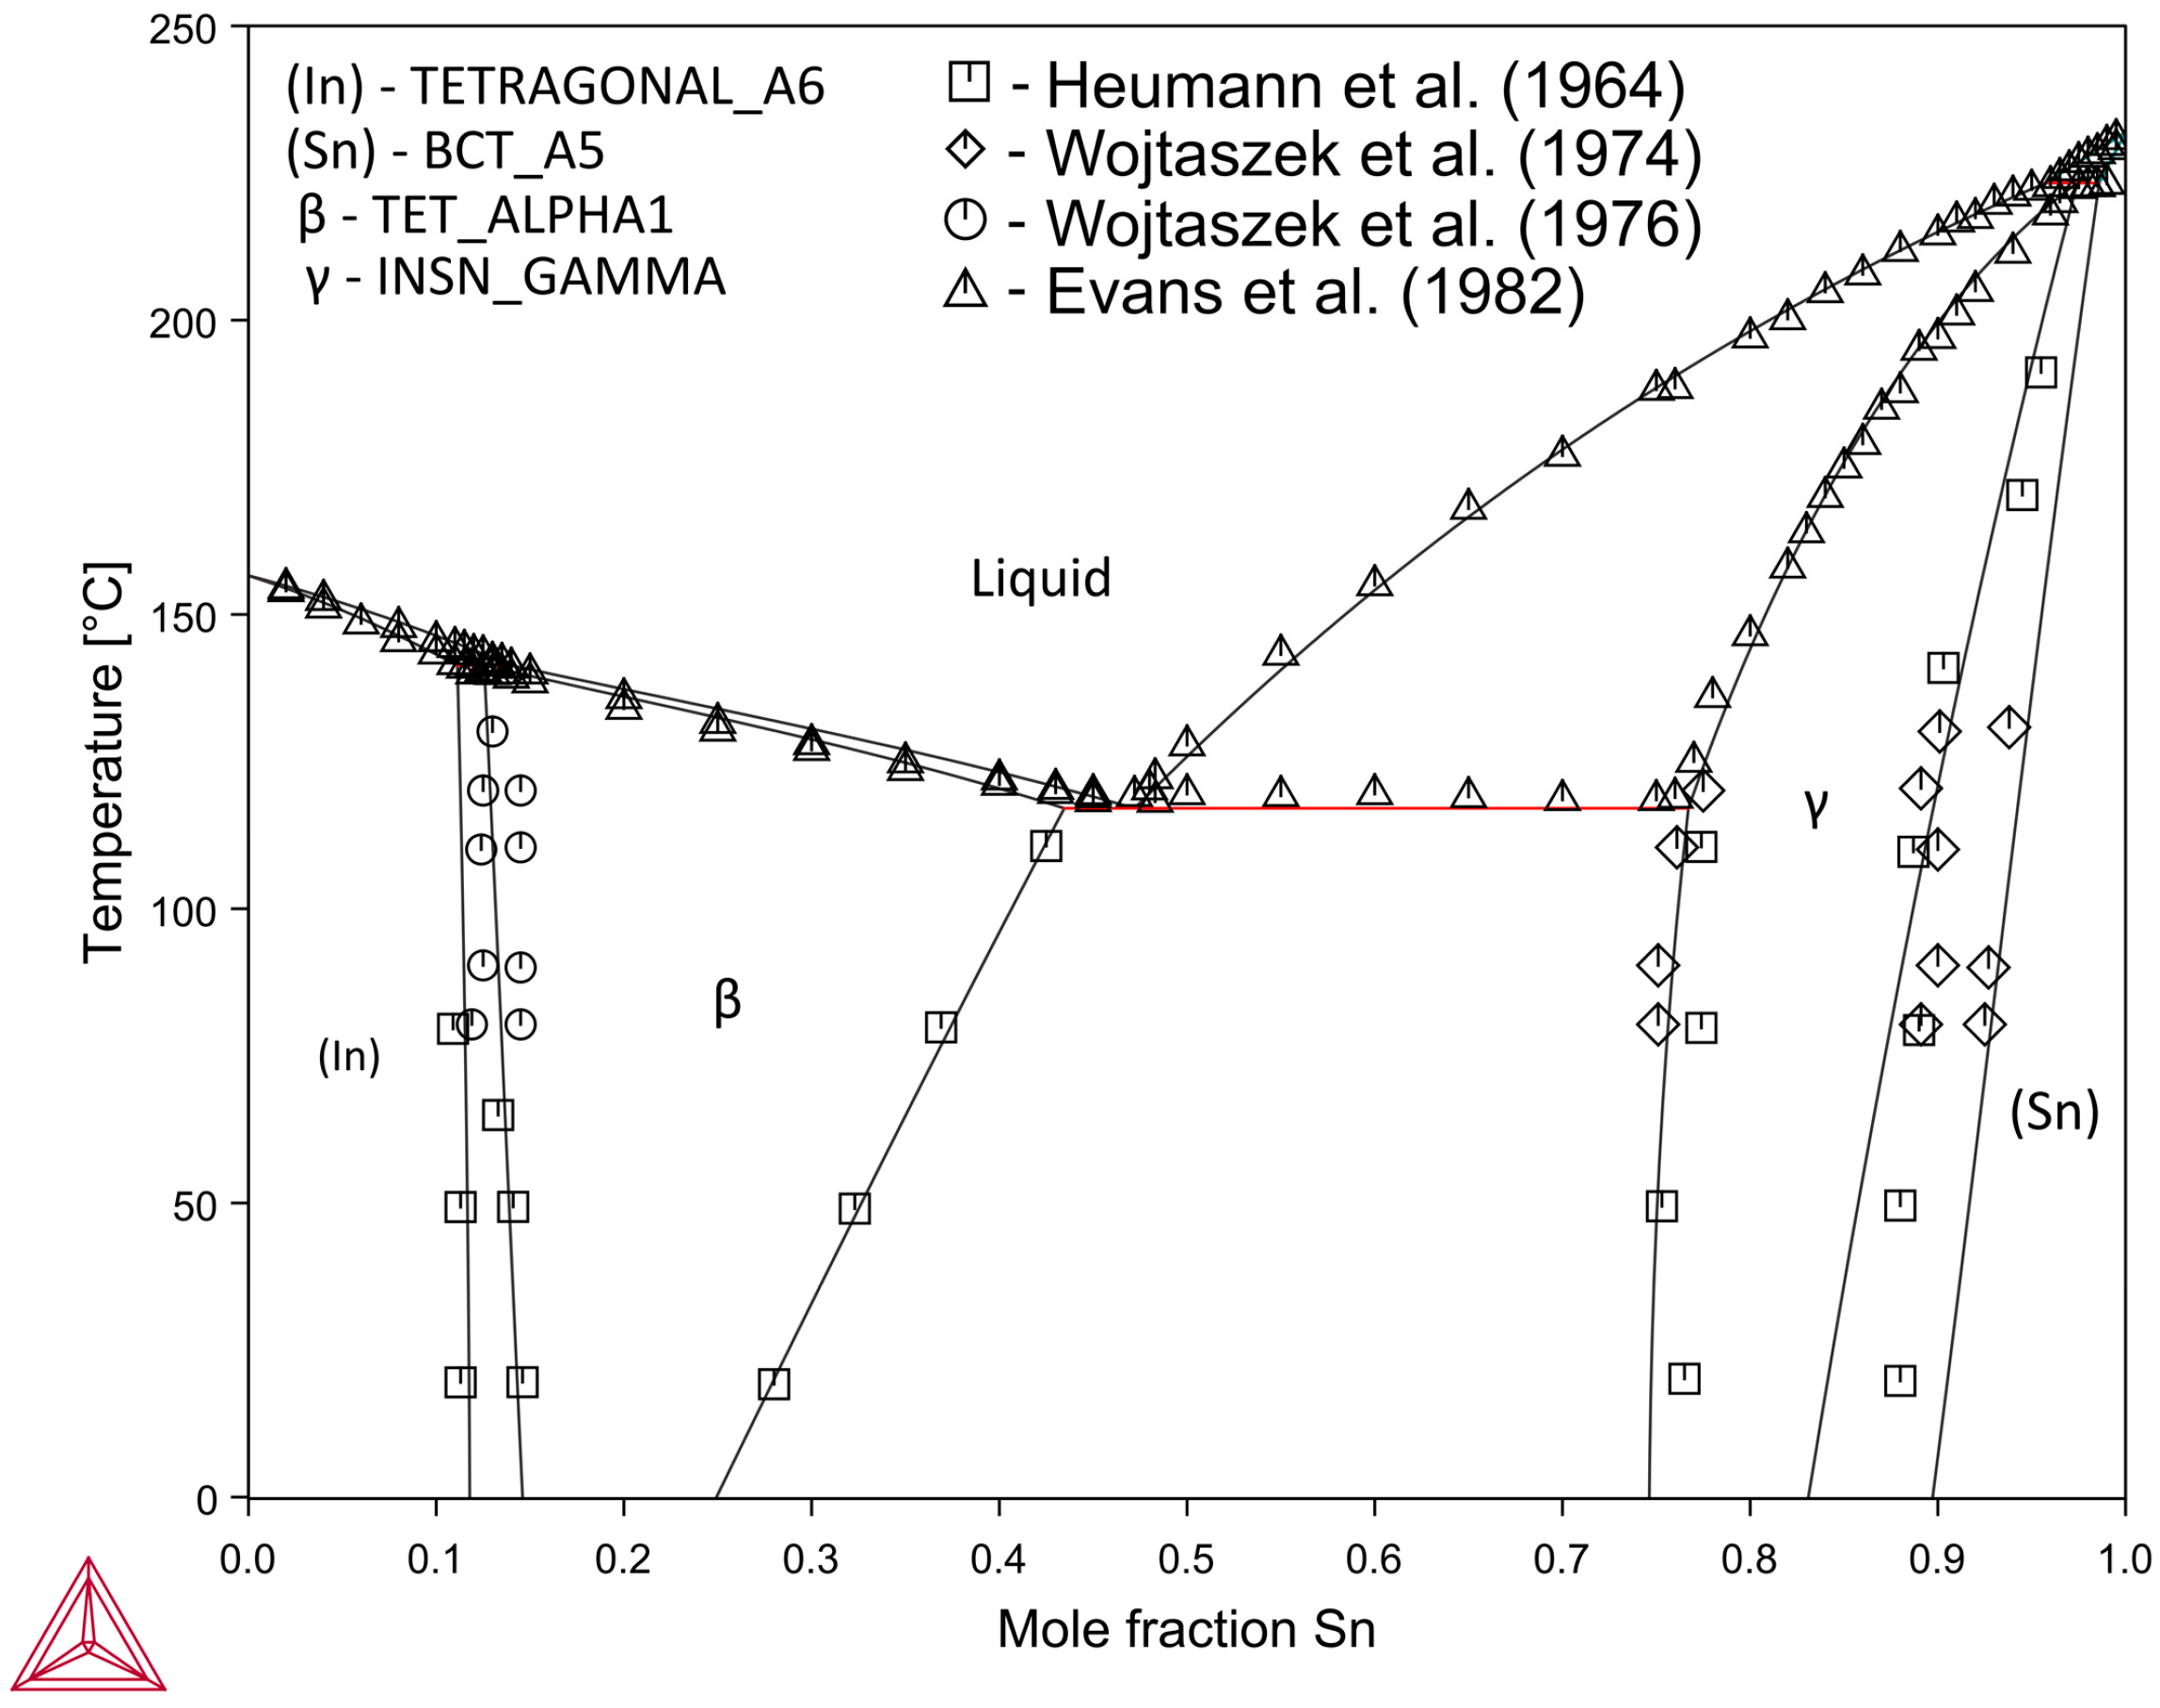
- The thermodynamic calculation of the In–Sn system was performed in three works [15,16,17]. The results in [15] are in the best agreement with the experimental data for phase equilibria. According to other studies, the γ phase present in the system turns out to be too stable, which is why its calculated homogeneity field is much wider than the experimental one. In all the In–Sn system calculations [15,16,17], obsolete values [18] of indium stability parameters in the β tin-type structure and of tin in the In type structure were used. The description of the In–Sn system requires revision.
- -
- The most complete thermodynamic description of the Pd–Sn system, taking into account the latest studies of phase equilibria in the system, was proposed in [19]. Two models for the liquid phase: the Redlich–Kister polynomial and the associated solution theory were used. Both provide essentially the same quality of the reproduction of all the experimental data available.
2. Experimental Procedures
3. Thermodynamic Model
Thermodynamic Models of Phases with Sublattices
4. Results and Discussion
4.1. Experimental Investigations
4.2. Differential Thermal Analysis
4.3. Thermodynamic Modelling
4.3.1. In–Sn System
4.3.2. In–Pd System
4.3.3. Pd–Sn System
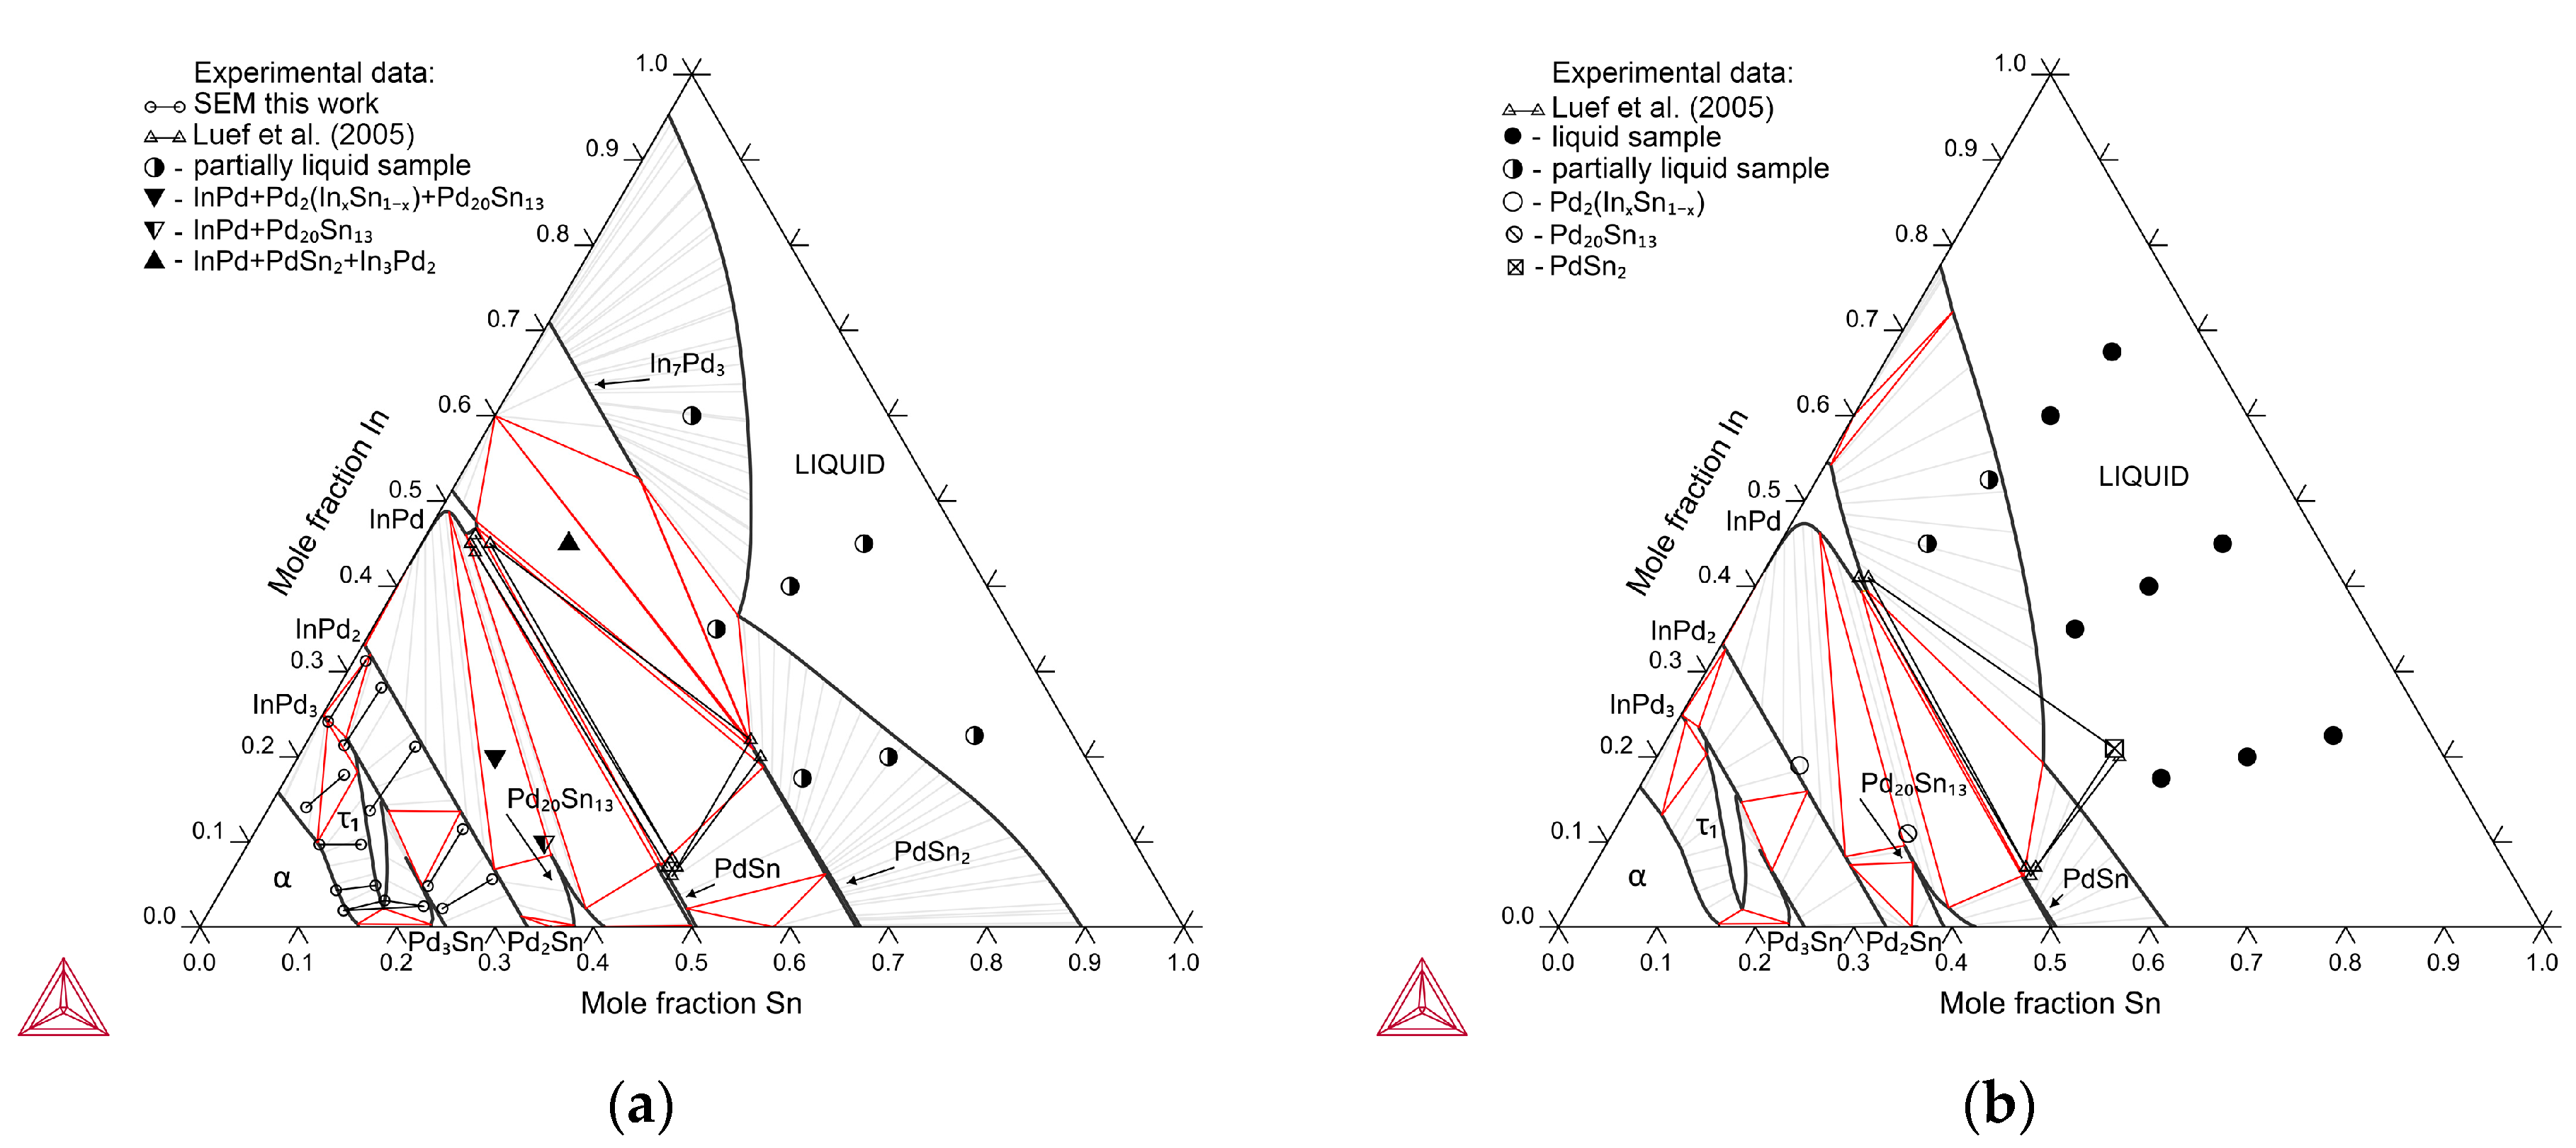
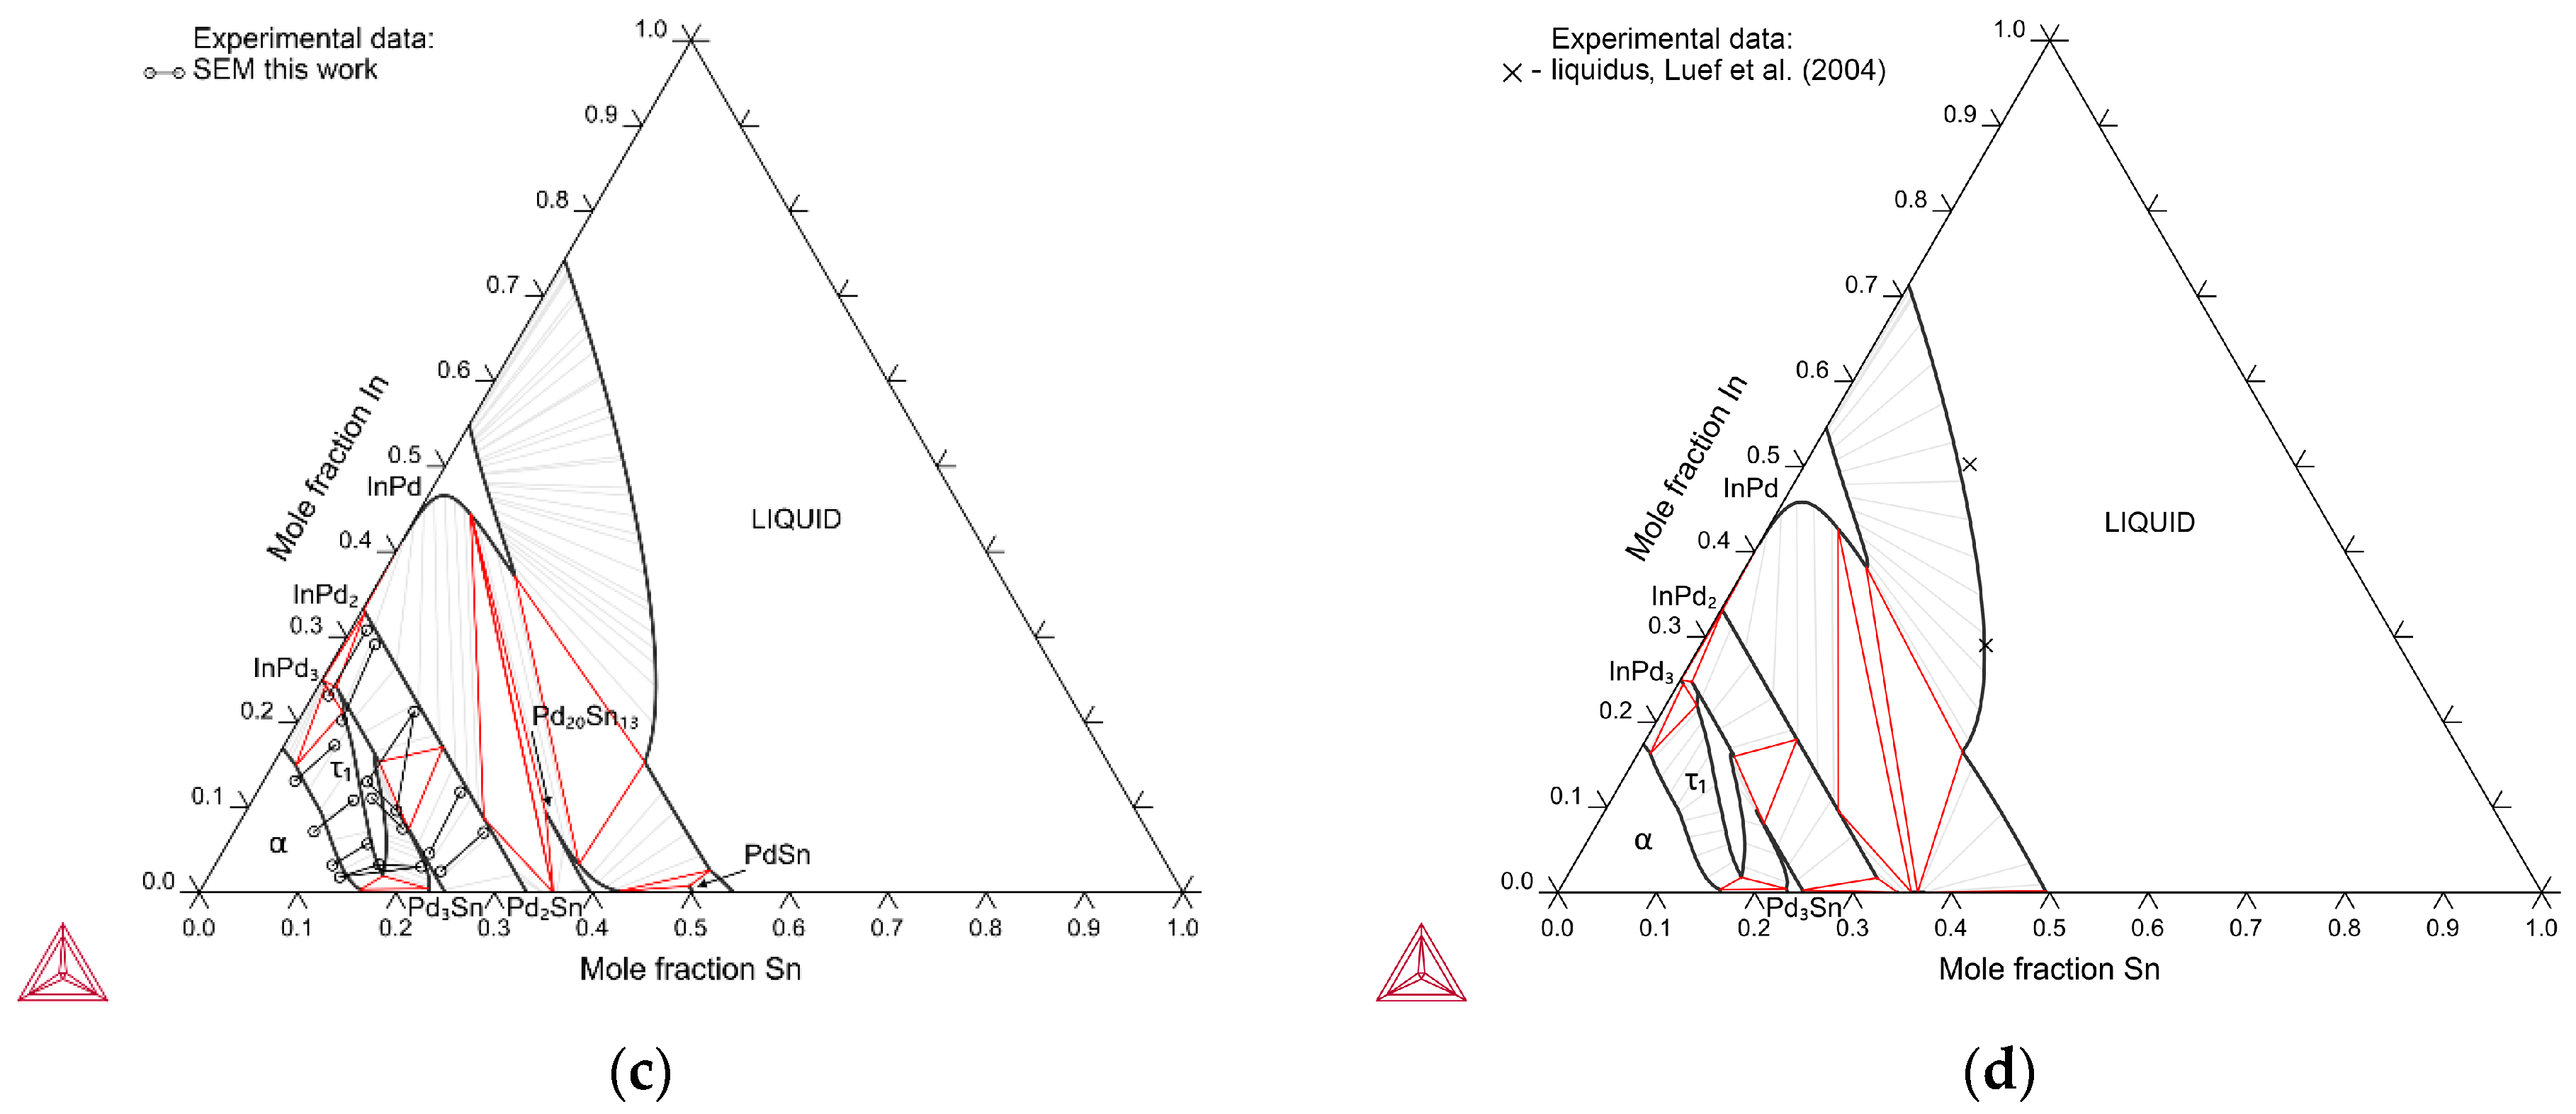
4.3.4. In–Pd–Sn Ternary System Modeling
5. Conclusions
Author Contributions
Funding
Institutional Review Board Statement
Informed Consent Statement
Data Availability Statement
Conflicts of Interest
References
- Shin, H.J.; Kwon, Y.H.; Seol, H.J. Effect of cooling rate on hardness and microstructure of Pd–Ag–In–Sn−Ga alloy during porcelain firing simulation. J. Mech. Behav. Biomed. Mater. 2020, 107, 103728. [Google Scholar] [CrossRef]
- Zhang, R.; Peng, M.; Ling, L.; Wang, B. PdIn intermetallic material with isolated single-atom Pd sites–A promising catalyst for direct formic acid fuel cell. Chem. Eng. Sci. 2019, 199, 64–78. [Google Scholar] [CrossRef]
- Zerdoumi, R.; Armbrüster, M. Insights into the Electronic Effects in Methanol Electro-Oxidation by Ternary In1–xSnxPd2 Intermetallic Compounds. ACS Appl. Energy Mater. 2021, 4, 11279–11289. [Google Scholar] [CrossRef]
- Lee, C.Y.; Yang, S.P.; Yang, C.H.; Lu, M.K.; Kuo, T.T.; Ho, C.E. Influence of Pd(P) thickness on the Pd-free solder reaction between eutectic Sn-Ag alloy and Au/Pd(P)/Ni(P)/Cu multilayer. Surf. Coat. Technol. 2020, 395, 125879. [Google Scholar] [CrossRef]
- Chen, C.; Wang, C.; Sun, H. Interfacial Microstructure and Mechanical Reliability of Sn-58Bi/ENEPIG Solder Joints. Processes 2022, 10, 295. [Google Scholar] [CrossRef]
- Luef, C.; Flandorfer, H.; Paul, A.; Kodentsov, A.; Ipser, H. The In–Pd–Sn phase diagram (xPd ≤ 0.6): Isothermal sections. J. Intermet. 2005, 13, 1207–1213. [Google Scholar] [CrossRef]
- Okamoto, H. In-Pd (Indium-Palladium). J. Phase Equilib. 2003, 24, 481. [Google Scholar] [CrossRef]
- Kohlmann, H.; Ritter, C. Reaction pathways in the formation of intermetallic InPd3 polymorphs. Z. Anorg. Allg. Chem. 2009, 635, 1573–1579. [Google Scholar] [CrossRef]
- Kohlmann, H.; Ritter, C. Refinement of the crystal structures of palladium-rich In-Pd compounds by x-ray and neutron powder diffraction. Z. Naturforsch. B 2007, 62, 929–934. [Google Scholar] [CrossRef]
- Okamoto, H. Pd-Sn (Palladium-Tin). J. Phase Equilib. Diffus. 2012, 33, 253–254. [Google Scholar] [CrossRef]
- Franke, P.; Neuschütz, D. Landolt-Börnstein—Group IV Physical Chemistry 19B3; Springer: Berlin/Heidelberg, Germany, 2005; pp. 1–6. [Google Scholar]
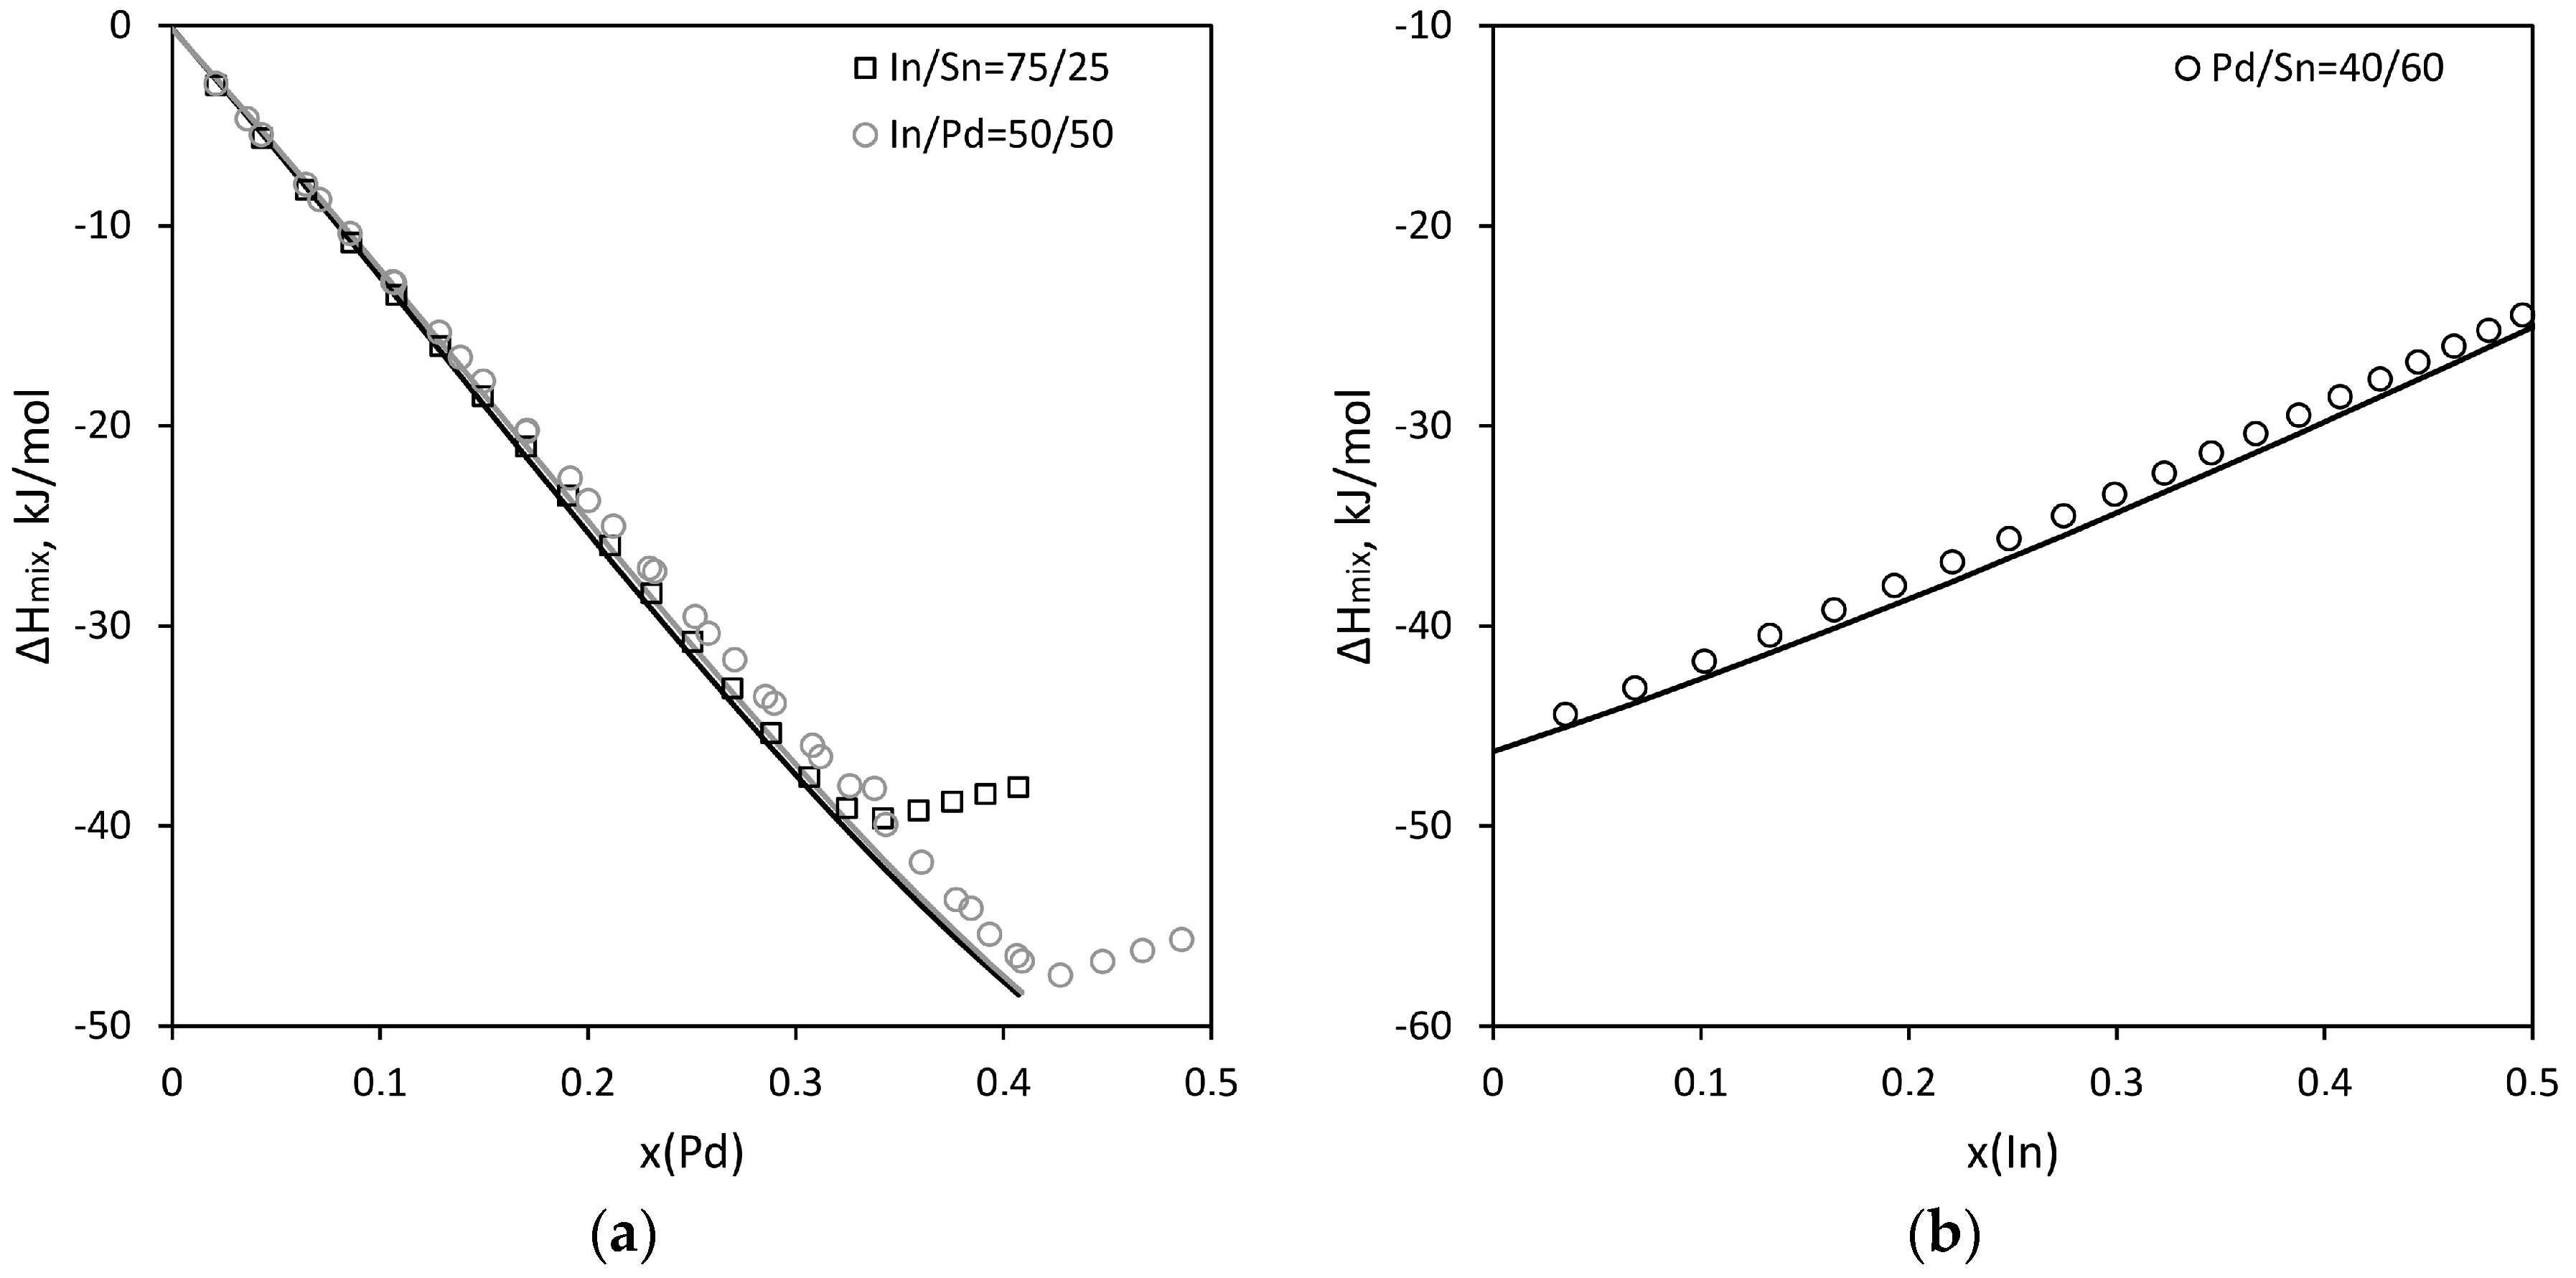
- Luef, C.; Flandorfer, H.; Ipser, H. Enthalpies of mixing of liquid alloys in the In–Pd–Sn system and the limiting binary systems. Thermochim. Acta 2004, 417, 47–57. [Google Scholar] [CrossRef]
- Jiang, C.; Liu, Z.K. Thermodynamic modeling of the indium-palladium system. Metall. Mater. Trans. A 2002, 33, 3597–3603. [Google Scholar] [CrossRef]
- Thermo-Calc software PURE5/SGTE pure element database. Available online: https://thermocalc.com/about-us/methodology/the-calphad-methodology/assessment-of-thermodynamic-data/ (accessed on 13 January 2023).
- Lee, B.J.; Oh, C.S.; Shim, J.H. Thermodynamic assessments of the Sn-In and Sn-Bi binary systems. J. Electron. Mater. 1996, 25, 983–991. [Google Scholar] [CrossRef]
- Korhonen, T.M.; Kivilahti, J.K. Thermodynamics of the Sn-In-Ag solder system. J. Electron. Mater. 1998, 27, 149–158. [Google Scholar] [CrossRef]
- David, N.; El Aissaoui, K.; Fiorani, J.M.; Hertz, J.; Vilasi, M. Thermodynamic optimization of the In–Pb–Sn system based on new evaluations of the binary borders In–Pb and In–Sn. Thermochim. Acta 2004, 413, 127–137. [Google Scholar] [CrossRef]
- Dinsdale, A.T. SGTE data for pure elements. Calphad 1991, 15, 317–425. [Google Scholar] [CrossRef]
- Cui, S.; Wang, J.; You, Z.; Napolitano, R.E. Critical evaluation and thermodynamic modeling of the Pd–Sn system. J. Intermet. 2020, 126, 106945. [Google Scholar] [CrossRef]
- Ptashkina, E.A.; Kabanova, E.G.; Kalmykov, K.B.; Kuznetsov, V.N.; Zhmurko, G.P. Isothermal section of the Pd–Cu–In system at 500° C. J. Alloys Compd. 2020, 845, 156166. [Google Scholar] [CrossRef]
- Pavlenko, A.S.; Ptashkina, E.A.; Zhmurko, G.P.; Kabanova, E.G.; Kareva, M.A.; Khoroshilov, A.V.; Kuznetsov, V.N. Experimental Investigation and Thermodynamic Modelling of Ag–In–Pd Ternary System. Rus. J. Phys. Chem. A 2023, 97, 42–49. [Google Scholar] [CrossRef]
- Sundman, B.; Lukas, H.L.; Fries, S.G. Computational Thermodynamics: The Calphad Method; Cambridge University Press: Cambridge, UK, 2007. [Google Scholar]
- Redlich, O.; Kister, A.T. Algebraic representation of thermodynamic properties and the classification of solutions. Ind. Eng. Chem. 1948, 40, 345–348. [Google Scholar] [CrossRef]
- Prince, E. International Tables for Crystallography, Volume C: Mathematical, Physical and Chemical Tables, 3rd ed.; Kluwer Academic Publishers: Alphen aan den Rijn, The Netherlands, 2004. [Google Scholar]
- Bhan, S.; Schubert, K. Über die Struktur von Phasen mit Kupfer Unterstruktur in einigen T-B Legierungen (T= Ni, Pd, Pt; B= Ga, In, Tl, Pb, Sb, Bi). J. Less Com. Met. 1969, 17, 73–90. [Google Scholar] [CrossRef]
- Heumann, T.; Alpaut, O. Das Zustandsdiagramm Indium-Zinn. J. Less Com. Met. 1964, 6, 108–117. [Google Scholar] [CrossRef]
- Wojtaszek, Z.; Kuzyk, H. Phase diagram of the In-Sn system in the range 60-100 atomic % tin. Zesz. Nauk. Uniw. Jagiell. Pr. Chem. 1974, 19, 281–287. [Google Scholar]
- Wojtaszek, Z.; Kuzyk, H. Phase diagram of the In-Sn system in the range 0-60 atomic percent of tin. Zesz. Nauk. Uniw. Jagiell. Pr. Chem. 1976, 21, 27–32. [Google Scholar]
- Evans, D.S.; Prince, A. The In–Sn Phase Diagram. MRS Proc. 1982, 19, 389–394. [Google Scholar] [CrossRef]
- Schmid, E.E. Ph.D. Thesis, University Stuttgart, Stuttgart, Germany, 1987.
- Schubert, K.; Breimer, H.; Burkhardt, W.; Günzel, E.; Haufler, R.; Lukas, H.L.; Vetter, H.; Wegst, J.; Wilkens, M. Einige strukturelle ergebnisse an metallischen phasen II. Naturwissensch 1957, 44, 229–230. [Google Scholar] [CrossRef]
- Saal, J.E.; Kirklin, S.; Aykol, M.; Meredig, B.; Wolverton, C. Materials design and discovery with high-throughput density functional theory: The open quantum materials database (OQMD). JOM 2013, 65, 1501–1509. [Google Scholar] [CrossRef]
- Pavlenko, A.S.; Ptashkina, E.A.; Khoroshilov, A.V.; Kabanova, E.G.; Kuznetsov, V.N. Using DTA/DSC data for assessment of the Toop and Muggianu predictive models for the Ag–Au–In ternary. J. Therm. Anal. Calorim. 2019, 138, 2605–2613. [Google Scholar] [CrossRef]


| Phase | Prototype | Space Group | Phase Designation in Thermo-Calc® Databases | References |
|---|---|---|---|---|
| In–Pd system | ||||
| (Pd) | Cu | Fmm | FCC_A1 | [7] |
| αInPd3 | Al3Zr | I4/mmm | αInPd3 | [8] |
| βInPd3 | Al3Ti | I4/mmm | βInPd3 | [8] |
| αInPd2 | Co2Si | Pnma | Pd2(InxSn1−x) | [9] |
| βInPd2 | – * | – | βInPd2 | [7] |
| In3Pd5 | Rh5Ge3 | Pbam | In3Pd5 | [9] |
| InPd | CsCl | Pmm | BCC_B2 | [7] |
| In3Pd2 | Ni2Al3 | Pm1 | In3Pd2 | [7] |
| In7Pd3 | Ge7Ir3 | Imm | In7Pd3 | [7] |
| Pd–Sn system | ||||
| (Pd) | Cu | Fmm | FCC_A1 | [10] |
| Pd3Sn | AuCu3 | Pmm | Pd3Sn | [10] |
| Pd2Sn | Co2Si | Pnma | Pd2(InxSn1−x) | [10] |
| γ–Pd2−xSn | Ni2In | P63/mmc | γ–Pd2–xSn | [10] |
| Pd20Sn13 | Pd13Sn9 | P3221 | Pd20Sn13 | [10] |
| PdSn | FeAs | Pnma | PdSn | [10] |
| Pd5Sn7 | Pd5Sn7 | C2/m | Pd5Sn7 | [10] |
| PdSn2 | PdSn2 | Aba2 | PdSn2 | [10] |
| PdSn3 | PdSn3 | Cmca | PdSn3 | [10] |
| PdSn4 | PdSn4 | Aba2 | PdSn4 | [10] |
| αPd3Sn2 | – | – | αPd3Sn2 | [10] |
| βPd3Sn2 | – | – | βPd3Sn2 | [10] |
| δPd3Sn2 | – | – | δPd3Sn2 | [10] |
| In–Sn system | ||||
| (In) | In | I4/mmm | TETRAGONAL_A6 | [11] |
| β | In | I4/mmm | TET_ALPHA1 | [11] |
| γ | Hg0.1Sn0.9 | P6/mmm | INSN_GAMMA | [11] |
| (Sn) | βSn | I41/amd | BCT_A5 | [11] |
| No. | Alloy Composition, at.% | Phase | Type | Phase Composition, at.% | Cell Parameters, Å | ||||||
|---|---|---|---|---|---|---|---|---|---|---|---|
| In | Pd | Sn | In | Pd | Sn | a | b | c | |||
| 1 | 15.5 | 80.2 | 4.3 | α | Cu | 12.7 | 83.7 | 3.6 | 3.9452(8) | - | - |
| InPd3 | Al3Zr | 17.0 | 77.5 | 5.5 | 4.04277(10) | - | 15.3234(5) | ||||
| τ1 | Al3Ti | - | - | - | 4.0897(10) | - | 7.481(3) | ||||
| 2 | 9.4 | 81.1 | 9.5 | α | Cu | 7.9 | 83.7 | 8.4 | 3.9427(7) | - | - |
| τ1 | Al3Ti | 11.2 | 78.7 | 10.1 | 4.0835(6) | - | 7.4757(14) | ||||
| 3 | 5.3 | 81.0 | 13.7 | α | Cu | 3.4 | 84.1 | 12.4 | 3.9413(8) | - | - |
| τ1 | Al3Ti | 6.1 | 79.2 | 14.8 | 4.0740(9) | - | 7.4784(23) | ||||
| 4 | 20.0 | 75.3 | 4.7 | τ1 | Al3Ti | 20.0 | 75.3 | 4.7 | 4.1135(10) | - | 7.4364(20) |
| 5 | 14.9 | 76.3 | 8.8 | τ1 | Al3Ti | 14.9 | 76.3 | 8.8 | 4.1053(8) | - | 7.4634(18) |
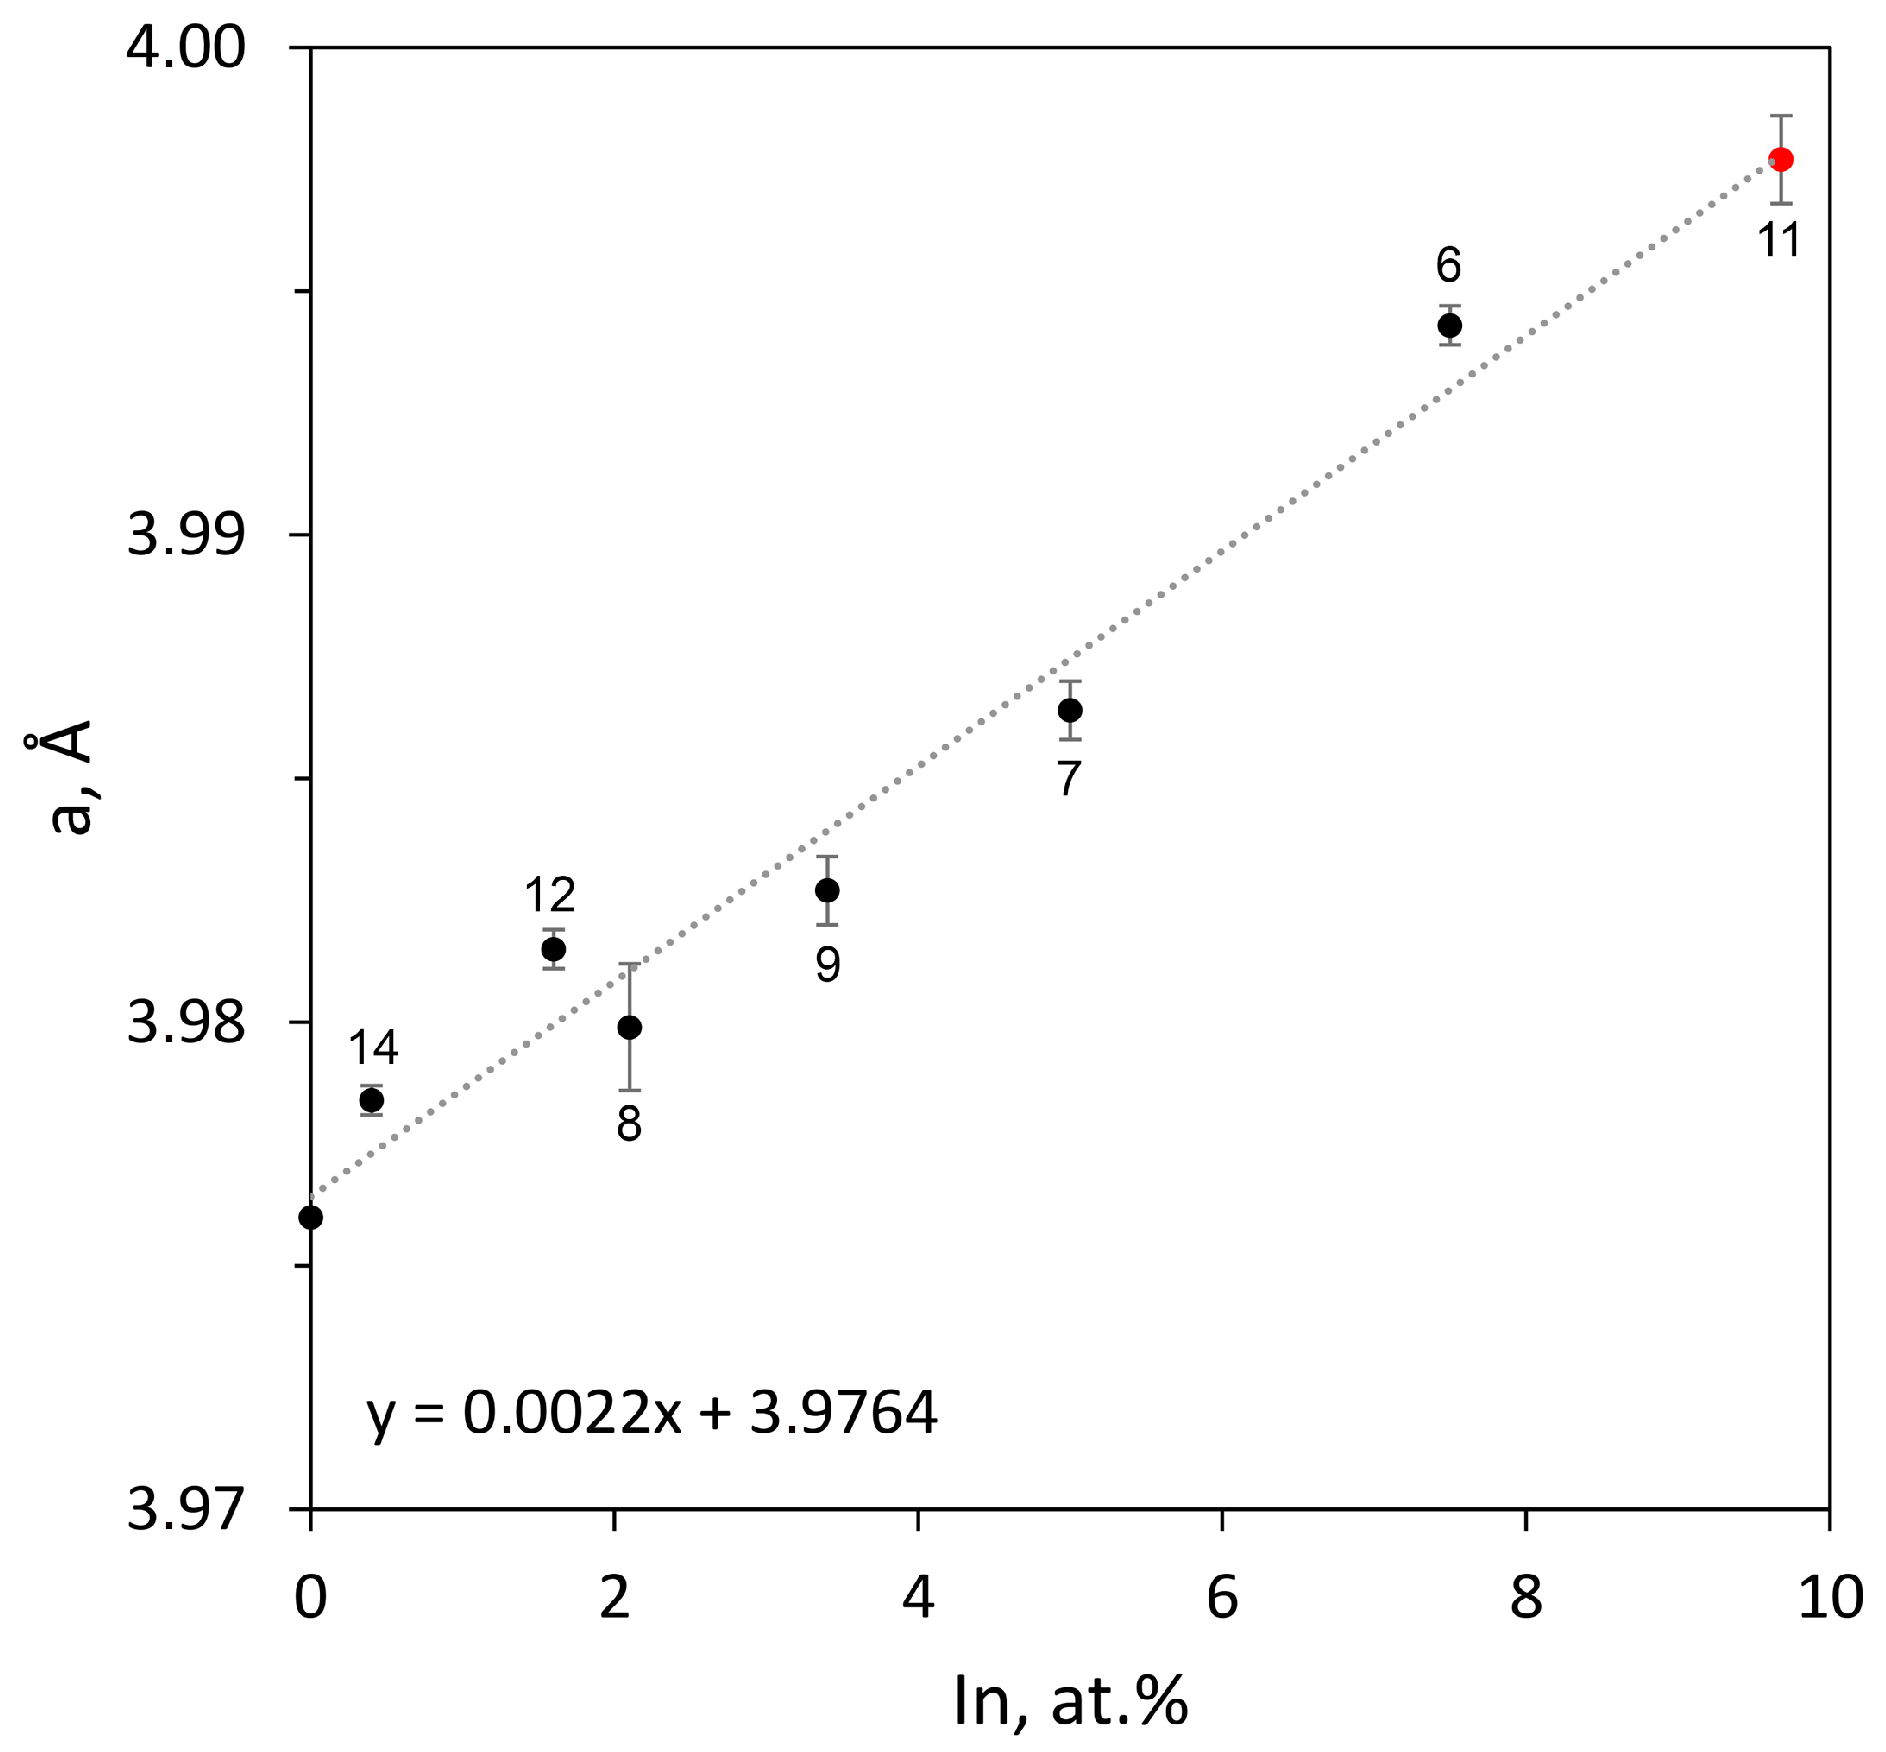
| 6 | 10.4 | 76.1 | 13.5 | Pd3Sn | AuCu3 | 7.5 | 76.1 | 16.4 | 3.9943(4) | - | - |
| τ1 | Al3Ti | 10.7 | 76.3 | 13.0 | 4.1001(10) | - | 7.4806(20) | ||||
| 7 | 5.0 | 76.7 | 18.4 | Pd3Sn | AuCu3 | 5.0 | 76.7 | 18.4 | 3.9864(6) | - | - |
| 8 | 2 | 81 | 17 | α | Cu | 2.0 | 84.6 | 13.4 | 3.9416(6) | - | - |
| Pd3Sn | AuCu3 | 3.1 | 76.2 | 20.7 | 3.9799(13) | - | - | ||||
| τ1 | Al3Ti | – | – | – | 4.0685(5) | - | 7.5270(14) | ||||
| 9 | 3 | 78.5 | 18.5 | τ1 | Al3Ti | 3.3 | 80.2 | 16.5 | 4.0692(5) | - | 7.5178(14) |
| Pd3Sn | AuCu3 | 3.6 | 76.6 | 19.8 | 3.9827(7) | - | - | ||||
| α | Cu | 2.3 | 84.0 | 13.7 | 3.9409(8) | - | - | ||||
| 10 | 22.5 | 73.3 | 4.1 | τ1 | Al3Ti | 19.6 | 75.7 | 4.7 | 4.1144(10) | - | 7.434(3) |
| Pd2(InxSn1−x) | Co2Si | 28.2 | 68.3 | 3.5 | 5.621(4) | 4.2320(16) | 8.201(4) | ||||
| 11 | 15.0 | 74.2 | 10.8 | τ1 | Al3Ti | 12.3 | 77.0 | 10.8 | 4.1005(9) | - | 7.4728(20) |
| Pd2(InxSn1−x) | Co2Si | 21.1 | 67.7 | 11.2 | 5.6182(9) | 4.2387(5) | 8.2009(12) | ||||
| Pd3Sn | AuCu3 | – | – | – | 3.9977(9) | - | - | ||||
| 12 | 5.1 | 73.9 | 21.0 | Pd3Sn | AuCu3 | 1.6 | 76.6 | 21.8 | 3.9815(4) | ||
| Pd2(InxSn1−x) | Co2Si | 10.4 | 68.9 | 20.8 | 5.6381(20) | 4.2553(13) | 8.173(10) | ||||
| 13 | 25.6 | 72.7 | 1.7 | InPd3 | Al3Zr | 22.9 | 75.5 | 1.6 | 4.0724(16) | - | 15.180(7) |
| Pd2(InxSn1−x) | Co2Si | 31.1 | 67.4 | 1.6 | 5.6099(21) | 4.2284(15) | 8.213(4) | ||||
| 14 | 2.5 | 74.3 | 23.2 | Pd3Sn | AuCu3 | 0.4 | 77.2 | 22.4 | 3.9784(3) | - | - |
| No. | Alloy Composition, at.% | Phase | Type | Phase Composition, at.% | Cell Parameters, Å | ||||||
|---|---|---|---|---|---|---|---|---|---|---|---|
| In | Pd | Sn | In | Pd | Sn | a | b | c | |||
| 1 | 14.6 | 80.4 | 5.1 | α | Cu | 14.3 | 82.1 | 3.7 | 3.9519(13) | - | - |
| τ1 | Al3Ti | 17.0 | 78.1 | 4.9 | 4.0866(9) | - | 7.483(2) | ||||
| 2 | 9.7 | 80.8 | 9.6 | α | Cu | 10.4 | 81.8 | 7.8 | 3.9543(18) | - | - |
| τ1 | Al3Ti | 10.5 | 78.9 | 10.6 | 4.0830(6) | - | 7.4866(20) | ||||
| 3 | 4.4 | 82.0 | 13.6 | α | Cu | 4.5 | 83.9 | 11.6 | 3.9546(13) | - | - |
| τ1 | Al3Ti | 5.0 | 79.0 | 16.0 | 4.0700(10) | - | 7.526(3) | ||||
| 4 | 20.4 | 75.1 | 4.5 | τ1 | Al3Ti | 20.4 | 75.1 | 4.5 | 4.0960(11) | - | 7.496(3) |
| 5 | 15.5 | 75.2 | 9.3 | τ1 | Al3Ti | 15.5 | 75.2 | 9.3 | 4.1018(11) | - | 7.466(4) |
| 6 | 10.4 | 76.3 | 13.3 | τ1 | Al3Ti | 10.4 | 76.3 | 13.3 | 4.0924(5) | - | 7.4872(18) |
| 7 | 4.8 | 76.9 | 18.3 | Pd3Sn | AuCu3 | 4.8 | 76.9 | 18.3 | 3.9845(5) | - | - |
| 8 | 2.0 | 81.0 | 16.0 | Pd3Sn | AuCu3 | 2.5 | 76.2 | 21.3 | 3.9760(16) | - | - |
| τ1 | Al3Ti | 2.65 | 79.4 | 18.0 | 4.0735(8) | - | 7.530(3) | ||||
| α | Cu | 2.1 | 84.2 | 13.7 | 3.9445(14) | - | - | ||||
| 9 | 3.0 | 78.5 | 18.5 | Pd3Sn | AuCu3 | 2.8 | 76.0 | 21.8 | 3.98387(11) | - | - |
| τ1 | Al3Ti | 3.2 | 79.5 | 17.3 | 4.0711(17) | - | 7.536(4) | ||||
| α | Cu | 2.4 | 82.6 | 15.0 | 3.9352(17) | - | - | ||||
| 10 | 22.5 | 72.7 | 4.8 | Pd2(InxSn1−x) | Co2Si | 27.6 | 68.1 | 4.3 | 5.6156(15) | 4.2225(10) | 8.2292(20) |
| τ1 | Al3Ti | 20.8 | 74.3 | 4.9 | 4.1044(13) | - | 7.460(3) | ||||
| 11 | 14.7 | 73.9 | 11.4 | Pd2(InxSn1−x) | Co2Si | 21.8 | 66.8 | 11.4 | 5.6218(12) | 4.2328(14) | 8.206(12) |
| τ1 | Al3Ti | 13.4 | 76.2 | 10.4 | 4.0987(14) | - | 7.464(4) | ||||
| 12 | 5.6 | 73.6 | 20.8 | Pd2(InxSn1−x) | Co2Si | 10.4 | 68.8 | 20.8 | 5.6411(15) | 4.2583(8) | 8.1521(23) |
| Pd3Sn | AuCu3 | 2.1 | 77.2 | 20.7 | 3.9807(3) | - | - | ||||
| 13 | 26.9 | 71.6 | 1.5 | Pd2(InxSn1−x) | Co2Si | 31.0 | 67.9 | 1.1 | 5.6105(19) | 4.2263(19) | 8.2194(22) |
| InPd3 | Al3Zr | 23.1 | 76.1 | 0.8 | 4.0671(8) | - | 15.256(6) | ||||
| 14 | 2.5 | 73.7 | 23.8 | Pd2(InxSn1−x) | Co2Si | 5.3 | 68.5 | 26.2 | 5.6432(14) | 4.2843(16) | 8.131(3) |
| Pd3Sn | AuCu3 | 1.2 | 77.2 | 21.6 | 3.9798(5) | - | - | ||||
| 15 | 23.3 | 67.6 | 9.1 | Pd2(InxSn1−x) | Co2Si | 23.3 | 67.6 | 9.1 | 5.6167(11) | 4.2226(12) | 8.211(4) |
| 16 | 16.0 | 68.5 | 15.5 | Pd2(InxSn1−x) | Co2Si | 16.0 | 68.5 | 15.5 | 5.634(3) | 4.2405(19) | 8.2028(23) |
| 17 | 8.9 | 68.0 | 23.2 | Pd2(InxSn1−x) | Co2Si | 8.9 | 68.0 | 23.2 | 5.651(3) | 4.2579(18) | 8.164(3) |
| 18 | 5.3 | 67.6 | 27.1 | Pd2(InxSn1−x) | Co2Si | 5.3 | 67.6 | 27.1 | 5.6448(12) | 4.2796(14) | 8.131(3) |
| No. | Phase Area | Alloy Composition According to EDX, at.% | Temperature, °C | |||
|---|---|---|---|---|---|---|
| Pd | In | Sn | Liquidus | Phase Transitions | ||
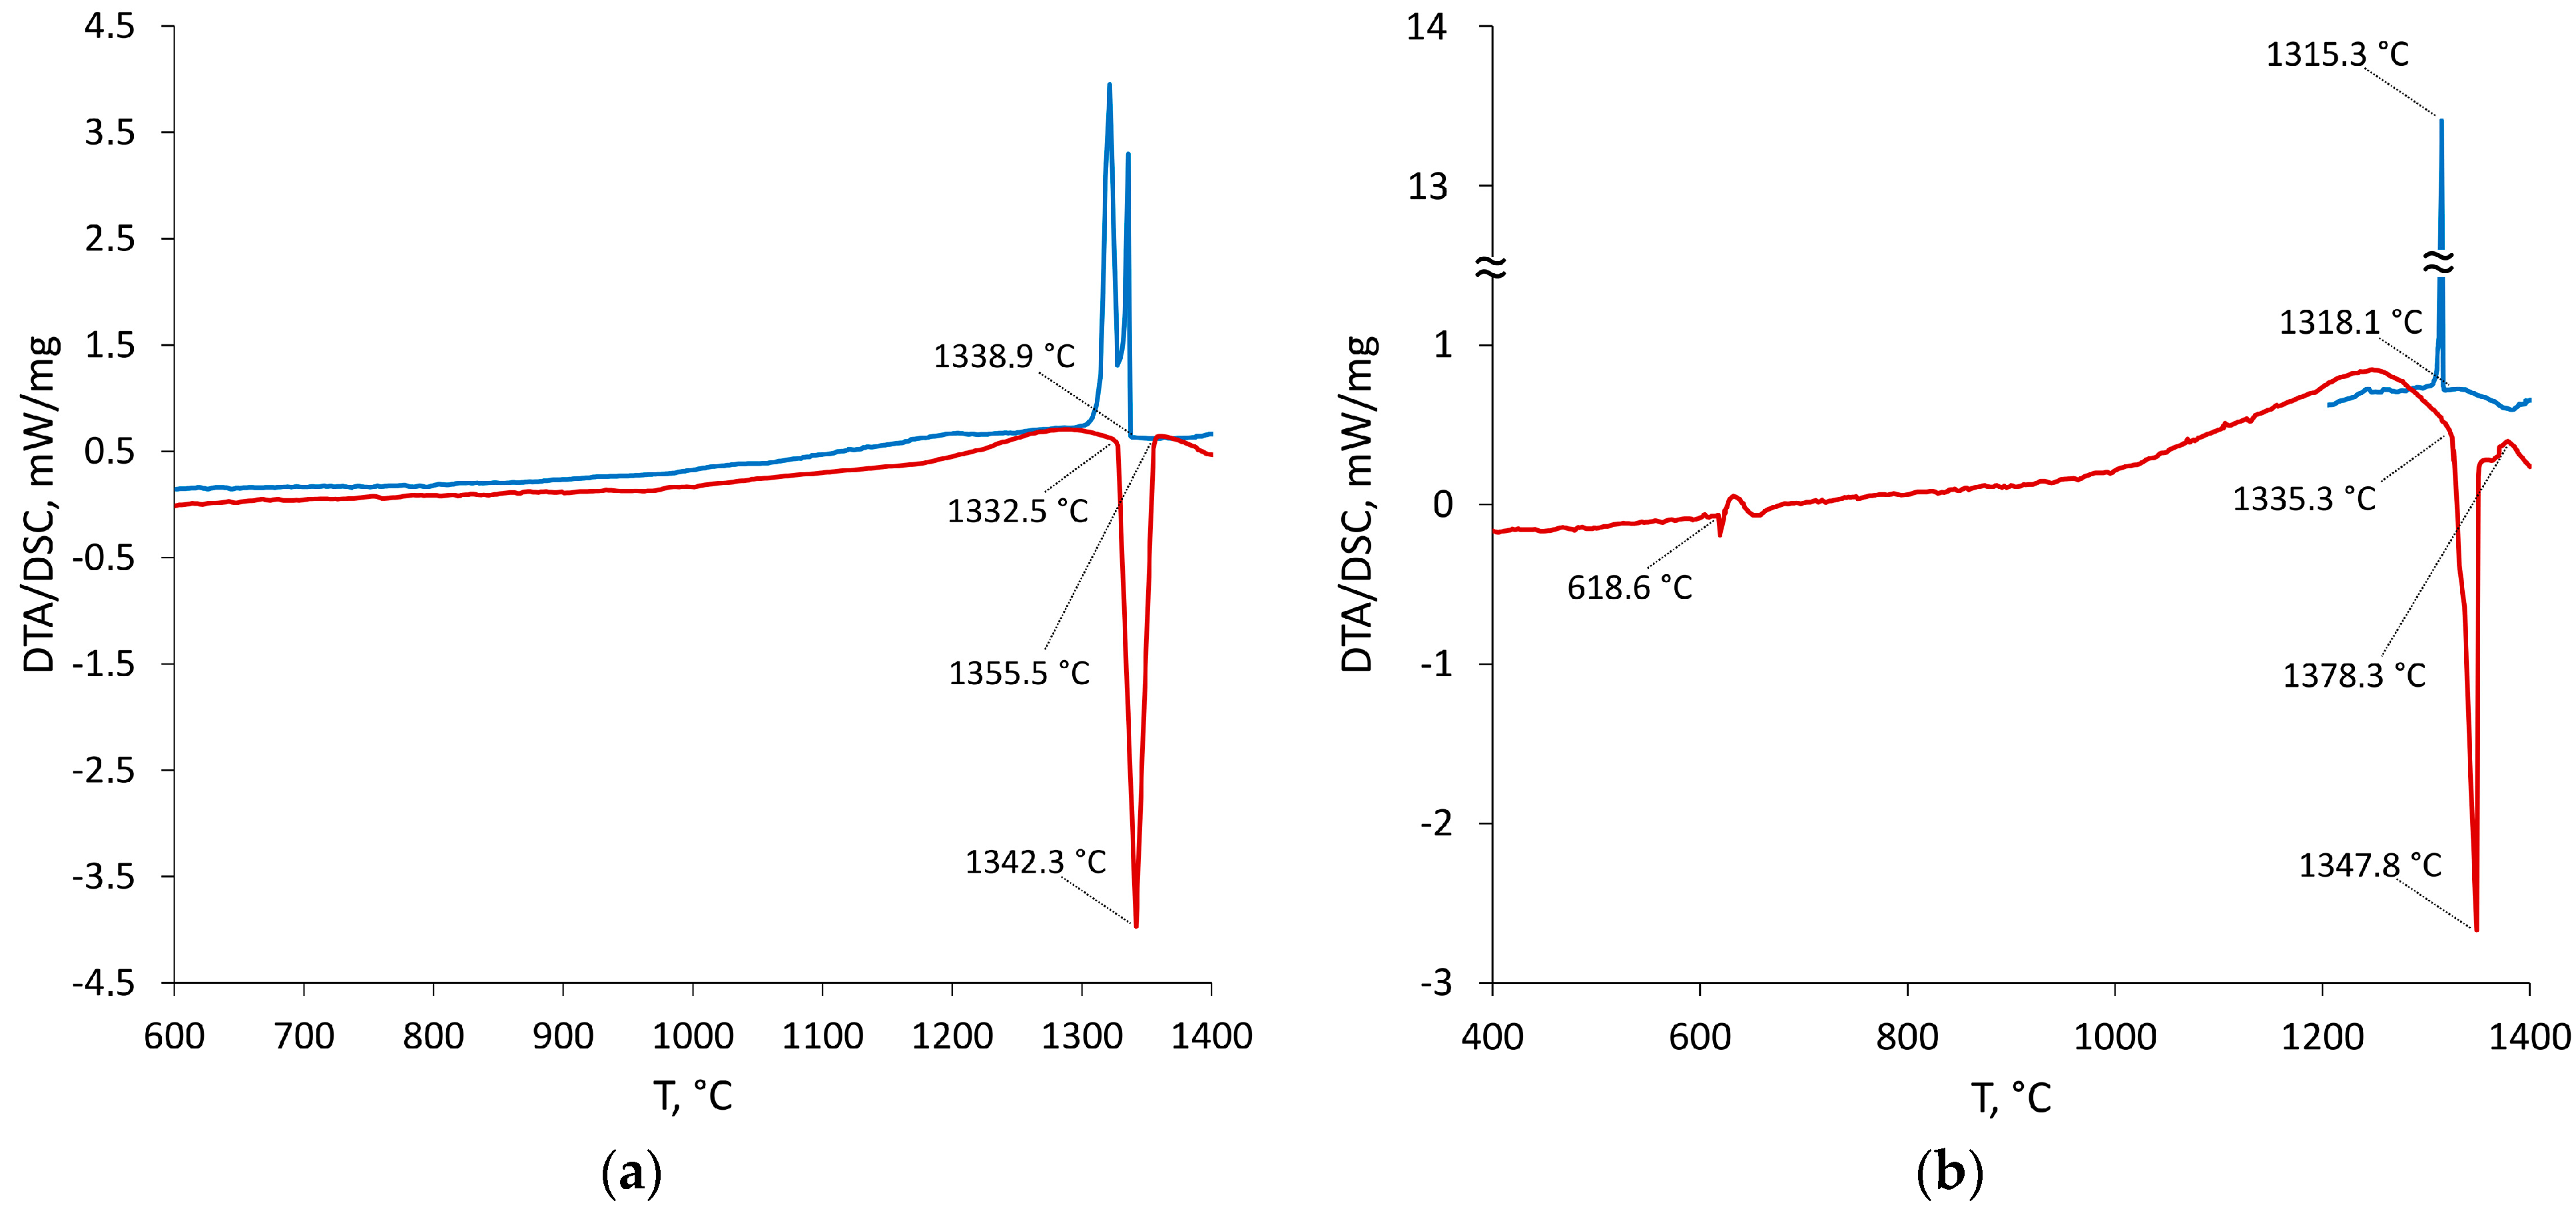
| 2. | α + τ1 | 80.8 | 9.7 | 9.6 | 1342 | 1333 |
| 6 | τ1 | 76.3 | 10.4 | 13.3 | 1378 | 619 1055 1335 |
| 16 | Pd2(InxSn1−x) | 68.5 | 16.0 | 15.5 | 1308 | 1094 1269 |
| 19 | Pd2(InxSn1−x) + Pd20Sn13 | 62.4 | 18.9 | 18.7 | 1278 | 990 1058 1213 |
| Invariant Reactions | Temperature, °C | ||
|---|---|---|---|
| Experiment [30] | Calculated [13] | Calculated, This Work | |
| Liquid = βInPd2 + βInPd3 | 1303 | 1312 | 1305 |
| βInPd2 + βInPd3 = αInPd2 | 1076 | 1076 | 1079 |
| βInPd3 = αInPd2 + αInPd3 | 1059 | 1029 | 1058 |
| Liquid = βInPd3 | 1365 | 1372 | 1365 |
| Liquid = βInPd3 + α | 1357 | 1350 | 1351 |
| βInPd3 + α = αInPd3 βInPd3 = α + αInPd3 | 1223 | 1224 | |
| 1206 | |||
| Phase | Model | Parameter (J/mol) | References |
|---|---|---|---|
| LIQUID | (In, Pd, Sn)1 | 0 = −221,079 + 72.484∙T | [13] |
| 1 = +105,789 − 42.023∙T | [13] | ||
| 2 = −10,272+ 9.982∙T | [13] | ||
| 0 = −711 − 1.6934∙T | [15] | ||
| 1 = −64 − 1.3592∙T | [15] | ||
| 0 = −218,959.83 + 50.86∙T | [19] | ||
| 1 = −132,369.48 + 33.63∙T | [19] | ||
| 2 = −2810.63 − 0.79∙T | [19] | ||
| 3 = +29,608.28 | [19] | ||
| 0 = +202,182 − 58.24∙T | This work, optimized | ||
| 1 = +275,610 − 94.07∙T | This work, optimized | ||
| 2 = +193,130 − 65.45∙T | This work, optimized | ||
| FCC_A1 (α) | (In, Pd, Sn)1(Va)1 | 0 = −209,569 + 64.241∙T | [13] |
| 1 = +108,049 − 44.206∙T | [13] | ||
| 0 = +2500 + 10∙T | This work, estimated | ||
| 0 = −115,000.00 + 57.68∙T | [19] | ||
| 1 = –441,623.62 + 36.16∙T | [19] | ||
| 2 = +223,668.60 | [19] | ||
| 0 = +130,000 | This work, estimated | ||
| BCC_B2 (InPd) | (In, Pd, Sn)0.5(Pd, Va)0.5 | = –70918 + 116.068∙T − 21.968∙T∙ln(T) − 0.00304425∙T2 | [13] |
| = +GBCCPD | [13] | ||
| = +5000 − 0.5∙T + 0.5∙GBCCIN | [13] | ||
| = + | [13] | ||
| = −43,000 + 0.5∙GHSERSN+ 0.5∙GHSERPD | This work, estimated | ||
| = +5000 + 0.5∙GBCCSN | This work, estimated | ||
| 0 = −79,973 + 22.962∙T | [13] | ||
| 1 = +12,078 | [13] | ||
| 0 = −79,973 + 22.962∙T | [13] | ||
| 1 = +12,078 | [13] | ||
| 0 = −1918 | [13] | ||
| 0 = −1918 | [13] | ||
| 0 = −1500 | This work, estimated | ||
| BCT_A5 | (In, Sn)1 | 0 = −5297 + 10.3∙T | This work, optimized |
| TETRAGONAL_A6 | (In, Sn)1 | 0 = +743 − 3.3139∙T | [15] |
| 1 = −1487 | [15] | ||
| TET_ALPHA1 (β) | (In, Sn)1 | 0 = −1003–2.4∙T | This work, optimized |
| 1 = −406 + 0.479∙T | This work, optimized | ||
| In7Pd3 | (In, Sn)0.71(Pd)0.29 | = −48,676 + 126.534∙T − 25.3376∙T∙ln(T) | [13] |
| = −30,000 + 0.71∙GHSERSN +0.29∙GHSERPD | This work, estimated | ||
| In3Pd2 | (In)0.6(Pd)0.4 | = −63,165 + 109.678∙T − 0.00436412∙T2 − 21.1993∙T∙ln(T) | [13] |
| In3Pd5 | (In)0.375(Pd)0.625 | = −67,420 + 118.289∙T − 0.00328628∙T2 − 22.1055∙T∙ln(T) | [13] |
| βInPd2 | (In)0.34(Pd)0.66 | = −58,730 + 13.885∙T + 0.34∙GHSERIN + 0.66∙GHSERPD | [13] |
| βInPd3 (τ1) | (In, Pd, Sn)0.26(Pd)0.74 | = −53,225.4 + 13.153∙T + 0.26∙GHSERIN + 0.74∙GHSERPD | This work, optimized |
| = +425 + GHSERPD | This work, estimated | ||
| = −63,000 + 172.71∙T–30.2744878∙T∙ln(T) + 131,596.913∙T−1 + 0.0023214421∙T2 − 9.236∙10−7∙T3 | This work, estimated | ||
| 0 = −1387.7 | This work, optimized | ||
| 0 = −17,450 + 5.75∙T | This work, estimated | ||
| 1 = +5000 | This work, estimated | ||
| 2 = −5058 − 3.1∙T | This work, estimated | ||
| 0 = −28,996 + 6.9∙T | This work, estimated | ||
| 1 = +24,000 | This work, estimated | ||
| αInPd3 | (In, Sn)0.25(Pd)0.75 | = –54,212 + 14.320∙T + 0.25∙GHSERIN + 0.75∙GHSERPD | [13] |
| = −65,000 + 172.71∙T–30.2744878∙T∙ln(T) + 131,596.913∙T−1 + 0.0023214421∙T2 − 9.236∙10−7∙T3 | This work, estimated | ||
| Pd3Sn | (In, Pd, Sn)0.75(In, Pd, Sn)0.25 | = +5000 + GHSERIN | This work, estimated |
| = +5000 + 0.75∙GHSERIN + 0.25∙GHSERPD | This work, estimated | ||
| = +0.75∙GHSERIN + 0.25∙GHSERSN | This work, estimated | ||
| = −53,712 + 14.320∙T + 0.25∙GHSERIN + 0.75∙GHSERPD | This work, estimated | ||
| = +5000 + GHSERPD | [19] | ||
| = −67,551.69 + 172.71∙T − 30.2744878∙T∙ln(T) + 131596.913∙T−1 + 0.0023214421∙T2 − 9.236∙10−7∙T3 | [19] | ||
| = +0.75∙GHSERSN + 0.25∙GHSERIN | [19] | ||
| = +5000 + 0.75∙GHSERSN + 0.25∙GHSERPD | [19] | ||
| = +5000 + GHSERSN | [19] | ||
| 0 = −18,811.83 + 5.7∙T | [19] | ||
| Pd2(InxSn1–x) | (Pd)0.667(In, Sn)0.333 | = −65,890 + 121.070∙T − 0.00260306∙T2 − 22.5322∙T∙ln(T) | [13] |
| = −72,964 + 162.34∙T − 29.4108924∙T∙ln(T) + 108,177.878∙T−1 + 0.0064877∙T2 − 2.163328∙10−6∙T3 | This work, estimated | ||
| 0 = –2500 | This work, estimated | ||
| γ–Pd2–xSn | (Pd)1(Sn)1(Pd, Va)1 | = −186,900.46 + 29.32∙T + 2∙GHSERPD + GHSERSN | [19] |
| = −111,949.47 + 24.44∙T +GHSERPD + GHSERSN | [19] | ||
| 0 = −11,461.63 | [19] | ||
| 1 = −21,904.12 | [19] | ||
| Pd20Sn13 | (In, Pd, Sn)0.6(In, Pd, Sn)0.4 | = +5000 + 0.6∙GHSERIN + 0.4∙GHSERPD | This work, estimated |
| = −62,800 + 18∙T + 0.6∙GHSERPD + 0.4∙GHSERIN | This work, estimated | ||
| = +5000 + GHSERPD | [19] | ||
| = −64,648.47 + 11.22∙T + 0.6∙GHSERPD + 0.4∙GHSERSN | [19] | ||
| = +5000 + 0.6∙GHSERSN + 0.4∙GHSERPD | [19] | ||
| = +5000 + GHSERSN | [19] | ||
| 0 = −67,298.65 + 41.95∙T | [19] | ||
| 1 = +10,657.92 + 21.09∙T | [19] | ||
| 0 = −33,166.40 + 14.45∙T | [19] | ||
| PdSn | (Pd, Va)0.5(In, Pd, Sn)0.5 | = +5000 + GHSERPD | [19] |
| = +8000 + 0.5∙GHSERPD | [19] | ||
| = +15,000 + 0.5∙GHSERSN | [19] | ||
| = −68,723.03 + 147.77∙T − 27.1668054∙T∙ln(T) + 59,595.362∙T−1+ 0.00200199∙T2 − 1.3∙10−6∙T3 | [19] | ||
| = −65,325 + 25∙T + 0.5∙GHSERPD + 0.5∙GHSERIN | This work, estimated | ||
| = +5000 + 0.5∙GHSERIN | This work, estimated | ||
| 0 = −45,236.19 + 1.84∙T | [19] | ||
| 0 = −11,203.70 + 3.84∙T | [19] | ||
| Pd5Sn7 | (Pd)5(Sn)7 | = −645,800 + 132.53∙T + 5∙GHSERPD + 7∙GHSERSN | [19] |
| PdSn2 | (Pd, Sn)1(In, Sn)2 | = −155,217.39 + 416.13∙T–80.5563671∙T∙ln(T) + 173,251.065∙T−1 + 0.00866748∙T2 − 4.5∙10−6∙T3 | [19] |
| = +15,000 + 3∙GHSERSN | [19] | ||
| = −102,000 + GHSERPD + 2∙GHSERIN | This work, estimated | ||
| = +5000 + GHSERSN + 2∙GHSERIN | This work, estimated | ||
| 0 = −6001.20 + 5.25∙T | [19] | ||
| PdSn3 | (Pd)0.25(Pd, Sn)0.75 | = +6000 + GHSERPD | [19] |
| = −42,780.00 + 143.67∙T − 27.528975∙T∙ln(T) + 57076.482∙T−1 + 0.00131302∙T2 − 1.5∙10–6∙T3 | [19] | ||
| 0 = −64,266.34 + 6.29∙T | [19] | ||
| 1 = +54,238.32 − 6.29∙T | [19] | ||
| PdSn4 | (Pd)0.2(Pd, Sn)0.8 | = +5000 + GHSERPD | [19] |
| = −35,467.77 + 106.19∙T − 21.371054∙T∙ln(T) + 10943.604∙T−1 − 0.00783969∙T2 | [19] | ||
| 0 = −61,437.17 + 7.44∙T | [19] | ||
| 1 = +51,394.09 + 7.44∙T | [19] | ||
| αPd3Sn2 | (Pd)0.6(Sn)0.4 | = −64,735 + 11.99∙T + 0.6∙GHSERPD + 0.4∙GHSERSN | [19] |
| βPd3Sn2 | (Pd)0.6(Sn)0.4 | = −64,603.46 + 11.83∙T + 0.6∙GHSERPD + 0.4∙GHSERSN | [19] |
| δPd3Sn2 | (Pd)0.59(Sn)0.41 | = −64,196.15 + 11.05∙T + 0.59∙GHSERPD +0.41∙GHSERSN | [19] |
| INSN_GAMMA (γ) | (In, Sn)1 | = +10,292.5 − 7.64∙T + GHSERIN | [15] |
| = +925.3 − 1.7562∙T + GHSERSN | [15] | ||
| = −15,715.5 + 19.3402∙T | [15] |
Disclaimer/Publisher’s Note: The statements, opinions and data contained in all publications are solely those of the individual author(s) and contributor(s) and not of MDPI and/or the editor(s). MDPI and/or the editor(s) disclaim responsibility for any injury to people or property resulting from any ideas, methods, instructions or products referred to in the content. |
© 2023 by the authors. Licensee MDPI, Basel, Switzerland. This article is an open access article distributed under the terms and conditions of the Creative Commons Attribution (CC BY) license (https://creativecommons.org/licenses/by/4.0/).
Share and Cite
Pavlenko, A.S.; Kabanova, E.G.; Kareva, M.A.; Ptashkina, E.A.; Kustov, A.L.; Zhmurko, G.P.; Kuznetsov, V.N. Phase Equilibria of the In–Pd–Sn System at 500 °C and 800 °C: Experimental Study and CALPHAD Modeling. Materials 2023, 16, 1690. https://doi.org/10.3390/ma16041690
Pavlenko AS, Kabanova EG, Kareva MA, Ptashkina EA, Kustov AL, Zhmurko GP, Kuznetsov VN. Phase Equilibria of the In–Pd–Sn System at 500 °C and 800 °C: Experimental Study and CALPHAD Modeling. Materials. 2023; 16(4):1690. https://doi.org/10.3390/ma16041690
Chicago/Turabian StylePavlenko, Alexandr S., Elizaveta G. Kabanova, Maria A. Kareva, Evgeniya A. Ptashkina, Alexander L. Kustov, Galina P. Zhmurko, and Victor N. Kuznetsov. 2023. "Phase Equilibria of the In–Pd–Sn System at 500 °C and 800 °C: Experimental Study and CALPHAD Modeling" Materials 16, no. 4: 1690. https://doi.org/10.3390/ma16041690
APA StylePavlenko, A. S., Kabanova, E. G., Kareva, M. A., Ptashkina, E. A., Kustov, A. L., Zhmurko, G. P., & Kuznetsov, V. N. (2023). Phase Equilibria of the In–Pd–Sn System at 500 °C and 800 °C: Experimental Study and CALPHAD Modeling. Materials, 16(4), 1690. https://doi.org/10.3390/ma16041690