
Laser Welding Penetration Monitoring Based on Time-Frequency Characterization of Acoustic Emission and CNN-LSTM Hybrid Network


 , ,
, ,  and
and 
Abstract
1. Introduction
- (1)
- Acoustic emission monitoring
- (2)
- Machine learning modeling
- Through investigating the correlations between the transient nature of the subsurface keyhole and the acoustic signals, the AE technique could better characterize the keyhole dynamics and weld penetration. It will also provide important guidance for understanding the complicated interaction mechanisms between the pulsed laser radiation and aluminum alloy and can be extended to other laser-based manufacturing scenarios.
- In contrast to traditional time- or frequency-domain processing for non-stationary AE signals, an adaptive time-frequency technique called VMD was proposed, which can accurately distinguish between low-frequency and high-frequency components for better describing the weld penetration.
- A novel CNN-LSTM hybrid model was proposed to deeply mine the spatial and temporal acoustic features from the extracted frequency components. It can improve the penetration predicting performance of AE sensing and provide a potential and reliable monitoring technology for the dynamic laser welding process.
2. Methodical Approach
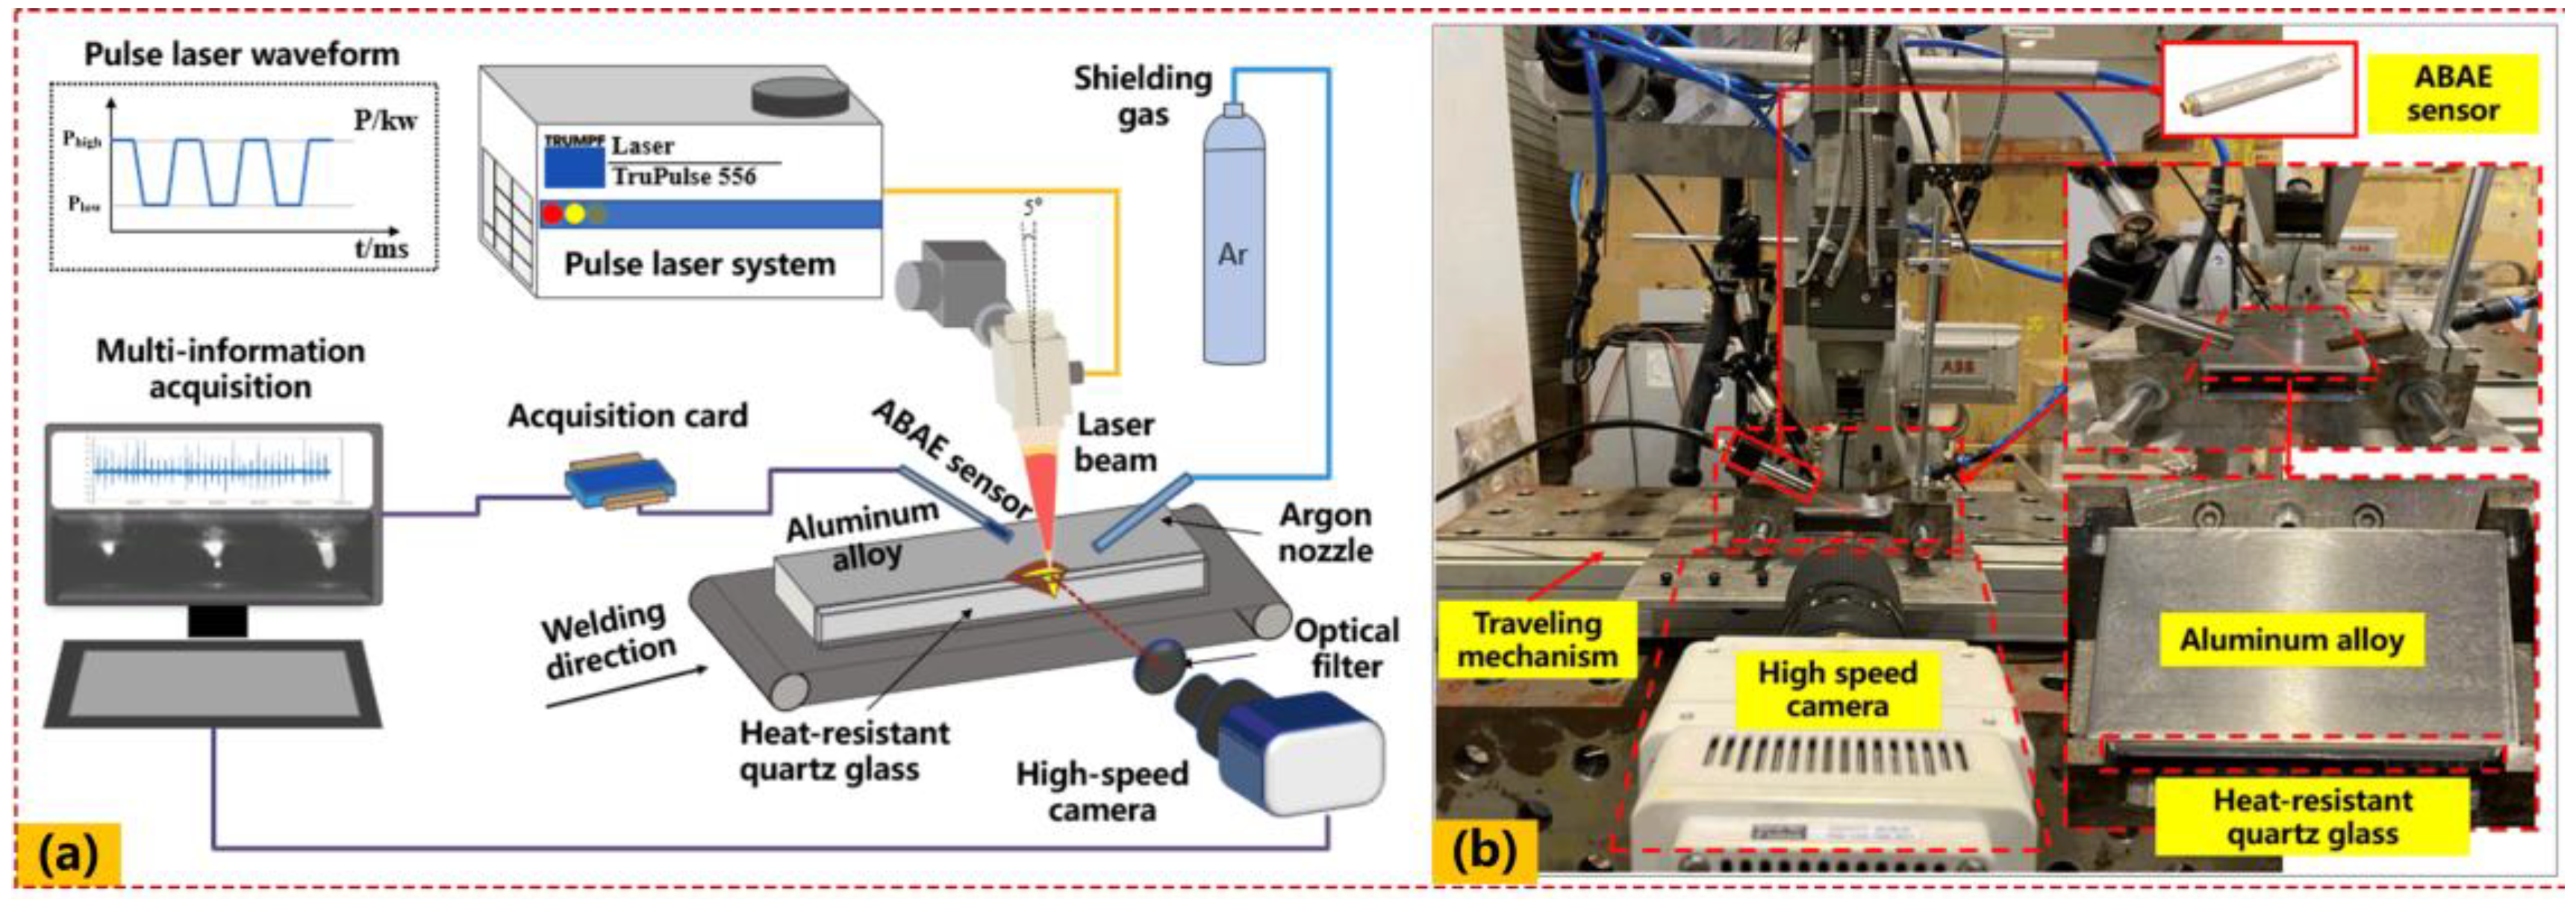
2.1. Experimental Setup and Data Acquisition
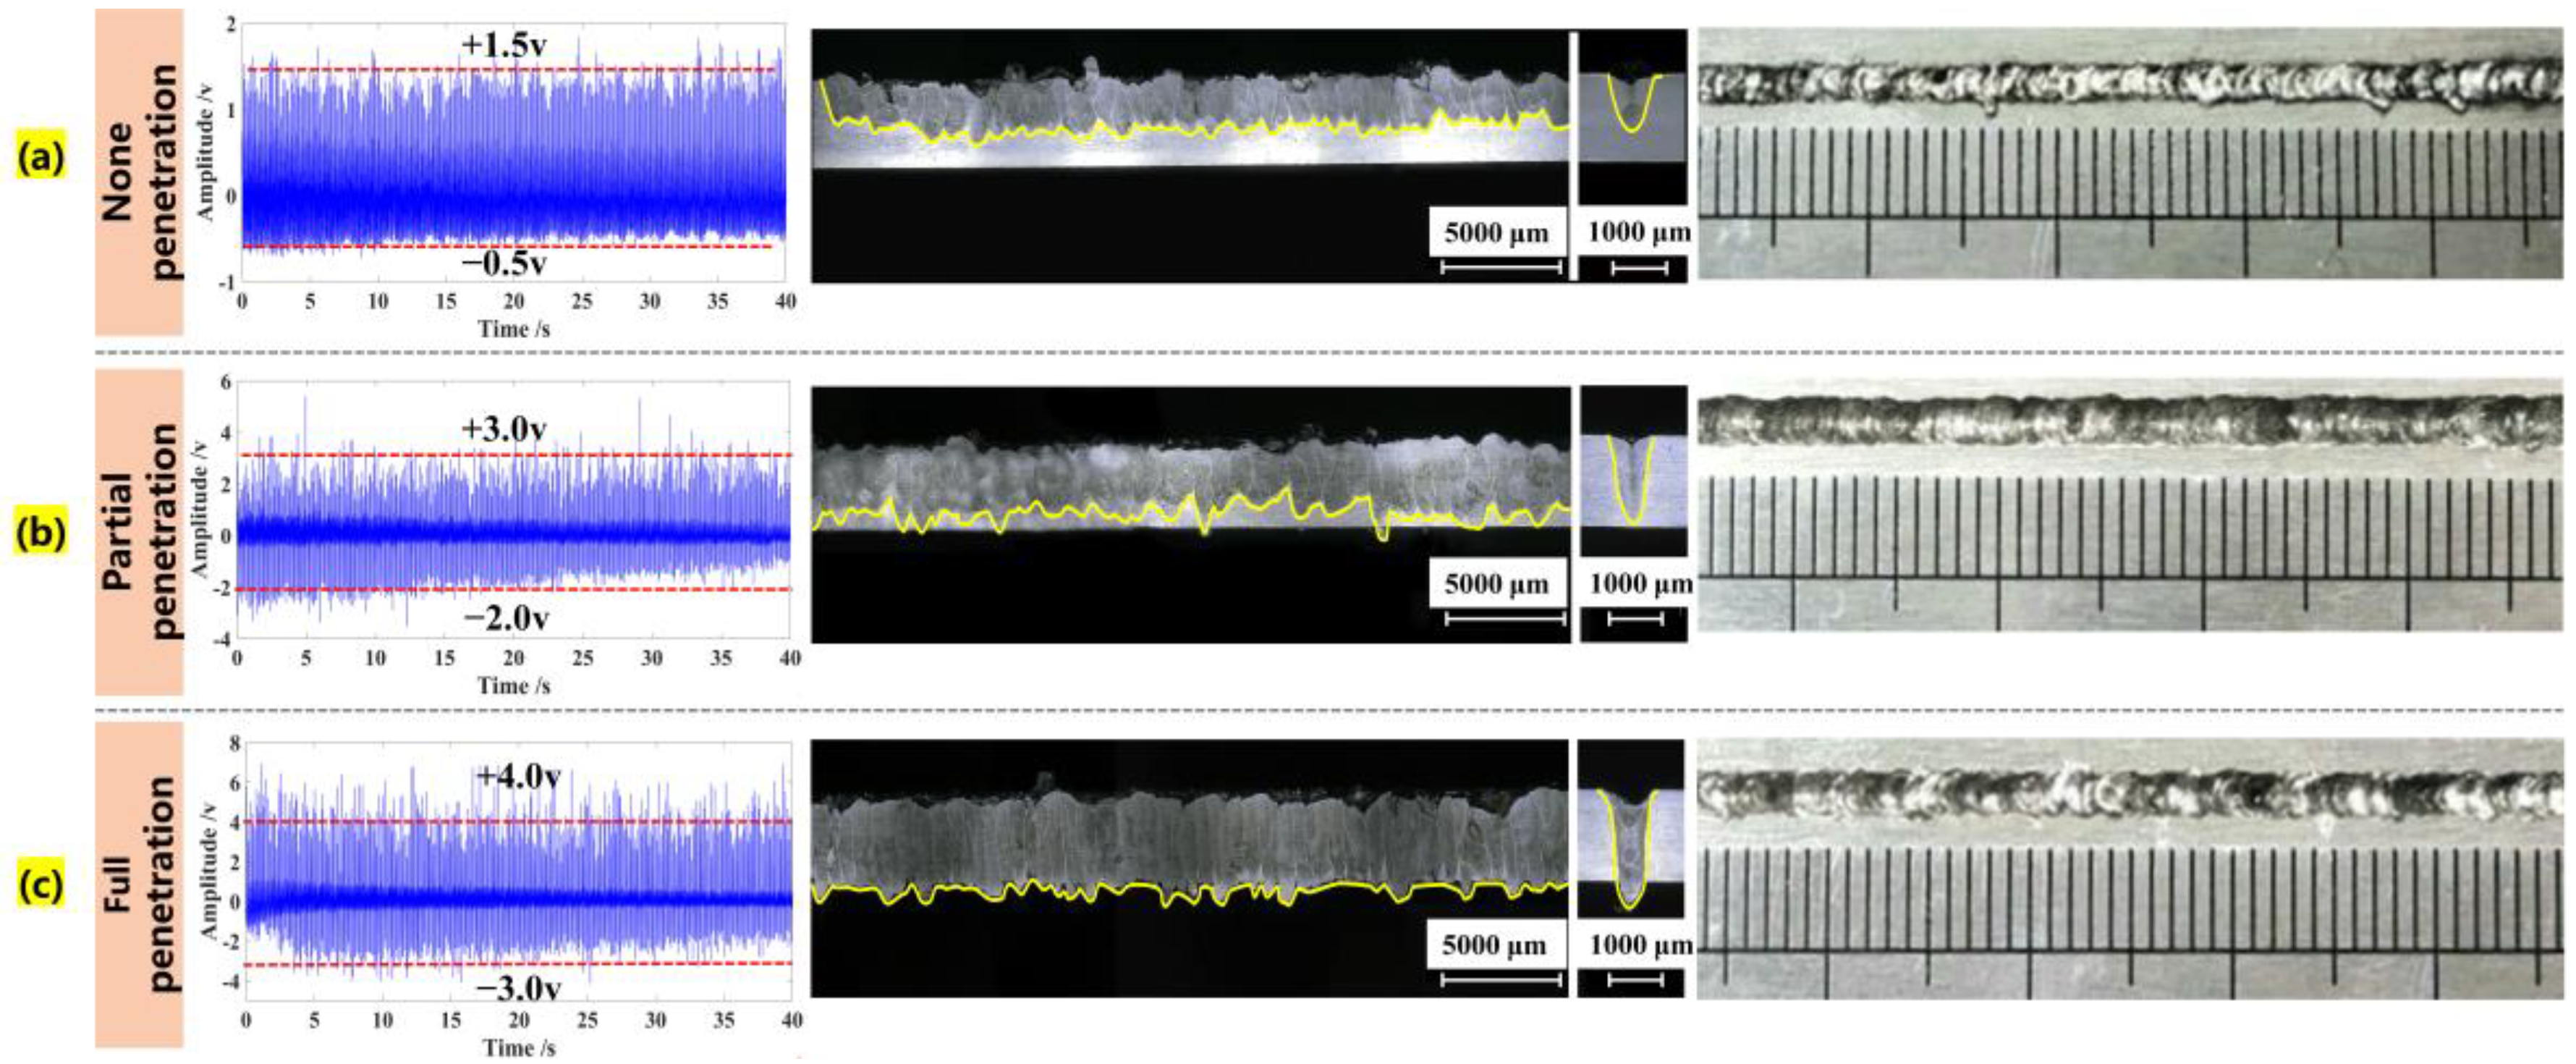
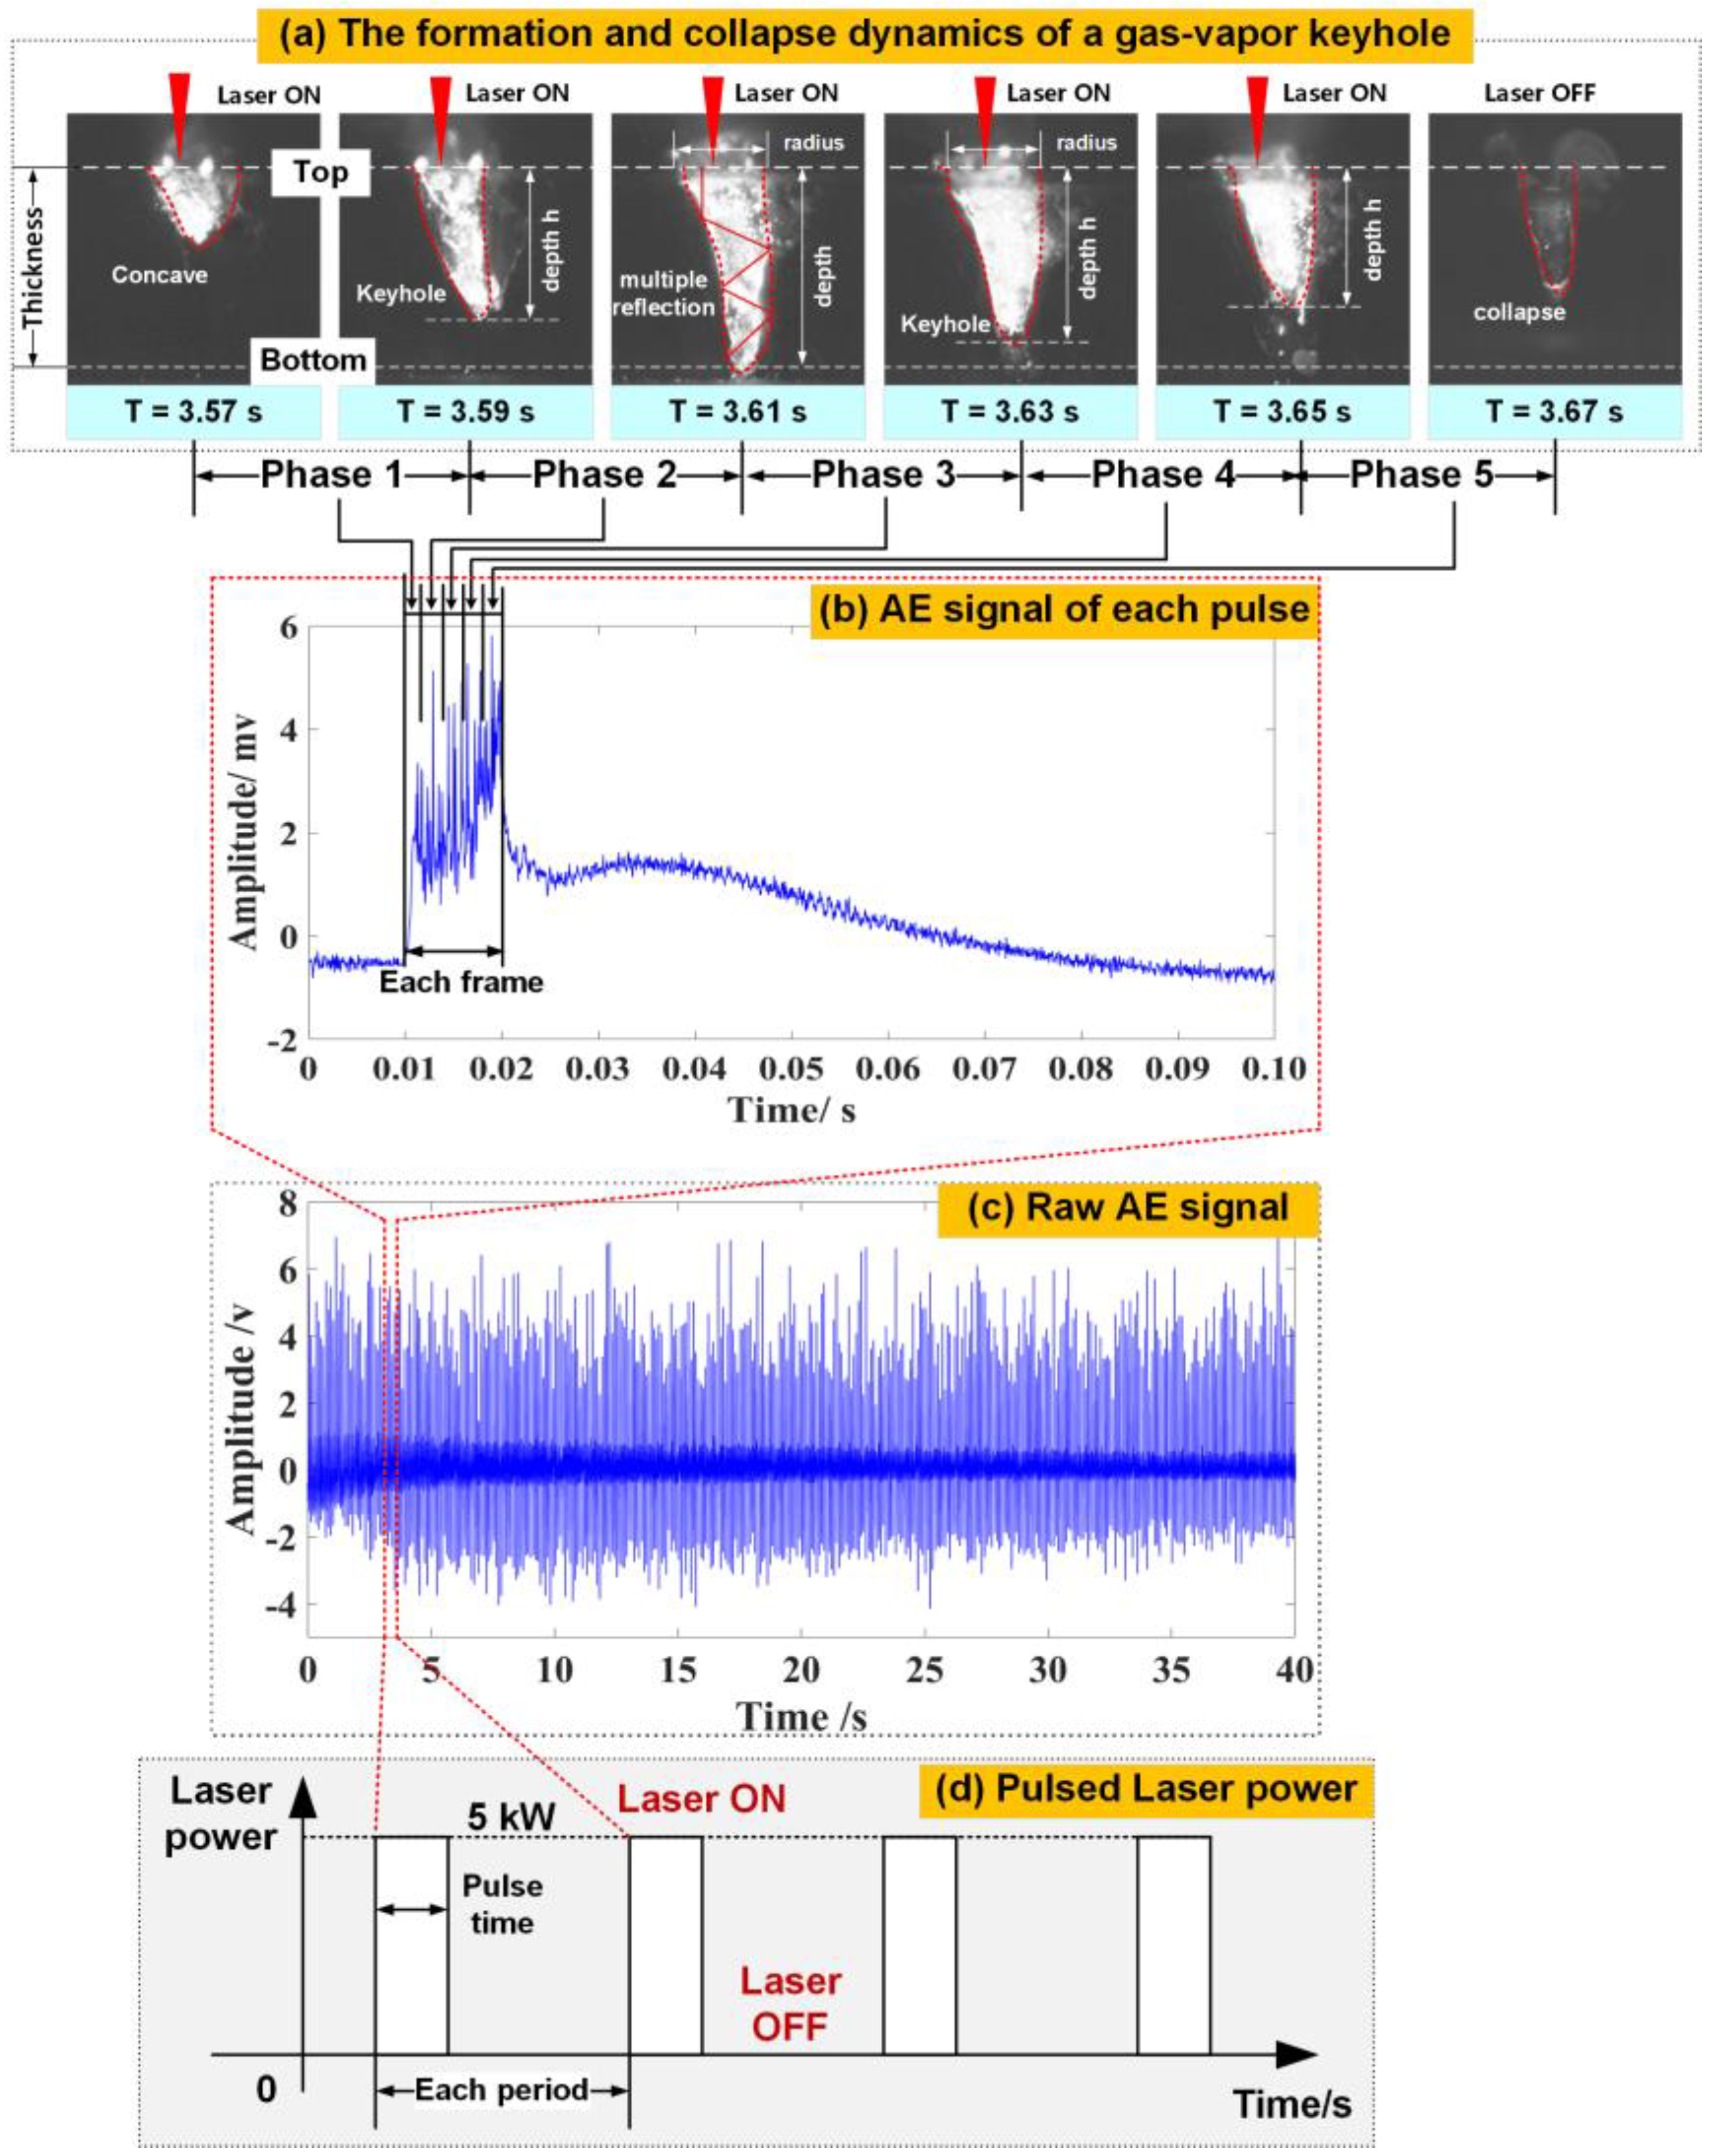
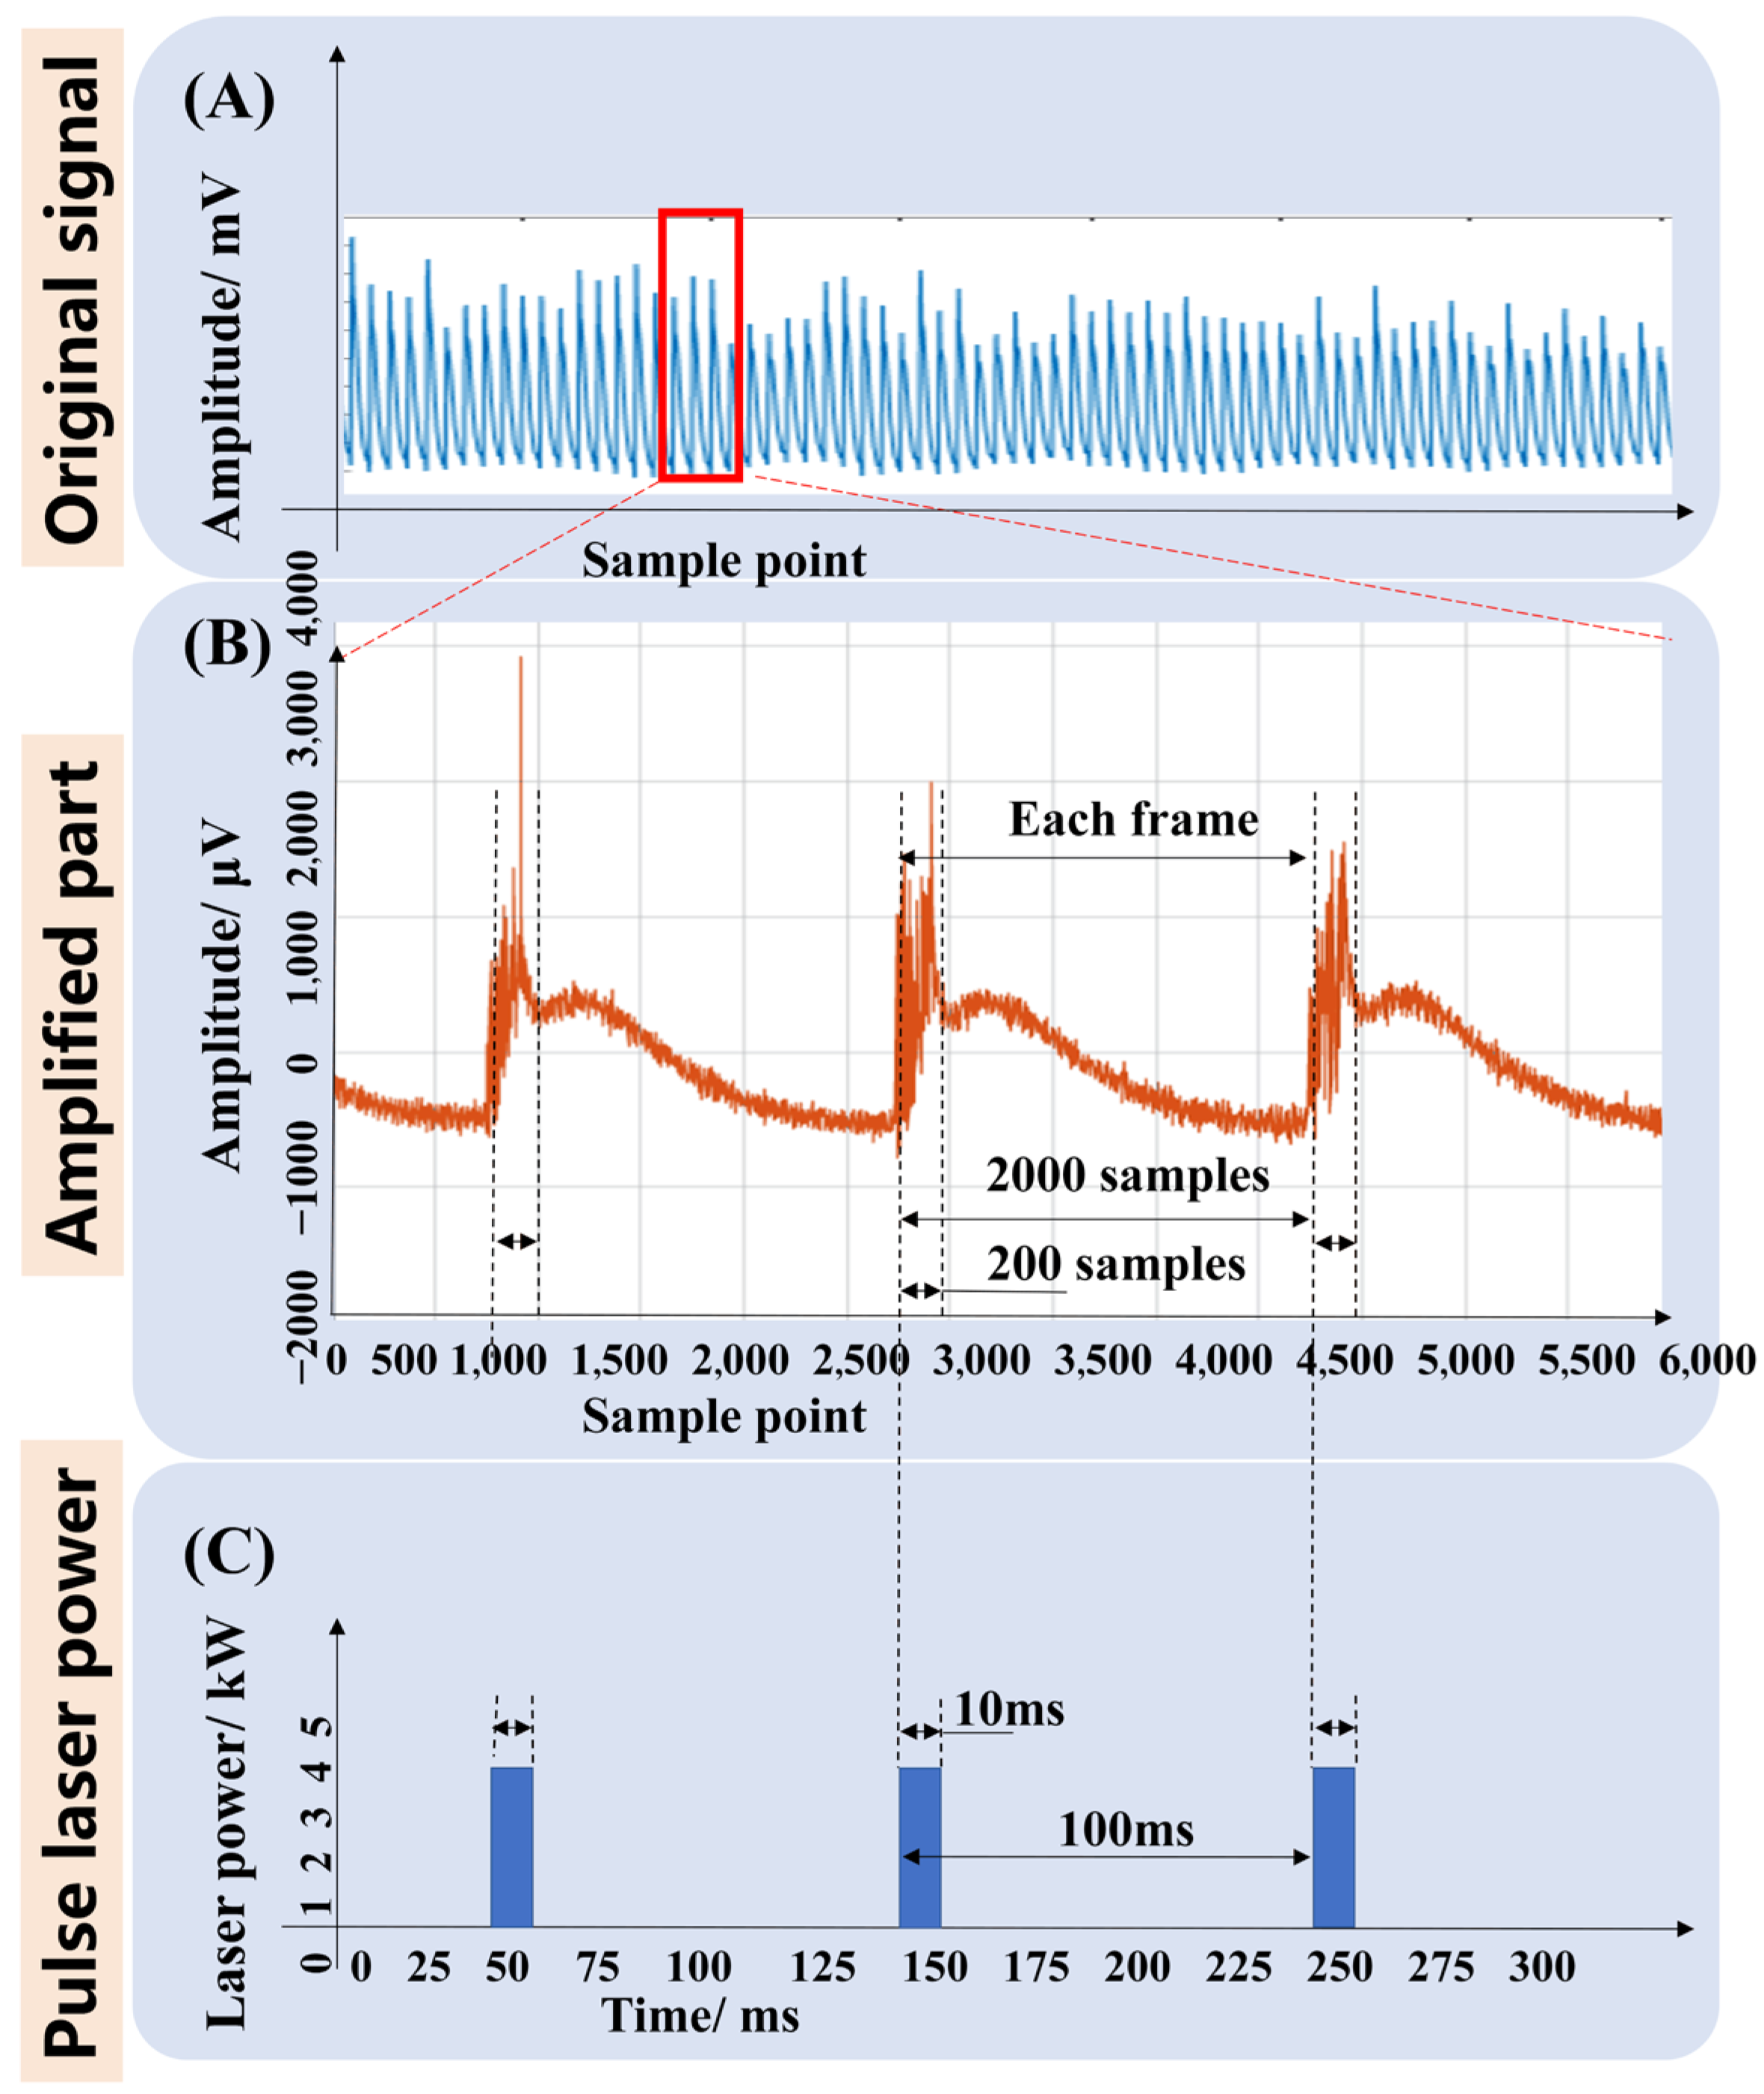
2.2. Detected AE Signals and Process Analysis
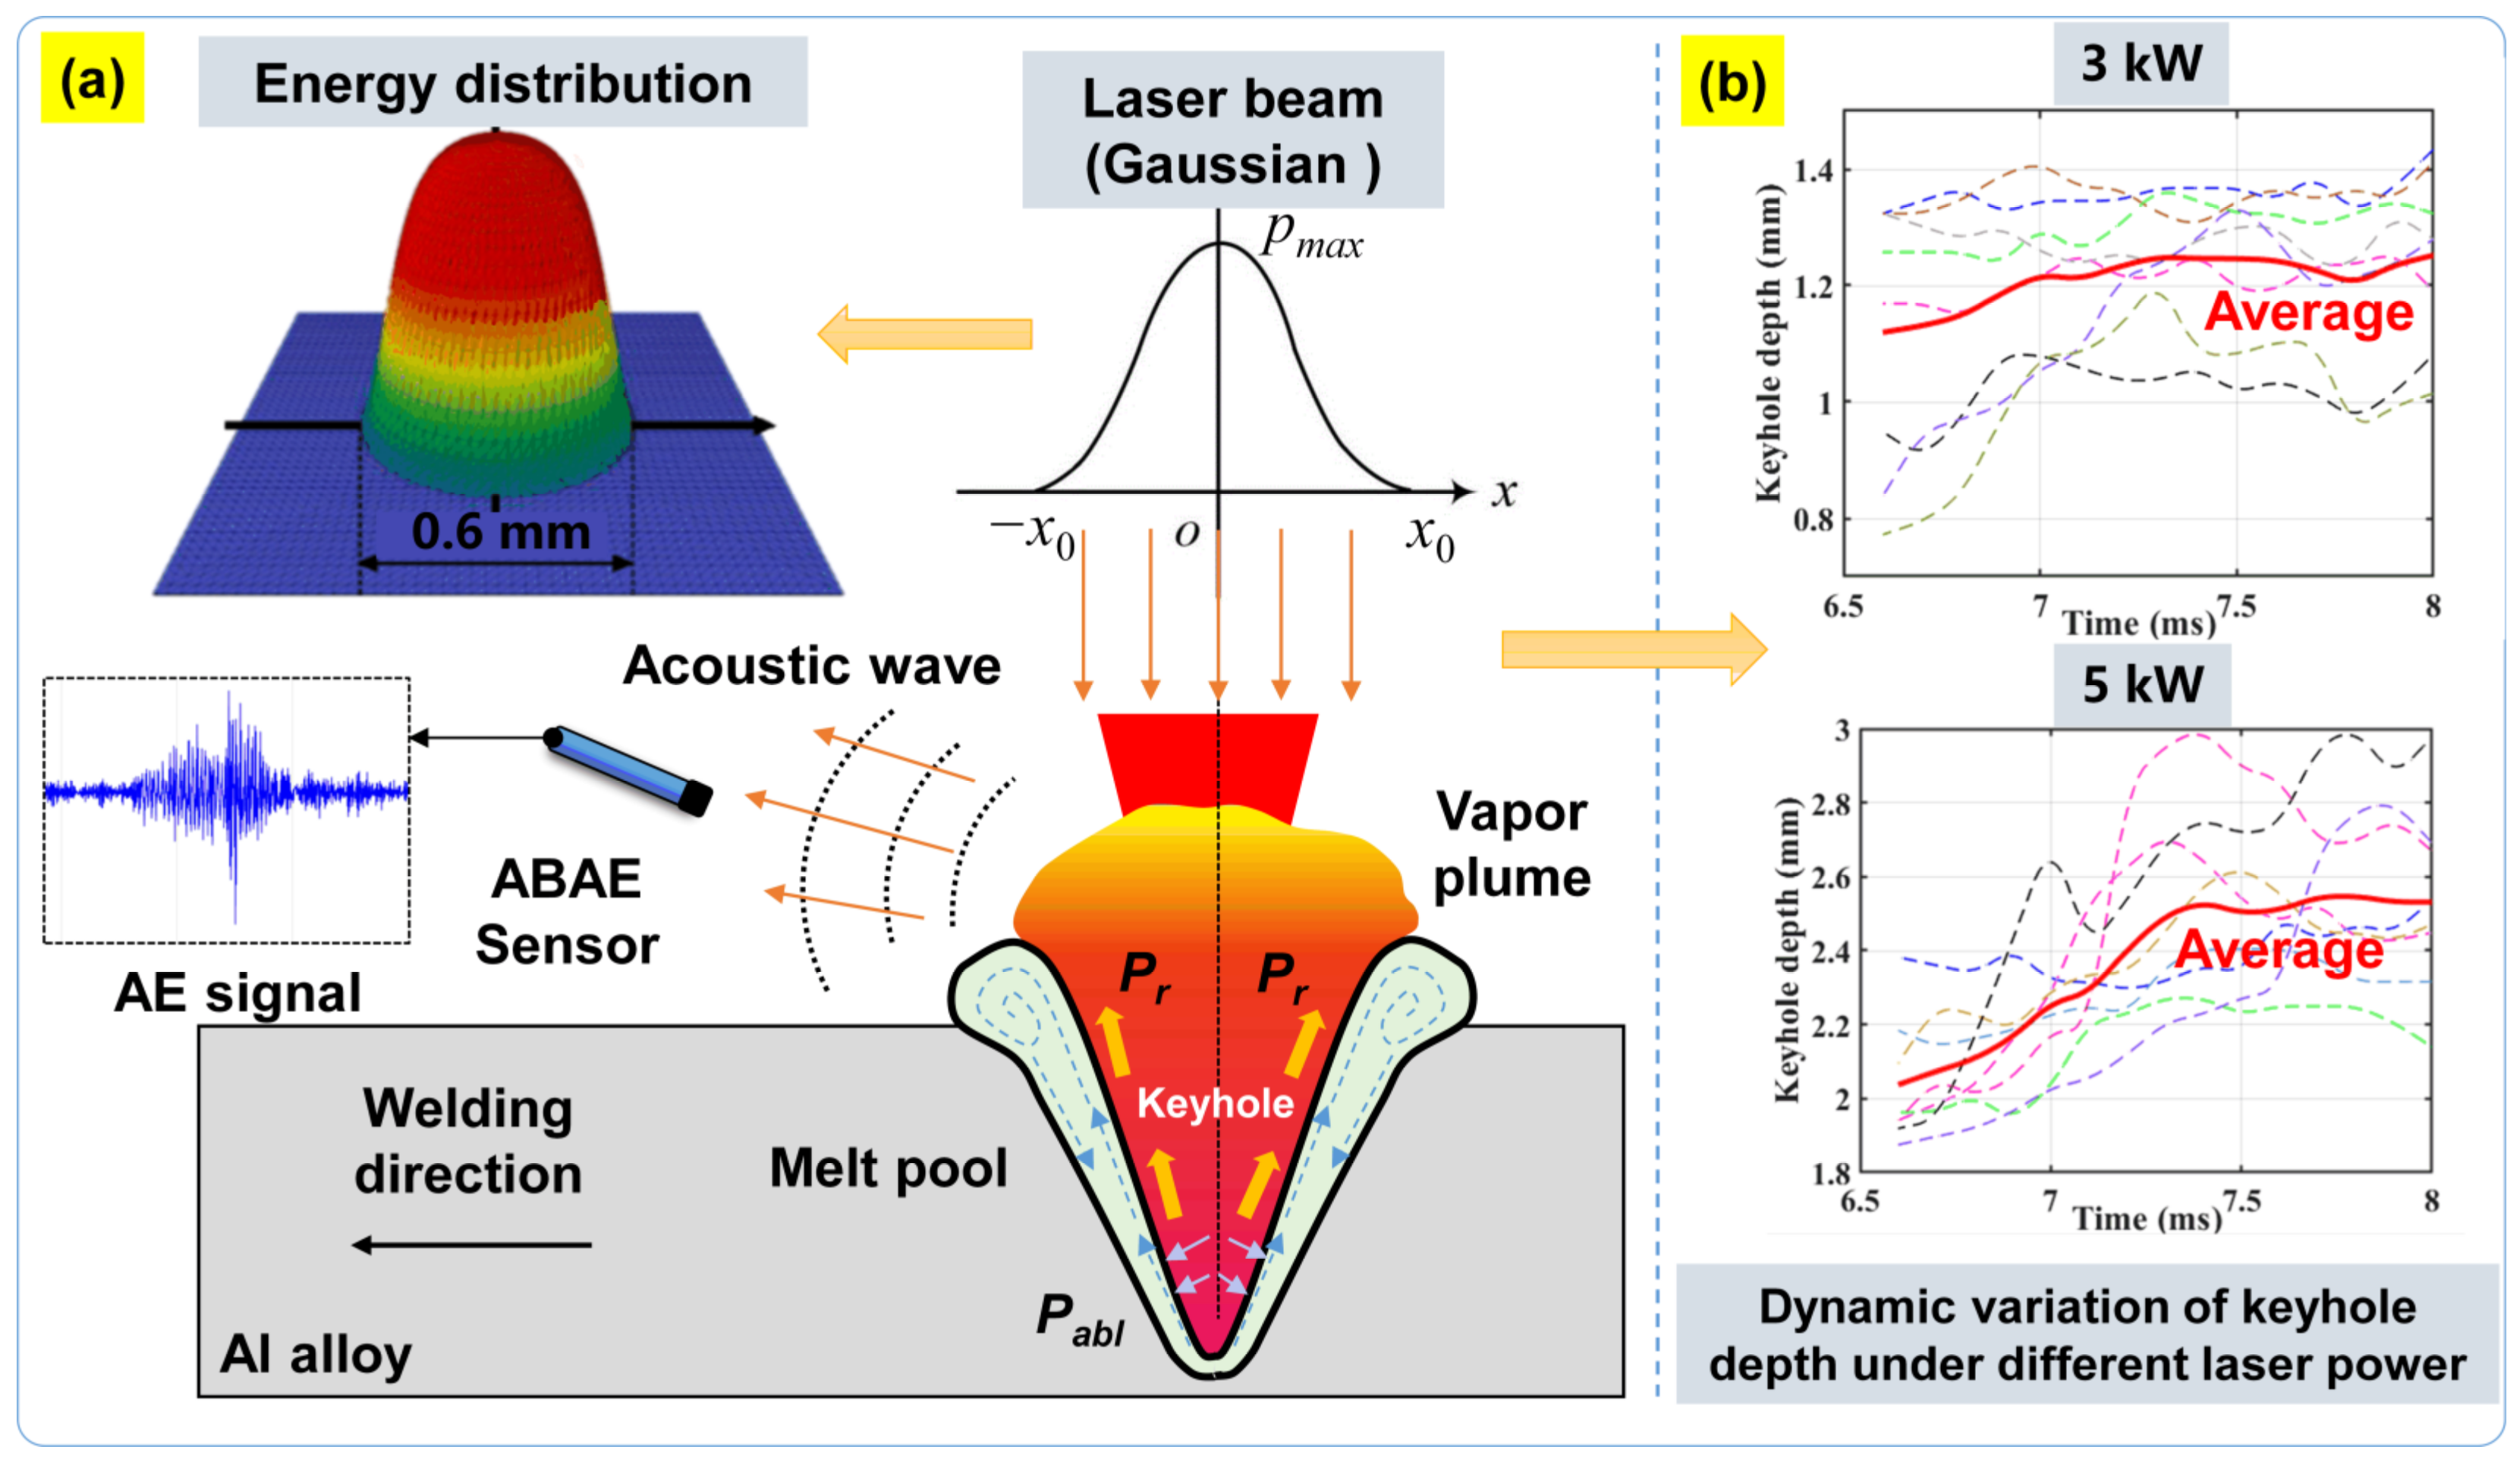
2.3. Generation Mechanism of Acoustic Wave
2.4. Time-Frequency Analysis of AE Signals
3. VMD-Based Frequency Component Extraction
4. The Proposed Spatio-Temporal CNN-LSTM Model
4.1. CNN Framework
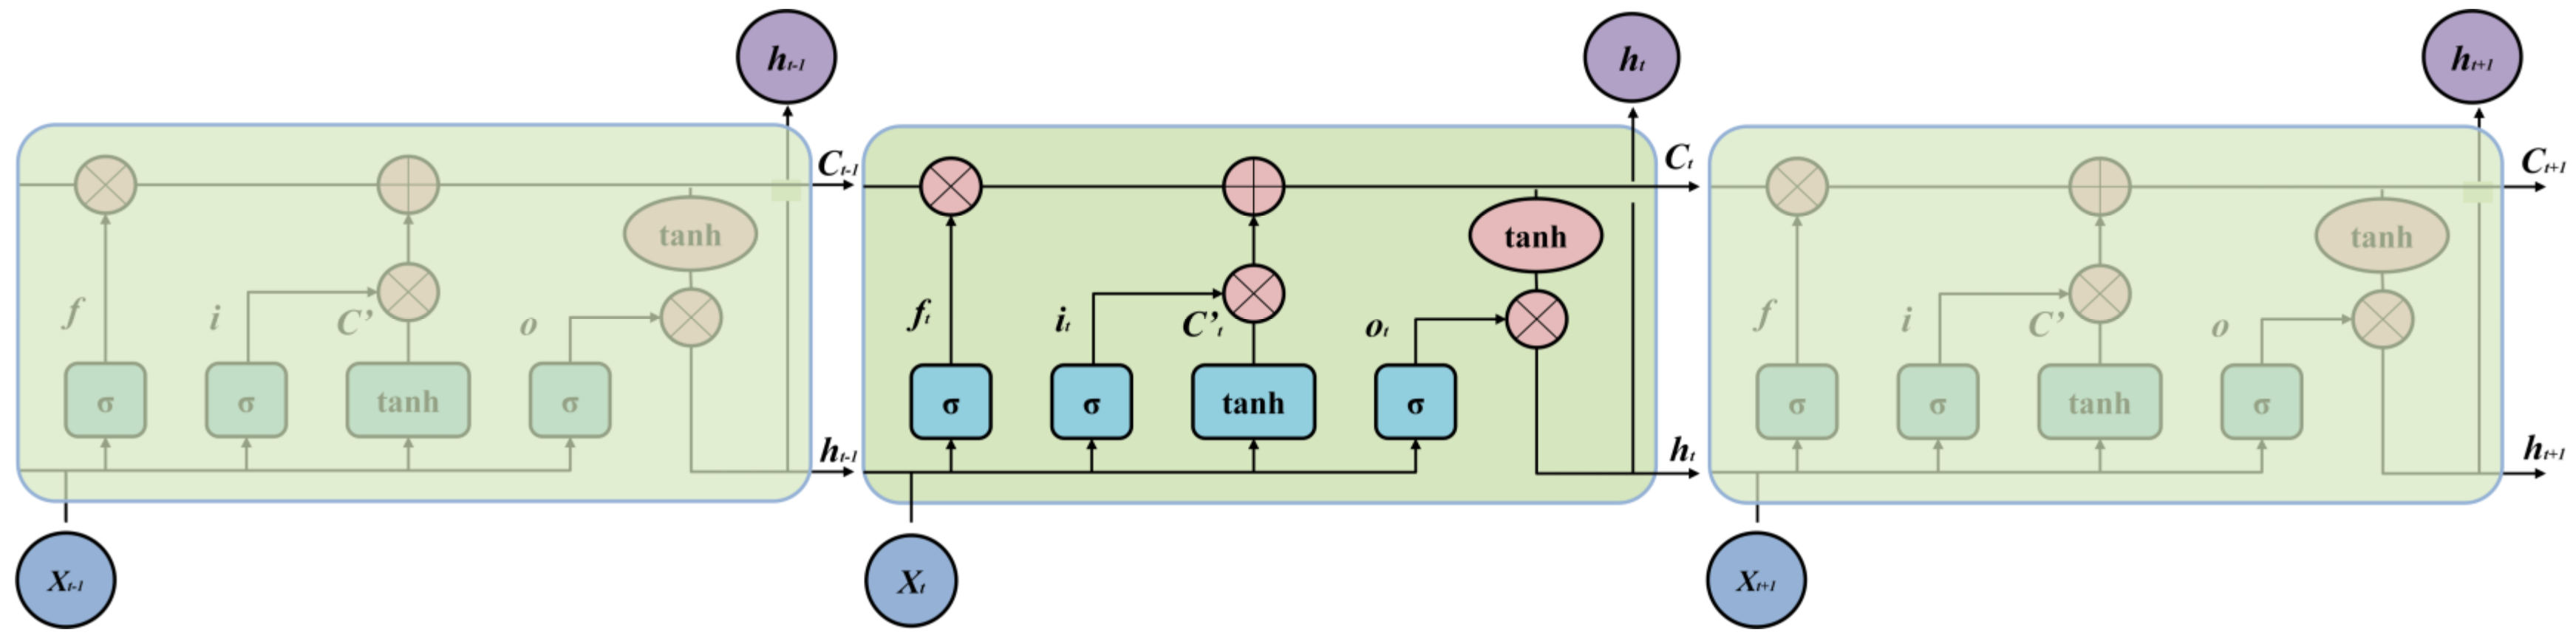
4.2. LSTM Framework
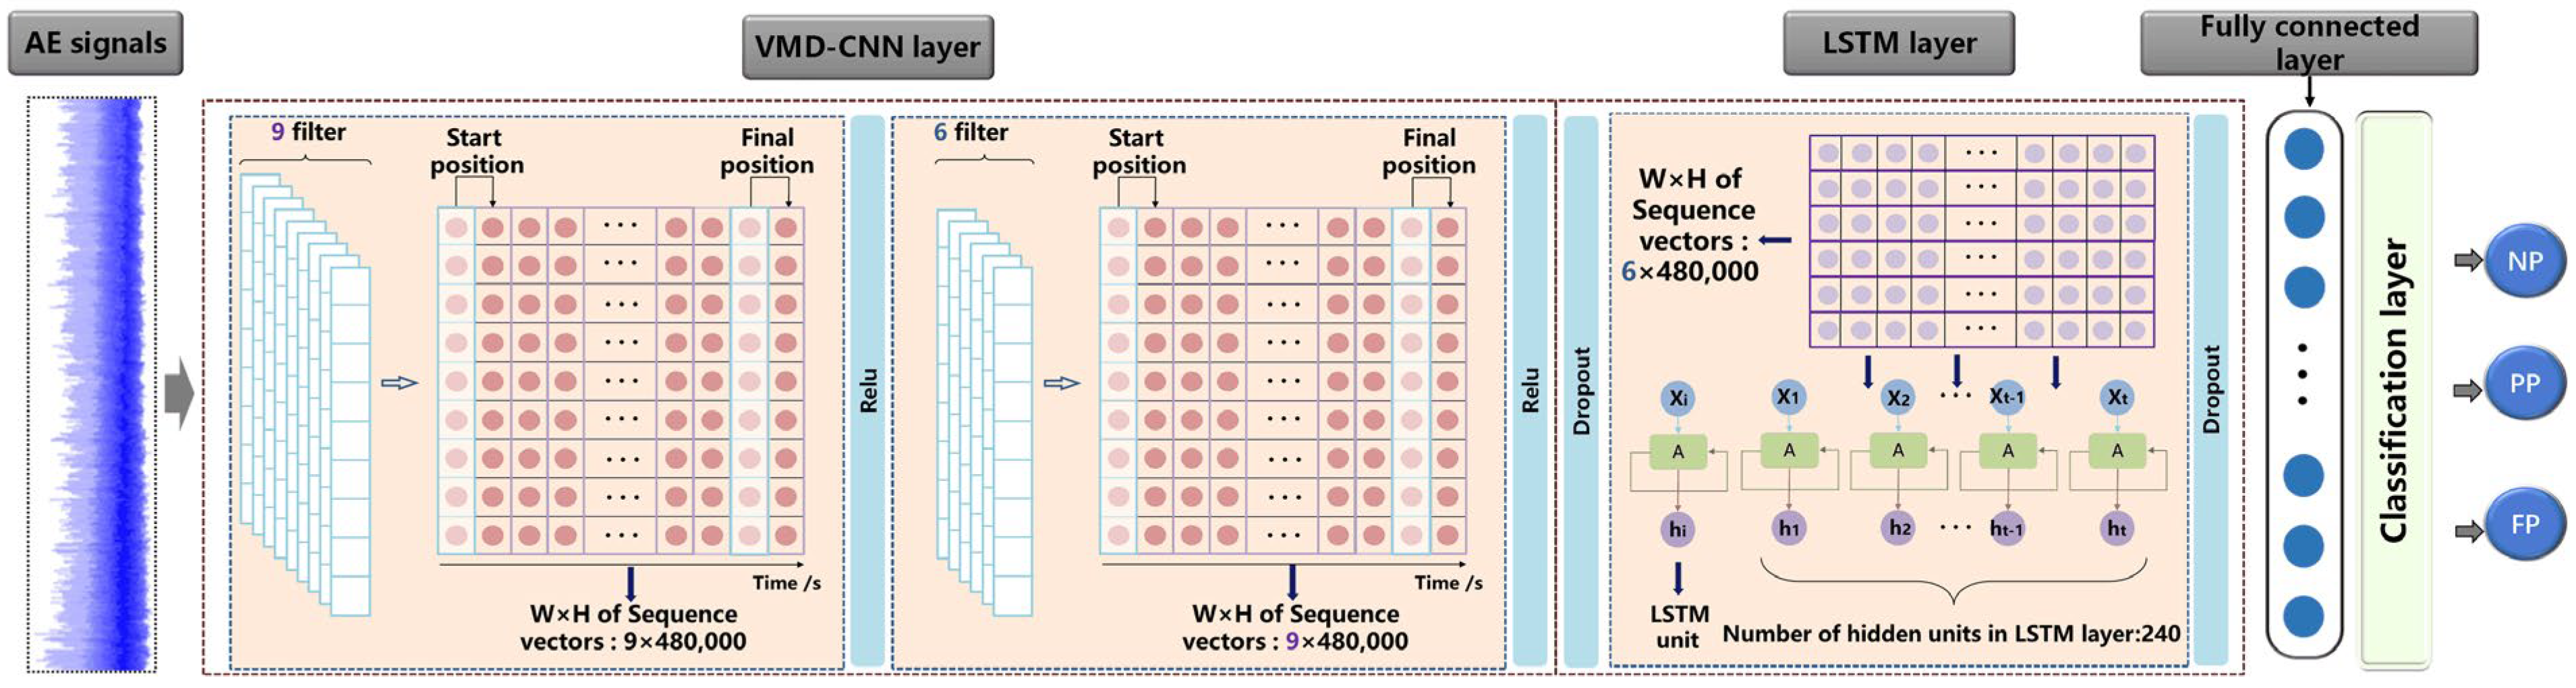
4.3. Establishment of the CNN-LSTM Hybrid Model
5. Results and Discussion
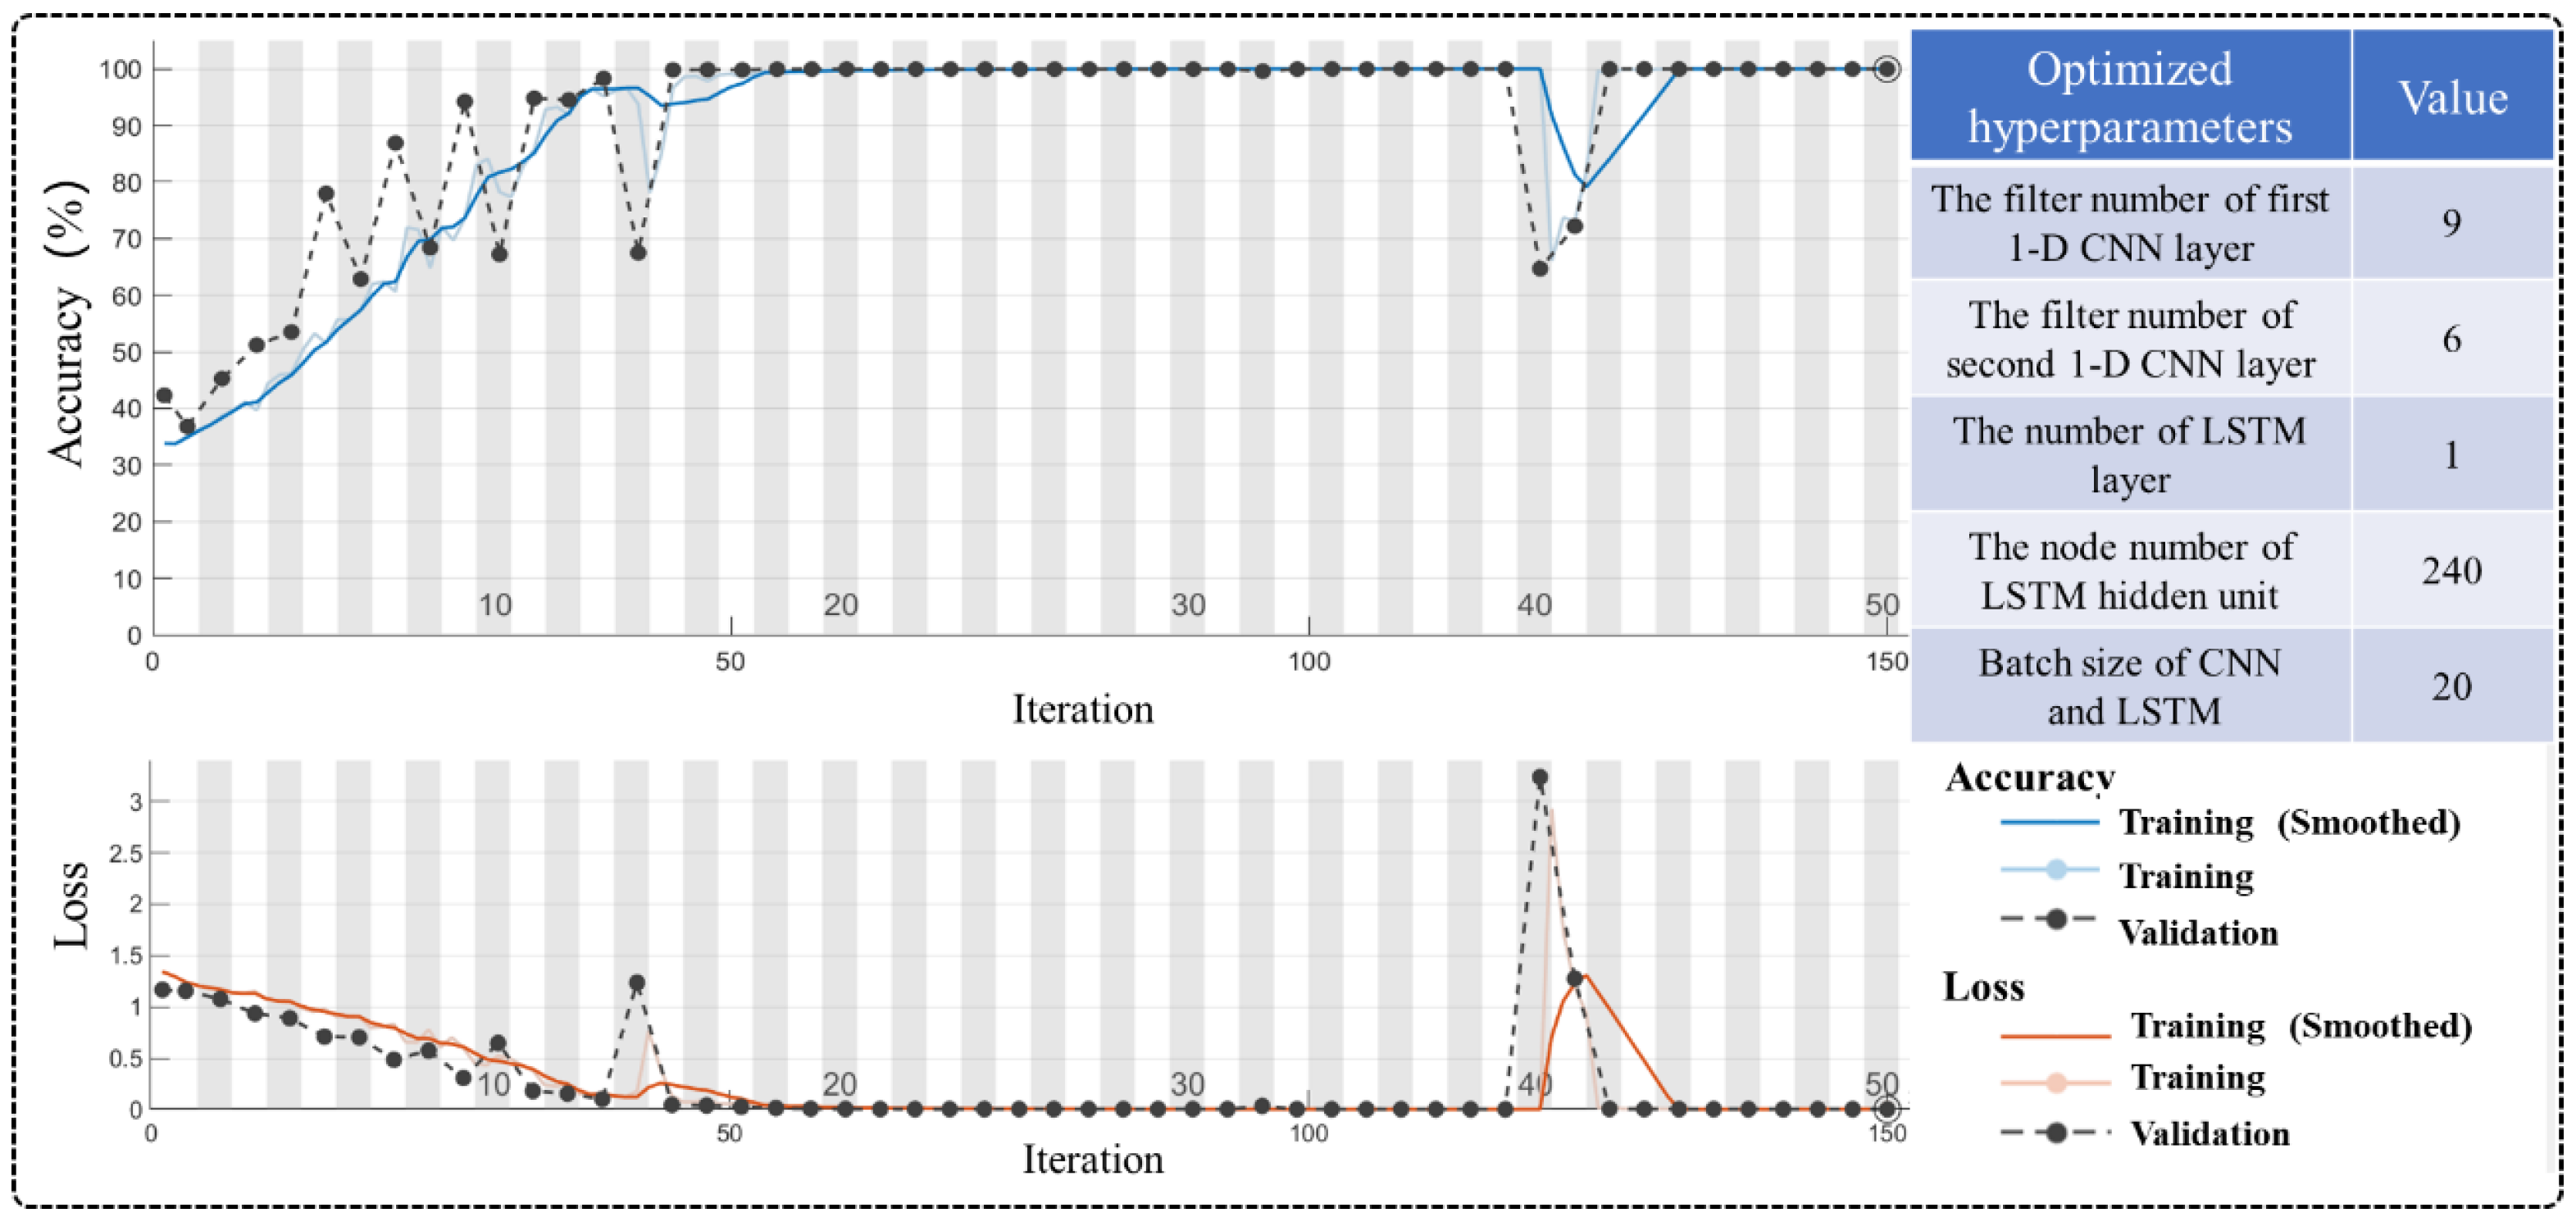
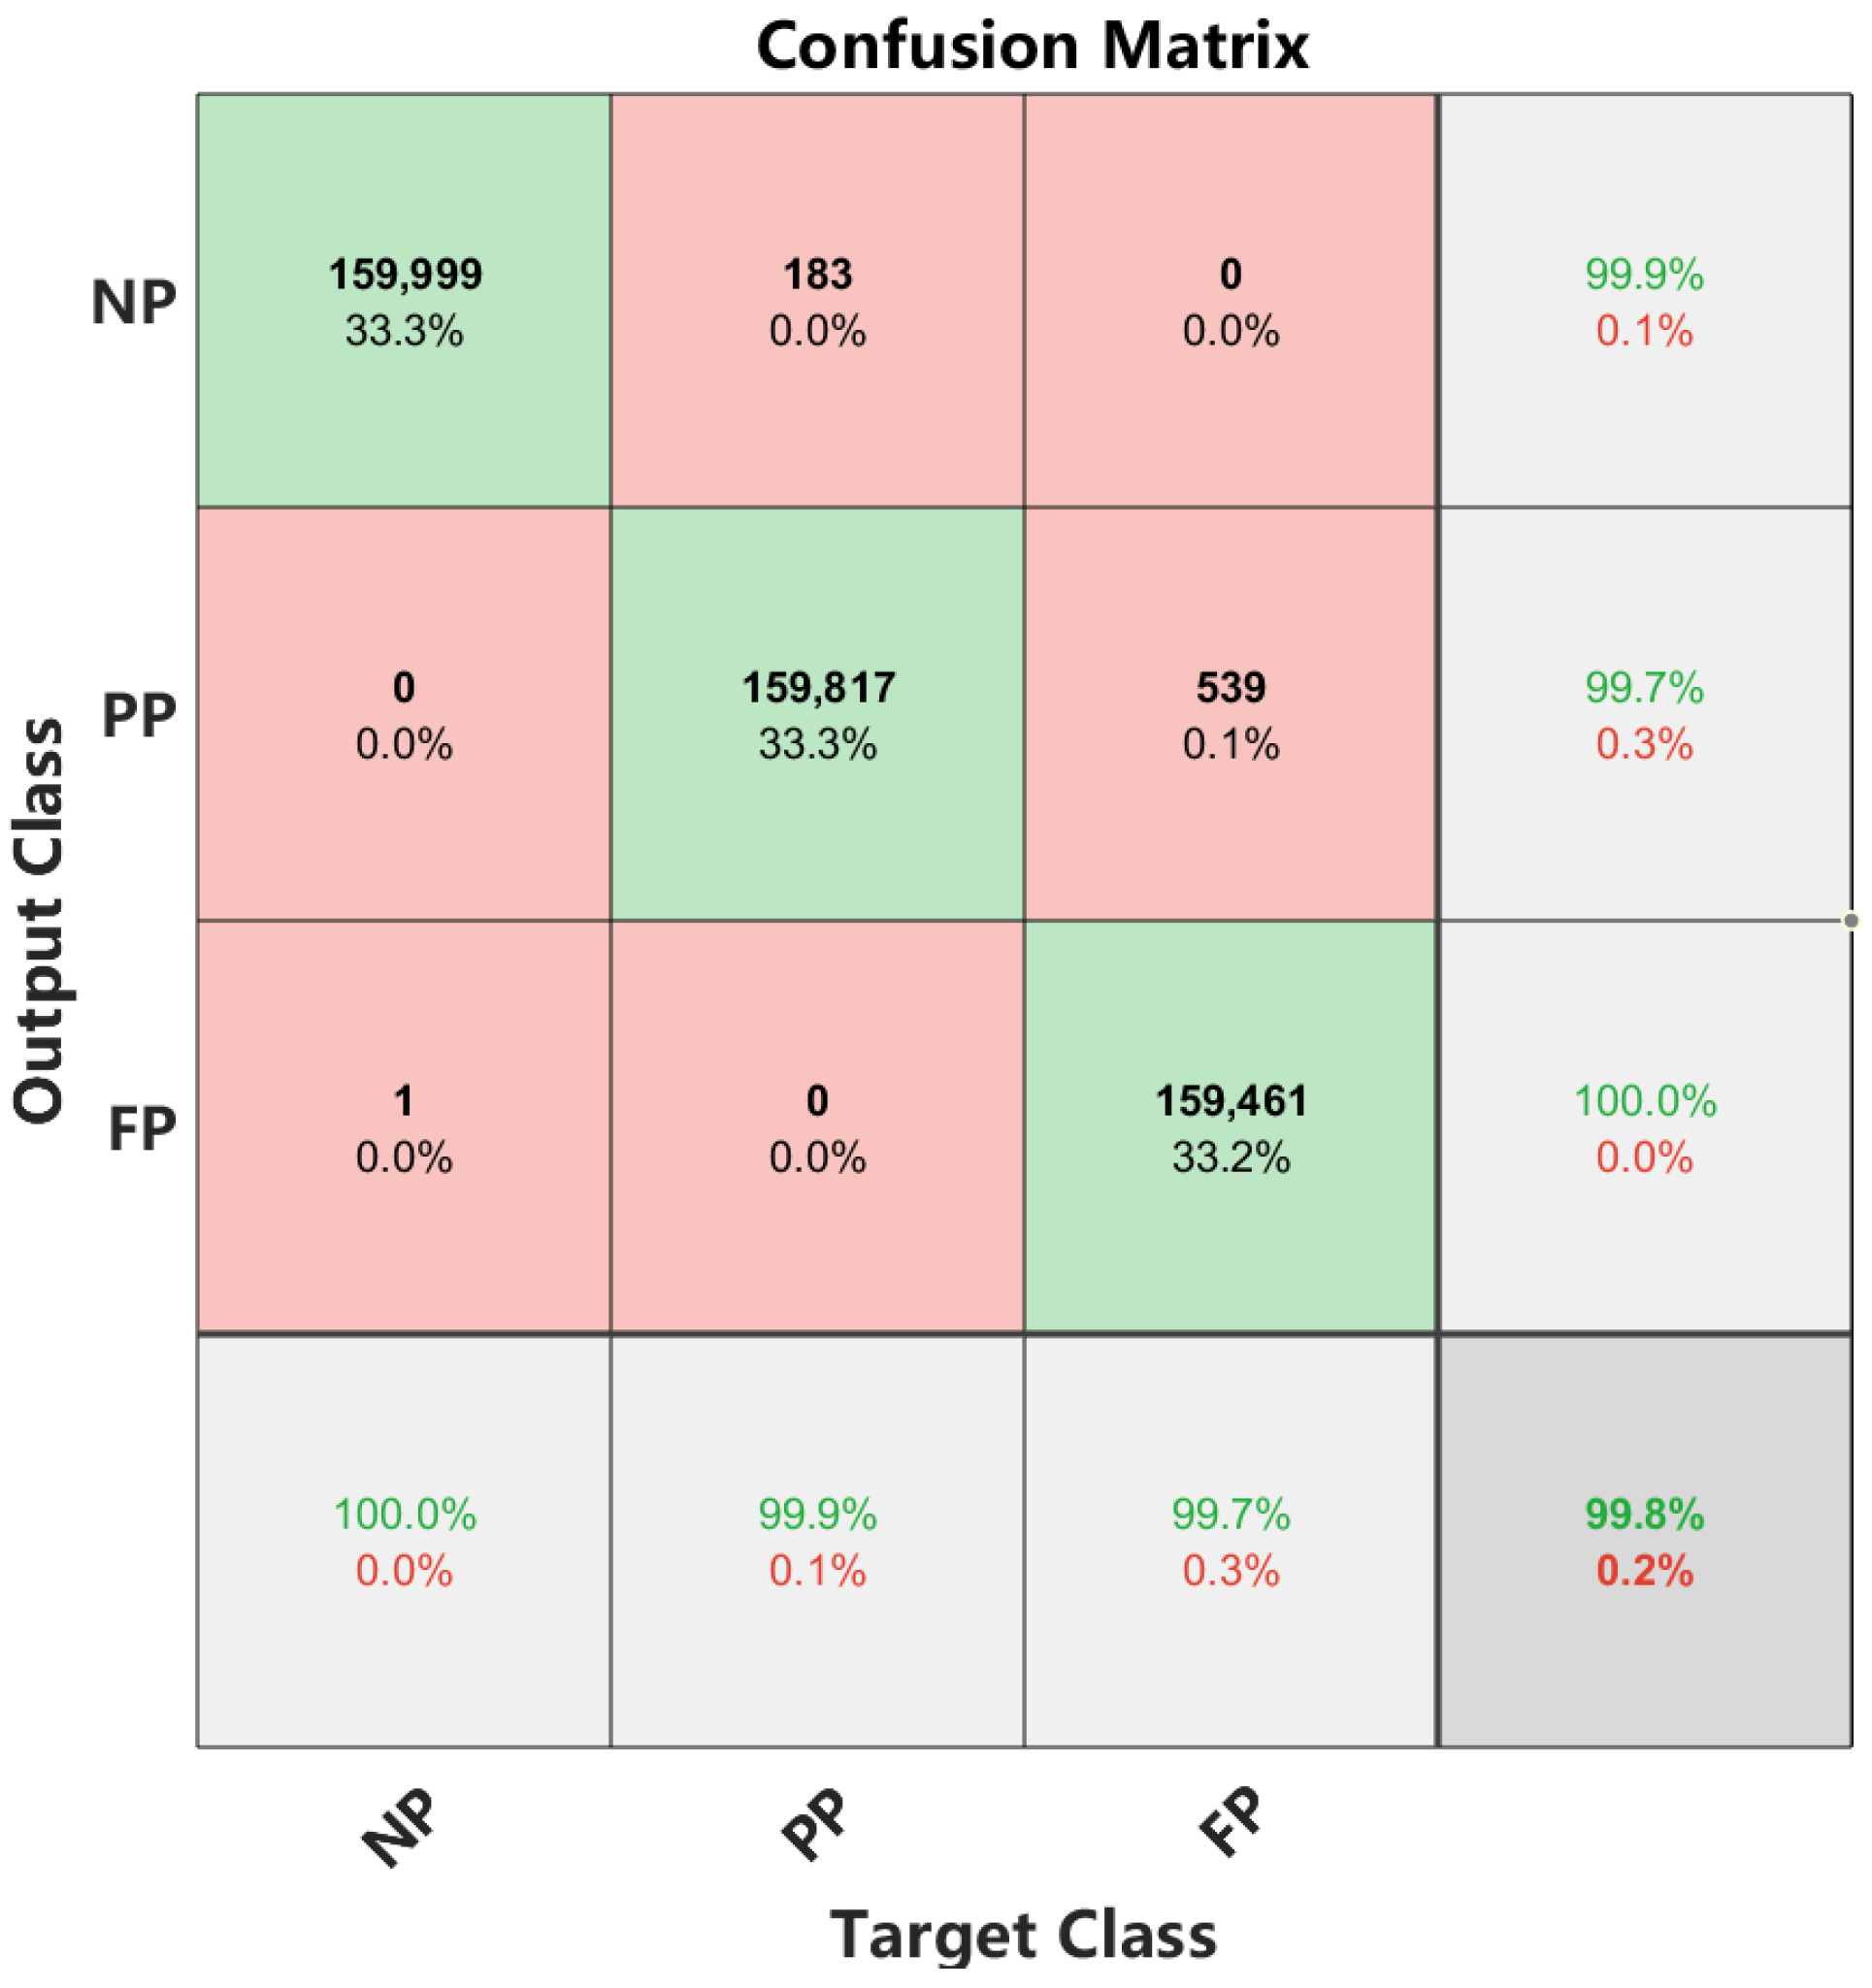
5.1. Performance Evaluation of the Constructed Model
5.2. Performance Comparison between Different Models
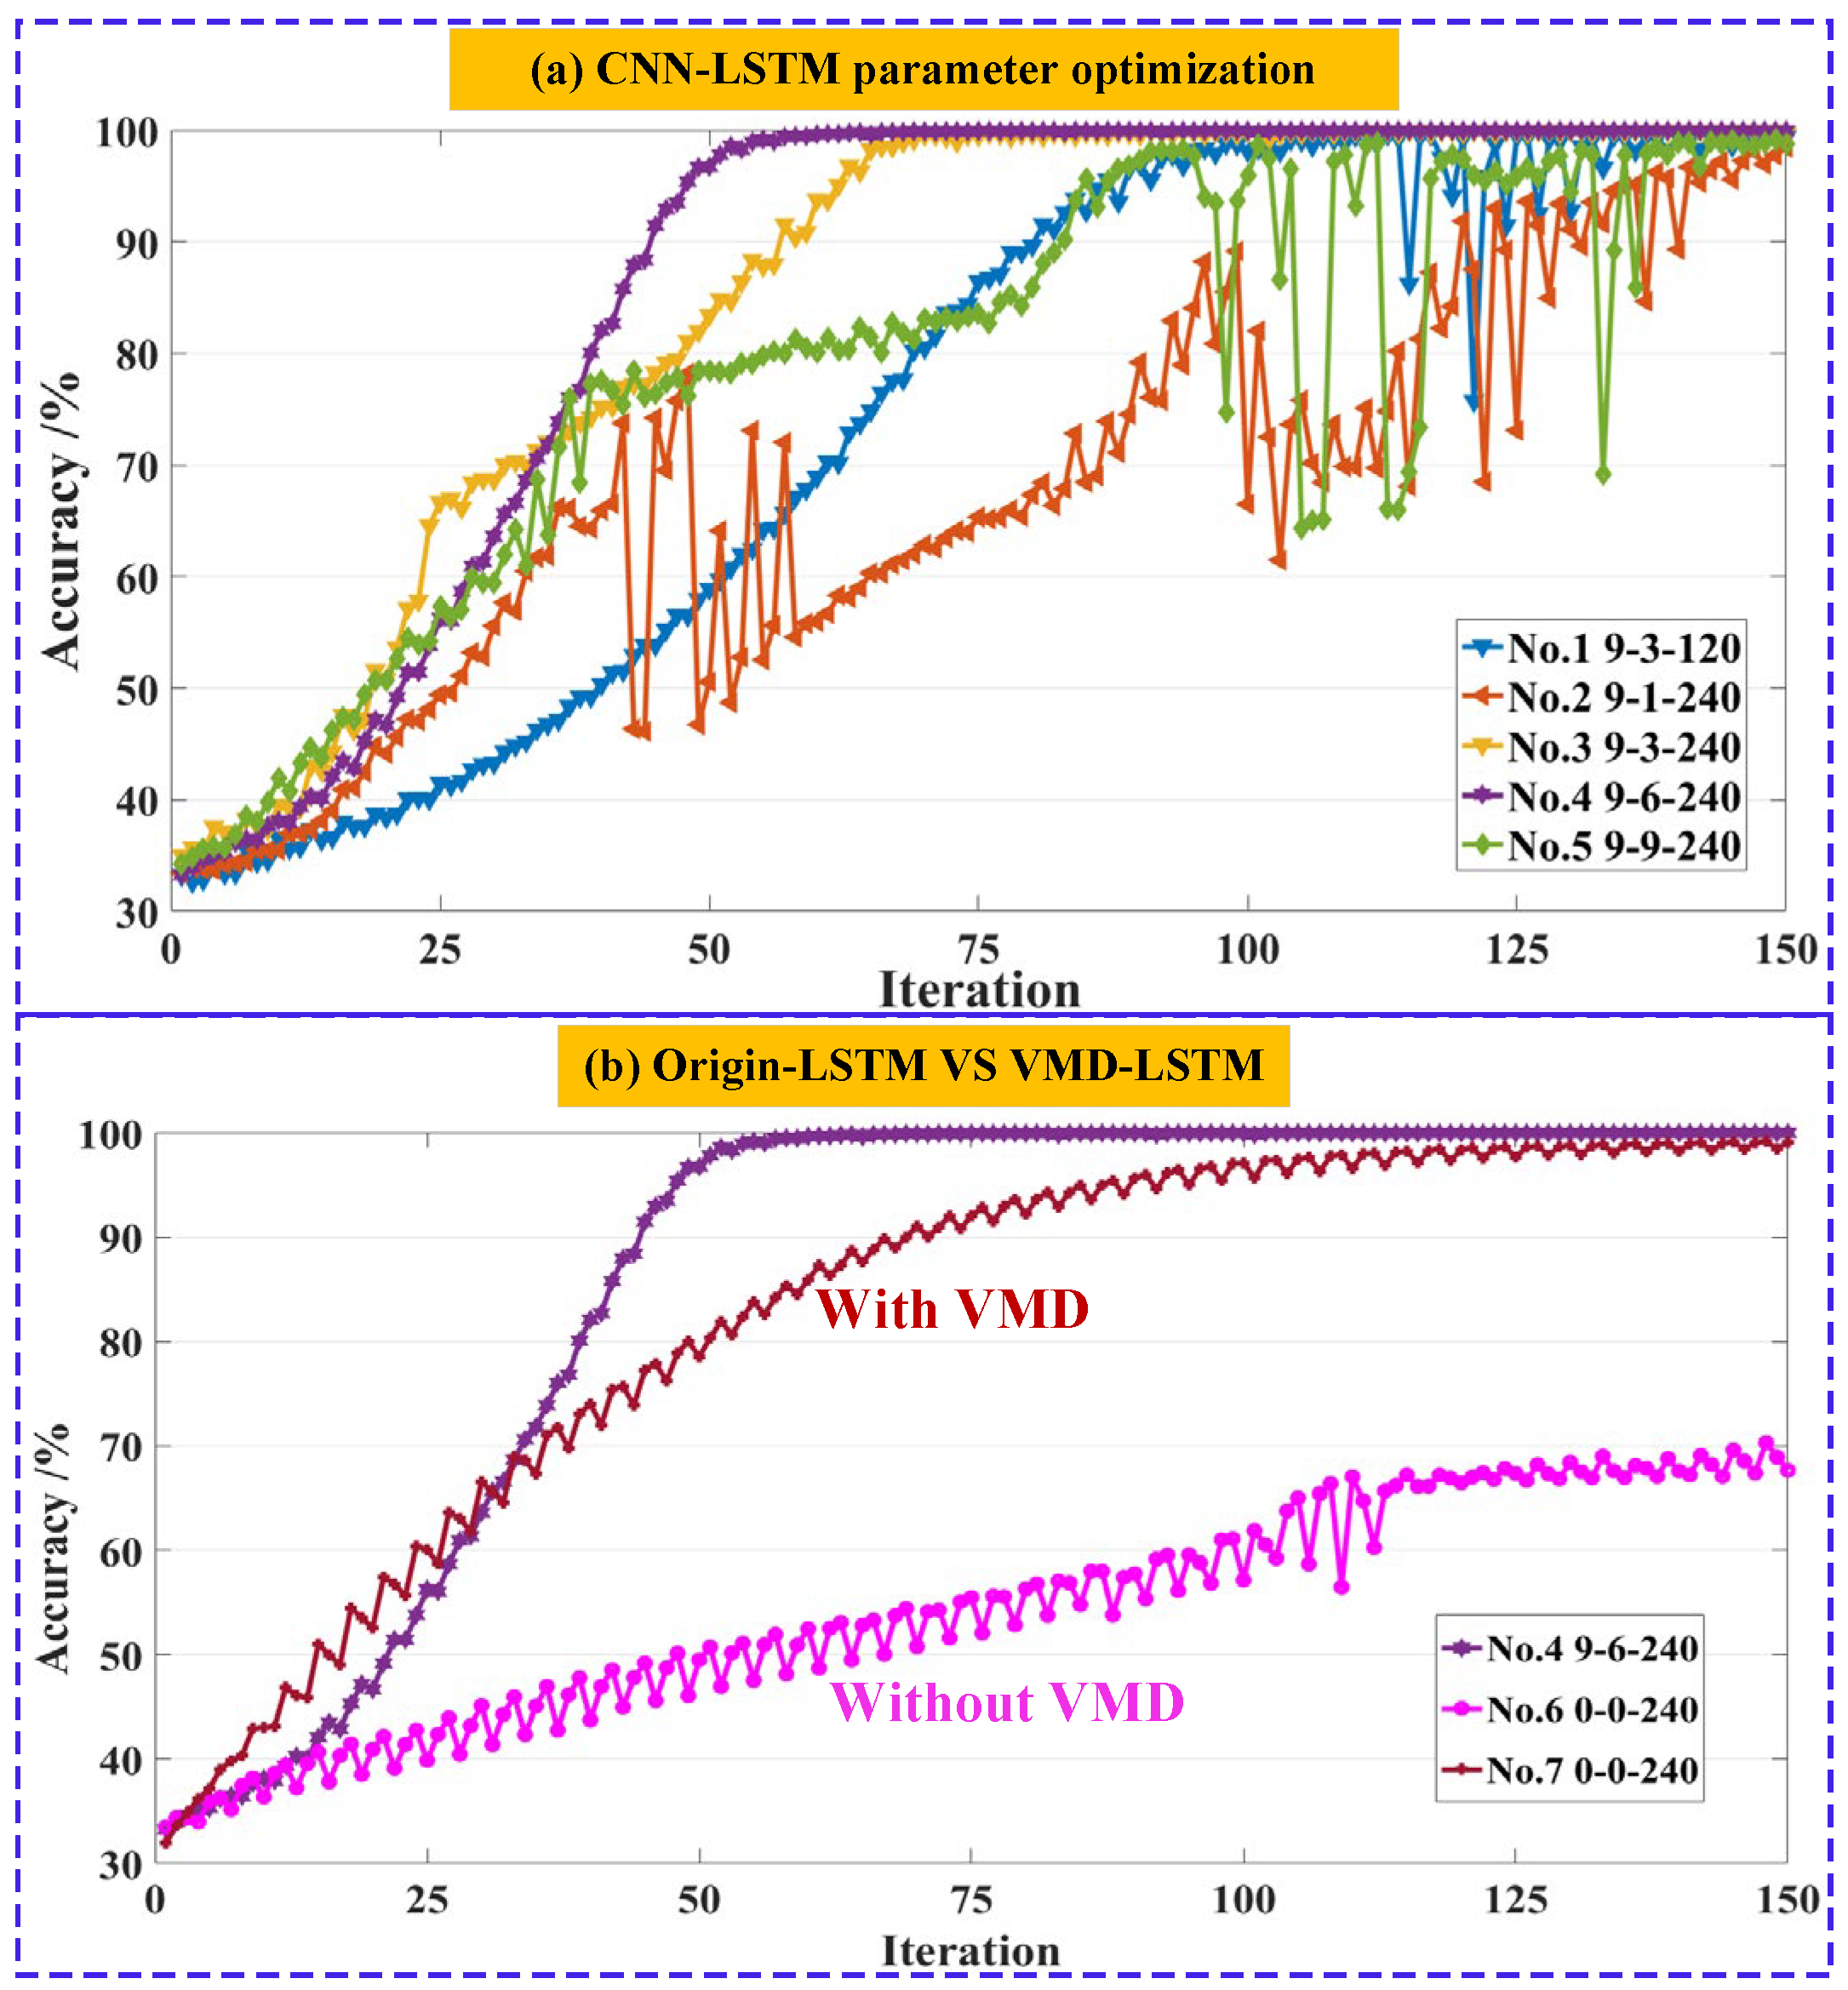
- No. 1 and No. 3 network models only compared the effect of different hidden layer nodes in LSTM on the model performance when other parameters remained unchanged. As the number of hidden nodes increases from 120 to 240, the average recognition accuracy also increases from 96.43% to 98.50%, which indicates that a lager node number in the LSTM hidden layer has a higher classification performance;
- Since the 1st layer of CNN was applied to extract the spatial features of 9-layer sub-signals through VMD, the filter number of the 1st layer was fixed at 9, thus No. 2–No. 5 network models compared the effect of the filter number of the 2nd CNN layer in turn. It is worth noting that the No. 4 model has a best classification performance of 99.85% when the filter number of 2nd layer is set to 6. Meanwhile, it has a minimum accuracy fluctuation when STD = 0.21, confirming that the optimal model is stable. Although other models (No. 2 and No. 5) can also reach a larger recognition accuracy exceeding 98%, there exists a strong accuracy fluctuation at 50 or 100 iterations, indicating that these models are not stable;
- As shown in Figure 15b, the No. 4 and No. 6 compared the effect of the VMD-based frequency components on the model’s performance. It can be found that the input data of the No. 6 network was not decomposed using the VMD method, which led to a significant accuracy (67.83%) decrease compared to the No. 4 network with the VMD method;
- Lastly, the No. 4 and No. 7 compared the effect of the CNN-based spatial feature extraction on the model performance after the VMD processing. The final recognition classification of No. 4 (99.85%) is higher than No. 7 (95.04%), and the standard deviation of No. 4 (0.21) is also lower compared to No. 7 (0.28). Meanwhile, the No. 4 structure achieves the global optimum in fewer iterations, indicating that the CNN layer contributes greatly to the penetration and prediction of results.

| No. | 1 | 2 | 3 | 4 | 5 | 6 | 7 |
|---|---|---|---|---|---|---|---|
| VMD method | Yes | Yes | Yes | Yes | Yes | No | Yes |
| Filter number of 1st CNN layer | 9 | 9 | 9 | 9 | 9 | - | - |
| Filter number of 2nd CNN layer | 3 | 1 | 3 | 6 | 9 | - | - |
| LSTM hidden nodes | 120 | 240 | 240 | 240 | 240 | 240 | 240 |
| Max Acc(%) | 97.45 | 98.50 | 98.82 | 99.99 | 99.99 | 70.32 | 96.25 |
| Min Acc(%) | 96.34 | 97.78 | 98.10 | 99.31 | 97.31 | 65.33 | 94.16 |
| Avg Acc(%) | 96.43 | 98.16 | 98.50 | 99.85 | 98.37 | 67.83 | 95.04 |
| Standard deviation | 0.28 | 2.33 | 0.25 | 0.21 | 2.32 | 0.32 | 0.28 |

6. Conclusions and Future Works
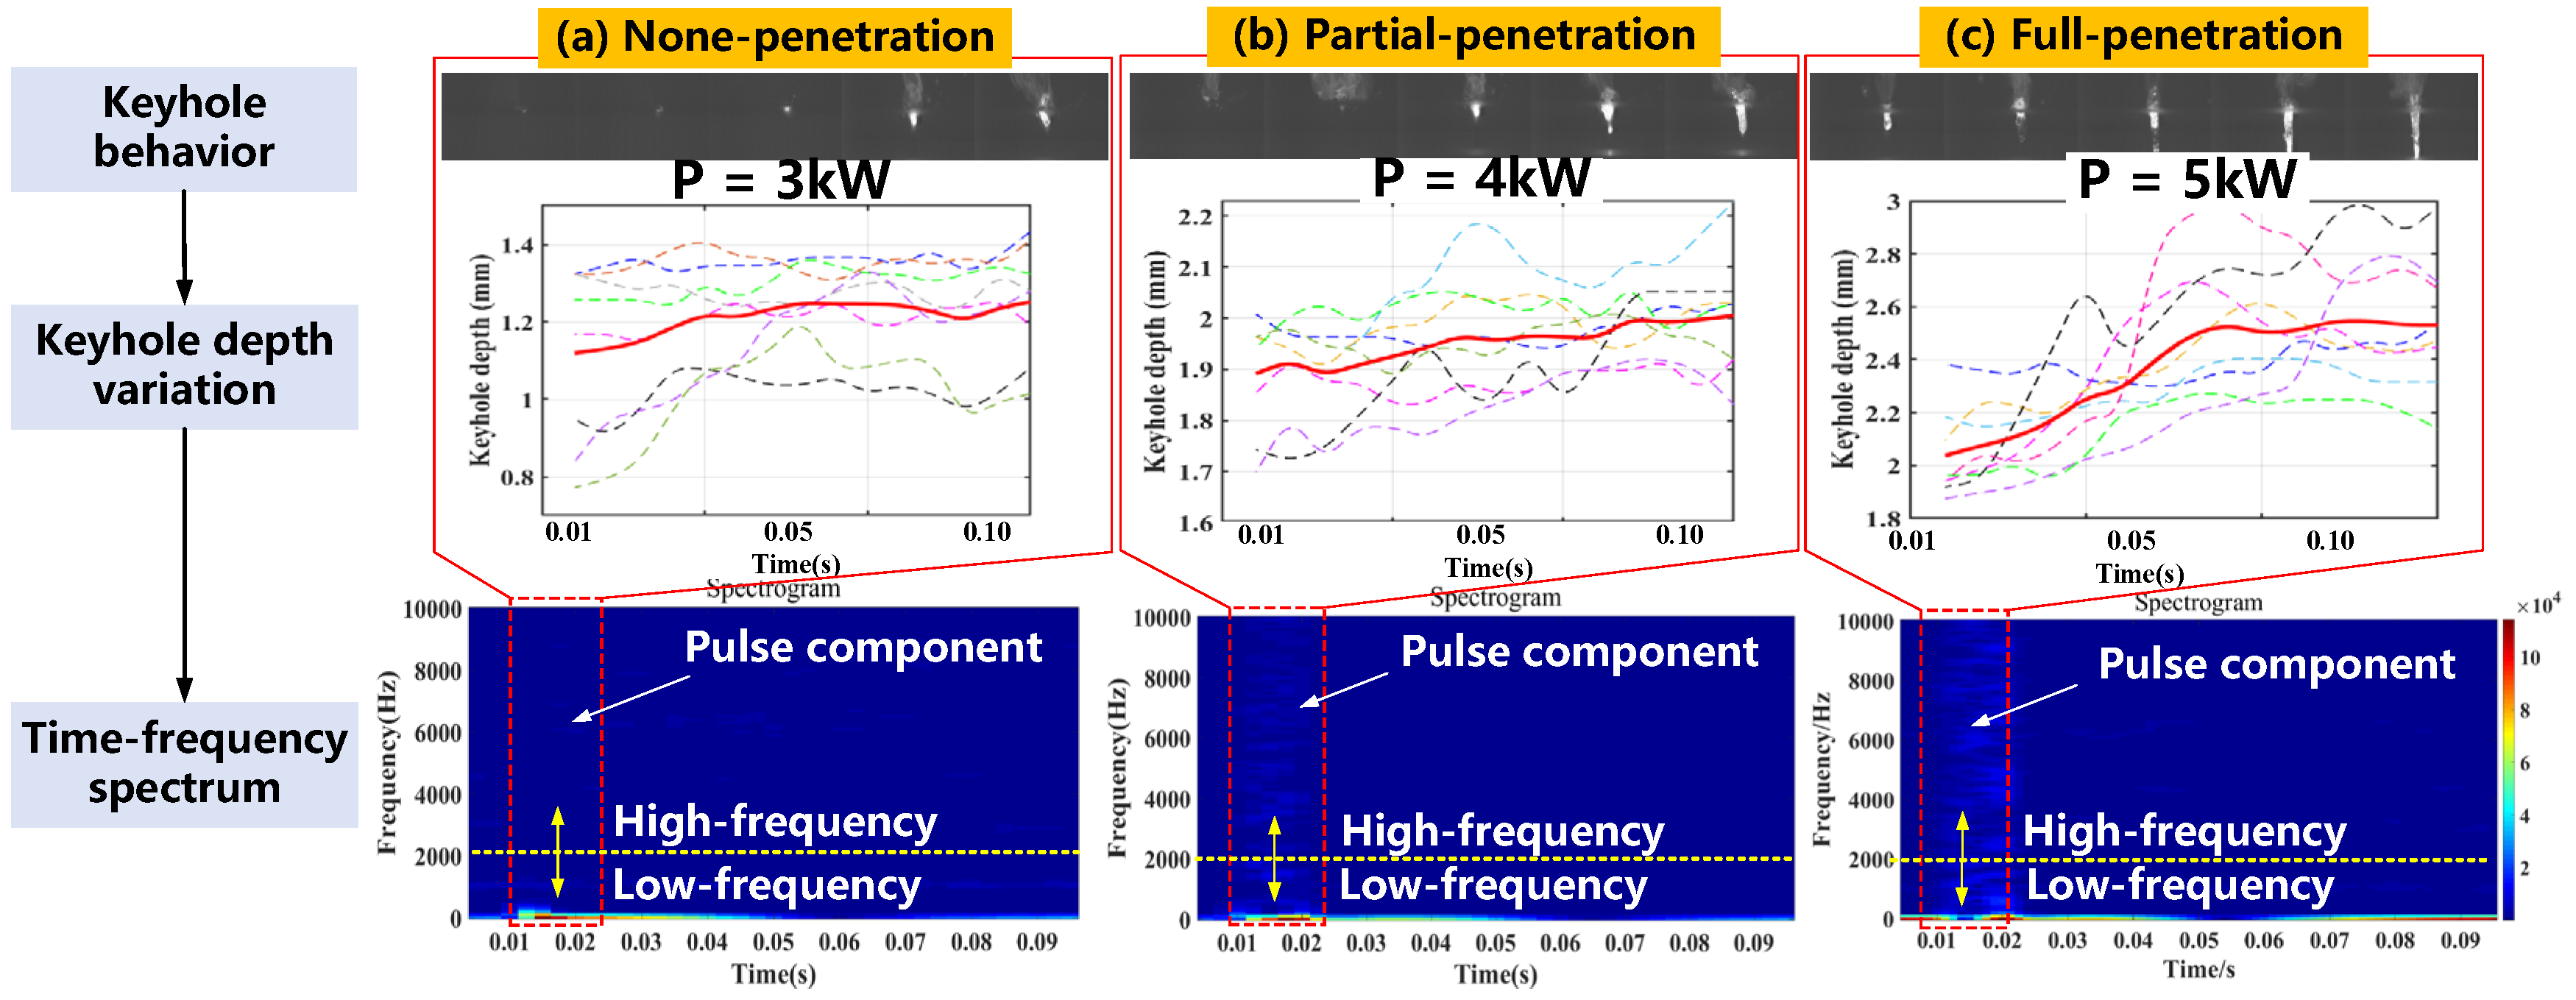
- Combining with the high-speed photography and AE measurements, the characteristics of the AE signal are closely related to the keyhole oscillation and various weld penetrations. Based on the proposed mechanism of an acoustic source, the keyhole oscillation under the dynamic pressure fluctuation is considered a potential point acoustic source, and the surrounding molten pool acts like a speaker diaphragm, generating the spherical acoustic waves propagating in the workpiece;
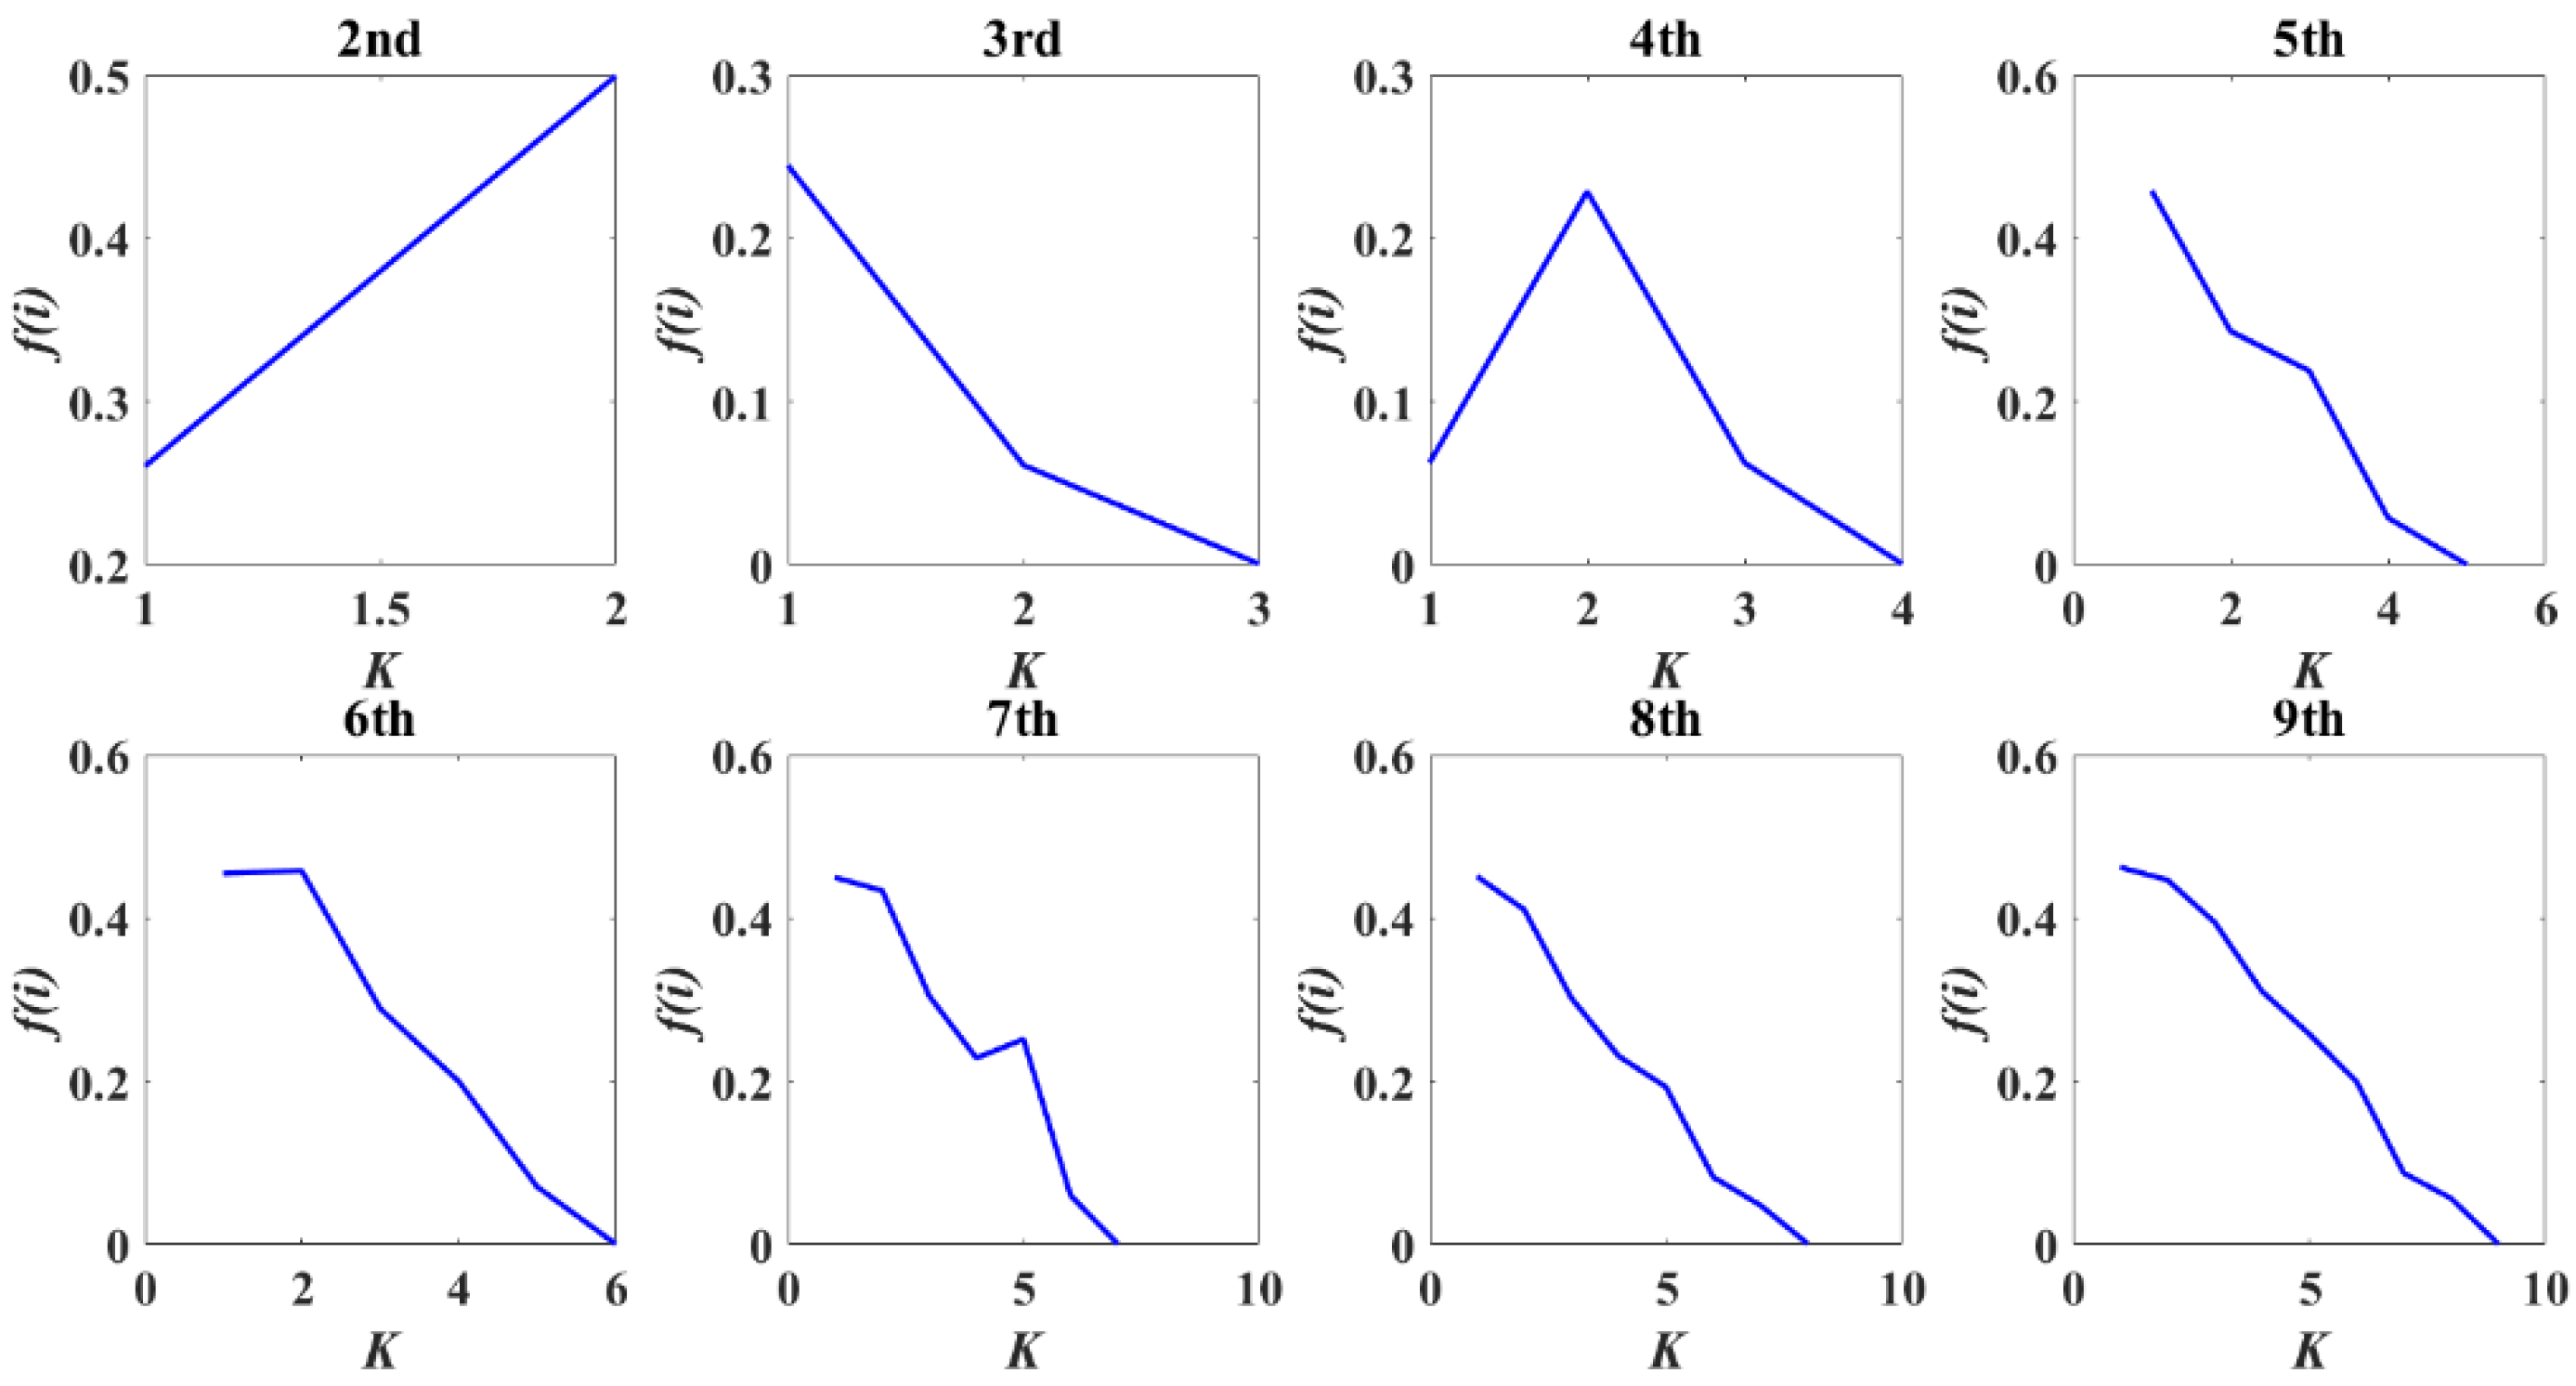
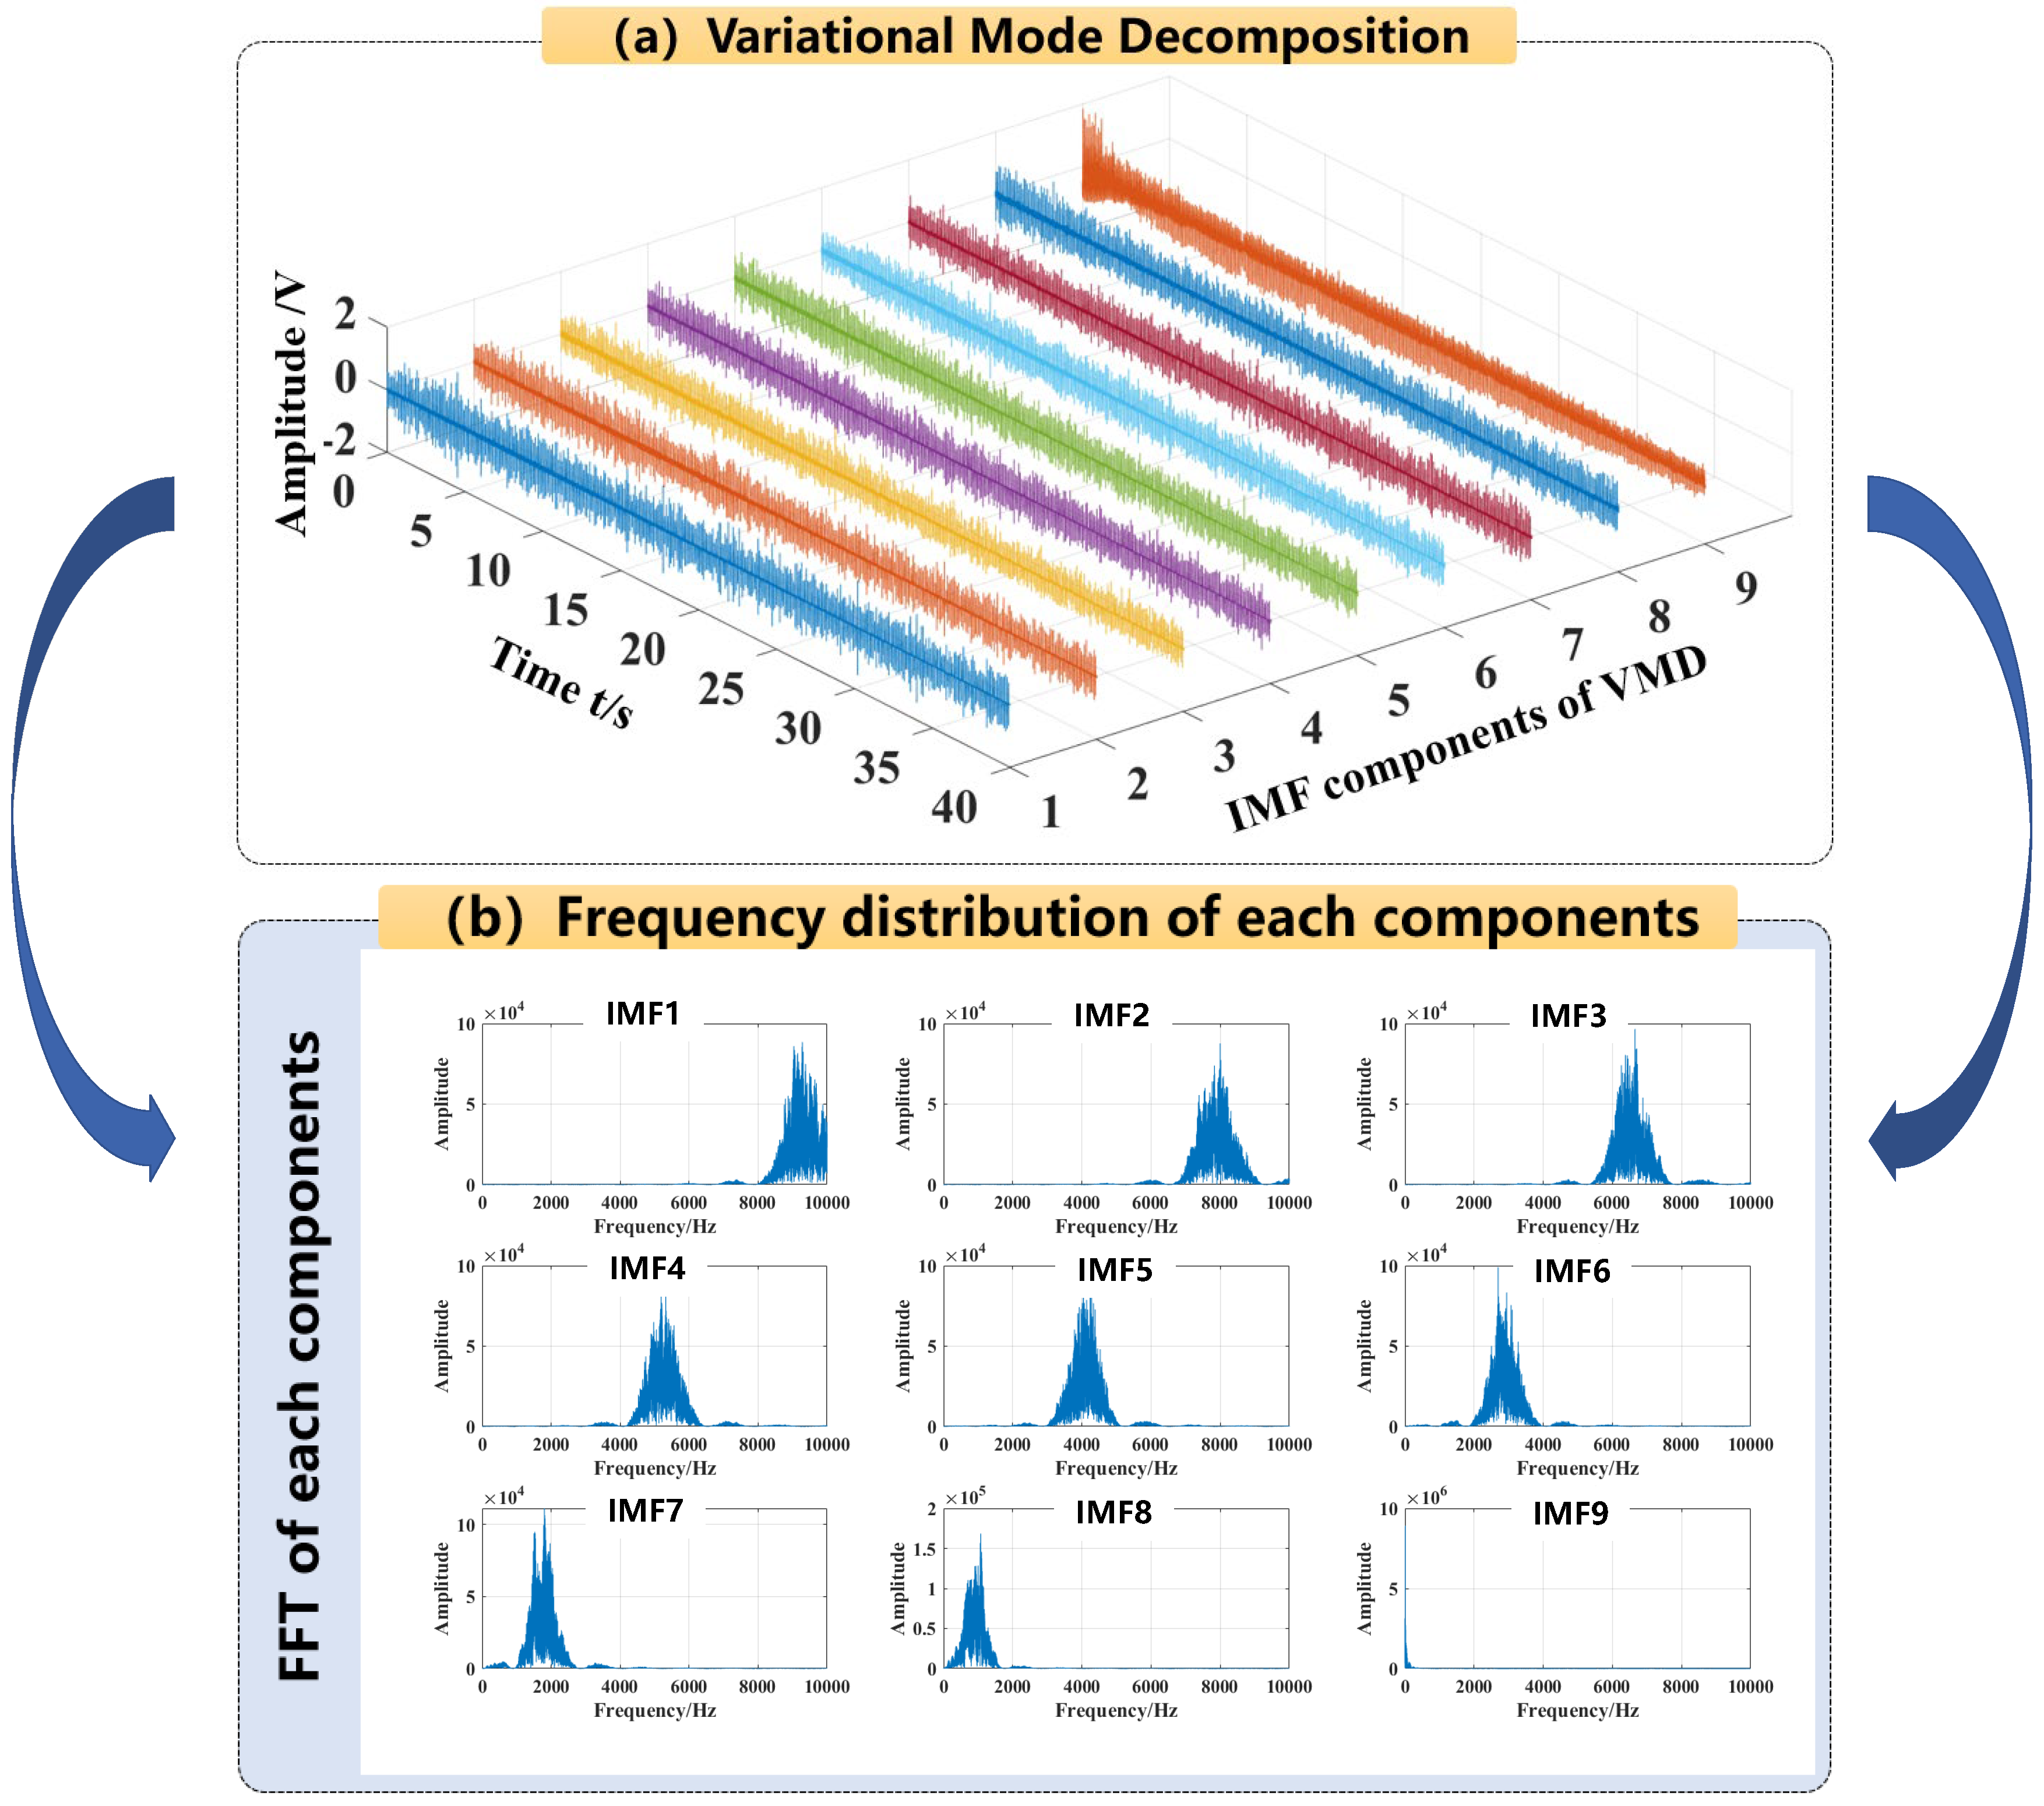
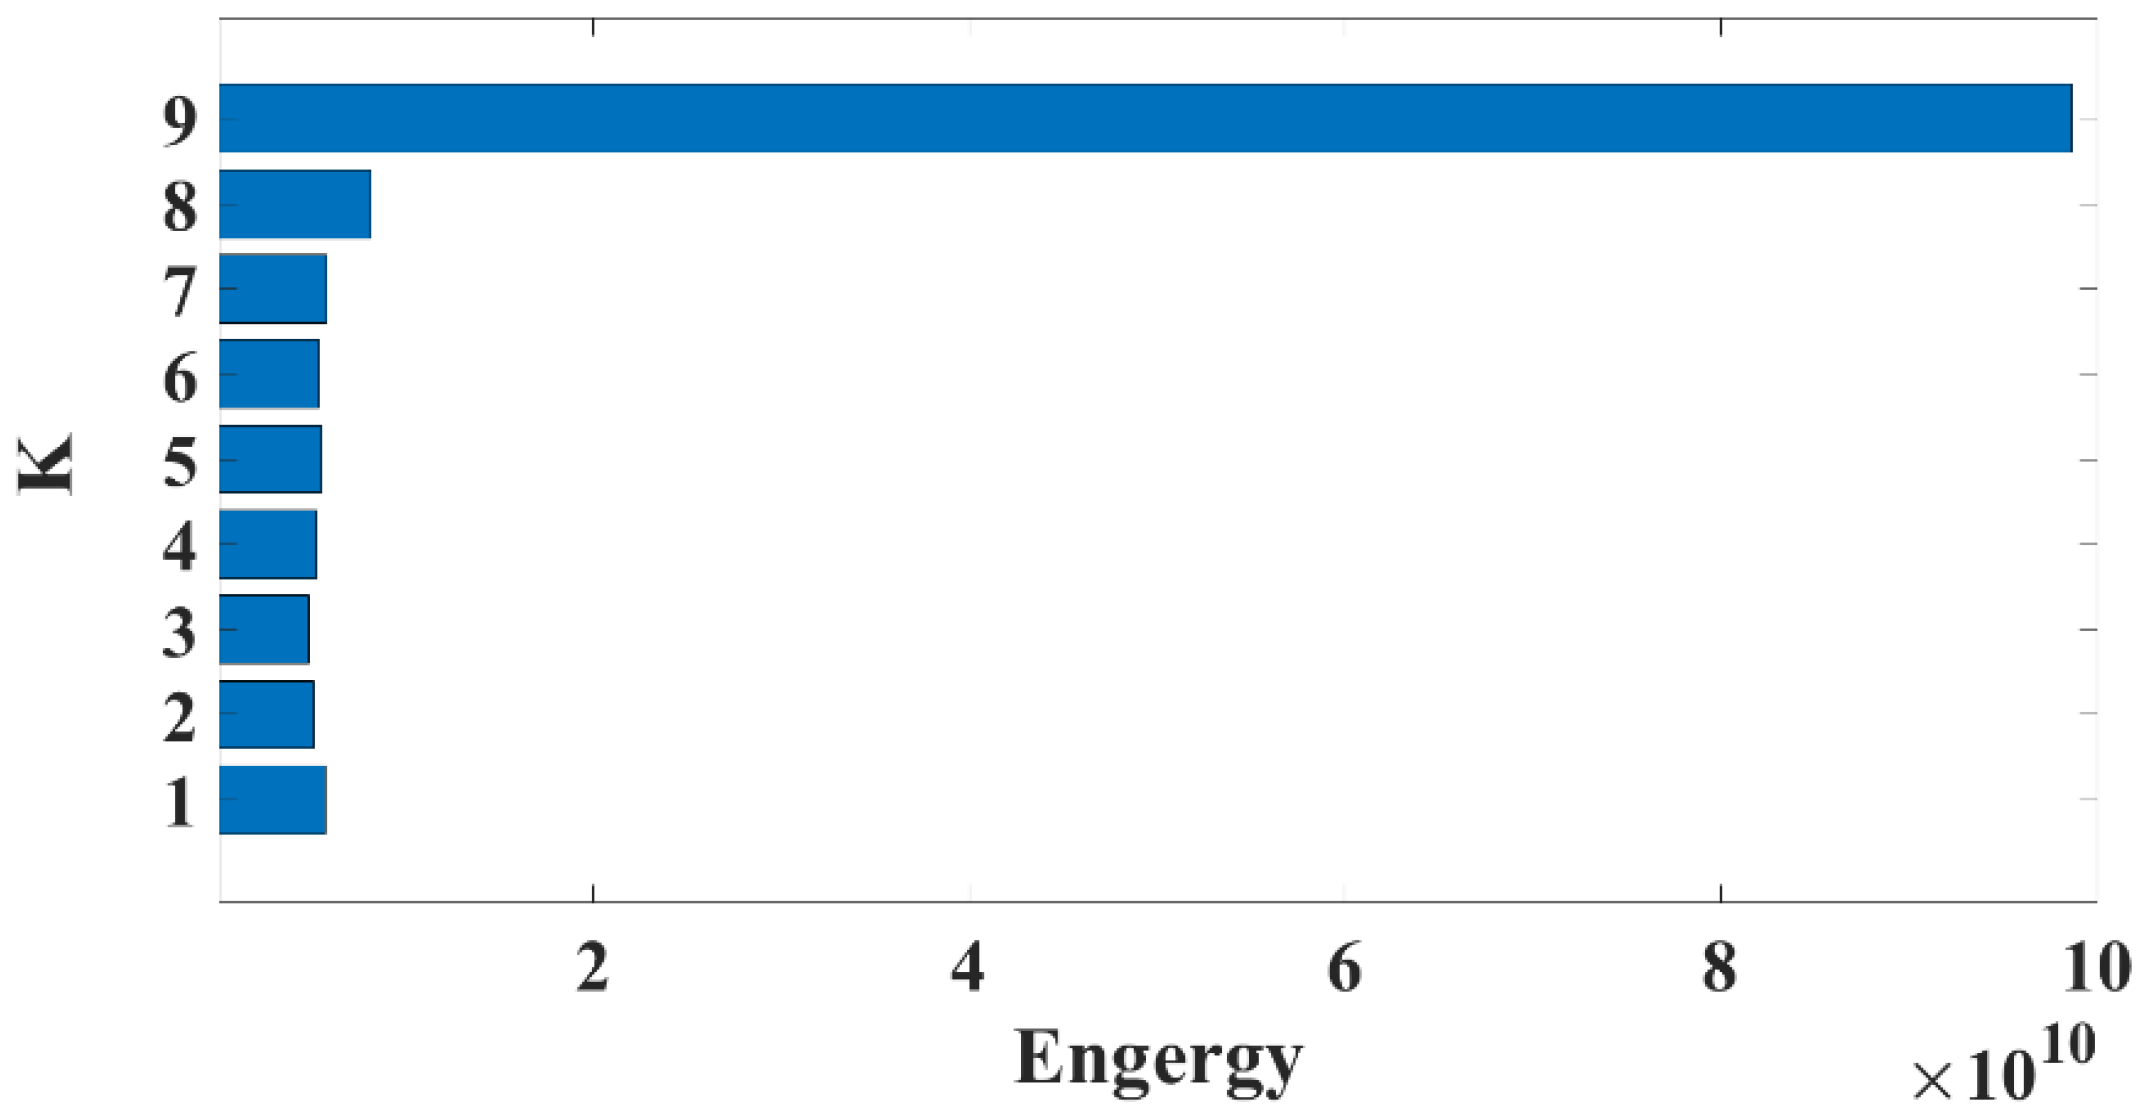
- According to the STFT time-frequency analysis, the acoustic spectra undoubtedly reflect a variety of quasi-periodic phenomena that are characteristic of the laser-metal interaction during laser welding; then the proposed VMD technique adaptively decomposed the raw AE signal into nine distinct frequency components, which can precisely characterize the acoustic energy distribution among the low-frequency and high-frequency components, under different welding penetrations, and improved frequency domain identifiability;
- Finally, a novel hybrid model combing CNN and LSTM was designed to deeply mine the spatial and temporal acoustic features from the extracted frequency components. Extensive experiments demonstrate that our proposed approach yields a remarkable classification performance with a test accuracy of 99.8% and a standard deviation of 0.21, which obtains the best recognition performance compared with other deep learning methods.
Author Contributions
Funding
Institutional Review Board Statement
Informed Consent Statement
Data Availability Statement
Conflicts of Interest
References
- Svenungsson, J.; Choquet, I.; Kaplan, A. Laser Welding Process—A Review of Keyhole Welding Modelling. Phys. Procedia 2015, 78, 182–191. [Google Scholar] [CrossRef]
- Jia, Z.; Zhang, P.; Yu, Z.; Shi, H.; Liu, H.; Wu, D.; Ye, X.; Wang, F.; Tian, Y. Effect of pulse shaping on solidification process and crack in 5083 aluminum alloy by pulsed laser welding. Opt. Laser Technol. 2021, 134, 106608. [Google Scholar] [CrossRef]
- Gao, X.; Chen, Y.; You, D.; Xiao, Z.; Chen, X. Detection of micro gap weld joint by using magneto-optical imaging and Kalman filtering compensated with RBF neural network. Mech. Syst. Signal Process. 2017, 84, 570–583. [Google Scholar] [CrossRef]
- Xiao, X.; Liu, X.; Cheng, M.; Song, L. Towards monitoring laser welding process via a coaxial pyrometer. J. Mater. Process. Technol. 2020, 277, 116409. [Google Scholar] [CrossRef]
- Zalakain-Azpiroz, A.; Rodríguez, N.; de la Yedra, A.G.; Piccini, J.; Angulo-Vinuesa, X. A calibration tool for weld penetration depth estimation based on dimensional and thermal sensor fusion. Int. J. Adv. Manuf. Technol. 2021, 119, 2145–2158. [Google Scholar] [CrossRef]
- Eriksson, I.; Powell, J.; Kaplan, A. Signal overlap in the monitoring of laser welding. Meas. Sci. Technol. 2010, 21, 105705. [Google Scholar] [CrossRef]
- You, D.; Gao, X.; Katayama, S. Monitoring of high-power laser welding using high-speed photographing and image processing. Mech. Syst. Signal Process. 2014, 49, 39–52. [Google Scholar] [CrossRef]
- Tang, Z.-j.; Liu, W.-w.; Zhang, N.; Wang, Y.-w.; Zhang, H.-c. Real–time prediction of penetration depths of laser surface melting based on coaxial visual monitoring. Opt. Lasers Eng. 2020, 128, 106034. [Google Scholar] [CrossRef]
- Zhao, C.; Parab, N.; Li, X.; Fezzaa, K.; Tan, W.; Rollett, A.; Sun, T. Critical instability at moving keyhole tip generates porosity in laser melting. Science 2020, 370, 1080–1086. [Google Scholar] [CrossRef]
- Ju, S.; Li, D.; Jia, J. Machine-learning-based methods for crack classification using acoustic emission technique. Mech. Syst. Signal Process. 2022, 178, 109253. [Google Scholar] [CrossRef]
- Gu, H.; Duley, W. Resonant acoustic emission during laser welding of metals. J. Phys. D-Appl. Phys. 1996, 29, 550–555. [Google Scholar] [CrossRef]
- Gu, H.; Duley, W. A statistical approach to acoustic monitoring of laser welding. J. Phys. D-Appl. Phys. 1996, 29, 555–560. [Google Scholar] [CrossRef]
- Huang, W.; Kovacevic, R. Feasibility study of using acoustic signals for online monitoring of the depth of weld in the laser welding of high-strength steels. Proc. Inst. Mech. Eng. Part B J. Eng. Manuf. 2009, 223, 343–361. [Google Scholar] [CrossRef]
- Huang, W.; Kovacevic, R. A neural network and multiple regression method for the characterization of the depth of weld penetration in laser welding based on acoustic signatures. J. Intell. Manuf. 2009, 22, 131–143. [Google Scholar] [CrossRef]
- Yusof, M.; Ishak, M.; Ghazali, M. Classification of weld penetration condition through synchrosqueezed-wavelet analysis of sound signal acquired from pulse mode laser welding process. J. Mater. Process. Technol. 2020, 279, 116559. [Google Scholar] [CrossRef]
- Yusof, M.; Ishak, M.; Ghazali, M. Weld depth estimation during pulse mode laser welding process by the analysis of the acquired sound using feature extraction analysis and artificial neural network. J. Manuf. Process. 2021, 63, 163–178. [Google Scholar] [CrossRef]
- Cai, Y.; Luo, Y.; Wang, X.; Yang, S.; Zhang, F.; Tang, F.; Peng, Y. Physical mechanism of laser-excited acoustic wave and its application in recognition of incomplete-penetration welding defect. Int. J. Adv. Manuf. Technol. 2022, 120, 6091–6105. [Google Scholar] [CrossRef]
- Wu, D.; Huang, Y.; Zhang, P.; Yu, Z.; Chen, H.; Chen, S. Visual-Acoustic Penetration Recognition in Variable Polarity Plasma Arc Welding Process Using Hybrid Deep Learning Approach. IEEE Access 2020, 8, 120417–120428. [Google Scholar] [CrossRef]
- Wu, D.; Zhang, P.; Yu, Z.; Gao, Y.; Zhang, H.; Chen, H.; Chen, S.; Tian, Y. Progress and perspectives of in-situ optical monitoring in laser beam welding: Sensing, characterization and modeling. J. Manuf. Process. 2022, 75, 767–791. [Google Scholar] [CrossRef]
- Xie, S.; Zhang, Y.; Chen, C.; Zhang, X. Identification of nonlinear hysteretic systems by artificial neural network. Mech. Syst. Signal Process. 2013, 34, 76–87. [Google Scholar] [CrossRef]
- Movsessian, A.; Cava, D.G.; Tcherniak, D. An artificial neural network methodology for damage detection: Demonstration on an operating wind turbine blade. Mech. Syst. Signal Process. 2021, 159, 107766. [Google Scholar] [CrossRef]
- Lee, S.; Ahn, S.; Park, C. Analysis of Acoustic Emission Signals During Laser Spot Welding of SS304 Stainless Steel. J. Mater. Eng. Perform. 2013, 23, 700–707. [Google Scholar] [CrossRef]
- Shevchik, S.; Le-Quang, T.; Meylan, B.; Farahani, F.; Olbinado, M.; Rack, A.; Masinelli, G.; Leinenbach, C.; Wasmer, K. Supervised deep learning for real-time quality monitoring of laser welding with X-ray radiographic guidance. Sci. Rep. 2020, 10, 3389. [Google Scholar] [CrossRef] [PubMed]
- Pandiyan, V.; Drissi-Daoudi, R.; Shevchik, S.; Masinelli, G.; Le-Quang, T.; Logé, R.; Wasmer, K. Semi-supervised Monitoring of Laser powder bed fusion process based on acoustic emissions. Virtual Phys. Prototyp. 2021, 16, 481–497. [Google Scholar] [CrossRef]
- Zhang, Z.; Qin, R.; Li, G.; Du, Z.; Li, Z.; Lin, Y.; He, W. Deep learning-based monitoring of surface residual stress and efficient sensing of AE for laser shock peening. J. Mater. Process. Technol. 2022, 303, 117515. [Google Scholar] [CrossRef]
- Shi, J.; Peng, D.; Peng, Z.; Zhang, Z.; Goebel, K.; Wu, D. Planetary gearbox fault diagnosis using bidirectional-convolutional LSTM networks. Mech. Syst. Signal Process. 2022, 162, 107996. [Google Scholar] [CrossRef]
- Song, R.; Jiang, Q. Application of VMD Combined with CNN and LSTM in Motor Bearing Fault. In Proceedings of the 2021 IEEE 16th Conference on Industrial Electronics and Applications (ICIEA), Chengdu, China, 1–4 August 2021; pp. 1661–1666. [Google Scholar]
- GB/T 3190-2020; State Administration of Market Regulation and the Standardization Administration. China Non-Ferrous Metals Industry Association: Beijing, China, 2020.
- GB/T 3880.2-2012; General Administration of Quality Supervision, Inspection and Quarantine of the People’s Republic of China. Standardization Administration of the People’s Republic of China: Beijing, China, 2012.
- Klein, T.; Vicanek, M.; Kroos, J.; Decker, I.; Simon, G. Oscillations of the keyhole in penetration laser beam welding. J. Phys. D-Appl. Phys. 1994, 27, 2023. [Google Scholar] [CrossRef]
- Klein, T.; Vicanek, M.; Simon, G. Forced oscillations of the keyhole in penetration laser beam welding. J. Phys. D-Appl. Phys. 1996, 29, 322. [Google Scholar] [CrossRef]
- Wen, X.; Wu, D.; Zhang, P.; Liu, S.; Luo, Z.; Jia, Z.; Ye, X.; Shi, H.; Yu, Z. Influence mechanism of the keyhole behavior on penetration depth by in-situ monitoring in pulsed laser welding of aluminum alloy. Optik 2021, 246, 167812. [Google Scholar] [CrossRef]
- Liu, S.; Wu, D.; Luo, Z.; Zhang, P.; Ye, X.; Yu, Z. Measurement of pulsed laser welding penetration based on keyhole dynamics and deep learning approach. Measurement 2022, 199, 111579. [Google Scholar] [CrossRef]
- Dragomiretskiy, K.; Zosso, D. Variational Mode Decomposition. IEEE Trans. Signal Process. 2014, 62, 531–544. [Google Scholar] [CrossRef]
- Zan, T.; Pang, Z.; Wang, M. Early Fault Diagnosis Method of Rollong Bearing Based on VMD. J. Beijing Univ. Technol. 2019, 45, 103–110. [Google Scholar]
- Kiranyaz, S.; Ince, T.; Gabbouj, M. Real-Time Patient-Specific ECG Classification by 1-D Convolutional Neural Networks. IEEE Trans. Biomed. Eng. 2016, 63, 664–675. [Google Scholar] [CrossRef]
- Hochreiter, S.; Schmidhuber, J. Long short-term memory. Neural Comput. 1997, 9, 1735–1780. [Google Scholar] [CrossRef]


| Case | Laser Power | Pulse Width | Pulse Frequency | Welding Speed | Defocusing Distance | Penetration Status |
|---|---|---|---|---|---|---|
| 1 | 5 kW | 10 ms | 10 Hz | 20 mm/s | 0 mm | FP |
| 2 | 4 kW | 10 ms | 10 Hz | 20 mm/s | 0 mm | PP |
| 3 | 3 kW | 10 ms | 10 Hz | 20 mm/s | 0 mm | NP |
| Alloy | Si (%) | Fe (%) | Cu (%) | Mn (%) | Mg (%) | Cr (%) | Zn (%) | Ti (%) | Tensile Strength (MPa) | Yield Strength (MPa) | Elongation after Fracture (%) |
|---|---|---|---|---|---|---|---|---|---|---|---|
| 6061 | 0.4–0.8 | 0.7 | 0.15–0.4 | 0.15 | 0.8–1.20 | 0.04–0.35 | 0.25 | 0.15 | ≥290 | ≥240 | 7 |
Disclaimer/Publisher’s Note: The statements, opinions and data contained in all publications are solely those of the individual author(s) and contributor(s) and not of MDPI and/or the editor(s). MDPI and/or the editor(s) disclaim responsibility for any injury to people or property resulting from any ideas, methods, instructions or products referred to in the content. |
© 2023 by the authors. Licensee MDPI, Basel, Switzerland. This article is an open access article distributed under the terms and conditions of the Creative Commons Attribution (CC BY) license (https://creativecommons.org/licenses/by/4.0/).
Share and Cite
Luo, Z.; Wu, D.; Zhang, P.; Ye, X.; Shi, H.; Cai, X.; Tian, Y. Laser Welding Penetration Monitoring Based on Time-Frequency Characterization of Acoustic Emission and CNN-LSTM Hybrid Network. Materials 2023, 16, 1614. https://doi.org/10.3390/ma16041614
Luo Z, Wu D, Zhang P, Ye X, Shi H, Cai X, Tian Y. Laser Welding Penetration Monitoring Based on Time-Frequency Characterization of Acoustic Emission and CNN-LSTM Hybrid Network. Materials. 2023; 16(4):1614. https://doi.org/10.3390/ma16041614
Chicago/Turabian StyleLuo, Zhongyi, Di Wu, Peilei Zhang, Xin Ye, Haichuan Shi, Xiaoyu Cai, and Yingtao Tian. 2023. "Laser Welding Penetration Monitoring Based on Time-Frequency Characterization of Acoustic Emission and CNN-LSTM Hybrid Network" Materials 16, no. 4: 1614. https://doi.org/10.3390/ma16041614
APA StyleLuo, Z., Wu, D., Zhang, P., Ye, X., Shi, H., Cai, X., & Tian, Y. (2023). Laser Welding Penetration Monitoring Based on Time-Frequency Characterization of Acoustic Emission and CNN-LSTM Hybrid Network. Materials, 16(4), 1614. https://doi.org/10.3390/ma16041614