Article

Mechanical Properties of Titanium/Nano-Fluorapatite Parts Produced by Laser Powder Bed Fusion

1
Department of Orthopaedics, Chi Mei Medical Center, No. 901 Zhonghua Rd., Yongkang District, Tainan 710, Taiwan
2
Department of Mechanical Engineering, Southern Taiwan University of Science and Technology, Tainan 710, Taiwan
*
Authors to whom correspondence should be addressed.
Materials 2023, 16(4), 1502; https://doi.org/10.3390/ma16041502
Submission received: 8 November 2022 / Revised: 1 January 2023 / Accepted: 5 January 2023 / Published: 10 February 2023
(This article belongs to the Special Issue Laser Micromachining of Materials for Biomedical Applications)

Abstract

:
Laser powder bed fusion (L-PBF) has attracted great interest in recent years due to its ability to produce intricate parts beyond the capabilities of traditional manufacturing processes. L-PBF processed biomedical implants are usually made of commercial pure titanium (CP-Ti) or its alloys. However, both alloys are naturally bio-inert, and thus reduce the formation of apatite as implants are put into the human body. Accordingly, in an attempt to improve the bioactivity of the materials used for making orthopedic implants, the present study decomposed fluorapatite material (FA, (Ca10(PO4)6F2)) into the form of nano-powder and mixed this powder with CP-Ti powder in two different ratios (99%Ti + 1%FA (Ti-1%FA) and 98%Ti + 2%FA (Ti-2%FA)) to form powder material for the L-PBF process. Experimental trials were conducted to establish the optimal processing conditions (i.e., laser power, scanning speed and hatching space) of the L-PBF process for the two powder mixtures and the original CP-Ti powder with no FA addition. The optimal parameters were then used to produce tensile test specimens in order to evaluate the mechanical properties of the different samples. The hardness of the various samples was also examined by micro-Vickers hardness tests. The tensile strength of the Ti-1%FA sample (850 MPa) was found to be far higher than that of the CP-Ti sample (513 MPa). Furthermore, the yield strength of the Ti-1%FA sample (785 MPa) was also much higher than that of the CP-Ti sample (472 MPa). However, the elongation of the Ti-1%FA sample (6.27 %) was significantly lower than that of the CP-Ti sample (16.17%). Finally, the hardness values of the Ti-1%FA and Ti-2%FA samples were around 63.8% and 109.4%, respectively, higher than that of the CP-Ti sample.

1. Introduction

Laser powder bed fusion (L-PBF) is one of the most common technologies in metal 3D printing manufacturing processes. In the L-PBF process, the heat energy from a controlled laser beam is used to melt the metal powder layer selectively along a specific scan path defined by the sliced geometry of the CAD file [1]. By repeating the scanning process in a layer-by-layer fashion, L-PBF enables complex geometry parts to be produced without the need for molding. It thus has strong potential for producing medical implants, which typically have a highly customized and intricate design [2,3,4,5]. However, one of the key challenges in producing such implants using the L-PBF process is that of determining the appropriate processing conditions that yield mechanical properties close to those of human bone (e.g., a Young’s modulus around 15–30 GPa) [3,4,6,7].
In an attempt to resolve this issue, several studies [2,3,8,9,10,11] have used the L-PBF process to fabricate titanium alloy lattice structures (also known as cellular or porous structures) with elastic modulus values close to that of human bone, thereby reducing the stress-shielding effect. These studies focus mainly on the effects of unit cell designs on the mechanical properties of 3D printed parts. Broadly speaking, unit cell designs can be categorized as either “scaffold-based” or “minimal surface” [7]. Chen et al. [2] produced porous Ti6Al4V scaffolds using the L-PBF process and showed that as the porosity of the porous structure increased from 43% to 71%, the Young’s modulus coefficient decreased from 55.8 to 7.8 GPa and the yield stress decreased from 565 to 62 MPa. Furthermore, for a porosity of 67%, the Young’s modulus and yield stress values (15 GPa and 129 MPa, respectively) approached those of human bone (14.8 GPa and 130 MPa, respectively), Hollander, Dirk A., et al. [8] showed that L-PBF porous structures with a pore size of 500 µm demonstrated a better bioactivity than dense structures produced by traditional manufacturing processes. Choy, Sing Ying, et al. [12] produced strut-based and honeycomb lattice structures by L-PBF processing and found that abrupt shear failure took place at the opposite corners of the lattice samples during compression testing since the diagonal struts in the planar section were oriented parallel to the compression direction. Additionally, the authors in reference [13] employed an experimental approach to find the processing conditions that can fabricate high-performance Ti6Al4V parts using the L-PBF process.
Carpenter et al. [10] were the first group to fabricate implant components with “minimal surface” designs using the L-PBF process. Several experimental studies [11,12] subsequently showed that “minimal surface” designs have numerous advantages over traditional strut-based designs, including a more efficient load transmission performance (and hence lower stress-shielding effect) than strut-based designs as a result of their greater degree of connectivity.
The long-term success of 3D printed biomedical implants depends on their biocompatibility and bioactivity. Han et al. [14] mixed nano-scale hydroxyapatite (HA) with CP-Ti and found that the resulting L-PBF processed parts had a significantly higher micro-hardness and nano-hardness than the original CP-Ti samples. Marcu et al. [15] similarly added HA to Ti6Al7Nb alloy powder to form a bio-composite powder for L-PBF processing. The experimental results showed that, given an appropriate selection of the processing conditions, the biocompatibility and mechanical properties of the printed parts were consistent with the requirements of orthopedic implant applications. Huang, Sheng, et al. [16] used the L-PBF process to produce porous titanium-tantalum scaffolds and showed that the biocompatibility of the printed samples was comparable to that of Ti6Al4V and CP-Ti samples. Aristizabal [16] fabricated orthopedic implants with excellent biocompatibility and low elastic modulus using Zr-702 alloy.
The literature contains many studies on the addition of biocompatible substances to a base material to improve the bioactivity and osseointegration of 3D printed implants. While most of these studies use HA as the doping agent, fluorapatite (FA, Ca10(PO4)6F2) also has significant potential for biomedical implants since it has the same apatite phase and a similar composition as that of human teeth and bones [17]. Furthermore, compared with HA, FA has a higher interatomic bonding strength, a lower dissolution rate, a better chemical and thermal stability, and a lower bio-resorption tendency [18,19,20]. As a result, it has many advantages over HA as a biomedical coating material, including an improved physical robustness (i.e., reduced cracking and flaking) and superior corrosion resistance. However, to the best of the current authors’ knowledge, the literature contains no studies on the addition of FA to CP-Ti powder to produce a bio-composite powder for L-PBF processing.
Accordingly, the we prepared three Ti-FA biocomposite powders with mixture ratios of 100%Ti, 99%Ti + 1%FA, and 98%Ti + 2%FA, respectively. Experimental trials were conducted to explore the optimal L-PBF processing conditions (i.e., laser power, scanning speed and hatching space) for each mixture. The mechanical properties and hardness of the specimens fabricated using the determined L-PBF parameters were then evaluated and compared.

2. Experimental Procedures

2.1. Powder Preparation

CP-Ti powder was purchased from AVIC Metal Powder Metallography Company (Taiwan). The metal powder particles were approximately spherical and had a size of 15~53 µm. In particular, the powder size distribution was analyzed by the Beckman Coulter ls320 analyzer. The particle size distribution conforms normal distribution with d10 = 19.86 µm; d50 = 31.84 µm; d90 = 49.06 µm. The chemical composition of the CP-Ti powder is shown in Table 1.
FA powder with a particle size of 0.4~0.8 μm was prepared by synthesizing Ca3(PO4)2 and CaF2 using a pressure-less stoichiometric method in accordance with the reaction 3Ca3(PO4)2 + CaF2 → Ca10(PO4)6F2 [21]. Briefly, 3Ca3(PO4)2 and CaF2 were mixed with a molar ratio of 3:1 and then further mixed with ethanol with a molar ratio of 1:3 and stirred for 24 h. The resulting mixture was dried at a temperature of 120 °C for 24 h and sieved with a standard 120 mesh. The sieved powder was placed in a furnace and heated to 300 °C at a rate of 20 °C/min. The temperature was maintained at 300 °C for 30 min and was then further increased to 500 °C at a ramp rate of 15 °C per minute. Following a heating period of 30 min, the temperature was increased to 800 °C at a ramp rate of 20 °C per minute and held for a further 30 min. Finally, the temperature was increased to 1010 °C at a heating rate of 7 °C per minute, and the powder was sintered for 9 h. Following the sintering process, the furnace was allowed to cool to room temperature and the bulk FA material was retrieved. The bulk FA was manually milled into the form of powder, and the powder was sieved with a standard 120 mesh. The filtered powder was mixed with ethanol and was then ground using aluminum grinding balls with a volume ratio of 1:3, a rotation speed of 120 rpm, and a milling time of 120 h to obtain powder particles with a size of around 1 µm. After the milling process, the FA slurry was vacuum dried to remove any excess ethanol and obtain the final desired FA product.
Bio-composite powders were prepared by adding 1 wt.% and 2 wt.% of FA powder, respectively, to CP-Ti powder. The two powder mixtures were individually mixed with ethanol in a volume ratio of 10:1. The mixtures were stirred evenly until no agglomeration was observed and were then dried in a furnace at 70 °C to remove the ethanol. Following the drying process, the powders were mixed with 20 mm alumina grinding balls in a volume ratio of 1:1 and stirred in a ball mill at 300 rpm for 5 min to obtain the desired Ti + 1%FA and Ti + 2%FA powders.

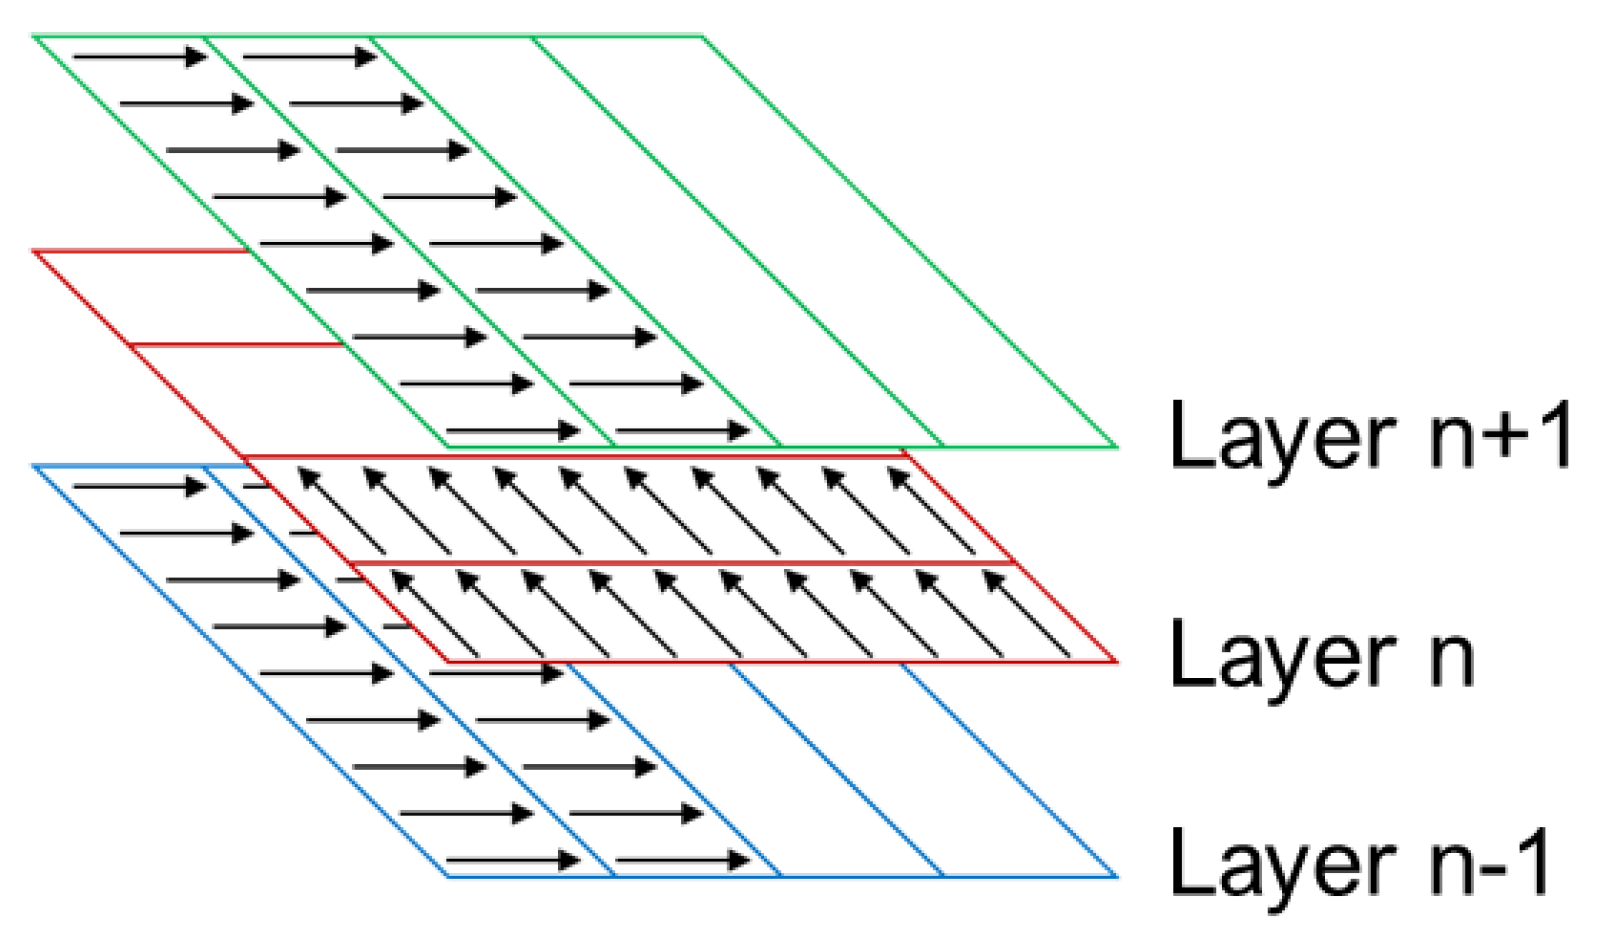
2.2. Laser Powder Bed Fusion Processing

The 3D-printing experiments were carried out on a commercial ITRI AM 100 machine (Industrial Technology Research Institute, Tainan, Taiwan) fitted with a fiber laser source with a wavelength of 1064 nm and a spot size of 78 µm. To prevent oxidation of the metal powder, the printing process was performed in a nitrogen environment with an oxygen concentration of less than 1000 ppm. In the L-PBF process, the quality of the top surface of each layer has a significant impact on the mechanical properties of the final component [21,22]. Accordingly, a surface-scanning technique was employed to determine the optimal processing conditions for each powder material. The processing conditions that resulted in a smooth, low-defect surface quality were then used to conduct further 3D printing trials.

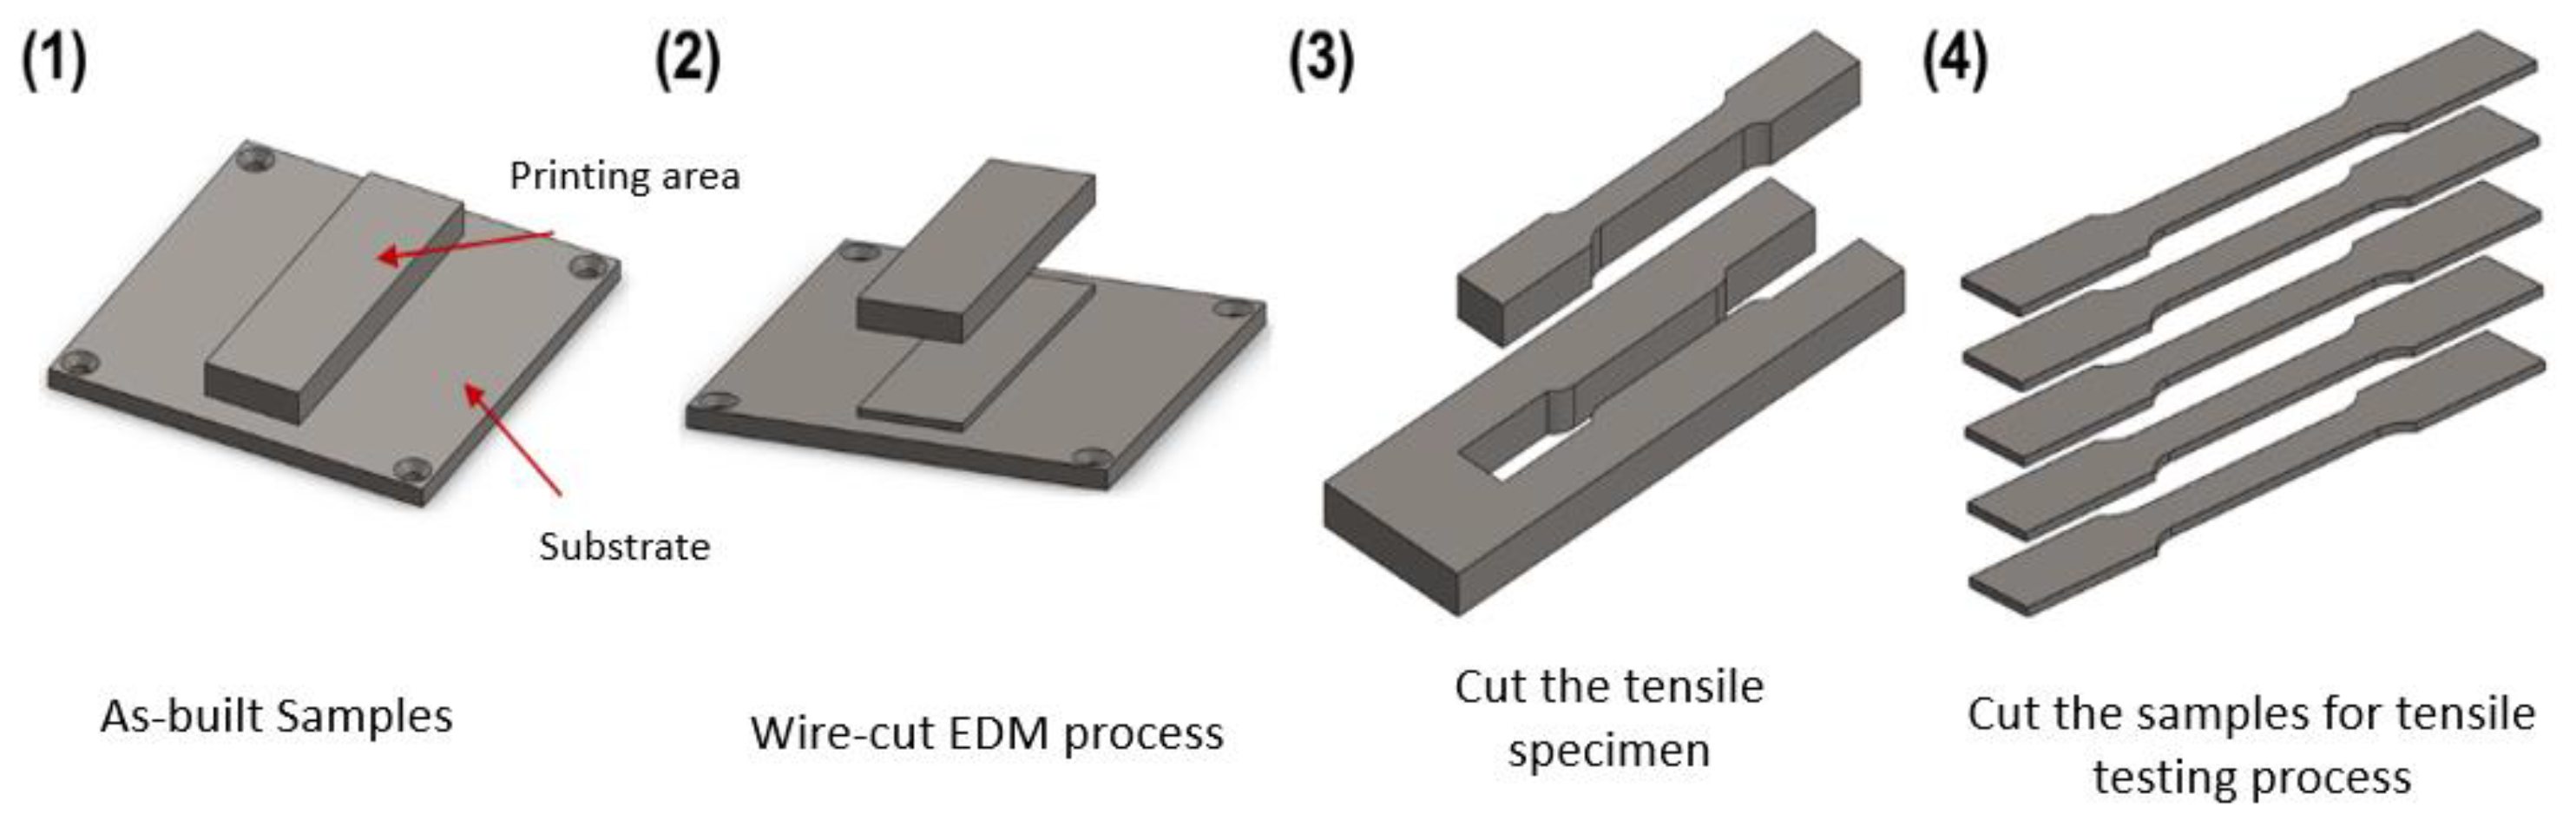
2.3. Mechanical Properties

The mechanical properties of the 3D printed samples were evaluated using a universal tensile testing machine (Chun Yen Testing Machines Co., Ltd., Taichung, Taiwan) with a maximum load capacity of 1000 kg. For each sample, testing was performed using an initial strain rate of 8.33 × 10⁻⁴ s−1 corresponding to a crosshead of 1 mm/min according to the standards defined in literatures [4,17]. In preparing the tensile test samples, the as-built samples machined into tensile test specimens using a wire electric discharge machining (WEDM) technique (Figure 1). The dimensions of the specimens were designed in accordance with the ASTM-E8 standard, as shown in Figure 2. The micro-hardness of the samples was measured using a Micro-Vickers hardness testing machine (HM-113, Mitutoyo, Kawasaki, Japan). The hardness tests were performed with a measurement length of 700 µm at 10× magnification and 140 µm at 50× magnification.

2.4. Microstructural Characterization

The microstructures and chemical compositions of the L-PBF samples were analyzed using an S-3000N scanning electron microscope (SEM, Hitachi, Tokyo, Japan) fitted with an EX-250 energy-dispersive spectroscopy (EDS) microprobe system. Phase identification was performed using a D2-PHASER X-ray diffraction (XRD) system (Bruker, Berlin, Germany) with a Cu tube and a working voltage and current of 30 kV and 10 mA, respectively. The surface roughness of the samples was analyzed using the VK-X200K confocal microscope.

3. Results and Discussion

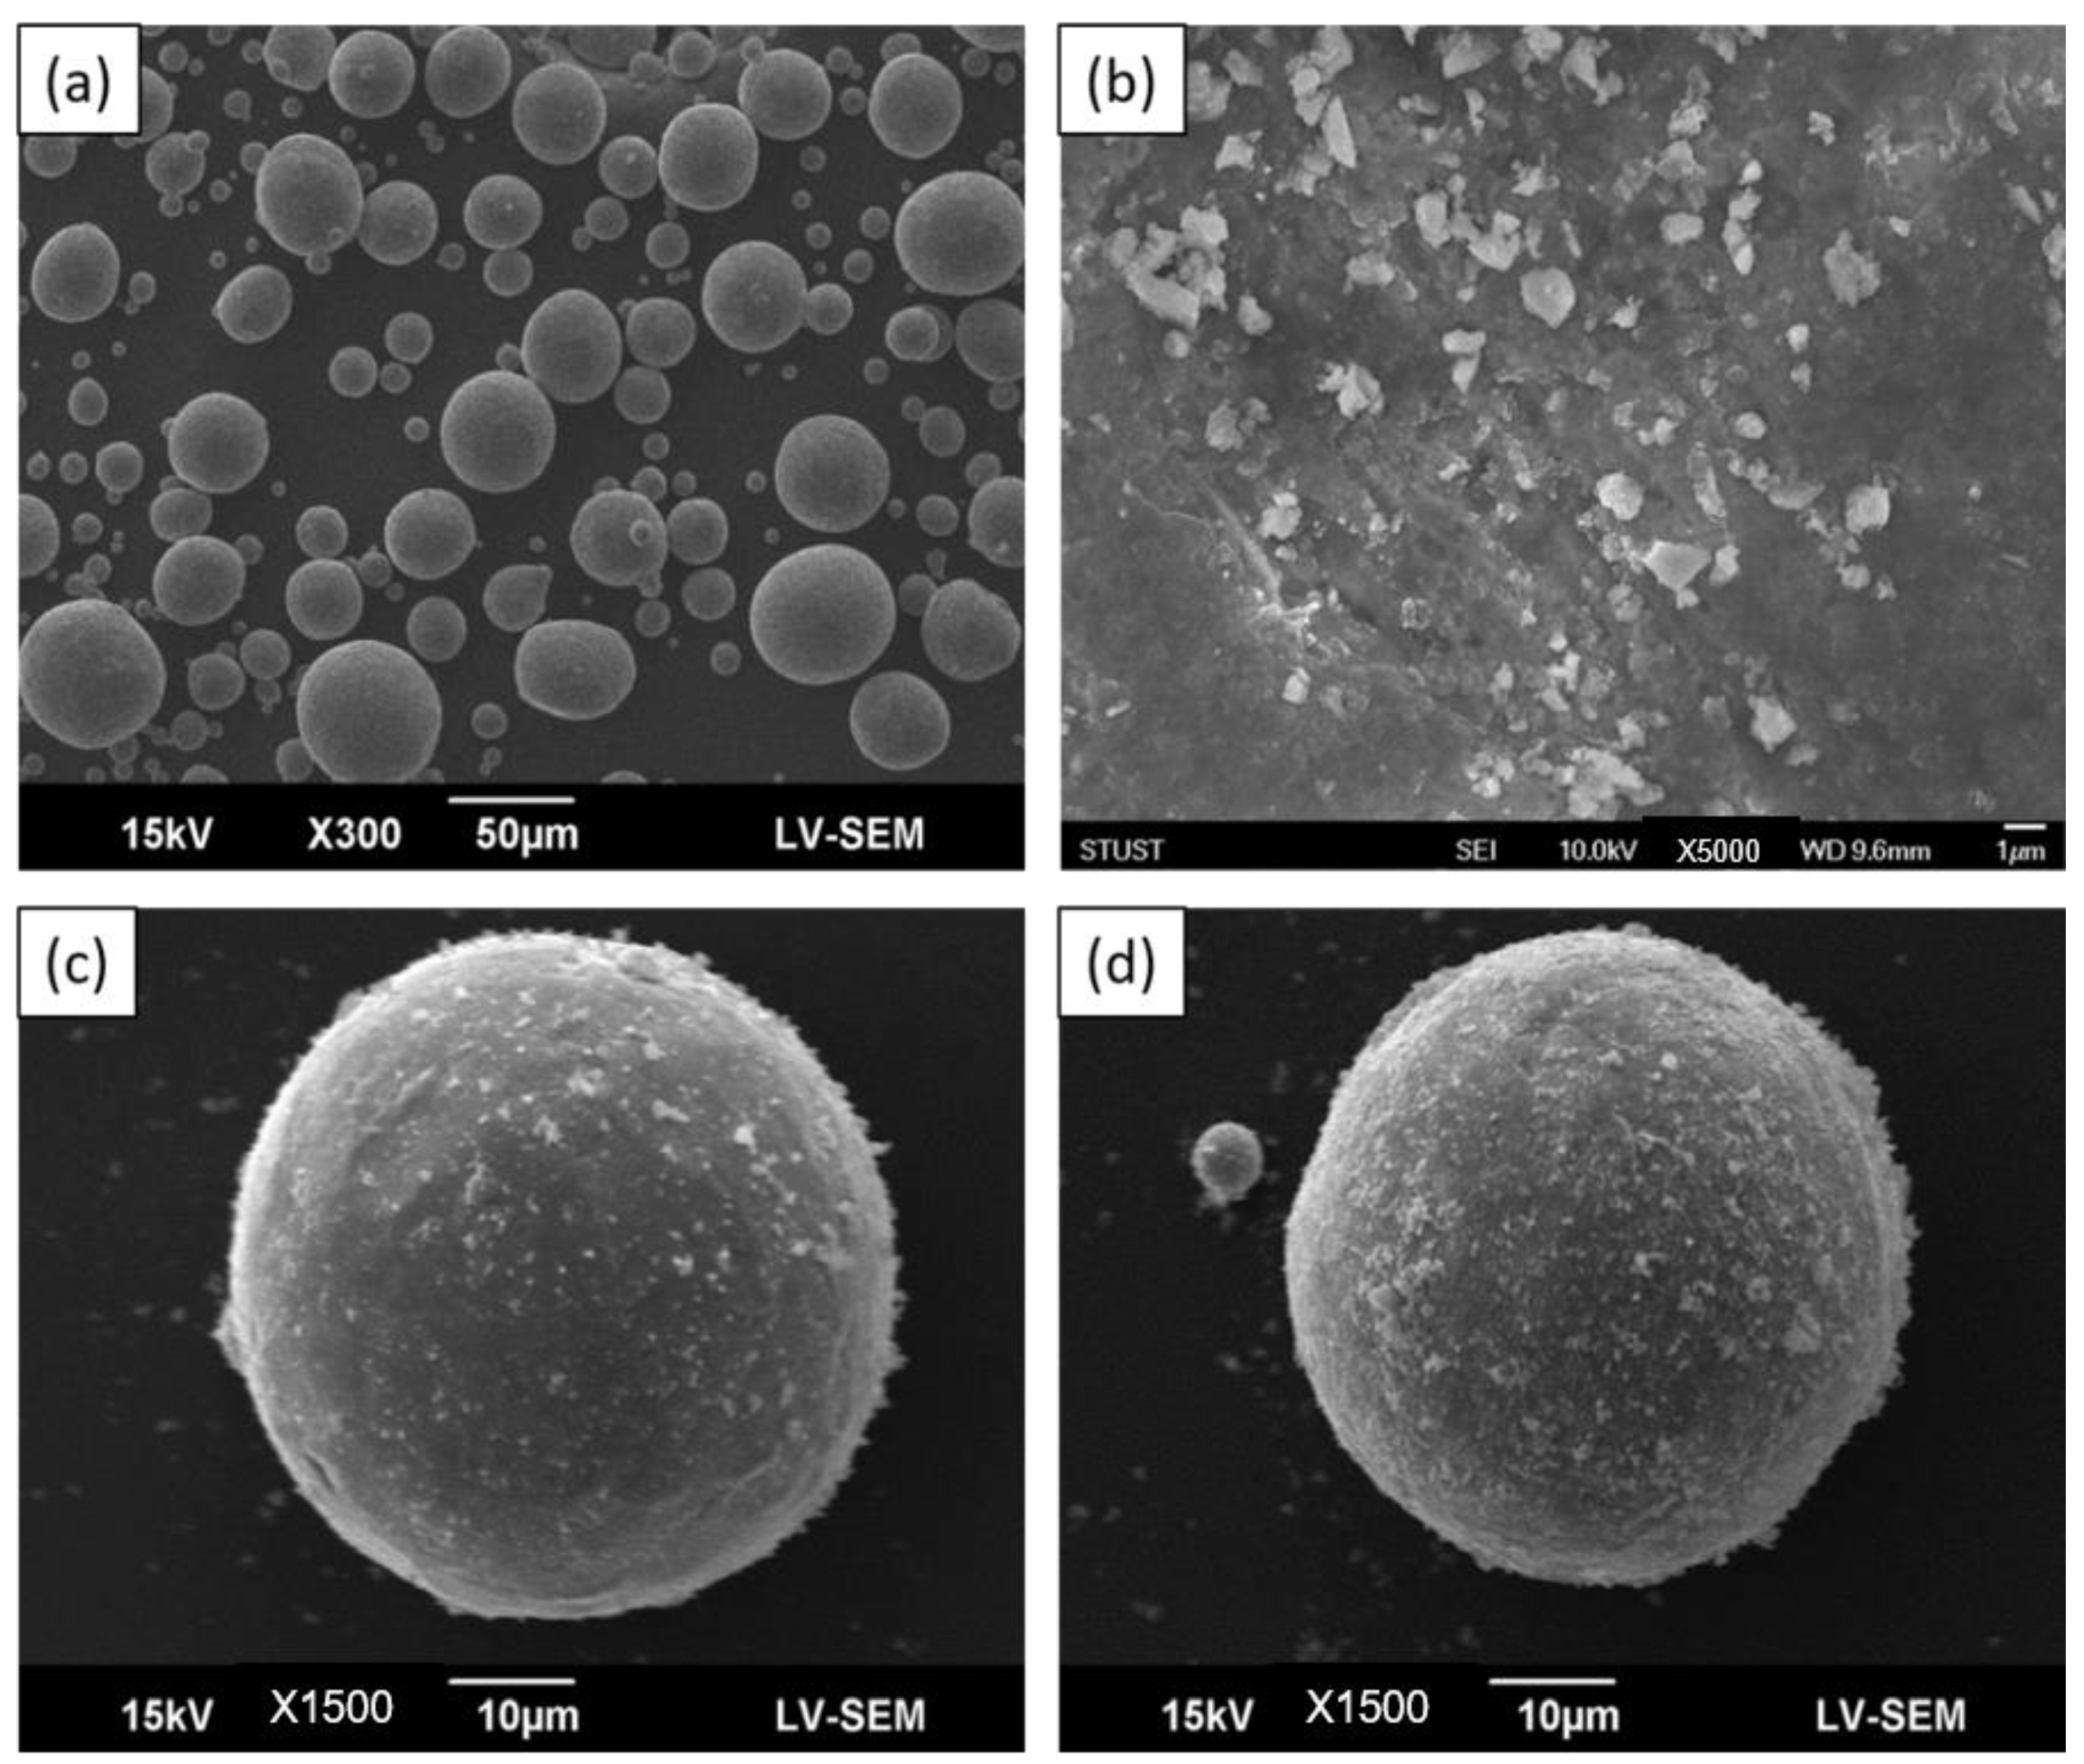
3.1. Composite Powders

Figure 3a,b show the surface morphologies of the CP-Ti powder and FA powder, respectively. Figure 3c,d present the surface morphologies of the composite powders with 1 wt.% and 2 wt.% FA addition, respectively. For the Ti-1%FA powder, the FA particles were evenly distributed on the surface of the Ti particles, and the composite particles retained the spherical form of the original powders. For the Ti-2%FA powder, the FA particles were again uniformly distributed on the Ti particles. In general, the thermal conductivity of FA (0.02 W/mK [23]) was much lower than that of Ti (20.5 W/mK [24]). Thus, to ensure the simultaneous melting of the FA and Ti particles during the L-PBF process, the FA particles must be much smaller than the Ti particles. Accordingly, prior to mixing with the CP-Ti matrix, the FA particles were ball-milled to a size of approximately 1 µm. The small particle size increased the surface energy of the particles and hence enhanced their adhesion force to the larger CP-Ti particles. Furthermore, the use of ethanol in preparing the Ti-FA composite powders improved the uniformity of the FA particle dispersion on the Ti particle surface. During the subsequent drying process, the ethanol in the Ti-FA mixture evaporated, thereby reducing the liquid region between the FA powder and the CP-Ti particles. Consequently, a capillary force effect was induced, which further contributed to the attachment of the FA powder on the CP-Ti particle surface [25]. According to [25], spherical metal powders increase the flow-ability of the metal powder layer in the L-PBF process, and hence improve the stability of the printing process. The SEM images in Figure 3c,d confirm that both composite powders have a spherical morphology and are thus suitable as a feedstock material for L-PBF processing.
Figure 4 shows the XRD pattern of the composite powders; additionally, for comparison purposes, this figure also shows the XRD patterns of the original FA and CP-Ti powders. However, it is hard to observe the FA peaks in composite powders. For clearly demonstrating the existence of FA peak in composite powders, Figure 5 is presented. From Figure 5, it is seen that for the composite powders, the FA peak increases with an increasing FA addition. Nevertheless, since the maximum FA addition is just 2%, the FA peak is still very weak compared with that of the Ti peak in the composite samples.
In summary, from the SEM images shown in Figure 3c,d, it is observed that the FA nanoparticles disperse uniformly on the single CP-Ti powders. Furthermore, the XRD patterns shown in Figure 4 and Figure 5 further confirm the present of FA peak in the composite powders. Thus, it can be verified that by using the proposed approach, the FA nanoparticles are able to spread uniformly on the surface of CP-Ti particles.

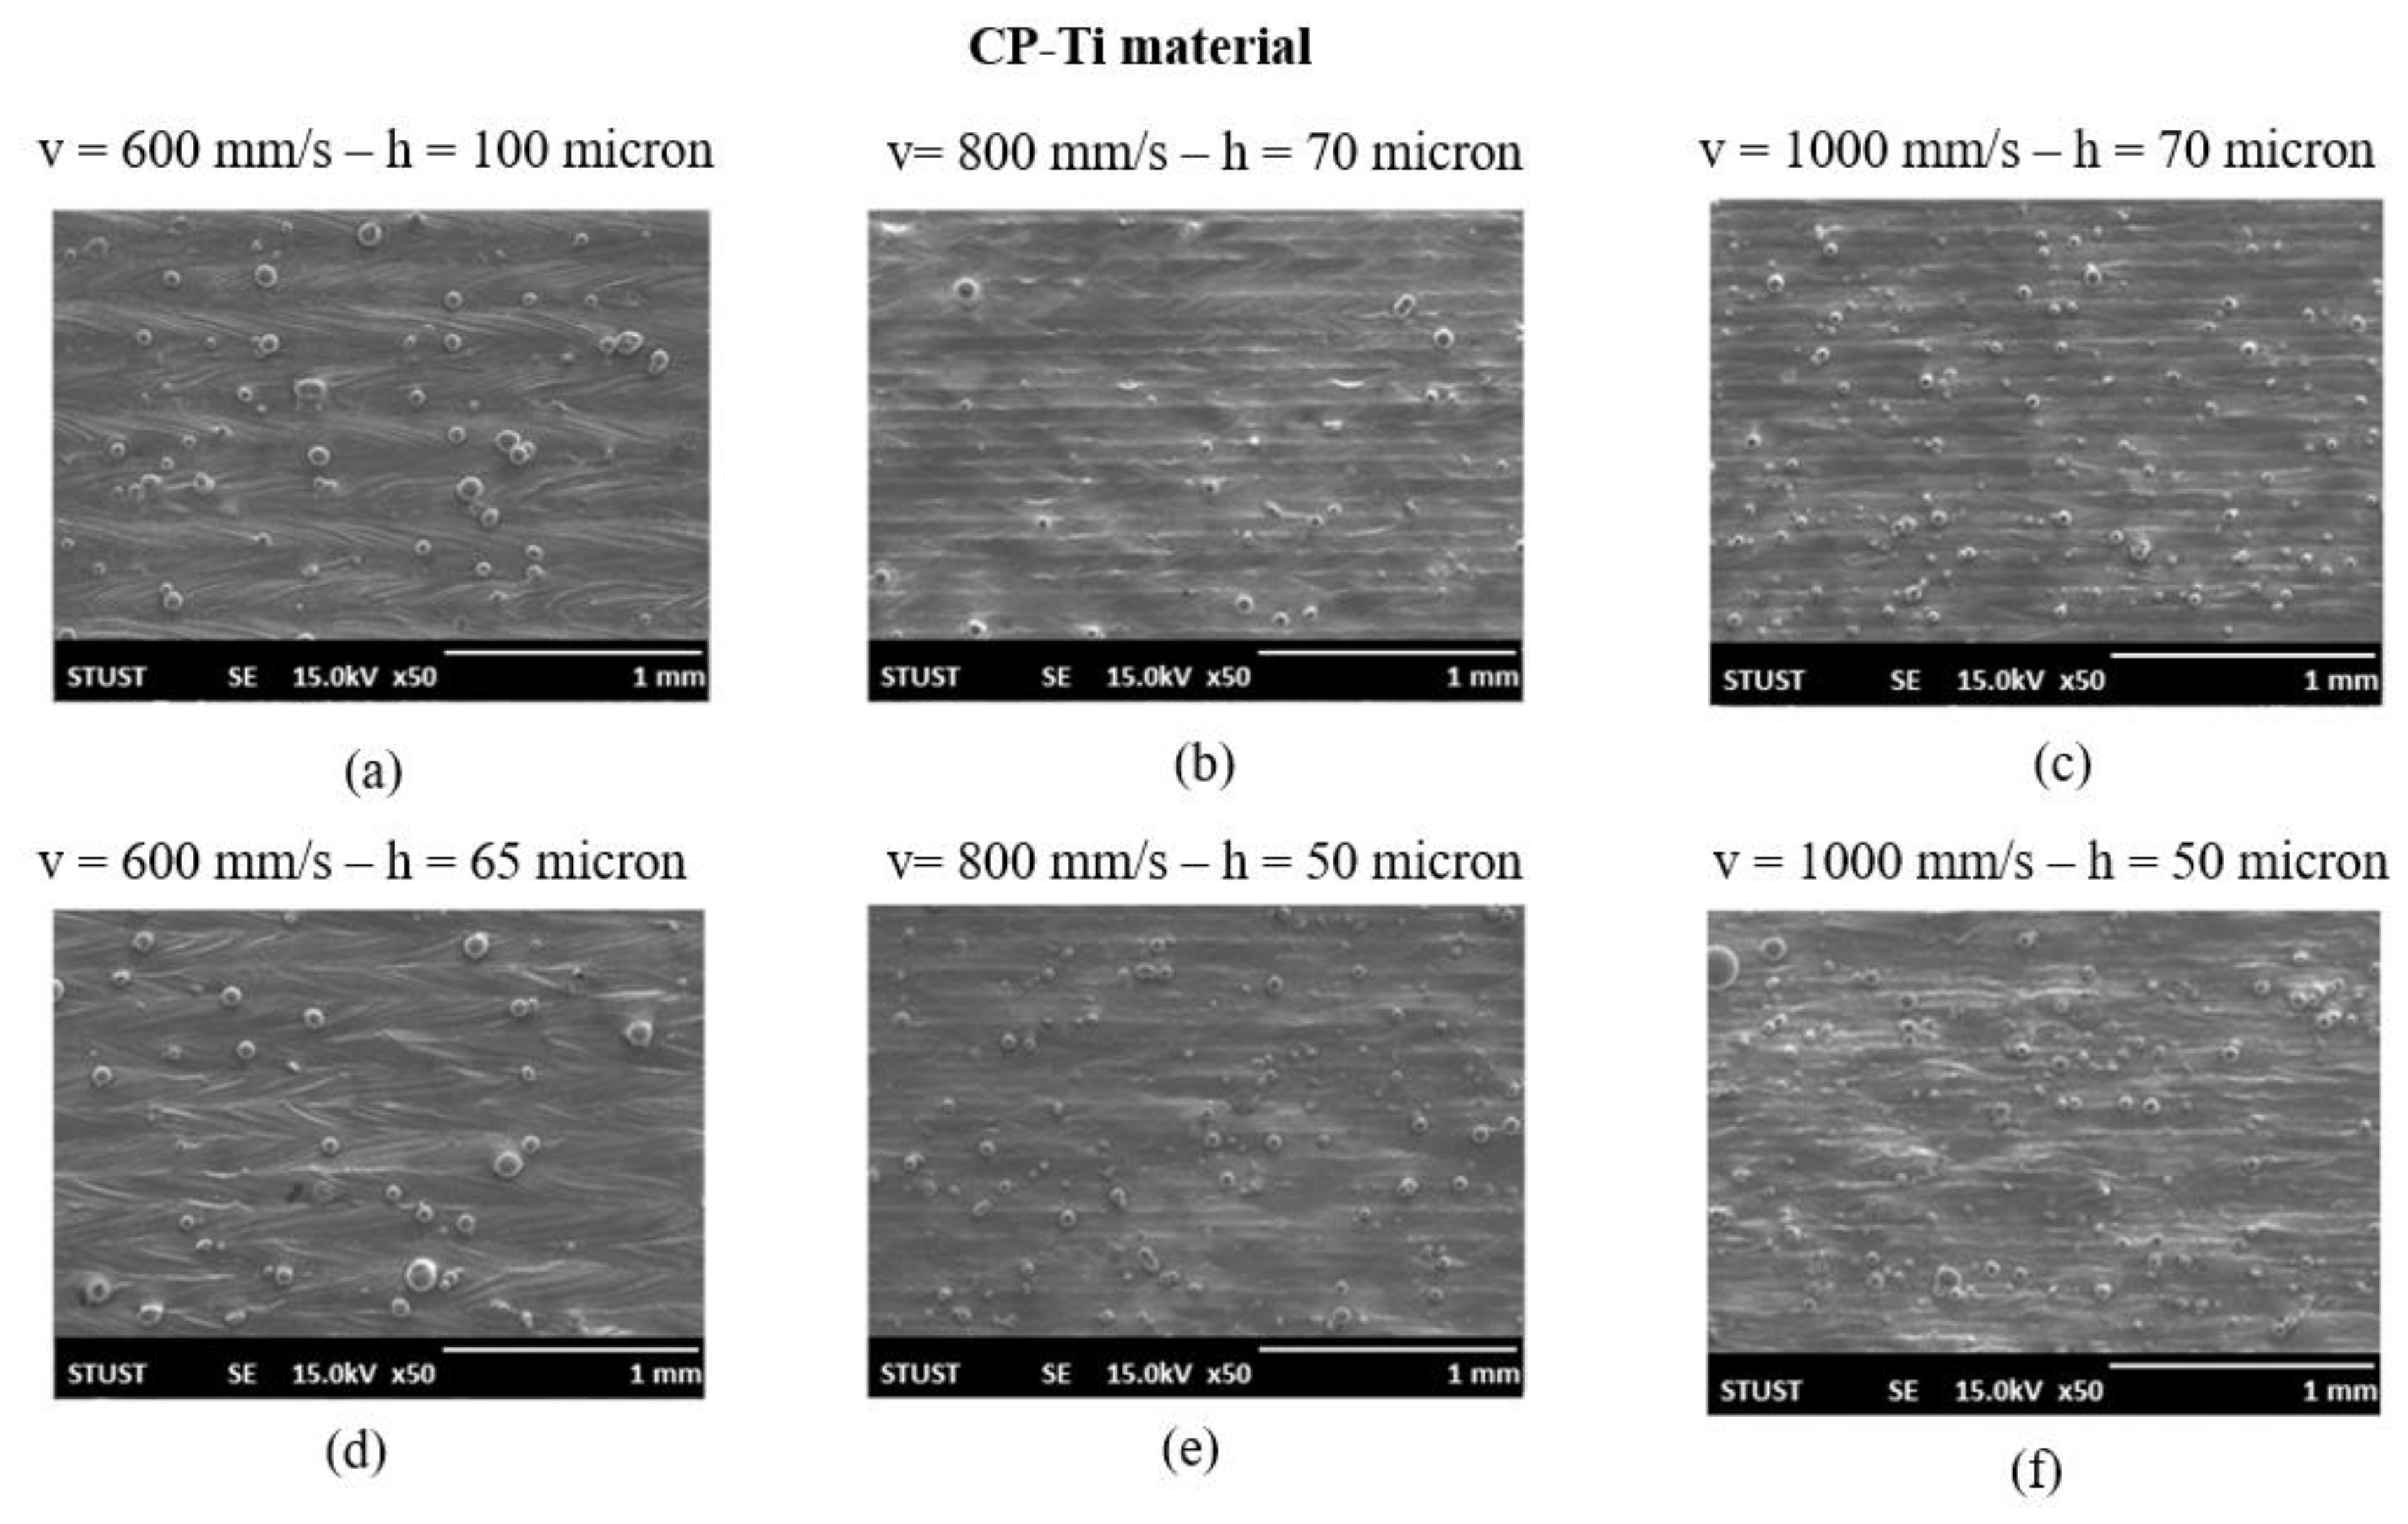
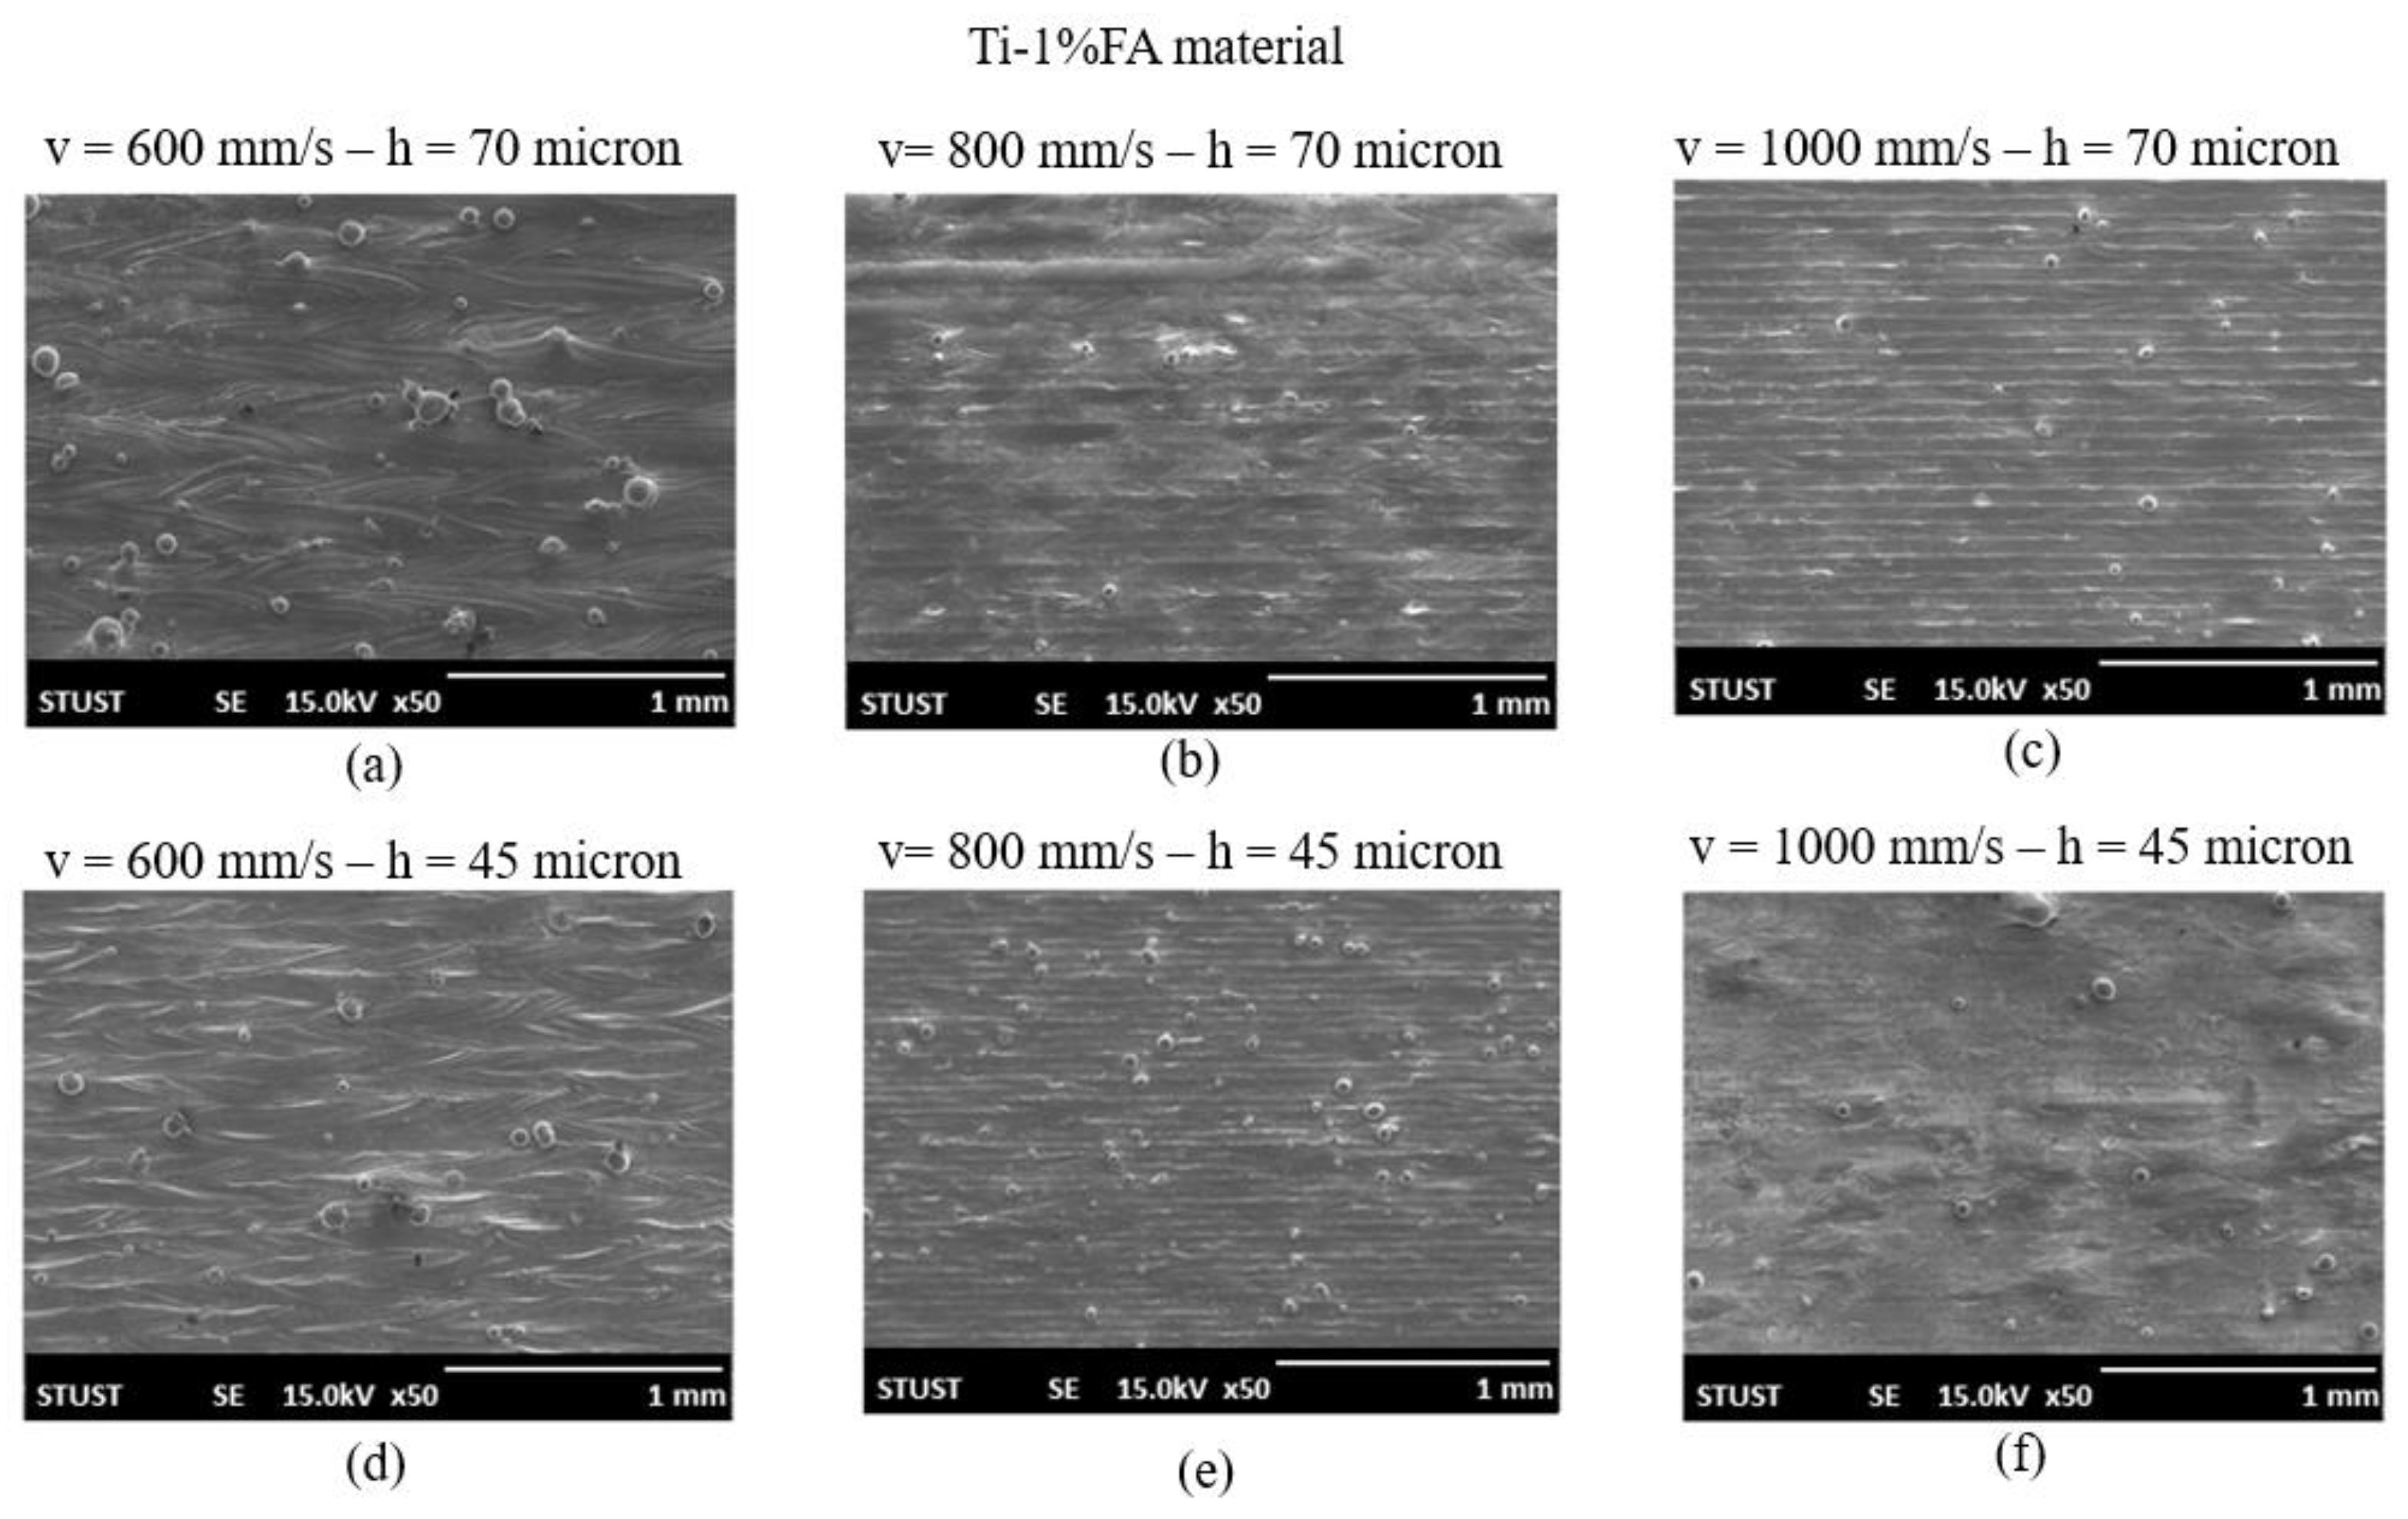
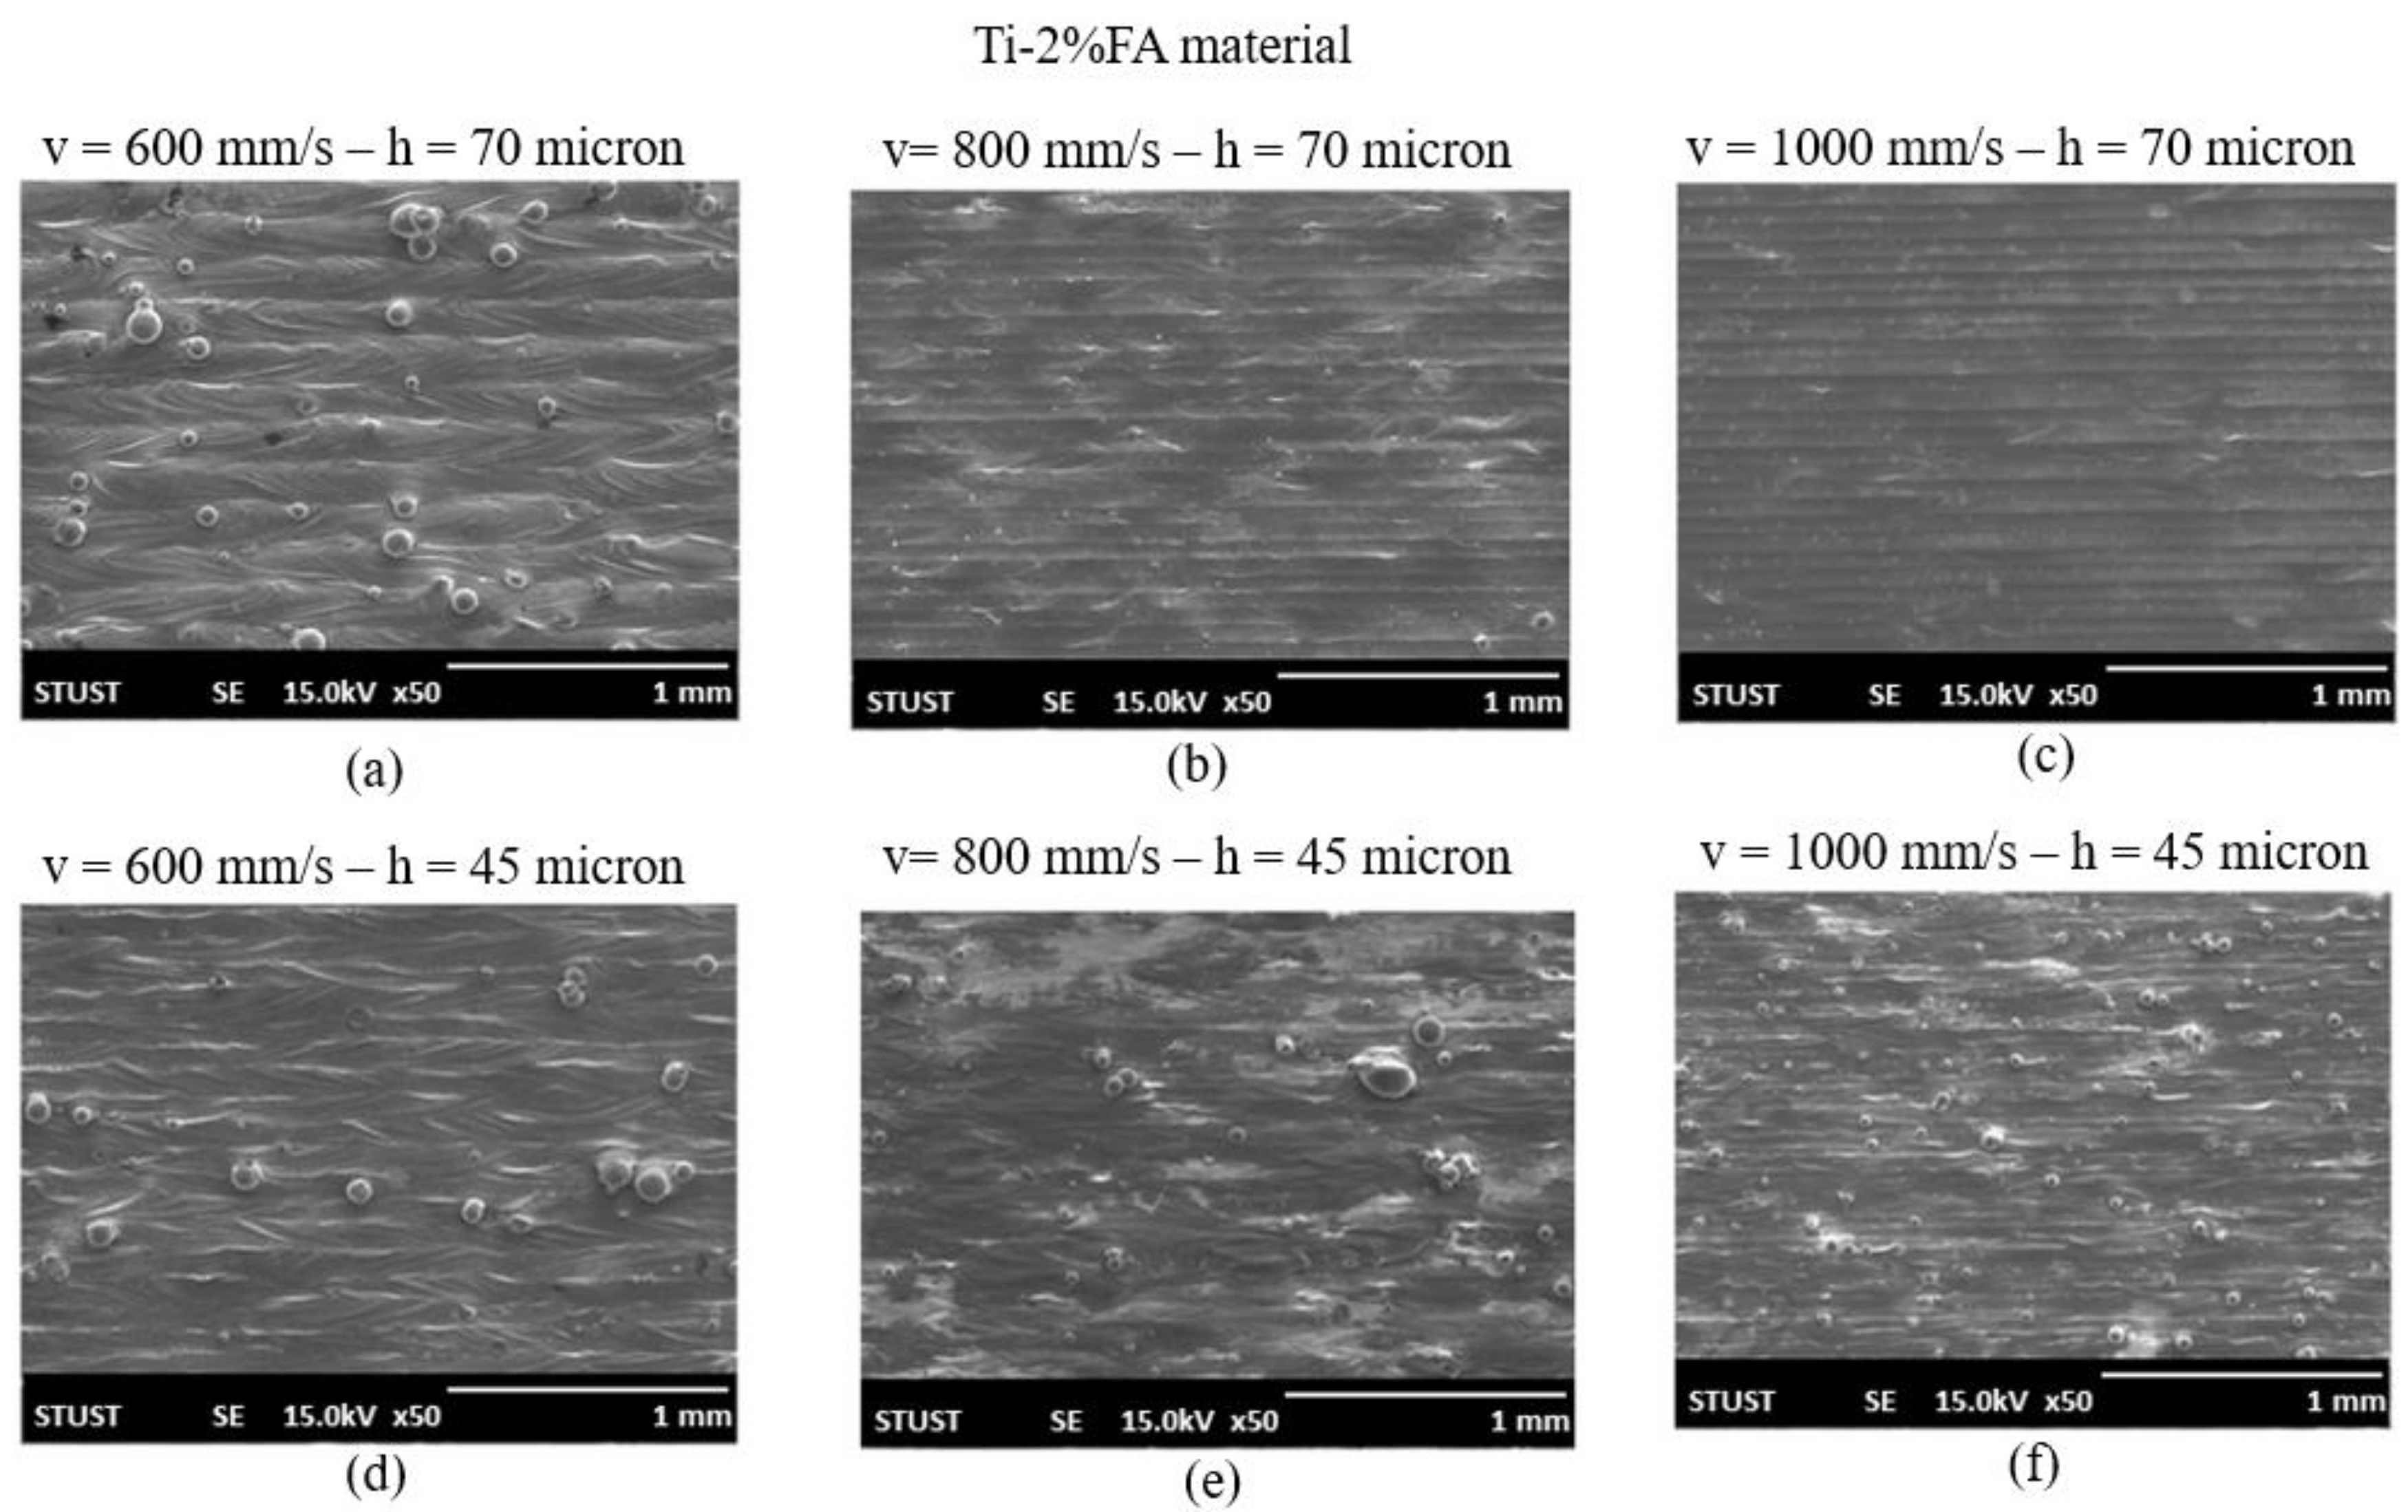
3.2. Determination of Optimal Processing Parameters for L-PBF Experiments

The L-PBF process fabricates 3D parts in a layer-by-layer manner [22]. Consequently, the quality of the top surface of the intermediate layers has a significant effect on the mechanical properties of the final component. Accordingly, a series of trials was performed to determine the optimal processing conditions (i.e., laser power, scanning speed, and hatching space) for the present CP-Ti, Ti-1%FA. and Ti-2%FA powders. For each material, cubic samples with a size of 10 mm × 10 mm × 0.4 mm were printed using a constant laser power of 150 W and the scanning speed and hatching space settings shown in Table 2. The surface morphologies of the top surfaces of the cubic samples were then analyzed by SEM to determine the optimal processing conditions for each of the powder materials.
Figure 6 presents SEM images of the top surface morphologies of the six CP-Ti samples fabricated using the various processing conditions listed in Table 2. It is seen that for the lowest scanning speed of 600 mm/s (Figure 6a,d), the high energy density led to extreme evaporation during the printing process, and hence the sample surface contained a large number of spattered particles. As the scanning speed increased to 800 mm/s, the energy density reduced, and thus the sample produced with a hatching space of 70 µm had a smooth surface (Figure 6b). However, for a lower hatching space of 50 µm, the surface contained a large number of tiny particles (Figure 6e) since the narrow hatching space increases the energy input density and therefore intensifies the evaporation effect. The resulting small spatters were not transported away from the melting zone by the air flow in the chamber, and hence settled back on the sample surface in the form of small particles [26]. As the scanning speed was further increased to 1000 mm/s, the melt pool became unstable and gave rise to a poor surface roughness [21,27]. Consequently, for both settings of the hatching space, the sample surface contained many tiny particles (Figure 6c,f). In general, the results presented in Figure 4 indicate that the optimal L-PBF processing conditions for the CP-Ti samples were a laser power of 150 W, a scanning speed of 800 mm/s, and a hatching space of 70 µm.
Figure 7 shows SEM images of the Ti-1%FA samples fabricated using the processing conditions listed in Table 2. For a low scanning speed of 600 mm/s, the sample surface contained a small number of spattered particles due to the intense evaporation effect induced by the high energy density input and the ejection of molten material from the melt pool (Figure 7a,d). For a scanning speed of 800 mm/s, the sample surface had a smooth appearance, particularly in the case of a wider hatching space (Figure 7b,e). The number of spattered particles reduced yet further as the scanning speed increased to 1000 mm/s (Figure 7c,f). Interestingly, a comparison of Figure 6 and Figure 7 shows that, for same laser power of 150 W, scanning speed of 800 mm/s, and nearly the same hatching space, the Ti-1%FA sample had fewer spatters on the sample surface than the pure CP-Ti sample. This result is reasonable since the addition of FA to the titanium matrix increases the viscosity of the melt pool [28]. Consequently, the ejection of molten particles from the melt pool under the same laser energy density was suppressed, and hence the surface roughness of the sample was improved. Overall, the results presented in Figure 7 show that for the Ti-1%FA powder, the optimal processing conditions were a laser power of P = 150 W, a scanning speed of 1000 mm/s, and a hatching space of 70 µm.
Figure 8 presents SEM images of the Ti-2%FA samples fabricated using the processing conditions listed in Table 2. As for the as-built Ti-1%FA samples, the optimal processing parameters were seen to be a laser power of 150 W, a scanning speed of 1000 mm/s, and a hatching space of 70 µm.

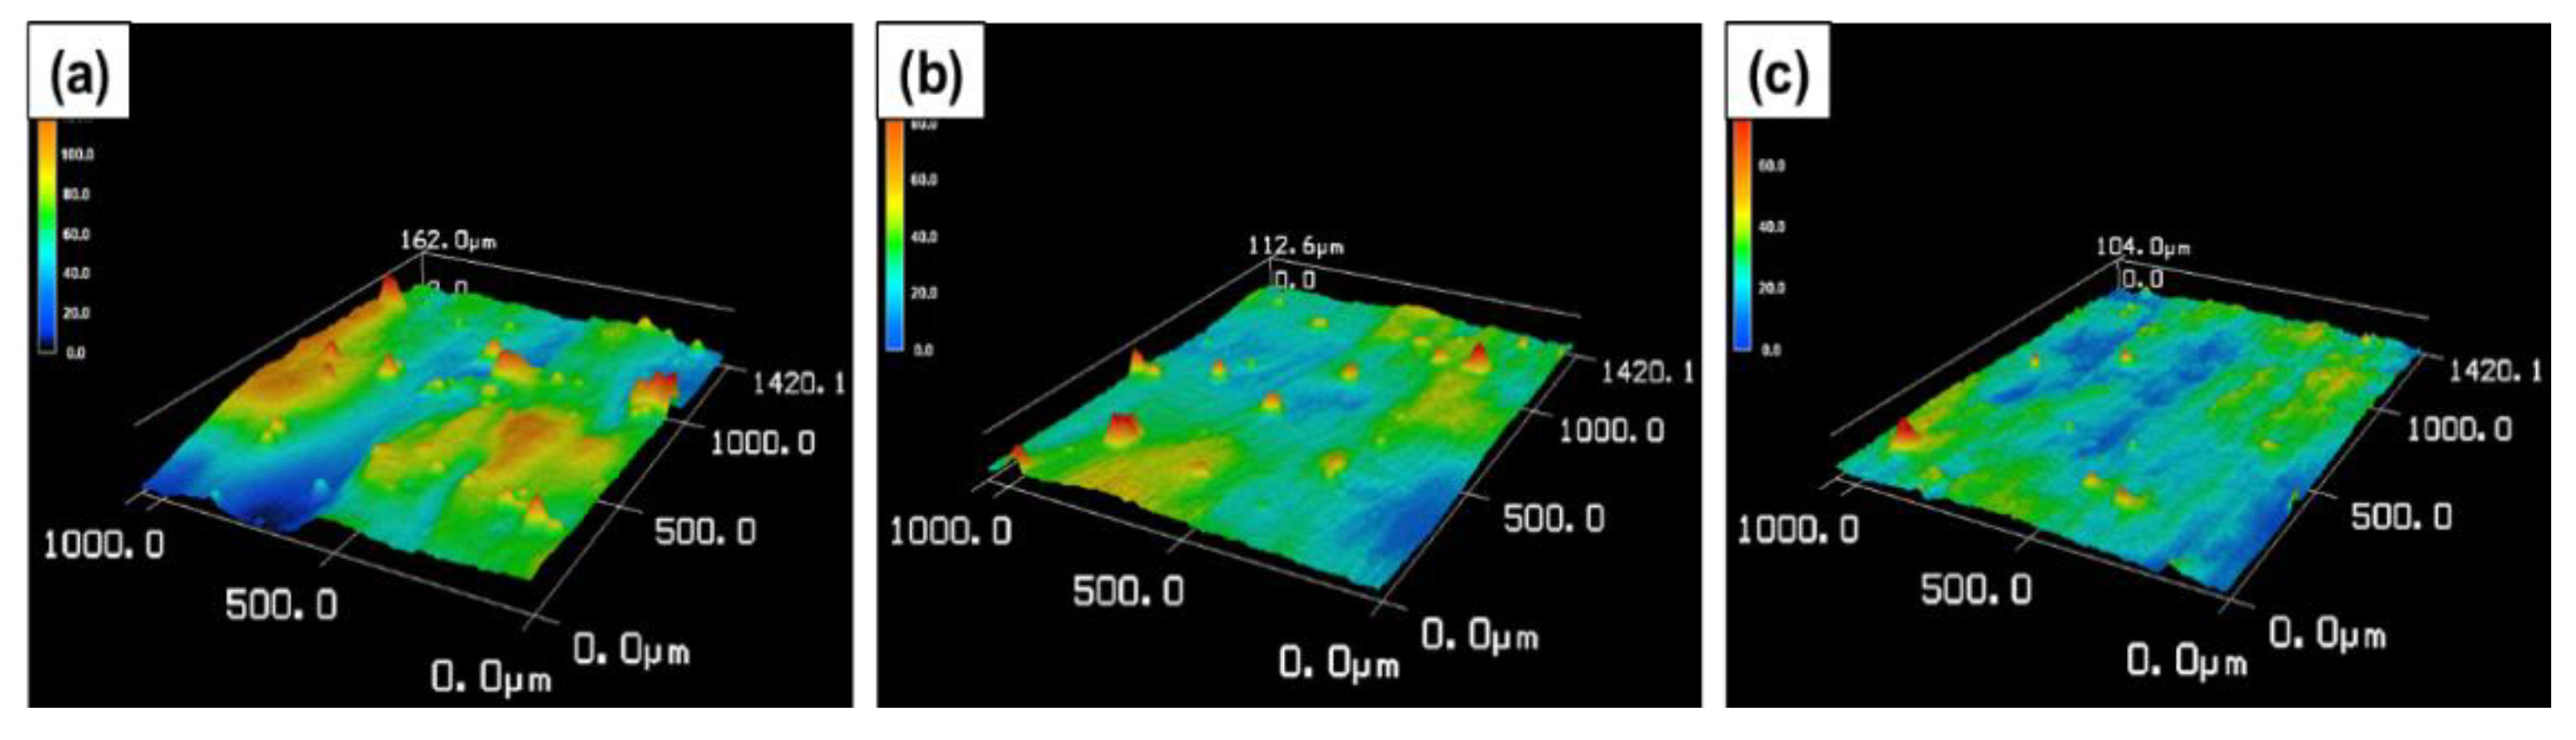
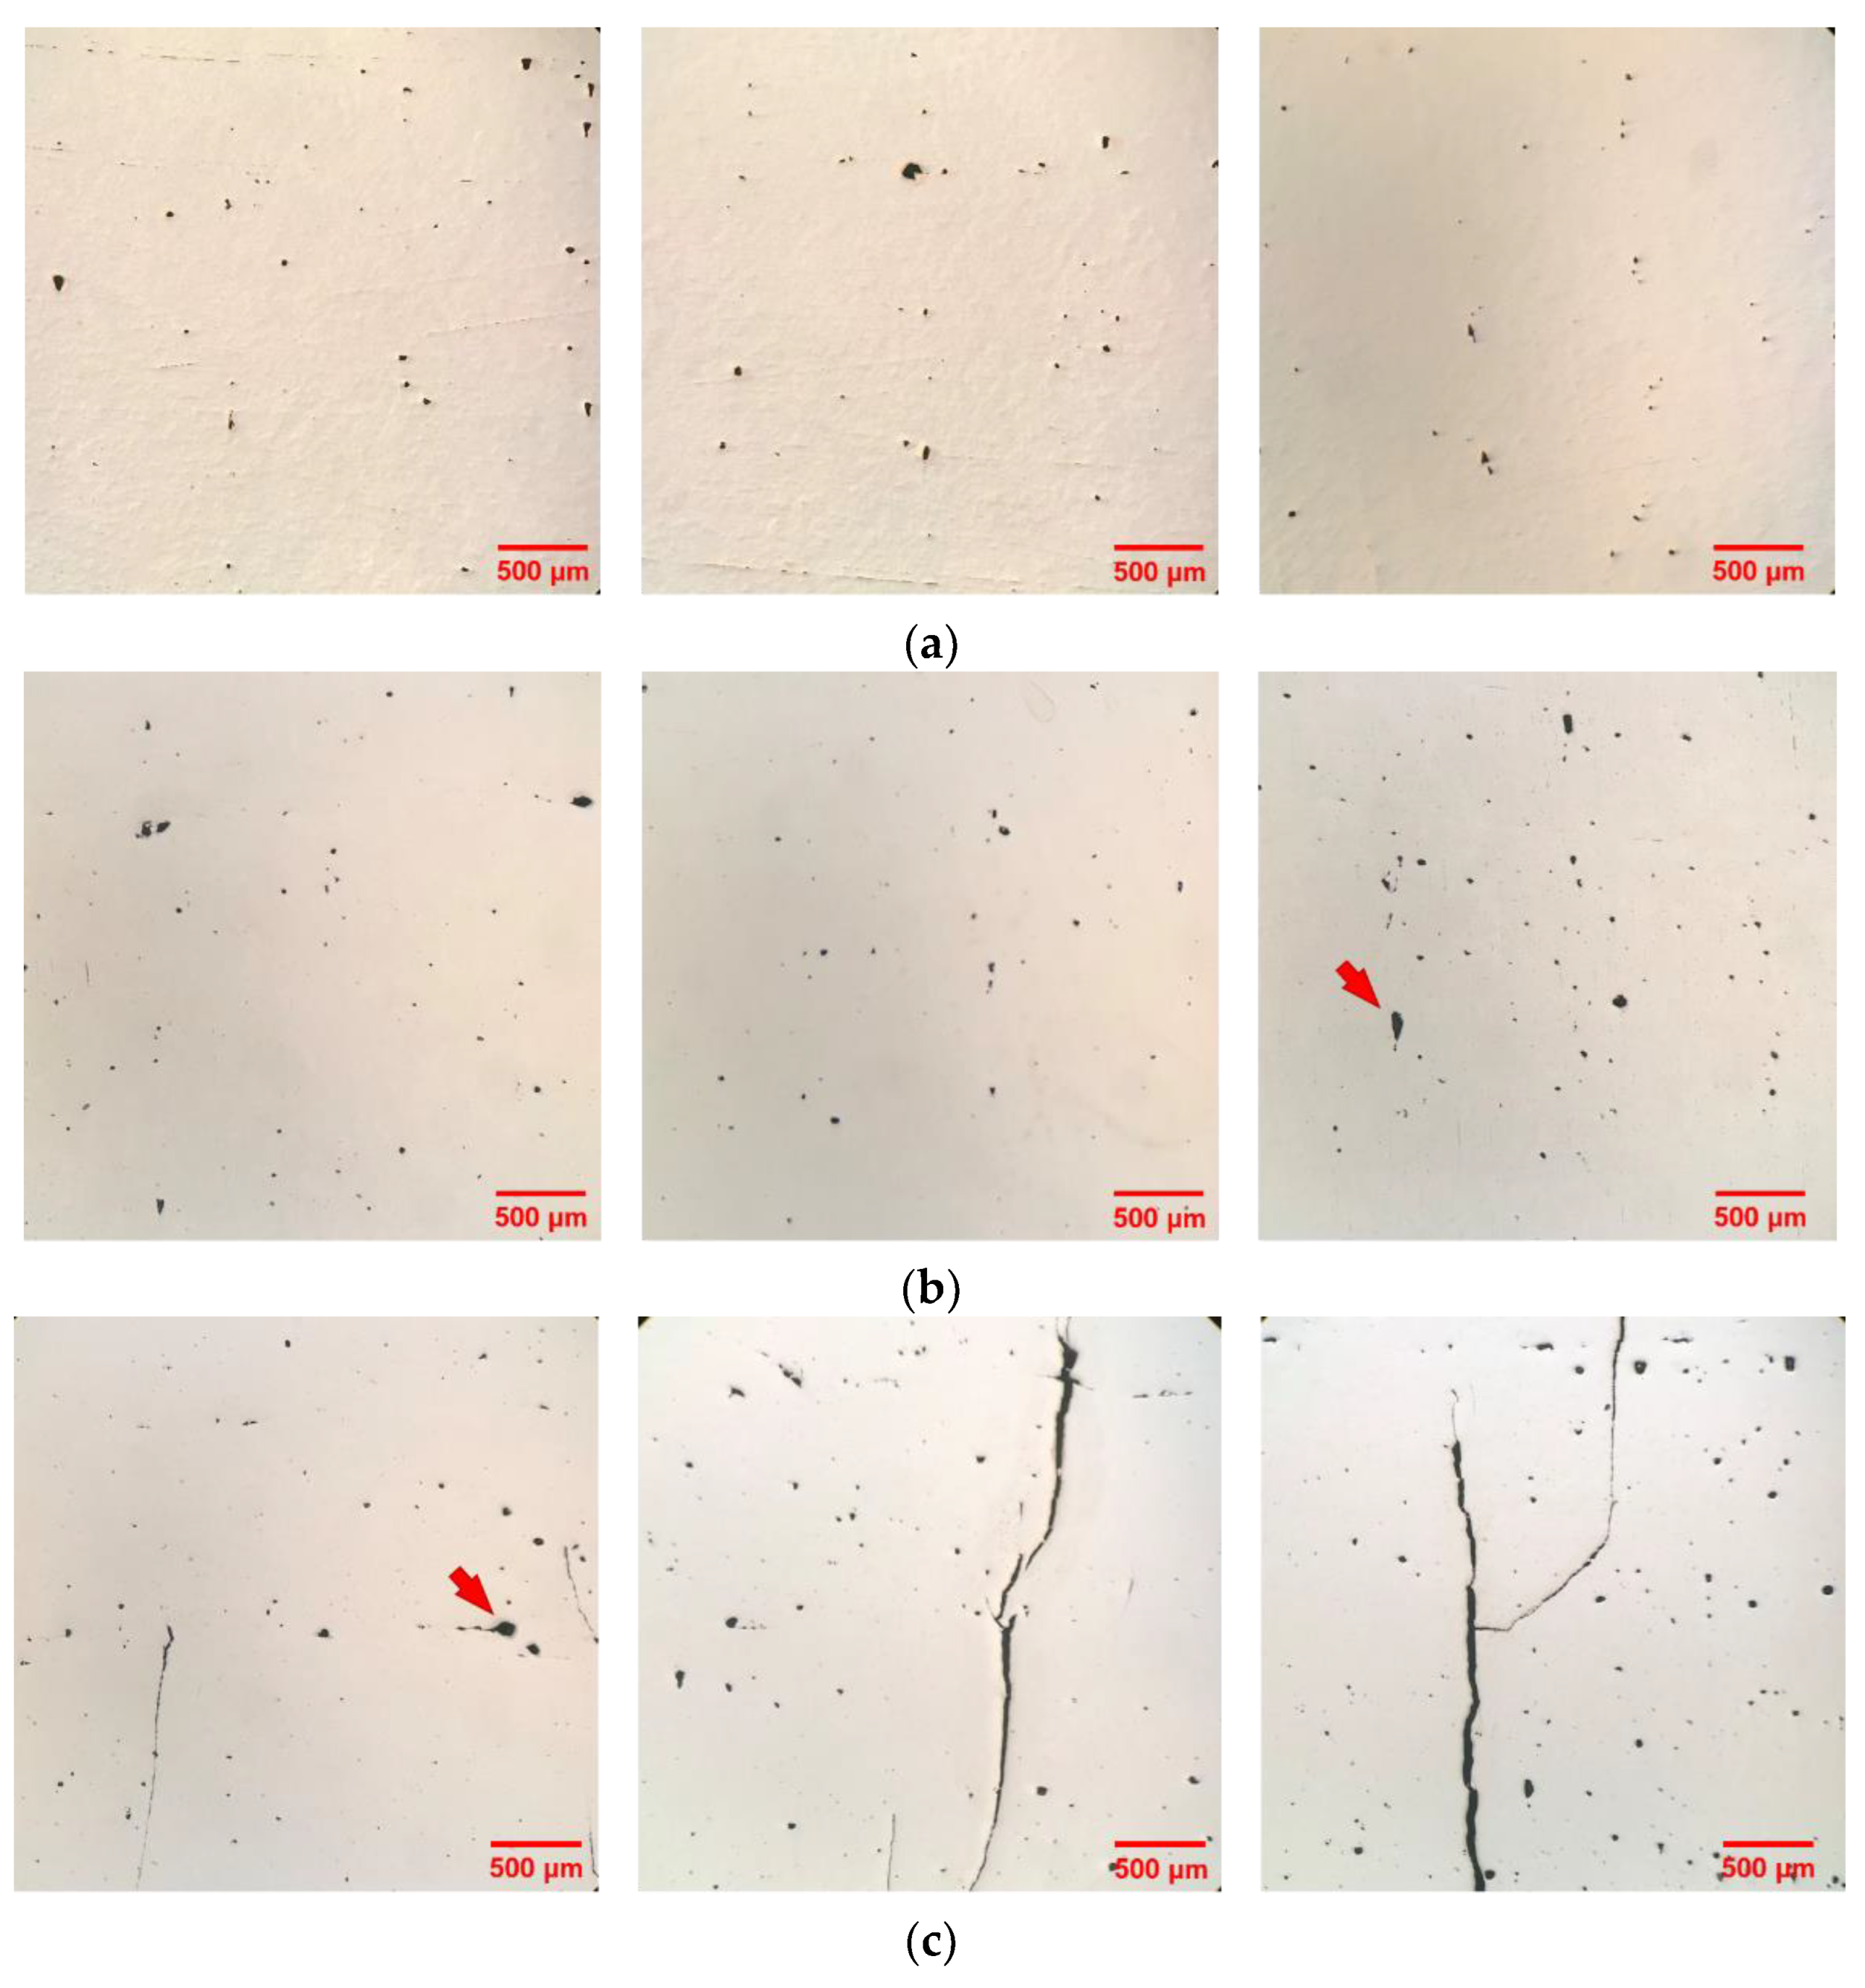
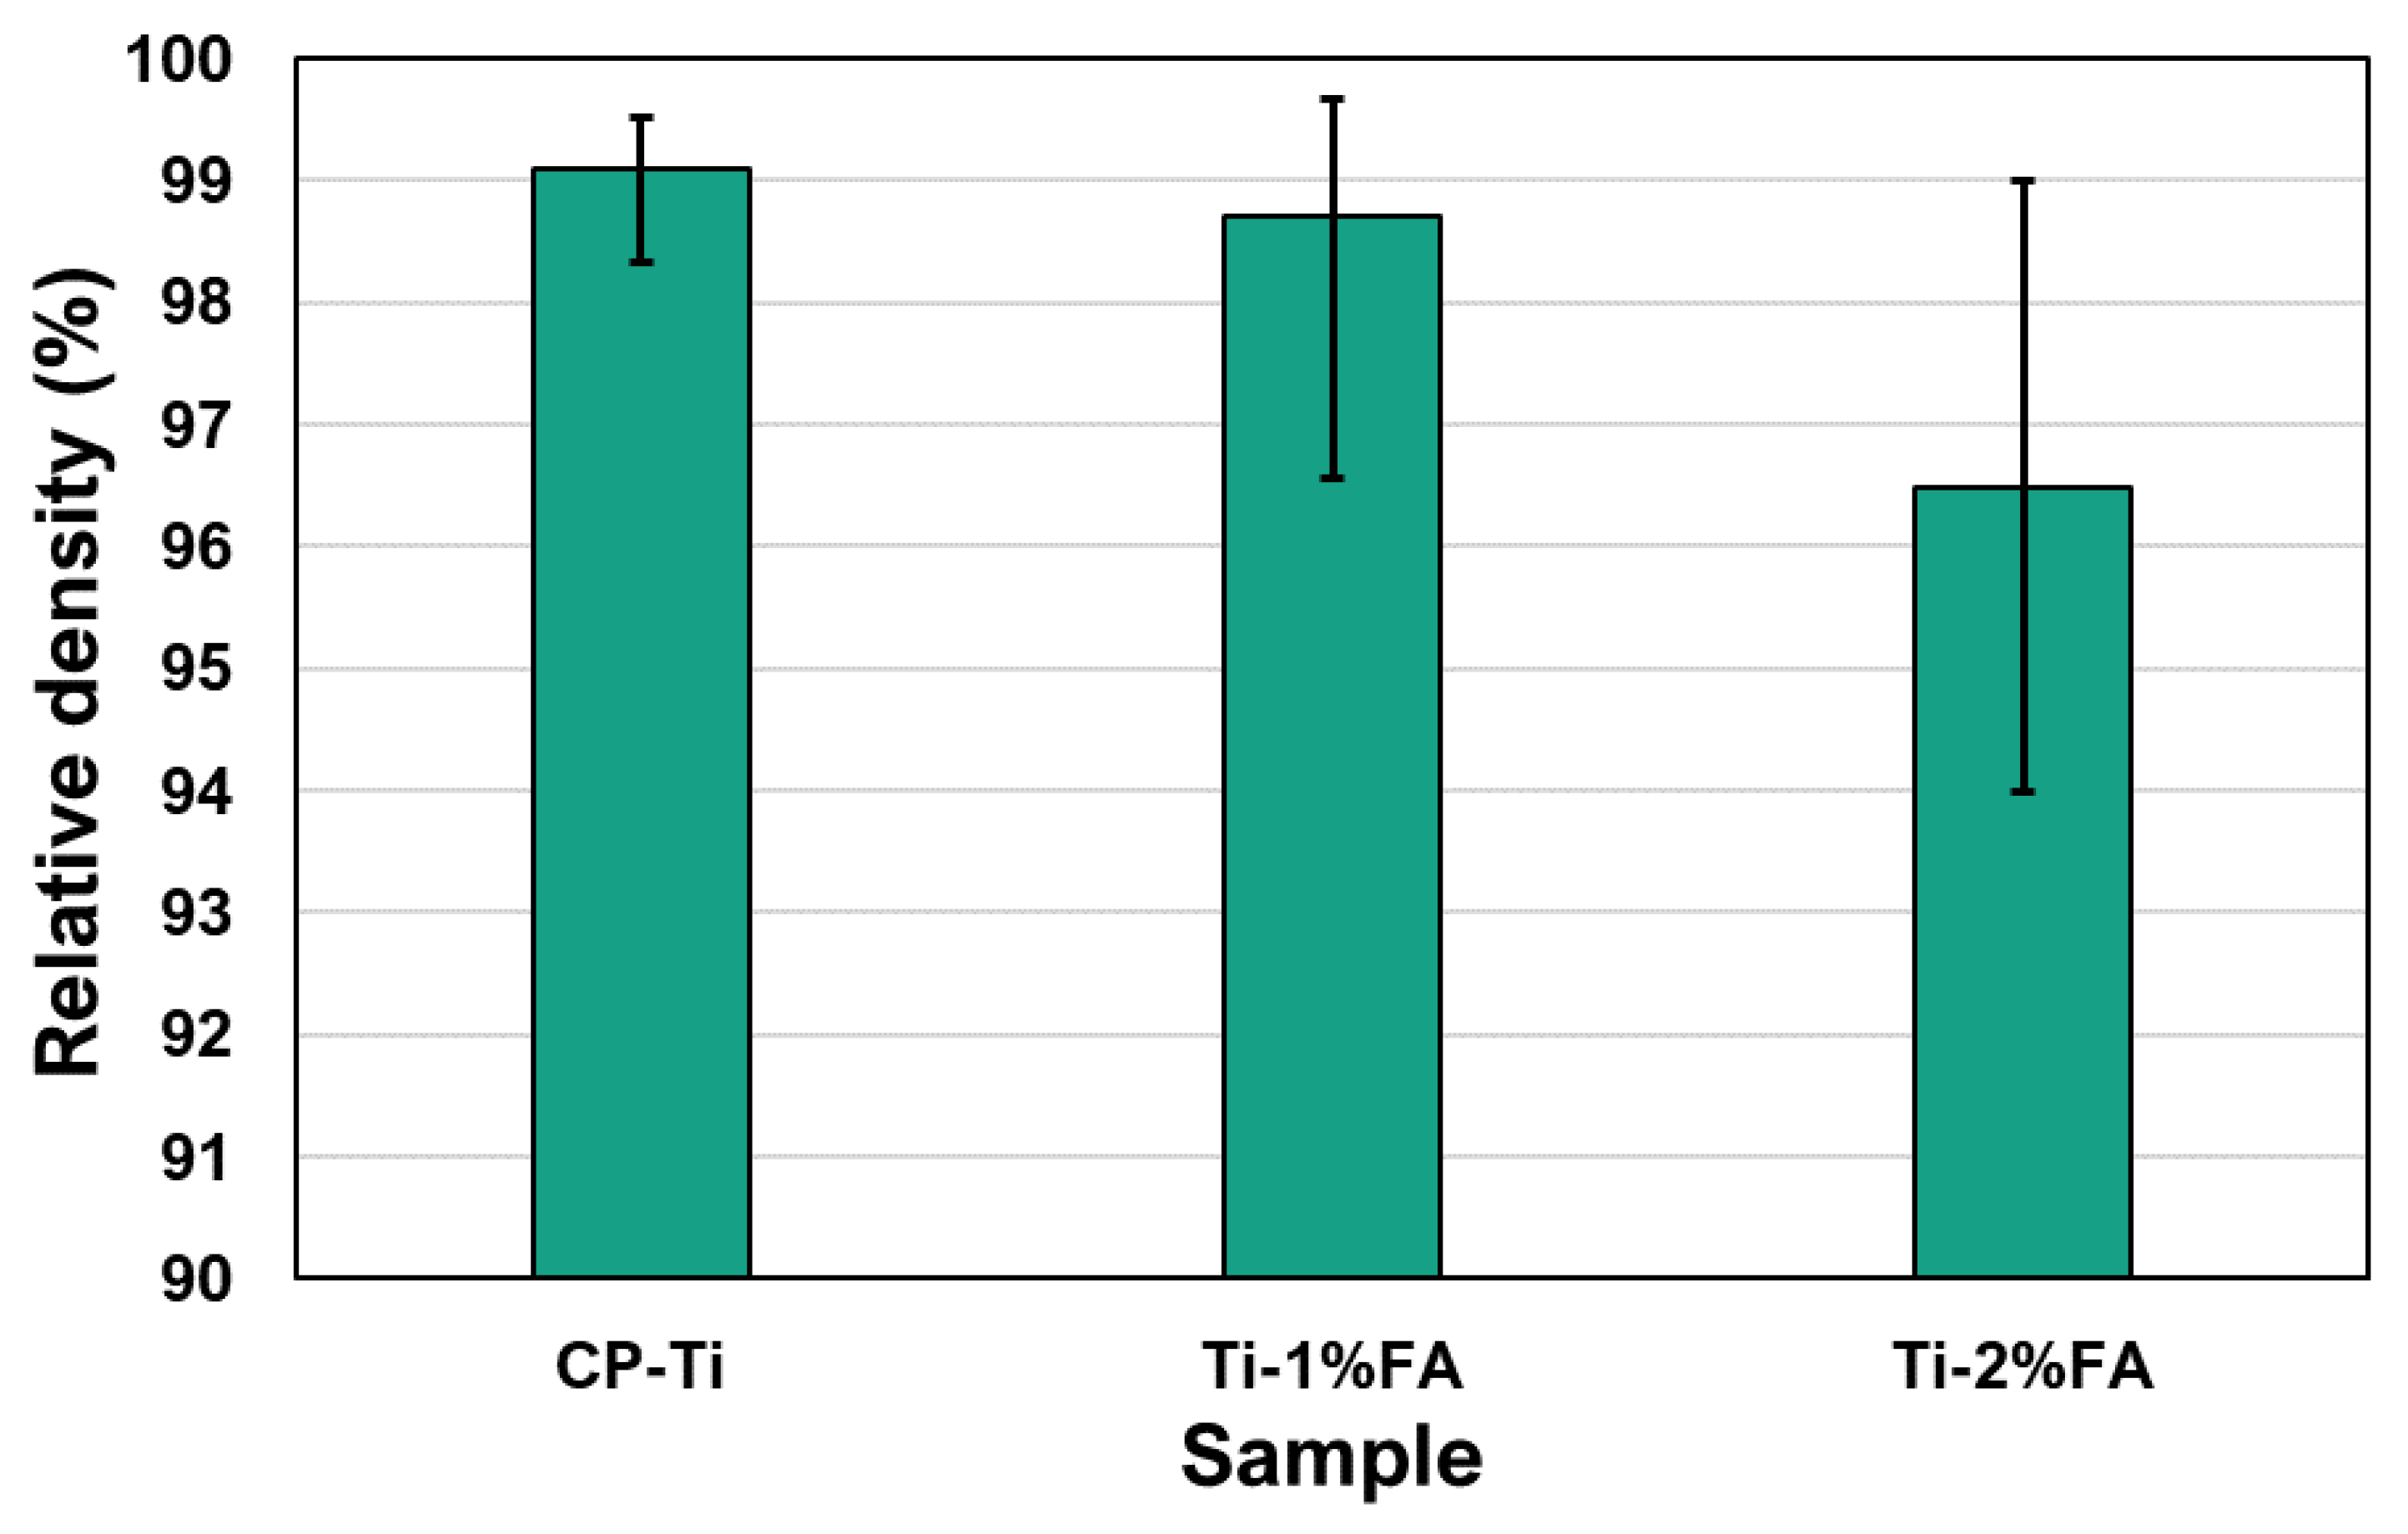
3.3. Microstructure Analysis of L-PBF Parts Fabricated Using Optimal Processing Conditions

The optimality of the processing conditions determined in the previous section (summarized in Table 3) was confirmed by performing further L-PBF printing trials using a larger cubic sample size of 80 mm × 40 mm × 10 mm. In performing the printing process, the rotation angle between adjacent layers was set as 90° in order to reduce the accumulation of residual stress. Moreover, a stripe scan strategy was employed with a stripe width of 5 mm (see Figure 9). The relative density of the printed components was evaluated using an optical microscopy (OM) technique [29,30].
Figure 10a–c show the 3D printed samples fabricated using CP-Ti, Ti-1%FA, and Ti-2%FA powders, respectively. The top surface of the CP-Ti sample and Ti-1%FA contains distinct parallel lines originating from the use of the stripe scanning strategy (Figure 10a,b). As shown in Figure 10c, the Ti-2%FA sample contains several cracks on the side surface running parallel to the built-up direction. During the L-PBF process, the cooling rates and thermal gradients around the melt pool are very high and hence produce significant stress. If the accumulation of stress exceeds the yield stress of the material, the built part experiences permanent deformation, and may crack. Furthermore, during the L-PBF process, the FA particles undergo thermal decomposition, and the resulting components may then react with CP-Ti to form low-ductility brittle phases such as TixPy [14]. The combination of a high stress and low ductility then leads to the occurrence of cold cracks, as shown in Figure 10c.
Figure 11 and Figure 12 show the surface morphology and surface roughness analysis of CP-Ti, Ti-1%FA and Ti-2%FA L-PBF processed samples. It is seen that the measured roughness (Ra) of CP-Ti specimens was higher (about 16.8 μm) among the three materials, while that of Ti-1%FA (about 9.3 μm) and Ti-2%FA (about 8.1 μm) specimen surface was lower.
Figure 13a–c present typical OM cross-sectional images of the CP-Ti, Ti-1%FA, and Ti-2%FA as-built samples, respectively. It was seen that even though all three samples were fabricated using the optimal processing conditions (as determined by surface scanning experiments), the cross-sections still contained pores, voids, and (in some cases) cracks. It was reported in [31] that the origins of the pores formed in the L-PBF process can be classified into three main types: (1) poor-adhesion, (2) key-hole, and (3) gas bubble entrapment during the solidification process [32,33]. It was additionally noted that the pores formed by gas bubble entrapment have a characteristic size of around 10 µm. A careful inspection of the OM images in Figure 13a suggests that the pores within the as-built CP-Ti sample may thus belong to the third type. This assertion is reasonable since the CP-Ti powder has a high oxygen concentration of around 0.13 wt.% (see Table 1). Part of this oxygen escapes from the melt pool as a result of the melt pool flow dynamics. However, the remainder remains trapped in the melt pool during the solidification process and produces small pores within the final CP-Ti component as a result.
An observation of Figure 13b shows that the Ti-1%FA samples also contain relatively large pores, albeit in a slightly lower quantity than the CP-Ti samples. The size of the pores again suggests that they are the result of gas bubble inclusion (oxygen or nitrogen) during the solidification process. The Ti-2%FA samples (Figure 13c) showed the appearance of many cold cracks as a result of a high residual stress accumulation and a low ductility of the composite material. It is also suspected that during the L-PBF process, cracking debris detached from the substrate and interfered with the powder re-coater. Thus, the spreading uniformity of the powder particles on the powder bed surface was impaired. Consequently, the cross-section of the Ti-2%FA sample contained not only cold cracks, but also a large number of pores.
The relative densities of the three samples were measured using the method described in [29]. The corresponding results are presented in Figure 14. Among the three samples, the CP-Ti sample had the highest relatively density of 99.1%. The relatively density reduced slightly to 98.7% for the sample containing 1 wt.% FA, and then reduced more significantly to 96.5% as the FA addition was further increased to 2 wt.%. The weight percentage of FA in Ti-2%FA composite powders was higher than that of Ti-1%FA composite powders. During L-PBF process, the FA particles underwent thermal decomposition, and the resulting components may then reacted with CP-Ti to form low-ductility brittle phases such as TixPy [4]. Thus, the number of brittle phases in as-built Ti-2%FA is expected to be higher than that of Ti-1% FA. The brittle phases together with the accumulation of tensile residual stress will lead to the cold crack along the build direction [34] (shown in Figure 13c). These cold cracks will degrade the density of as-built Ti-2%FA samples. Therefore, the density of Ti-2%FA samples was lower than that of Ti-1%FA samples.

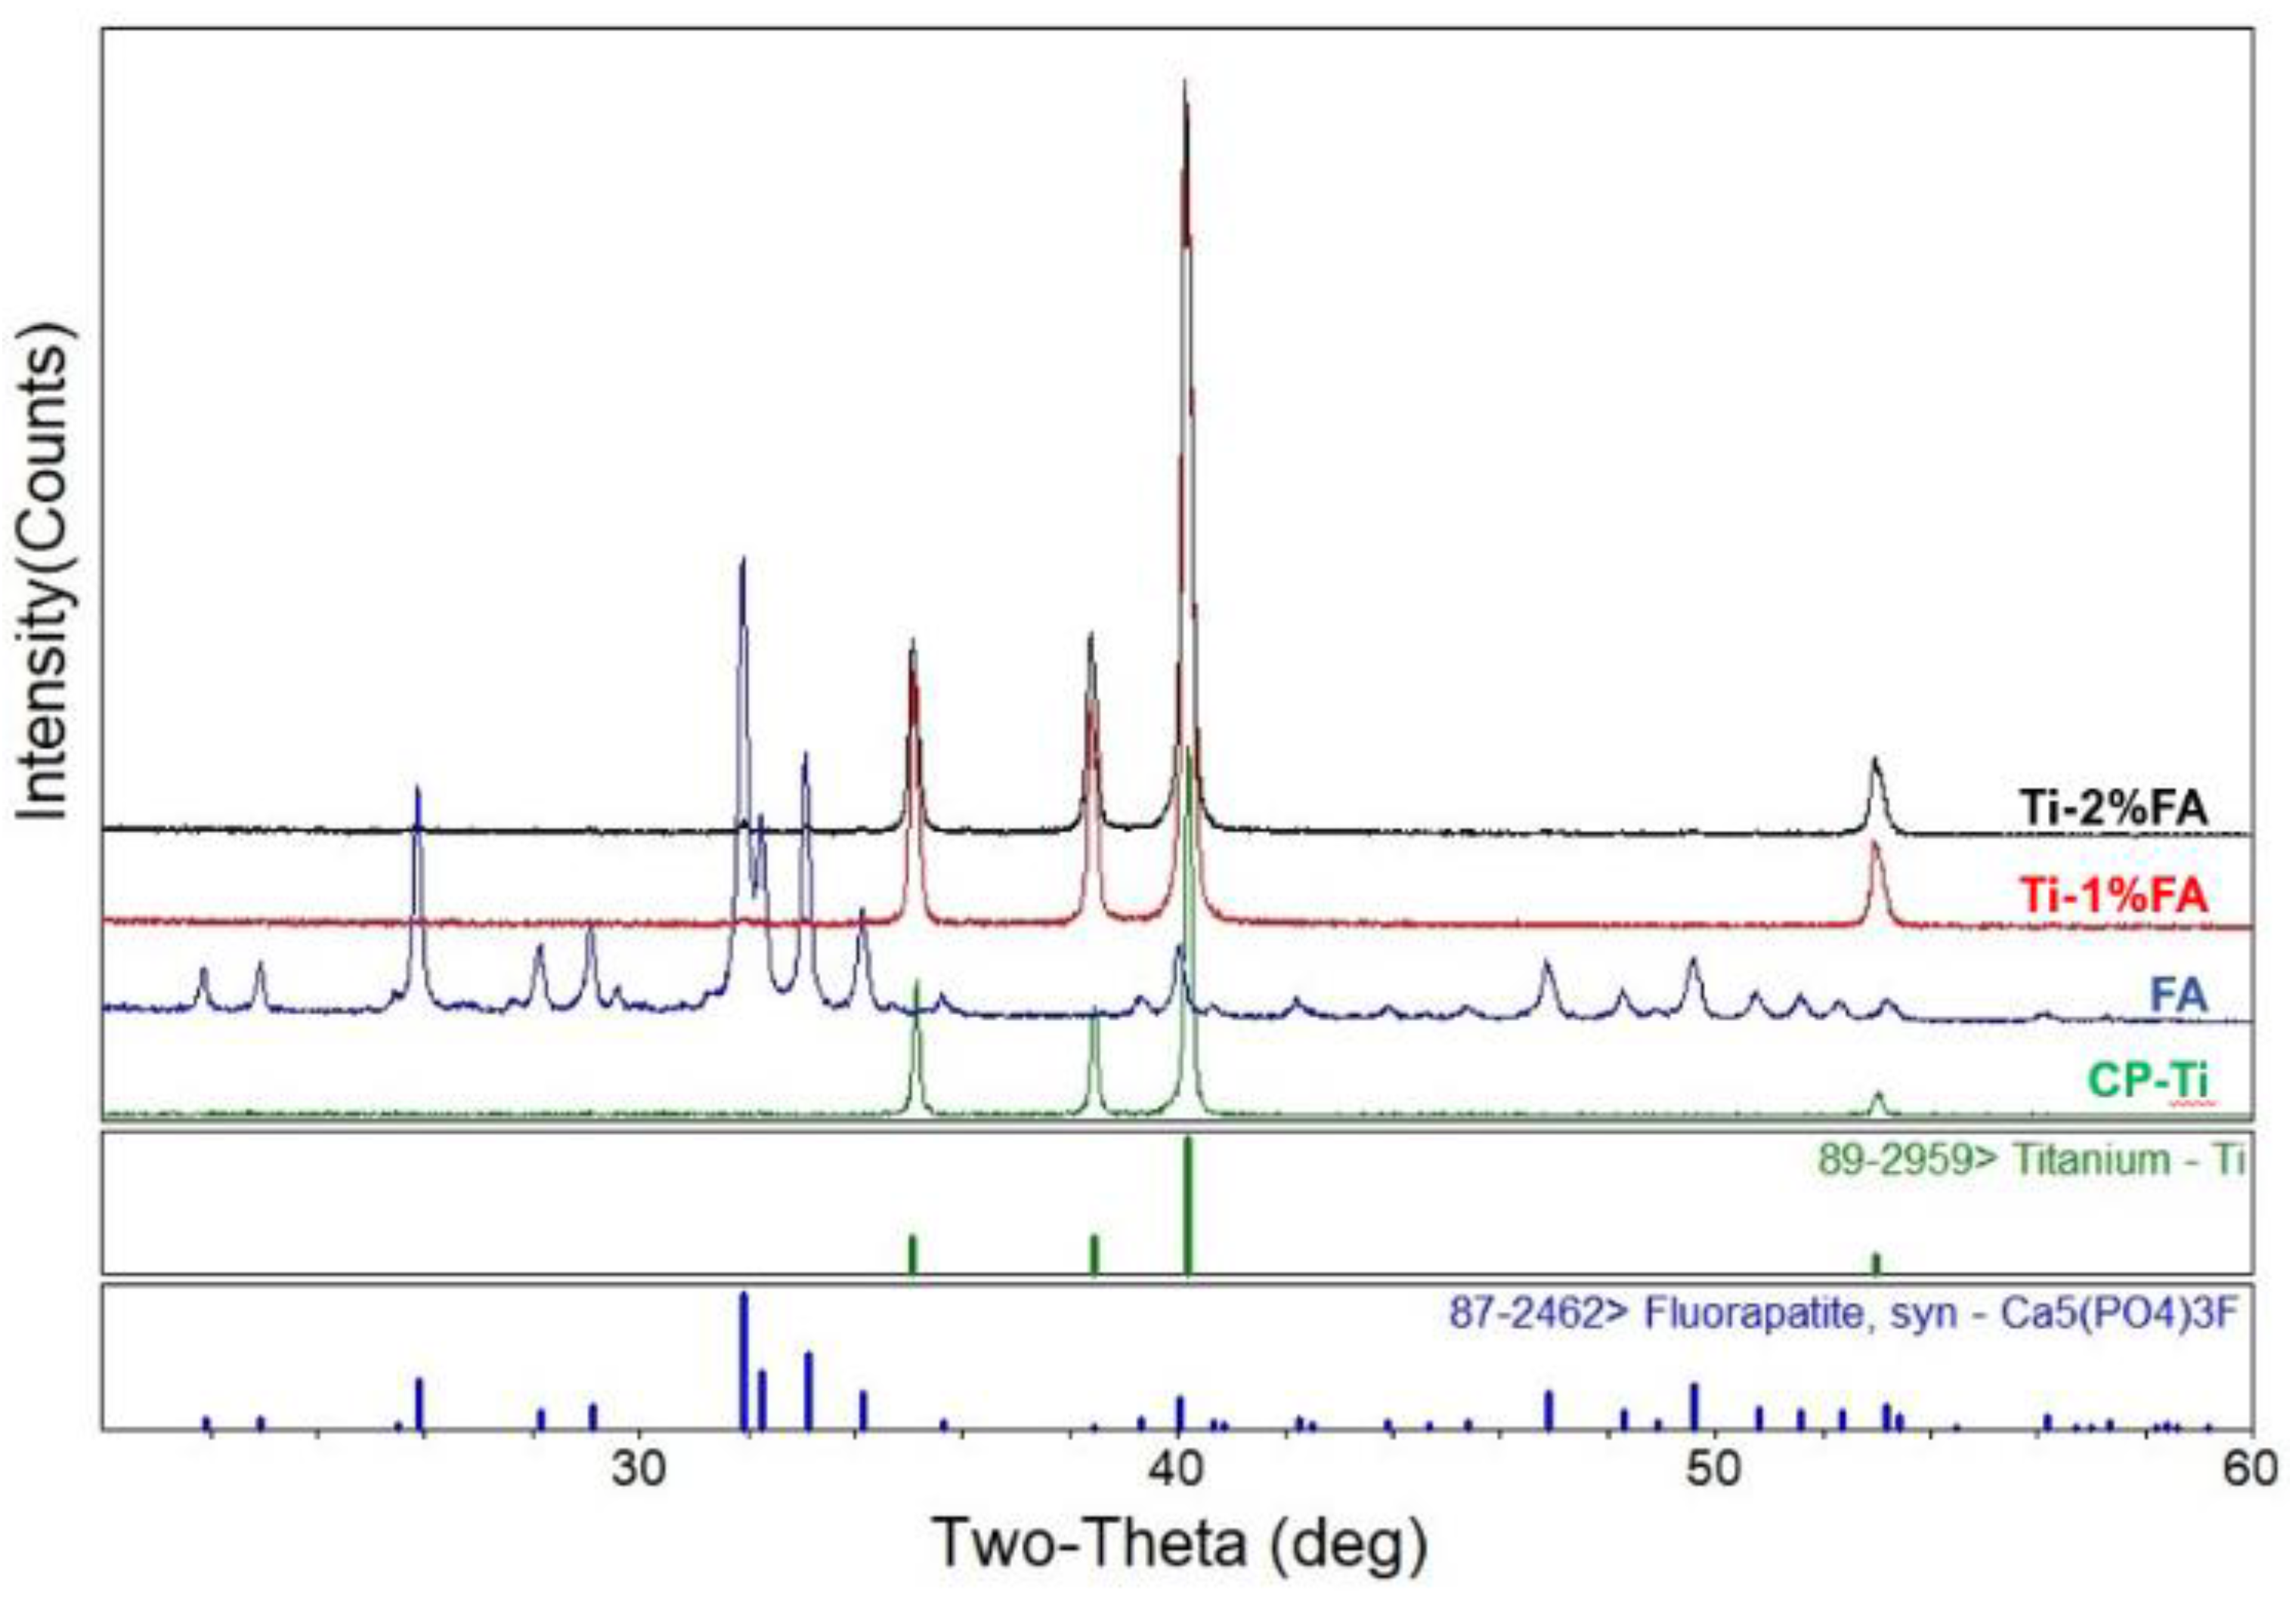
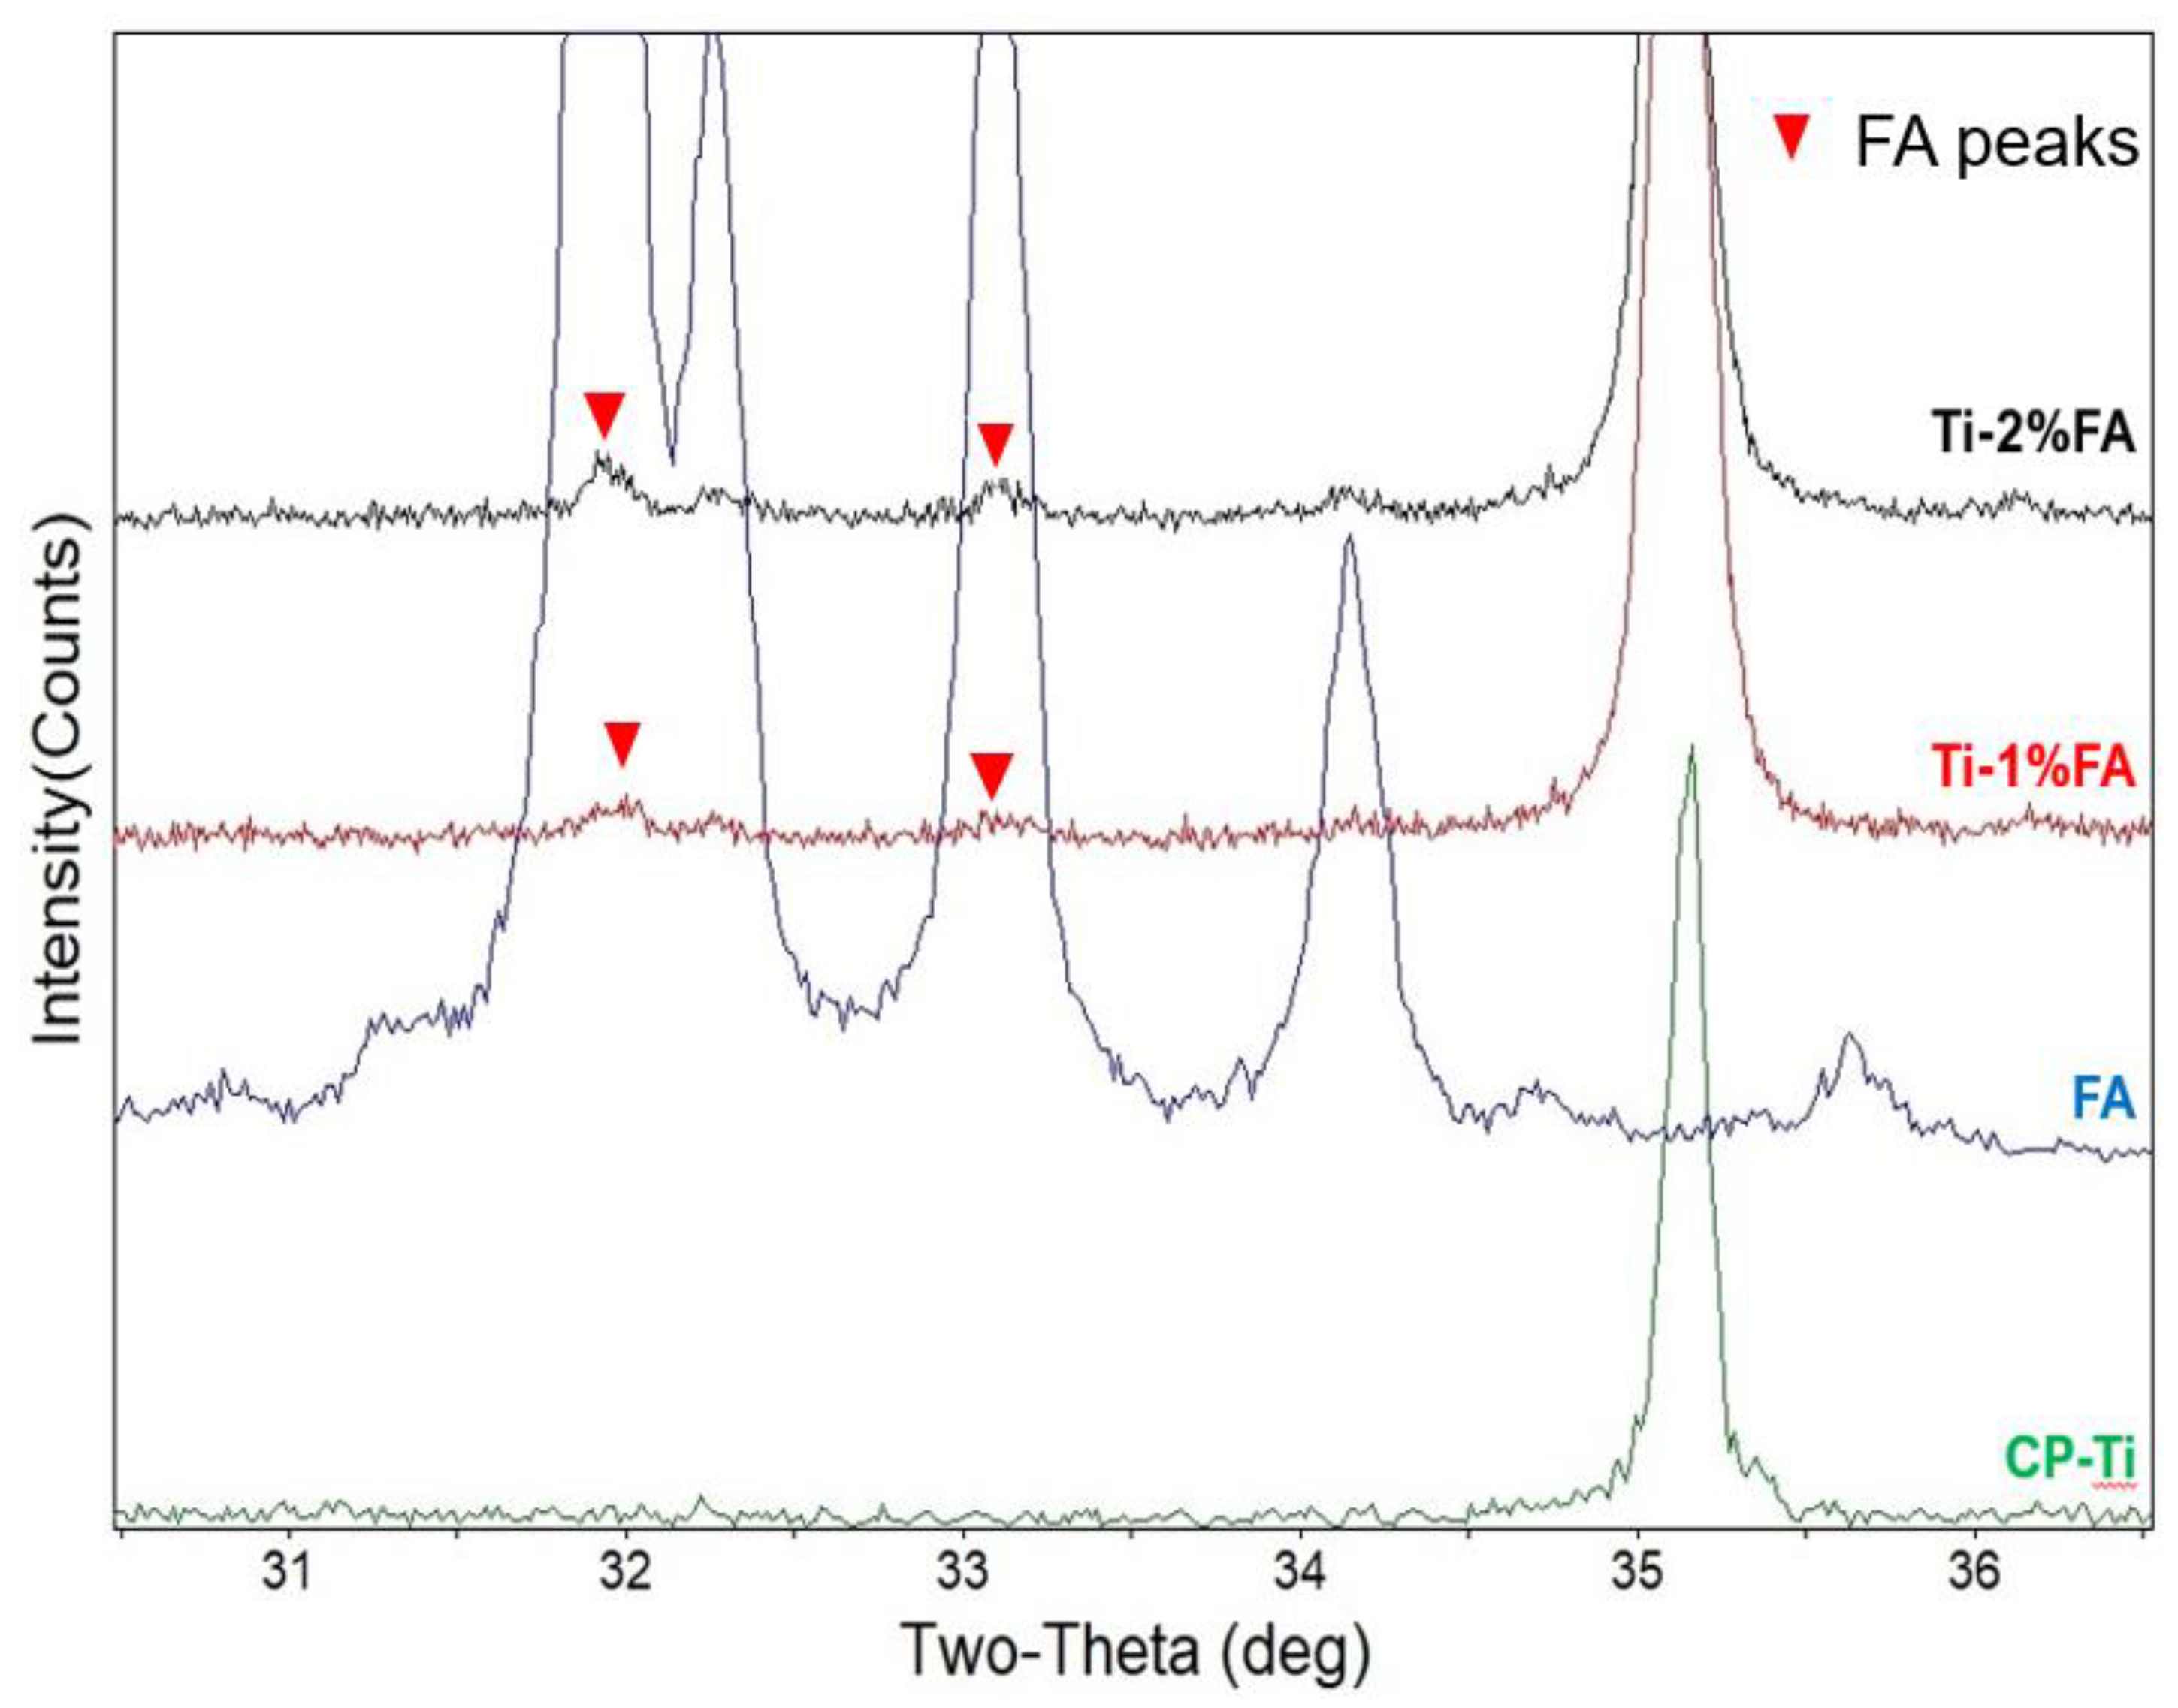
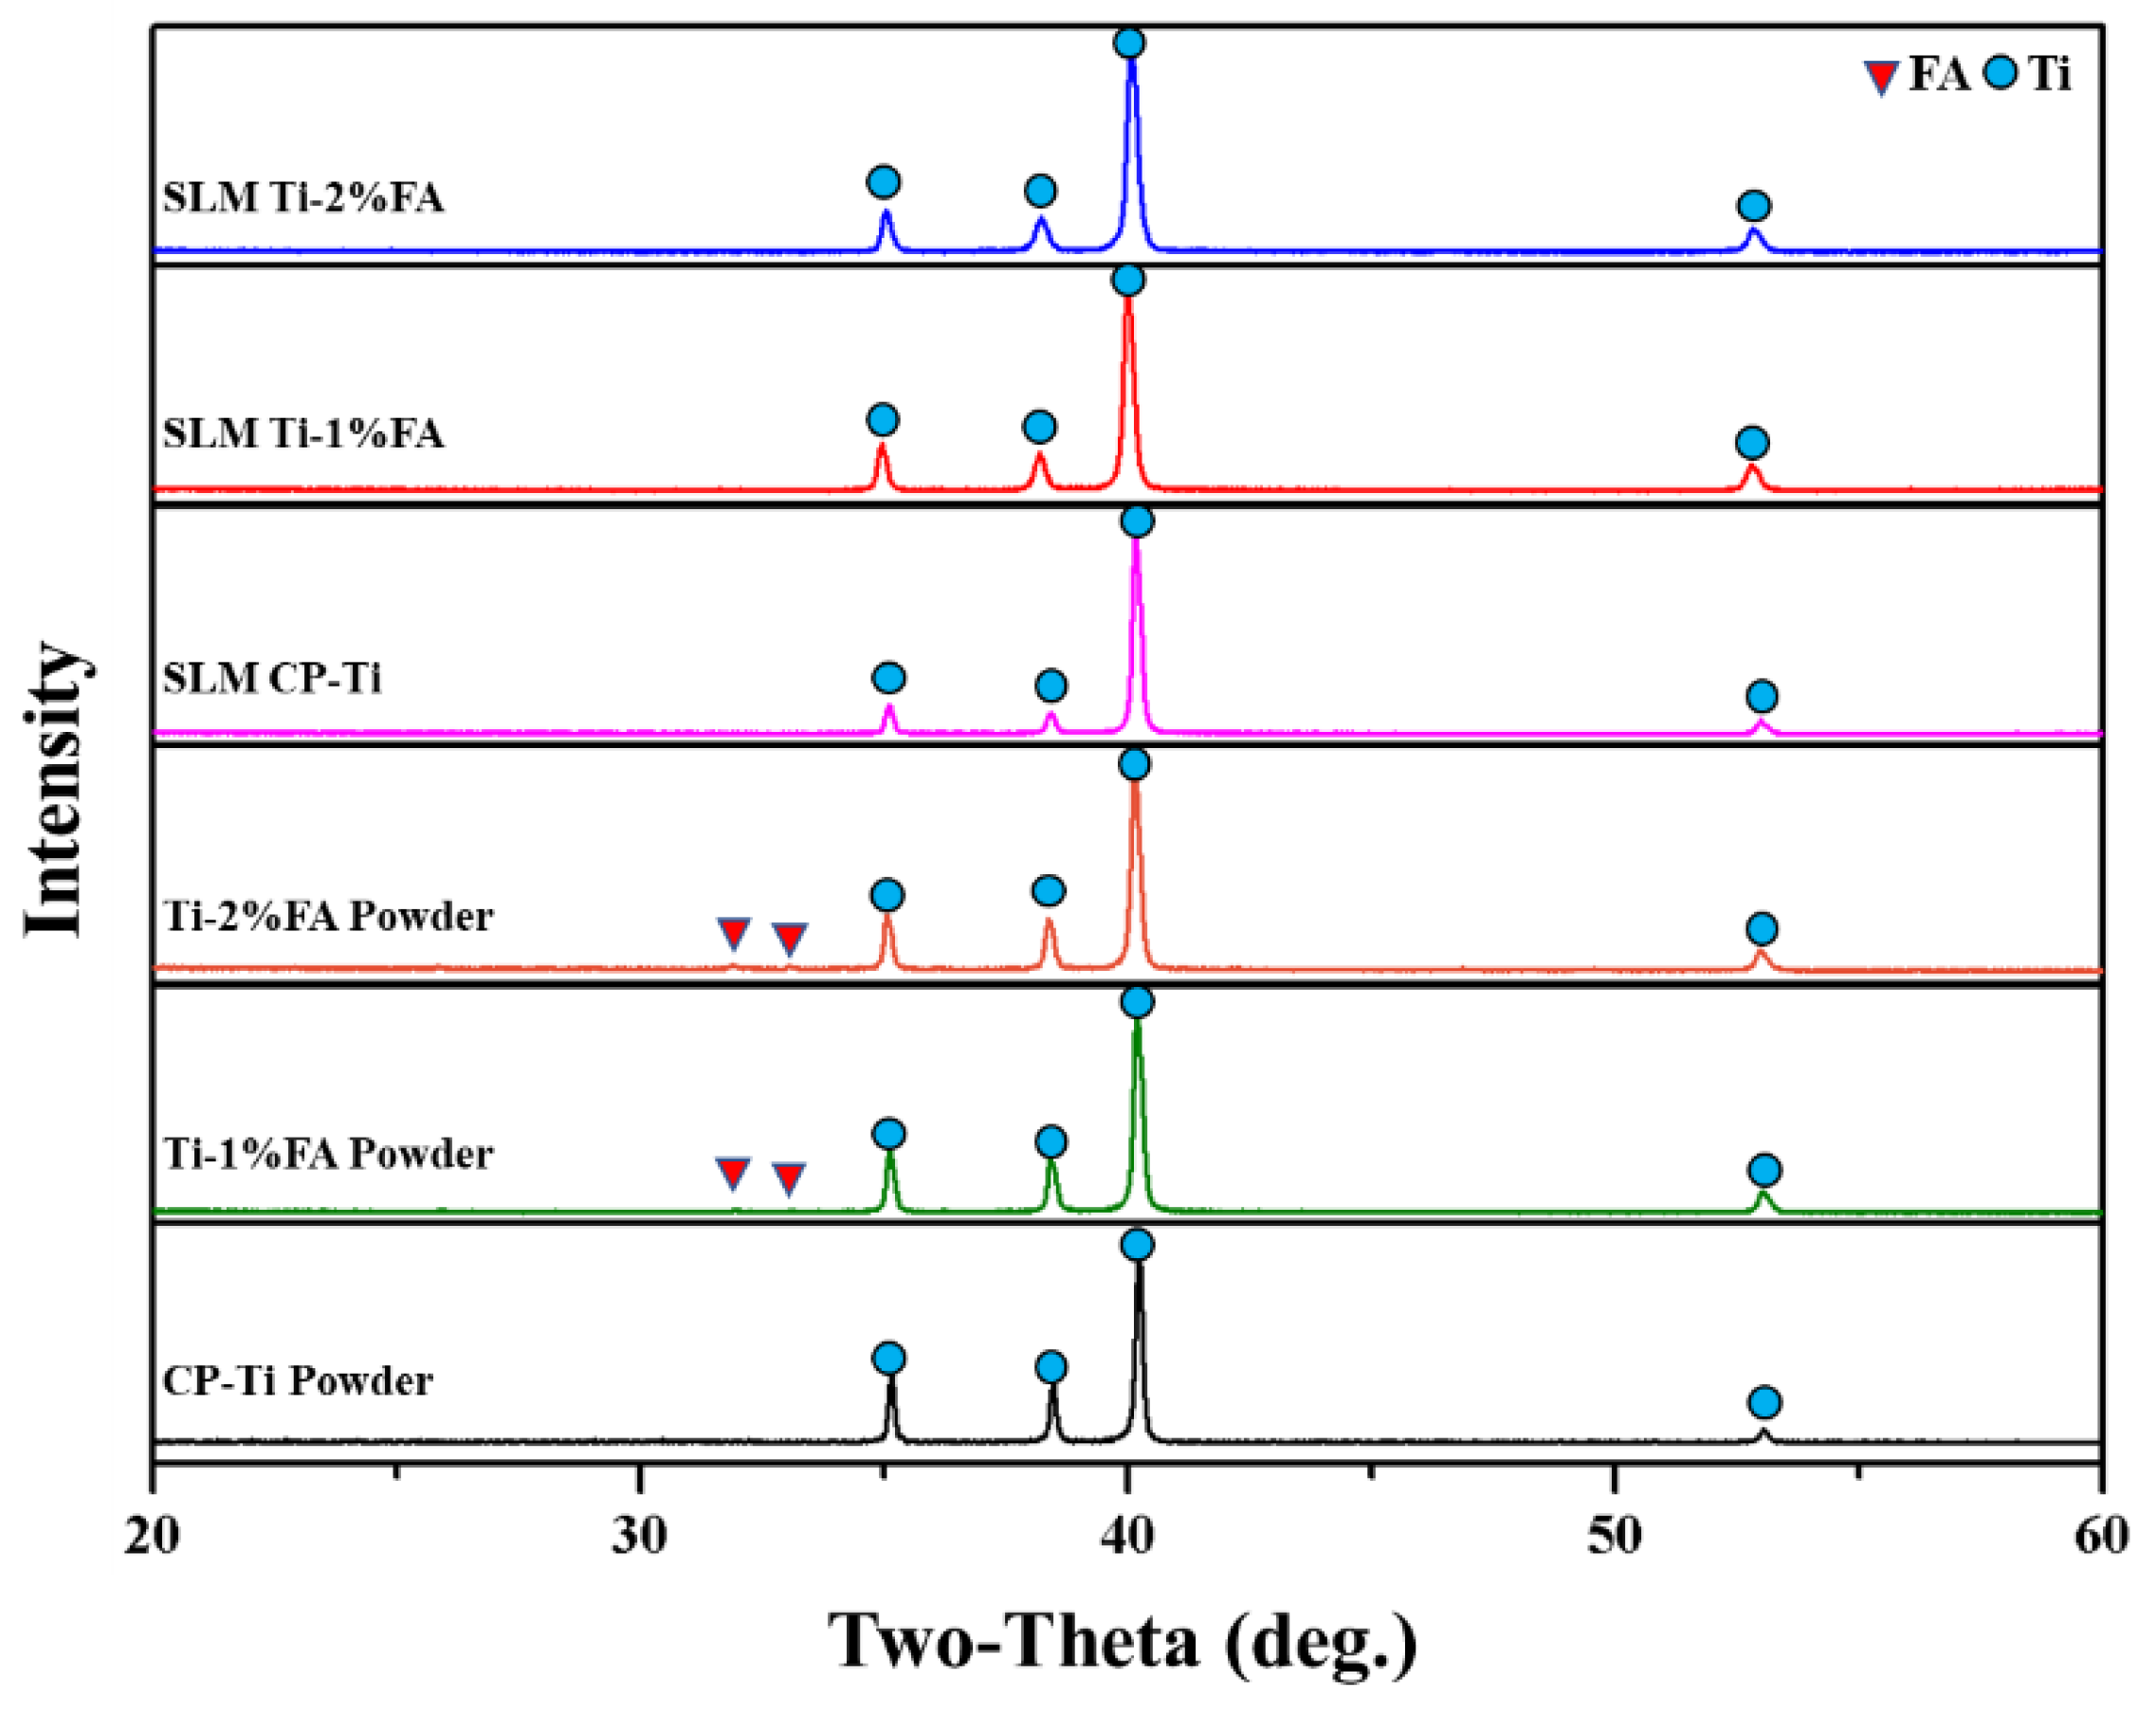
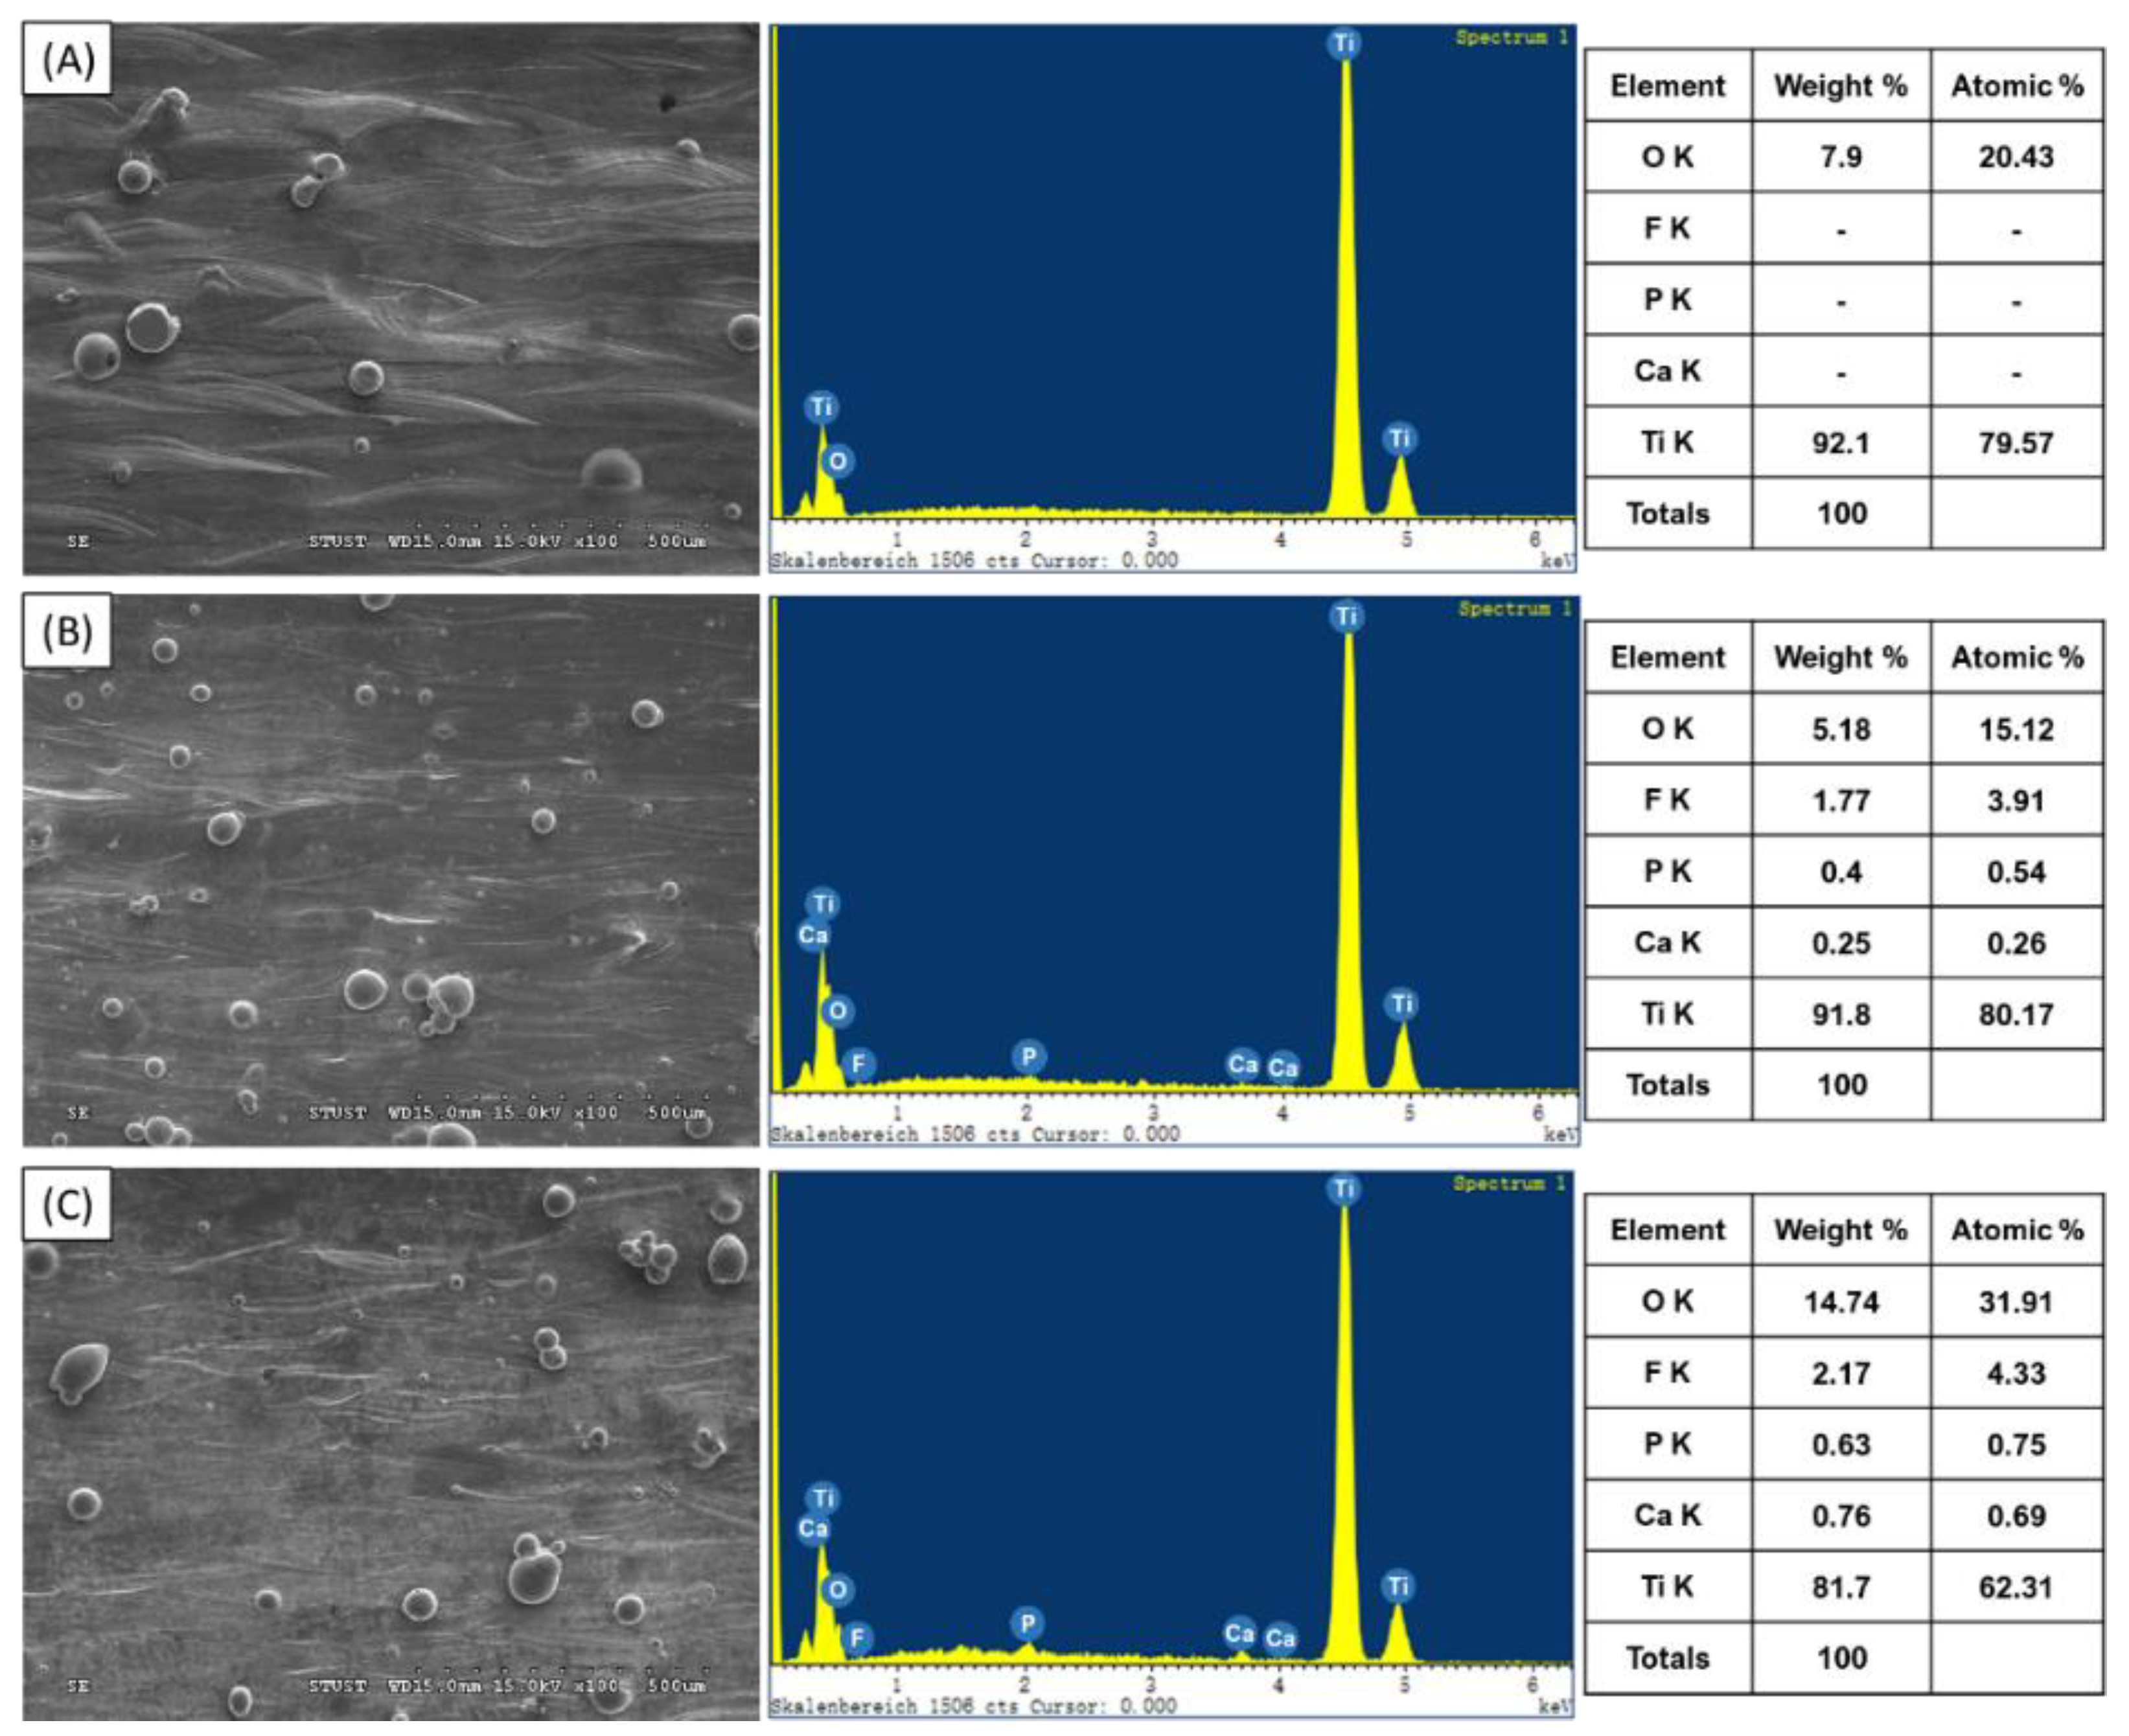
3.4. XRD and EDS Analysis

Figure 15 shows the XRD patterns of the three powder mixtures and corresponding as-built parts. A strong peak corresponding to FA was observed for both composite powders. However, the patterns for the corresponding as-built parts showed no FA diffraction peaks and contained only Ti peaks. The absence of FA peaks is due in part to the low quantity of FA powder added to the Ti matrix (1~2 wt.%) Furthermore, during the L-PBF process, the FA undergoes thermal decomposition, and some of the FA reacted with Ti to form TixPy, CaTiO3, or TixO [28]. Consequently, the quantity of FA within the Ti matrix was further reduced. Notably, the authors in [14] reported a similar absence of HA peaks in the XRD patterns of as-built Ti-HA samples.
The FA-related contents of the three samples were further investigated by EDS (Figure 16). The results indicated that, despite the absence of FA peaks in the XRD patterns, the Ti-1%FA and Ti-2%FA samples did in fact contain a small quantity of FA-related substances (Ca, P, F). Furthermore, as expected, the quantity of these substances increased slightly with an increasing FA.

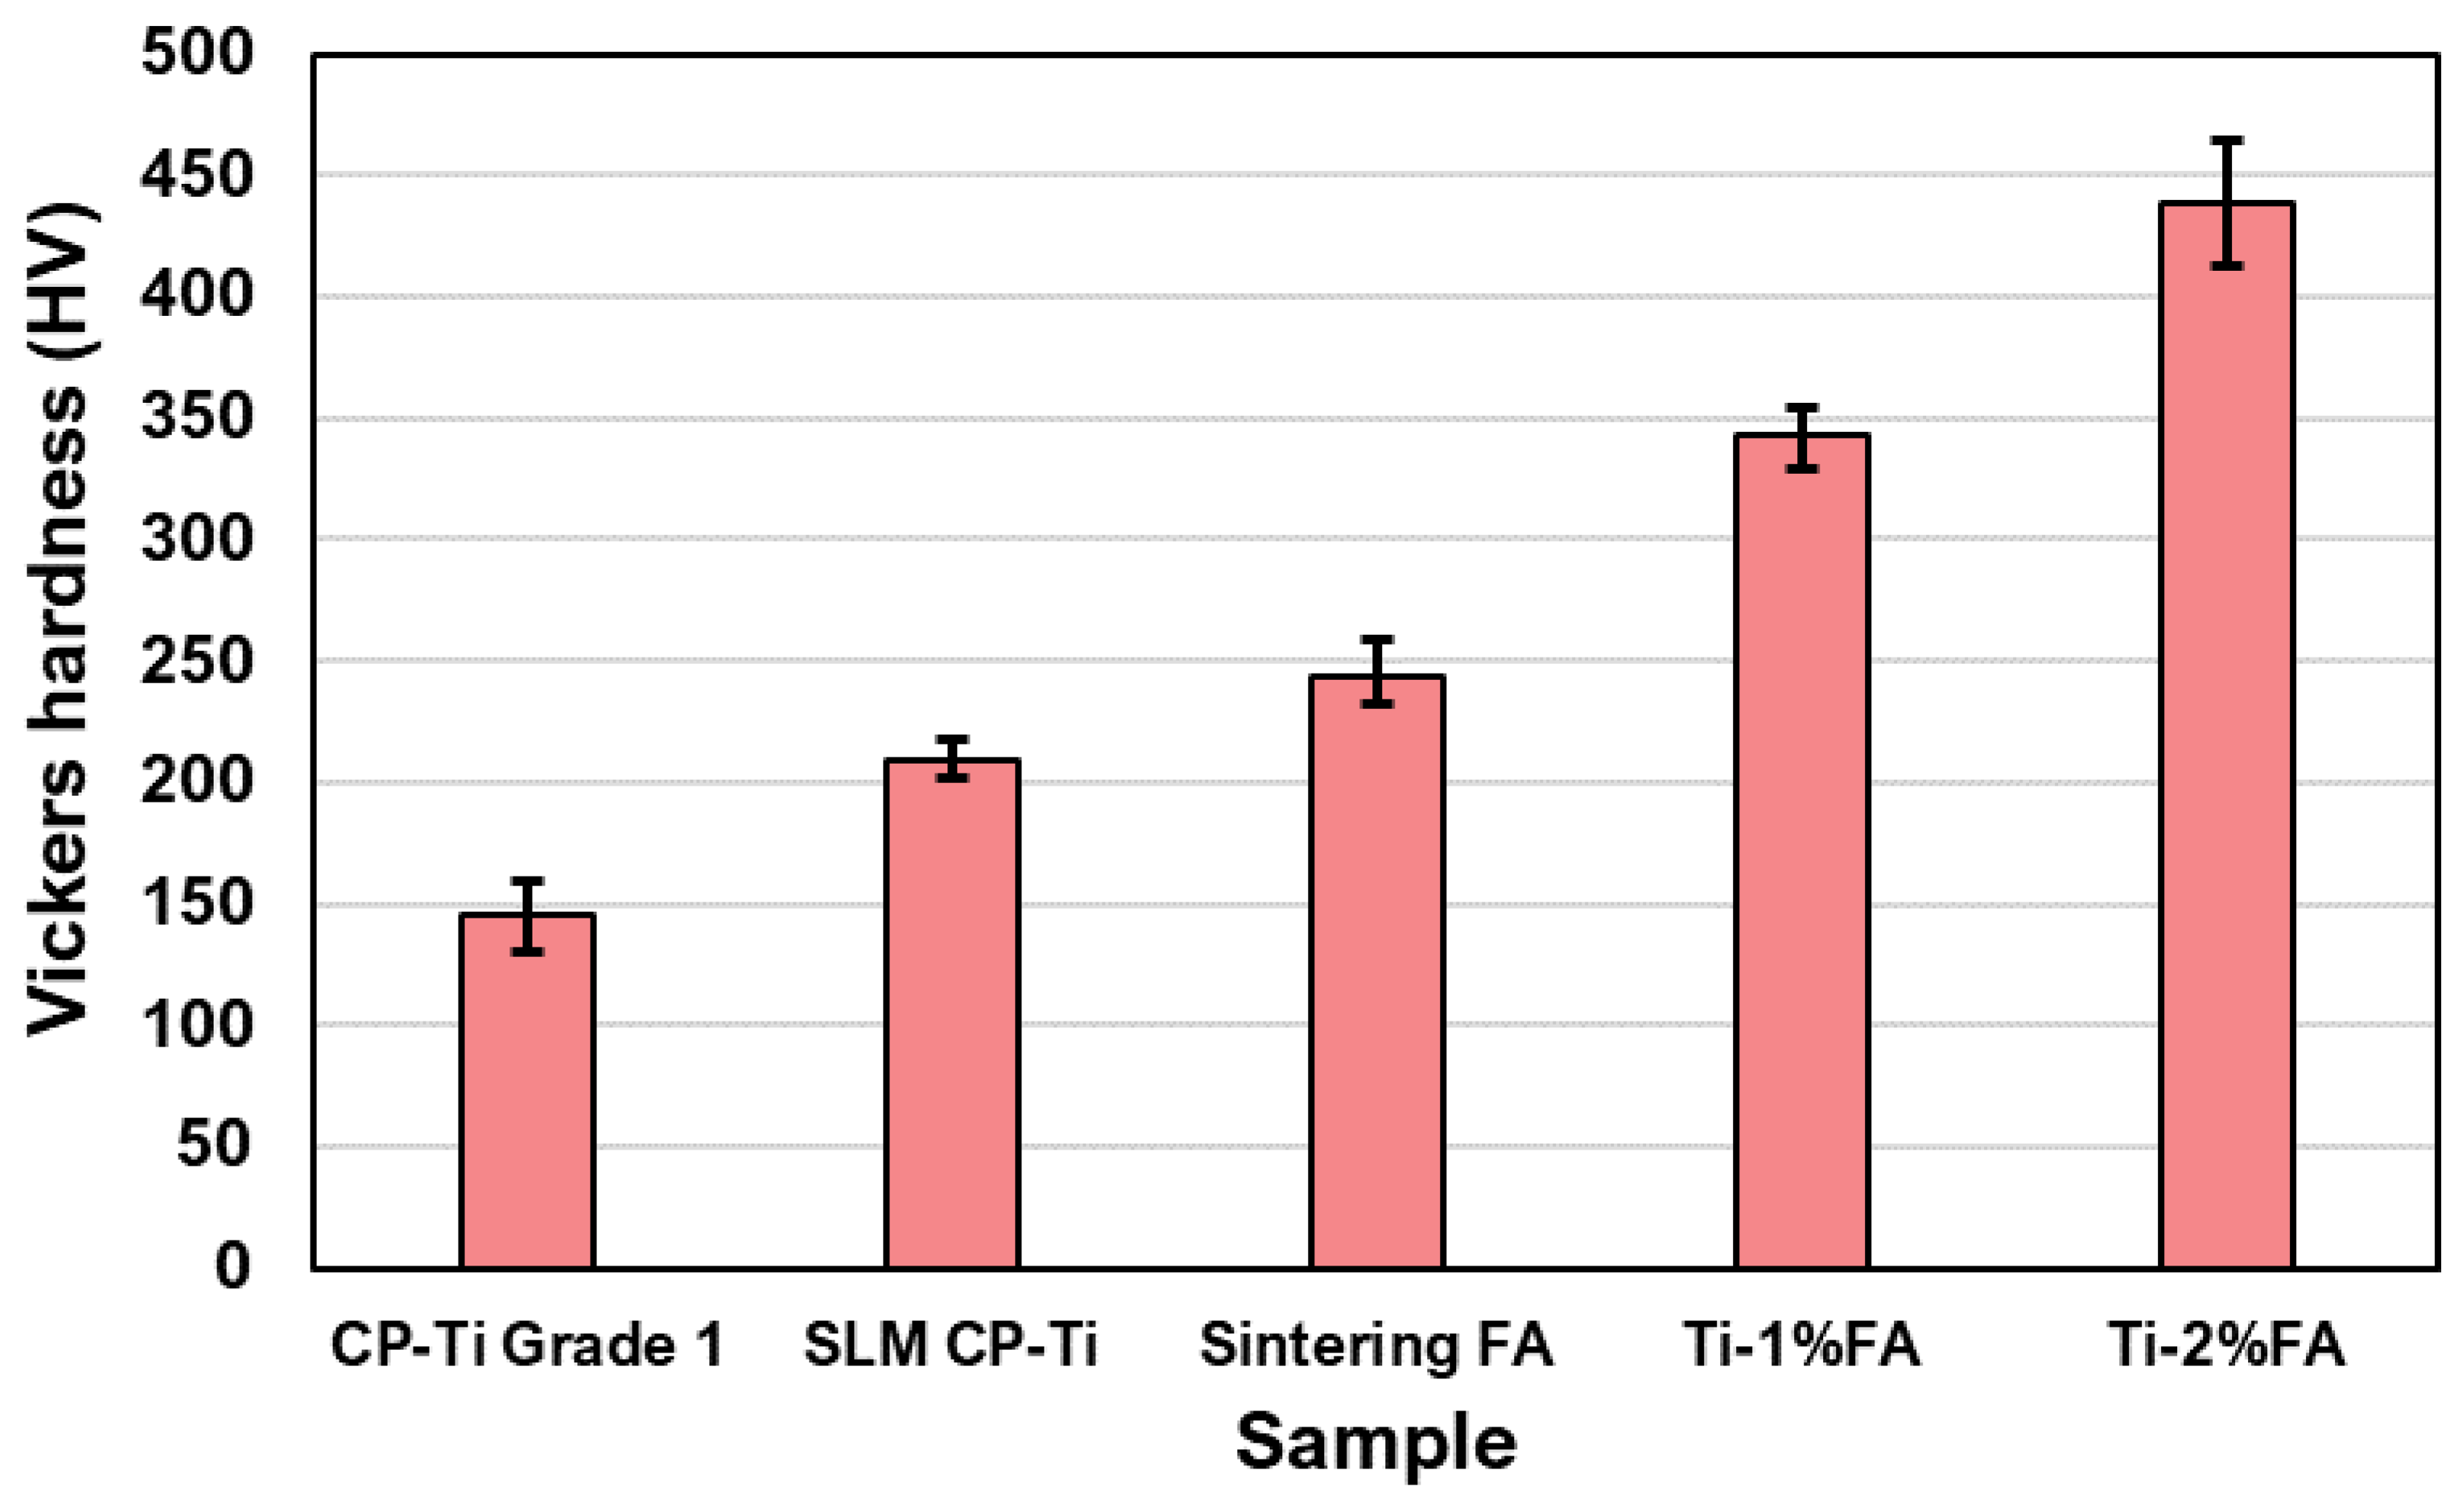
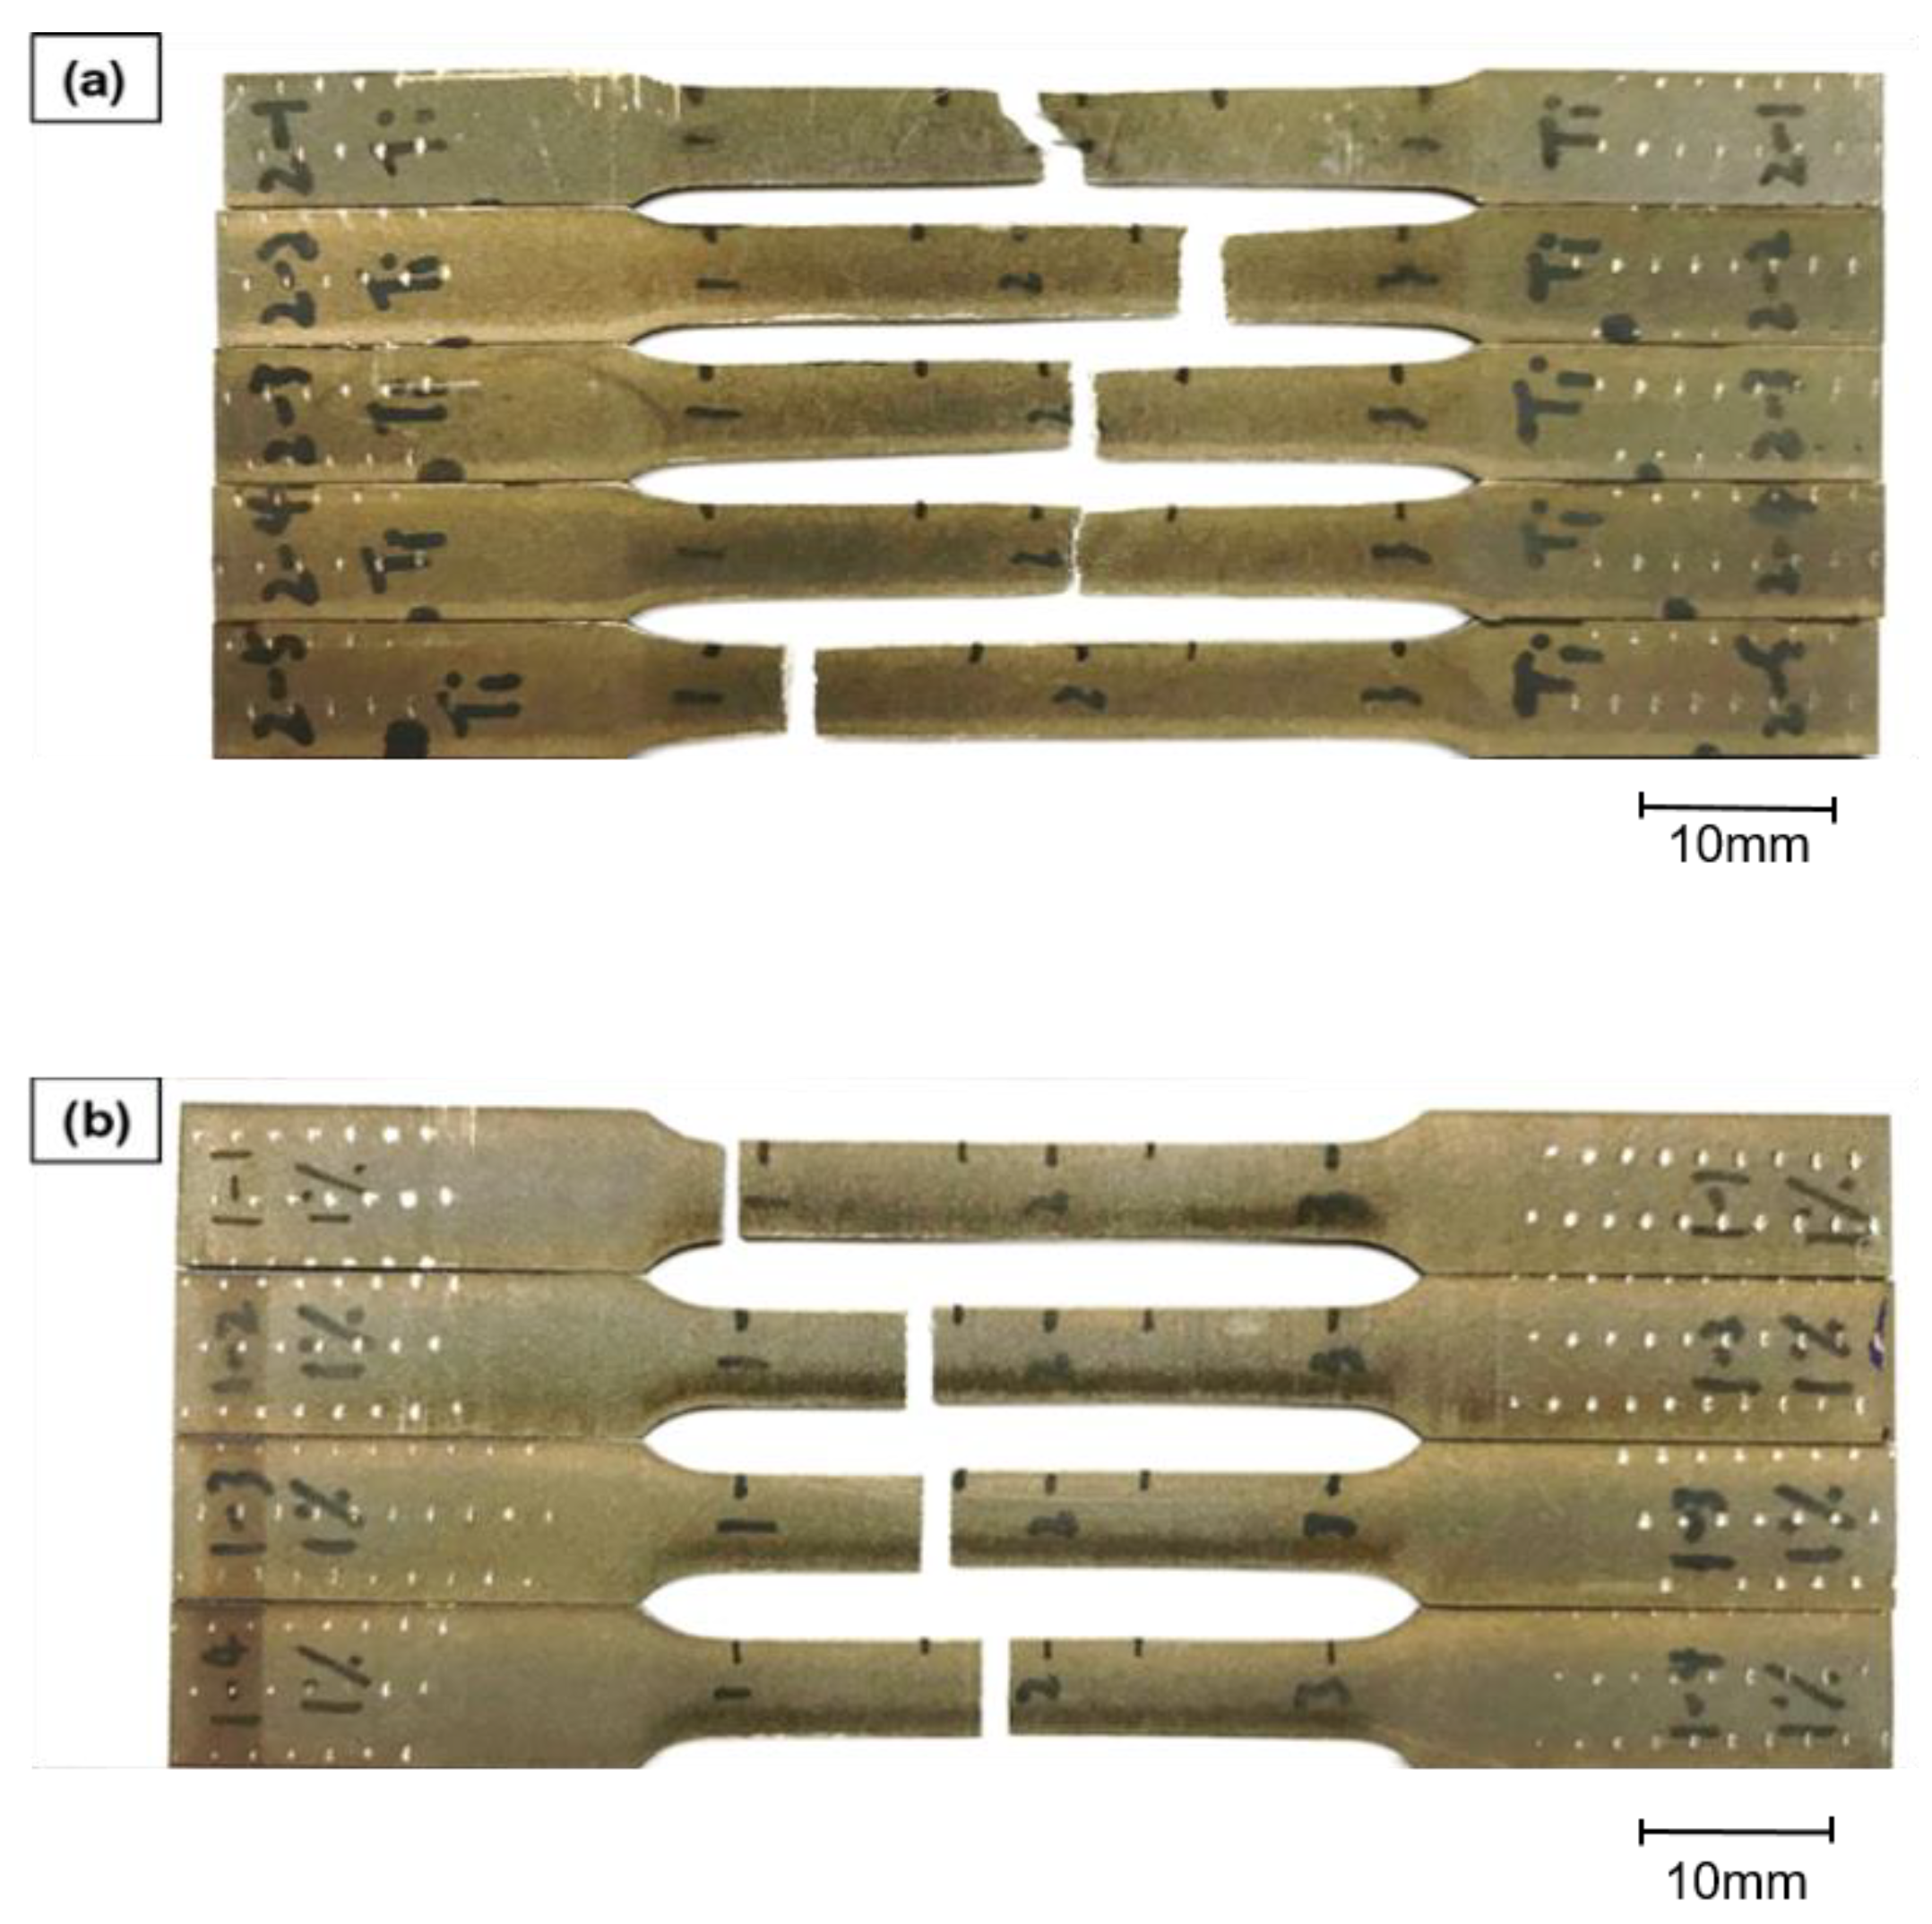
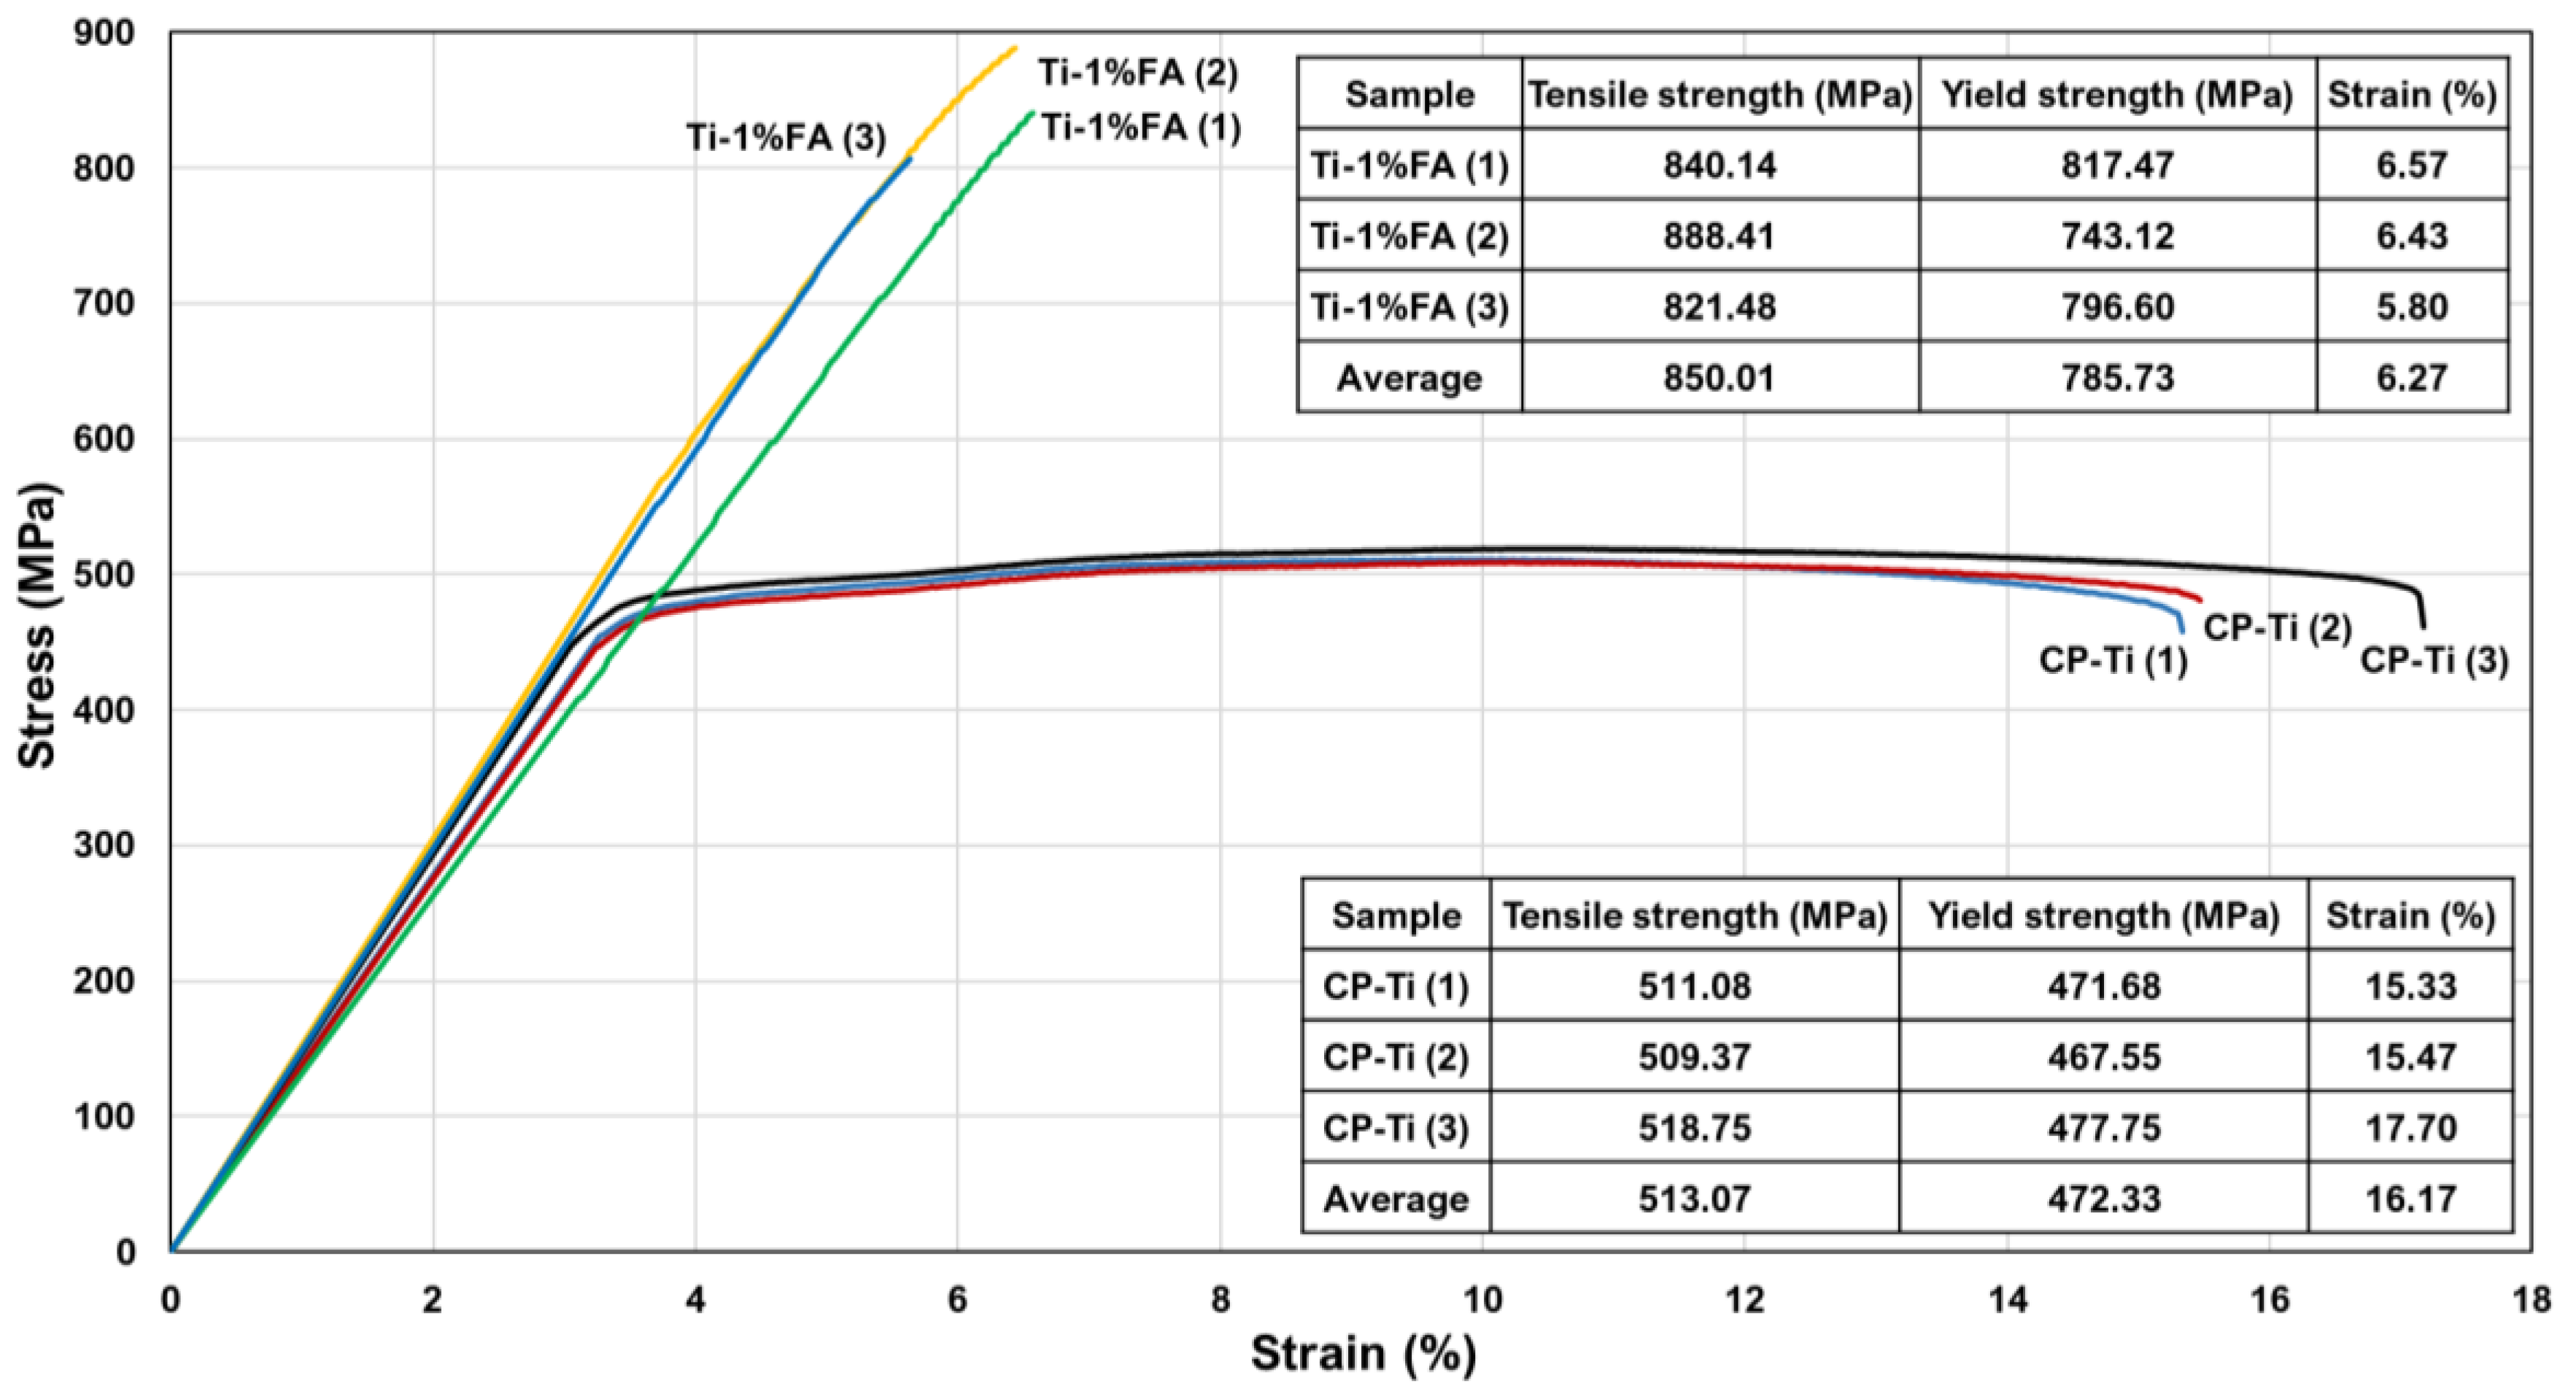
3.5. Hardness and Tensile Properties

Figure 17 shows the hardness values of the as-built CP-Ti, Ti-1%FA and Ti-2%FA samples. For comparison purposes, the figure also shows the hardness of an as-cast CP-Ti Grade 1 sample [35] and a sintered FA sample. The as-cast CP-Ti sample had a hardness of around 150 HV. By contrast, the hardness of the present as-built CP-Ti sample was around 209 HV, which is about 44.1% higher than that of the as-cast sample. The higher hardness of the present sample can be attributed to the rapid heating and cooling characteristics of the laser heating source. In particular, a large number of thermal cycles were generated in the L-PBF process during the repeated scanning operations. Consequently, the residual stress (and hence the hardness) of the as-built part increased [29]. The sintered FA sample had a hardness of 244 HV, which is around 16.7% higher than that of the as-built CP-Ti sample. For the sample with 1 wt.% FA addition, the hardness increased to 342.4 HV, i.e., 63.8% higher than that of the CP-Ti sample and 40% higher than that of the sintered FA sample. Finally, the Ti-2%FA sample had a high hardness of 438.6 HV, i.e., about 63.4% higher than that of the Ti-1%FA sample and 109.4% higher than that of the as-built CP-Ti sample. In general, the results showed that the hardness of the samples increased with an increasing FA content. It is speculated that the hardness improvement is the result of FA thermal decomposition during the L-PBF process and the subsequent formation of hard and brittle phases in the as-built sample [14].
As described above, the Ti-2%FA sample showed significant cold cracks (Figure 13c). Therefore, its tensile strength is expected to be significantly lower than the CP-Ti. It was thus excluded from the tensile test experiments. CP-Ti and Ti-1%FA samples were prepared using the conditions shown in Table 3.
Figure 18a,b show the CP-Ti and Ti-1%FA fractured samples, respectively after the tensile tests. As shown in Figure 18a, the CP-Ti specimens all demonstrated a necking phenomenon followed by shear failure. By contrast, the Ti-1%FA samples exhibited no necking zone and had a brittle fracture morphology at the fracture point. Hence, it is inferred that, of the two samples, the CP-Ti samples have a higher toughness.
Figure 19 presents the tensile test results for the CP-Ti and Ti-1%FA samples. It was seen that the Ti-1%FA sample has an average tensile strength of 850 MPa, which is around 65% higher than that of the CP-Ti sample (513 MPa). Moreover, the yield strength of the Ti-1%FA sample (785 MPa) was around 84% higher than that of the CP-Ti sample (427 MPa). However, the elongation of the Ti-1%FA sample (6.27%) was around 61% lower than that of the CP-Ti sample (16.17%). In other words, the addition of 1 wt.% FA to the Ti matrix increased the strength of the as-built sample, but reduced the ductility. This can be explained by the fact that the addition of 1 wt.% to the CP-Ti matrix may lead to the formation of TixPy, CaTiO3 due to the thermal decomposition of FA (Ca10(PO4)6F2)) [28]. These two phases make the composite material become brittle. As a result, no obvious necking behavior was observed at the fracture location. Therefore, the elongation of Ti-1%FA is significantly lower than that of CP-Ti. The SEM image presented in Figure 20A shows that the fracture surface of the CP-Ti sample contains dimple-like features characteristic of a ductile (i.e., high toughness) material. By contrast, the fracture surface of the Ti-1%FA sample showed cleavage facets, a small number of shallow dimples, and several cracks, which indicate a brittle nature of the sample (Figure 20B).
Han et al. [14] added HA to CP-Ti powder to form a bio-composite powder and found that the HA decomposed during the L-PBF process to form TixPy and CaTiO3 phases. These phases increased the brittleness of the as-built samples. Accordingly, the tensile specimens showed no obvious necking behavior prior to fracture. In this work, as described above, the addition of 1 wt.% FA to the CP-Ti matrix reduced the elongation of the as-built Ti-1%FA sample, but increased the tensile strength. This can be explained by the fact that the thermal decomposition temperature of FA (1400 °C) is much higher than that of HA (800–850 °C). Thus, the number of brittle phases formed in the CP-Ti matrix during the L-PBF process was lower than that produced in the Ti-HA sample. Overall, the results suggest the desirability for utilizing FA in place of HA to minimize the loss of strength caused by thermal decomposition during the L-PBF process.

4. Conclusions

This study developed a pressure-less stoichiometric technique to prepare composite Ti-1%FA and Ti-2%FA powders for L-PBF processing. The feasibility of the proposed approach was confirmed by the SEM and XRD analysis results. In particular, the SEM observations showed that the FA nanoparticles were uniformly distributed on the surface of the Ti powder. In addition, the XRD results revealed strong FA-related peaks in the XRD pattern of the composite powder. The composite powders were used to fabricate 3D L-PBF parts under optimal processing conditions. It was shown that the Ti-1%FA and Ti-2%FA specimens had relative densities of 98.5% and 96.5%, respectively, and are thus more porous than a pure CP-Ti sample with no FA addition (99%). The lower relative density of the Ti-2%FA sample is attributed to the formation of brittle phases during thermal decomposition and the accumulation of a high residual stress during the L-PBF process, which collectively led to the formation of a large number of cracks on the top and side surfaces of the as-built sample.
The micro-Vickers hardness tests showed that the CP-Ti sample hardness (209 HV) was around 44.1% higher than that of a traditional cast CP-Ti sample 150 HV). Furthermore, the hardness values of the Ti-1%FA (342.4 HV) and Ti-2%FA (438.6 HV) samples were around 63.8% and 109.4%, respectively, higher than that of the printed CP-Ti sample. The higher hardness of the Ti-1%FA and Ti-2%FA samples is most likely the result of the thermal decomposition of the FA during the L-PBF process to form hard and brittle phases such as TixPy. Finally, the tensile test results showed that the tensile strength and yield strength of the Ti-1%FA sample were around 65% and 66%, respectively, higher than those of the CP-Ti sample with no FA addition. However, the elongation was reduced by around 61%. The higher hardness but lower toughness of the Ti-1%FA sample is attributed to the formation of brittle phases during the L-PBF process.
For future works, thermos-mechanical simulation will be developed to predict the parameters that lead to lower residual stress. These parameters will be utilized to manufacture Ti-2%FA for preventing crack. Additionally, the Ti-1%FA will be further employed for 3D printing lattice structures with elastic modulus close to that of human bone for reducing the stress-shielding effects [6].

Author Contributions

Conceptualization, H.-C.T.; T.-Y.K. and C.-S.C.; methodology, H.-C.T.; T.-Y.K.; P.-K.W. and J.-W.L.; software, J.-W.L.; V.-L.V. and R.-L.L.; validation, W.-T.L.; J.-W.L. and H.-C.T.; formal analysis, H.-C.T.; J.-W.L. and T.-Y.K.; investigation, H.-C.T.; J.-W.L.; T.-Y.K. and V.-L.V.; resources, T.-Y.K. and C.-S.C.; data curation, H.-C.T.; J.-W.L. and V.-L.V.; writing—original draft preparation, H.-C.T.; writing—review and editing, H.-C.T.; visualization, H.-C.T. and V.-L.V.; supervision, T.-Y.K. and C.-S.C.; project administration, C.-S.C.; funding acquisition, H.-C.T. and T.-Y.K. All authors have read and agreed to the published version of the manuscript.

Funding

This research was funded by the National Science and Technology Council (Taiwan) grant number NSTC 107-2622-E-218-006 -CC3 and NSTC 110-2622-E-218 -005-, and the Chi Mei Medical Center, (Taiwan), grant number 13001110023. And the APC was funded by by the National Science and Technology Council (Taiwan) grant number NSTC 110-2622-E-218 -005-.

Institutional Review Board Statement

Not applicable.

Informed Consent Statement

Not applicable.

Data Availability Statement

Not applicable.

Acknowledgments

The authors gratefully acknowledge the financial support provided to this study by the National Science and Technology Council (Taiwan) under Contract No. NSTC 107-2622-E-218-006 -CC3 and NSTC 110-2622-E-218 -005-, and the Chi Mei Medical Hospital, (Taiwan), under Contract No. 13001110023. Additionally, the study was also supported in part by the funding provided to the Intelligent Manufacturing Research Center (iMRC) at National Cheng Kung University (NCKU) by the Ministry of Education, Taiwan, Headquarters of University Advancement. The additional financial support received under the Higher Education Sprout Project of the Ministry of Educa-tion at Southern Taiwan University of Science and Technology is also greatly appreciated.

Conflicts of Interest

The authors declare no conflict of interest.

References

  1. Gibson, I.; Rosen, D.; Stucker, B.; Khorasani, M. Additive Manufacturing Technologies; Springer: Cham, Switzerland, 2021. [Google Scholar]
  2. Chen, S.; Huang, J.; Pan, C.; Lin, C.; Yang, T.; Huang, Y.; Ou, C.; Chen, L.; Lin, D.; Lin, H.; et al. Microstructure and mechanical properties of open-cell porous Ti-6Al-4V fabricated by selective laser melting. J. Alloys Compd. 2017, 713, 248–254. [Google Scholar] [CrossRef]
  3. Depboylu, F.N.; Yasa, E.; Poyraz, Ö.; Minguella-Canela, J.; Korkusuz, F.; De los Santos López, M.A. Titanium based bone implants production using laser powder bed fusion technology. J. Mater. Res. Technol. 2022, 17, 1408–1426. [Google Scholar] [CrossRef]
  4. Dzogbewu, T.C. Laser powder bed fusion of Ti6Al4V lattice structures and their applications. J. Met. Mater. Miner. 2020, 30, 68–78. [Google Scholar] [CrossRef]
  5. Nespoli, A.; Bennato, N.; Villa, E.; Passaretti, F. Study of anisotropy through microscopy, internal friction and electrical resistivity measurements of Ti-6Al-4V samples fabricated by selective laser melting. Rapid Prototyp. J. 2022, 28, 1060–1075. [Google Scholar] [CrossRef]
  6. Patel, N.R.; Gohil, P.P. A review on biomaterials: Scope, applications & human anatomy significance. Int. J. Emerg. Technol. Adv. Eng. 2012, 2, 91–101. [Google Scholar]
  7. Yadroitsava, I.; du Plessis, A.; Yadroitsev, I. Bone regeneration on implants of titanium alloys produced by laser powder bed fusion: A review. Titan. Consum. Appl. 2019, 2019, 197–233. [Google Scholar] [CrossRef]
  8. Hollander, D.A.; von Walter, M.; Wirtz, T.; Sellei, R.; Schmidt-Rohlfing, B.; Paar, O.; Erli, H.J. Structural, mechanical and in vitro characterization of individually structured Ti-6Al-4V produced by direct laser forming. Biomaterials 2006, 27, 955–963. [Google Scholar] [CrossRef]
  9. Al-Ketan, O.; Rowshan, R.; Al-Rub, R.K.A. Topology-mechanical property relationship of 3D printed strut, skeletal, and sheet based periodic metallic cellular materials. Addit. Manuf. 2018, 19, 167–183. [Google Scholar] [CrossRef]
  10. du Plessis, A.; Yadroitsava, I.; Yadroitsev, I. Ti6Al4V lightweight lattice structures manufactured by laser powder bed fusion for load-bearing applications. Opt. Laser Technol. 2018, 108, 521–528. [Google Scholar] [CrossRef]
  11. Ravalji, J.M.; Raval, S.J. Review of quality issues and mitigation strategies for metal powder bed fusion. Rapid Prototyp. J. 2022. ahead of print. [Google Scholar] [CrossRef]
  12. Choy, S.Y.; Sun, C.-N.; Leong, K.F.; Wei, J. Compressive properties of Ti-6Al-4V lattice structures fabricated by selective laser melting: Design, orientation and density. Addit. Manuf. 2017, 16, 213–224. [Google Scholar] [CrossRef]
  13. Wang, P.; Chen, D.; Fan, J.; Sun, K.; Wu, S.; Li, J.; Sun, Y. Study on the influence of process parameters on high performance Ti-6Al-4V parts in laser powder bed fusion. Rapid Prototyp. J. 2022. ahead of print. [Google Scholar] [CrossRef]
  14. Han, C.; Wang, Q.; Song, B.; Li, W.; Wei, Q.; Wen, S.; Liu, J.; Shi, Y. Microstructure and property evolutions of titanium/nano-hydroxyapatite composites in-situ prepared by selective laser melting. J. Mech. Behav. Biomed. Mater. 2017, 71, 85–94. [Google Scholar] [CrossRef]
  15. Marcu, T.; Menapace, C.; Girardini, L.; Leordean, D.; Popa, C. Selective laser melting of Ti6Al7Nb with hydroxyapatite addition. Rapid Prototyp. J. 2014, 20, 301–310. [Google Scholar] [CrossRef]
  16. Huang, S.; Sing, S.L.; de Looze, G.; Wilson, R.; Yeong, W.Y. Laser powder bed fusion of titanium-tantalum alloys: Compositions and designs for biomedical applications. J. Mech. Behav. Biomed. Mater. 2020, 108, 103775. [Google Scholar] [CrossRef]
  17. Mojumdar, S.; Kozánková, J.; Chocholoušek, J.; Majling, J.; Fábryová, D. Fluoroapatite-material for medicine, Growth, morphology and thermoanalytical properties. J. Therm. Anal. Calorim. 2004, 78, 73–82. [Google Scholar] [CrossRef]
  18. Chen, Y.; Miao, X. Thermal and chemical stability of fluorohydroxyapatite ceramics with different fluorine contents. Biomaterials 2005, 26, 1205–1210. [Google Scholar] [CrossRef]
  19. Ayed, F.B.; Bouaziz, J. Sintering of tricalcium phosphate-fluorapatite composites by addition of alumina. Ceram. Int. 2008, 34, 1885–1892. [Google Scholar] [CrossRef]
  20. Bhadang, K.A.; Gross, K.A. Influence of fluorapatite on the properties of thermally sprayed hydroxyapatite coatings. Biomaterials 2004, 25, 4935–4945. [Google Scholar] [CrossRef]
  21. Tran, H.-C.; Lo, Y.-L.; Yang, H.-C.; Hsiao, H.-C.; Cheng, F.-T.; Kuo, T.-H. Intelligent Additive Manufacturing Architecture for Enhancing Uniformity of Surface Roughness and Mechanical Properties of Laser Powder Bed Fusion Components. IEEE Trans. Autom. Sci. Eng. 2022, 1–12. [Google Scholar] [CrossRef]
  22. Tran, H.-C.; Lo, Y.-L. Heat transfer simulations of selective laser melting process based on volumetric heat source with powder size consideration. J. Mater. Process. Technol. 2018, 255, 411–425. [Google Scholar] [CrossRef]
  23. Hopkins, R.H.; Damon, D.H.; Piotrowski, P.; Walker, M.S.; Uphoff, J.H. Thermal Properties of Synthetic Fluorapatite Crystals. J. Appl. Phys. 1971, 42, 272–275. [Google Scholar] [CrossRef]
  24. Mills, K.C. Recommended Values of Thermophysical Properties for Selected Commercial Alloys; Woodhead Publishing: Sawston, United Kingdom, 2002. [Google Scholar]
  25. Kurzynowski, T.; Chlebus, E.; Kuźnicka, B.; Reiner, J. Parameters in selective laser melting for processing metallic powders. In High Power Laser Materials Processing: Lasers, Beam Delivery, Diagnostics, and Applications, Proceedings of the SPIE LASE, San Francisco, CA, USA, 21–26 January 2012; Beyer, E., Morris, T., Eds.; SPIE Digital Library: Bellingham, WA, USA, 2012; pp. 317–322. [Google Scholar]
  26. Young, Z.A.; Guo, Q.; Parab, N.D.; Zhao, C.; Qu, M.; Escano, L.I.; Fezzaa, K.; Everhart, W.; Sun, T.; Chen, L. Types of spatter and their features and formation mechanisms in laser powder bed fusion additive manufacturing process. Addit. Manuf. 2020, 36, 101438. [Google Scholar] [CrossRef]
  27. Khorasani, M.; Ghasemi, A.; Leary, M.; Sharabian, E.; Cordova, L.; Gibson, I.; Downing, D.; Bateman, S.; Brandt, M.; Rolfe, B. The effect of absorption ratio on meltpool features in laser-based powder bed fusion of IN718. Opt. Laser Technol. 2022, 153, 108263. [Google Scholar] [CrossRef]
  28. Han, C.; Li, Y.; Wang, Q.; Cai, D.; Wei, Q.; Yang, L.; Wen, S.; Liu, J.; Shi, Y. Titanium/hydroxyapatite (Ti/HA) gradient materials with quasi-continuous ratios fabricated by SLM: Material interface and fracture toughness. Mater. Des. 2018, 141, 256–266. [Google Scholar] [CrossRef]
  29. Tran, H.-C.; Lo, Y.-L. Systematic approach for determining optimal processing parameters to produce parts with high density in selective laser melting process. Int. J. Adv. Manuf. Technol. 2019, 105, 4443–4460. [Google Scholar] [CrossRef]
  30. Wang, H.-Y.; Lo, Y.-L.; Tran, H.-C.; Raza, M.M.; Le, T.-N. Systematic approach for reducing micro-crack formation in Inconel 713LC components fabricated by laser powder bed fusion. Rapid Prototyp. J. 2021, 27, 1548–1561. [Google Scholar] [CrossRef]
  31. Pal, S.; Lojen, G.; Kokol, V.; Drstvensek, I. Evolution of metallurgical properties of Ti-6Al-4V alloy fabricated in different energy densities in the Selective Laser Melting technique. J. Manuf. Process. 2018, 35, 538–546. [Google Scholar] [CrossRef]
  32. Tran, H.-C.; Lo, Y.-L.; Le, T.-N.; Lau, A.K.-T.; Lin, H.-Y. Multi-scale simulation approach for identifying optimal parameters for fabrication of high-density Inconel 718 parts using selective laser melting. Rapid Prototyp. J. 2021, 28, 109–125. [Google Scholar] [CrossRef]
  33. Le, T.-N.; Lo, Y.-L.; Tran, H.-C. Multi-scale modeling of selective electron beam melting of Ti6Al4V titanium alloy. Int. J. Adv. Manuf. Technol. 2019, 105, 545–563. [Google Scholar] [CrossRef]
  34. Mirkoohi, E.; Tran, H.-C.; Lo, Y.-L.; Chang, Y.-C.; Lin, H.-Y.; Liang, S. Mechanics Modeling of Residual Stress Considering Effect of Preheating in Laser Powder Bed Fusion. J. Manuf. Mater. Process. 2021, 5, 46. [Google Scholar] [CrossRef]
  35. Wasz, M.; Brotzen, F.; McLellan, R.; Griffin, A. Effect of oxygen and hydrogen on mechanical properties of commercial purity titanium. Int. Mater. Rev. 1996, 41, 1–12. [Google Scholar] [CrossRef]
Figure 1. Machining of tensile test specimens.
Materials 16 01502 g001
Figure 2. Dimensions of tensile test specimens.
Materials 16 01502 g002
Figure 3. SEM images showing surface morphologies of different powder types: (a) CP-Ti, (b) FA, (c) Ti-1%FA, and (d) Ti-2%FA.
Materials 16 01502 g003
Figure 4. XRD patterns of different powder types.
Materials 16 01502 g004
Figure 5. XRD patterns of different powder types in main peak range of FA.
Materials 16 01502 g005
Figure 6. SEM surface images of as-built CP-Ti samples fabricated using different scanning speeds and hatching spaces: (a) v = 600 mm/s—h = 100 µm; (b) v = 800 mm/s—h = 70 µm; (c) v = 1000 mm/s—h = 70 µm; (d) v = 600 mm/s—h = 65 µm; (e) v = 800 mm/s—h = 50 µm; (f) v = 1000 mm/s—h = 50 µm.
Materials 16 01502 g006
Figure 7. SEM surface images of as-built Ti-1%FA samples fabricated using different scanning speeds and hatching spaces: (a) v = 600 mm/s—h = 70 µm; (b) v = 800 mm/s—h = 70 µm; (c) v = 1000 mm/s—h = 70 µm; (d) v = 600 mm/s—h = 45 µm; (e) v = 800 mm/s—h = 45 µm; (f) v = 1000 mm/s—h = 45 µm.
Materials 16 01502 g007
Figure 8. SEM surface images of as-built Ti-2%FA samples fabricated using different scanning speeds and hatching spaces: (a) v = 600 mm/s—h = 70 µm; (b) v = 800 mm/s—h = 70 µm; (c) v = 1000 mm/s—h = 70 µm; (d) v = 600 mm/s—h = 45 µm; (e) v = 800 mm/s—h = 45 µm; (f) v = 1000 mm/s—h = 45 µm.
Materials 16 01502 g008
Figure 9. Stripe scanning strategy employed in the L-PBF process.
Materials 16 01502 g009
Figure 10. L-PBF samples processed using optimal parameters: (a) CP-Ti, (b) Ti-1%FA, and (c) Ti-2% FA.
Materials 16 01502 g010
Figure 11. As-built surface morphology of (a) CP-Ti, (b) Ti-1%FA, (c) Ti-2%FA.
Materials 16 01502 g011
Figure 12. Comparisons between surface roughness of as-built samples of three different material.
Materials 16 01502 g012
Figure 13. OM images showing cross-sections of various as-built samples: (a) CP-Ti, (b) Ti-1%FA, (c) Ti-2%FA.
Materials 16 01502 g013
Figure 14. Relative densities of as-built samples.
Materials 16 01502 g014
Figure 15. XRD patterns of L-PBF powders and as-built samples.
Materials 16 01502 g015
Figure 16. EDS analysis results for as-built samples: (A) CP-Ti, (B) Ti-1%FA, and (C) Ti-2%FA.
Materials 16 01502 g016
Figure 17. Measured hardness values of different samples.
Materials 16 01502 g017
Figure 18. Fracture samples after tensile tests: (a) Cp-Ti, and (b) Ti-1%FA.
Materials 16 01502 g018
Figure 19. Stress vs. strain response of CP-Ti and Ti-1%FA samples.
Materials 16 01502 g019
Figure 20. SEM images showing cross-section fracture surfaces of tensile specimens: (A) CP-Ti, and (B) Ti-1%FA.
Materials 16 01502 g020
Table 1. Chemical composition of the CP-Ti powder.
ElementNHOCFeTi
Wt%0.04 max0.0125 max0.13 max0.08 max0.2 maxBal.
Table 2. Processing conditions for surface scanning experiments.
Fixed Processing Conditions for All Materials
Powder size (µm)<55
Diameter of laser beam (µm)78
Layer thickness (µm)40
Oxygen concentration (ppm)O2 < 1000 ppm
Laser power (W)150
Parameter Settings for Different Materials
CP-TiScanning Speed (mm/s)Hatching Space (µm)
600100
65
80070
50
100070
50
Ti-1%FA
Ti-2%FA
60070
45
80060
40
100060
40
Table 3. Processing conditions for 3D-printing experiments.
Fixed Processing Conditions for All Materials
Powder size (µm)<55
Diameter of laser beam (µm)78
Layer thickness (µm)40
Oxygen concentration (ppm)O2 < 1000 ppm
Laser power (W)150
Parameter Settings for Different Materials
CP-TiScanning Speed (mm/s)Hatching Space (µm)
80070
Ti-1%FA100070
Ti-2%FA100070
Disclaimer/Publisher’s Note: The statements, opinions and data contained in all publications are solely those of the individual author(s) and contributor(s) and not of MDPI and/or the editor(s). MDPI and/or the editor(s) disclaim responsibility for any injury to people or property resulting from any ideas, methods, instructions or products referred to in the content.

