Article

Abnormal Eu3+ → Eu2+ Reduction in Ca9−xMnxEu(PO4)7 Phosphors: Structure and Luminescent Properties

by
Elena V. Sipina
1,
Dmitry A. Spassky
2,3,
Nataliya R. Krutyak
1,3,
Vladimir A. Morozov
4,
Evgenia S. Zhukovskaya
4,
Alexei A. Belik
5,
Mikhail S. Manylov
4,
Bogdan I. Lazoryak
4 and
Dina V. Deyneko
4,6,*
1
Physics Department, Lomonosov Moscow State University, 119991 Moscow, Russia
2
Skobeltsyn Institute of Nuclear Physics, Lomonosov Moscow State University, 119991 Moscow, Russia
3
Institute of Physics, University of Tartu, 50411 Tartu, Estonia
4
Department of Chemistry, Lomonosov Moscow State University, 119991 Moscow, Russia
5
International Center for Materials Nanoarchitectonics (WPI-MANA), National Institute for Materials Science (NIMS), Tsukuba 305-0044, Ibaraki, Japan
6
Laboratory of Arctic Mineralogy and Material Sciences, Kola Science Centre, Russian Academy of Sciences, 184209 Apatity, Russia
*
Author to whom correspondence should be addressed.
Materials 2023, 16(4), 1383; https://doi.org/10.3390/ma16041383
Submission received: 5 January 2023 / Revised: 21 January 2023 / Accepted: 3 February 2023 / Published: 7 February 2023
(This article belongs to the Special Issue Advanced Materials for Optical and Luminescence Applications)

Abstract

:
β-Ca3(PO4)2-type phosphors Ca9−xMnxEu(PO4)7 have been synthesized by high-temperature solid-phase reactions. The crystal structure of Ca8MnEu(PO4)7 was characterized by synchrotron X-ray diffraction. The phase transitions, magnetic and photoluminescence (PL) properties were studied. The abnormal reduction Eu3+ → Eu2+ in air was observed in Ca9−xMnxEu(PO4)7 according to PL spectra study and confirmed by X-ray photoelectron spectroscopy (XPS). Eu3+ shows partial reduction and coexistence of Eu2+/3+ states. It reflects in combination of a broad band from the Eu2+ 4f65d1 → 4f7 transition and a series of sharp lines attributed to 5D07FJ transitions of Eu3+. Eu2+/Eu3+ ions are redistributed among two crystal sites, M1 and M3, while Mn2+ fully occupies octahedral site M5 in Ca8MnEu(PO4)7. The main emission band was attributed to the 5D07F2 electric dipole transition of Eu3+ at 395 nm excitation. The abnormal quenching of Eu3+ emission was observed in Ca9−xMnxEu(PO4)7 phosphors with doping of the host by Mn2+ ions. The phenomena of abnormal reduction and quenching were discussed in detail.

1. Introduction

The global search for obtainable phosphors emitting in the red region of the spectrum continues to the present, due to the requirements for creating high-quality light from modern LED illuminators. The aims of red phosphors are to improve the color rendering (CRI) and lower the resulting corelated color temperature (CCT) of the LED package. The main requirements for such phosphors are:
(1)
A broad excitation band which can be matched well with the light from the LED chip (usually, at 450–470 nm from the InGaN chip). A number of Eu3+-doped inorganic red phosphors have been developed with the narrow emission due to the electric dipole 5D07F2 transition located at 610–630 nm. This transition is dominant in most hosts due to the noncentrosymmetric environment. However, such luminescent materials mismatch the excitation wavelengths from the LED chip since the main excitation band of the Eu3+ ion is located obviously at 392–396 nm and has a narrow character;
(2)
A narrow emission band in the red region (full width at half-maximum (FWHM) should not exceed 20 nm to reduce radiative losses in the near-IR range) [1]. Moreover, the barycenter of the emission band must not lie beyond 650 nm to minimize wasted emission [2];
(3)
A high stability in the environment and high luminous efficiency of radiation (LER). LER values increase with the narrowing of the emission line from red phosphor [1]. At the moment, the luminous efficiency from red phosphors can reach values of 54 lm/W (lumens per watt) [3].
Red-emitting phosphors that mostly meet the technological requirements can be created, for example, based on nitrides [4] or oxynitrides, such as (Ba,Sr)2Si5N8:Eu2+ [5], (Ca,Sr)SiAlN3:Eu2+ [6] or Sr[Li2Al2O2N2]:Eu2+ [7]. For obtaining such compositions, metal nitrides Si3N4 and AlN are usually used as raw materials which are air-sensitive and require a combination of high temperatures (up to 1700 °C) with a reducing atmosphere [8].
Phosphors based on hexafluorometallates, such as K2SiF6:Mn4+ [9], for instance, satisfy the requirement to reduce the consumption of rare-earth elements [10] and emit an extremely narrow photoluminescence band (used to increase the brightness of displays) due to intra-configuration 3d-3d transitions of Mn4+ ions. However, high-cost Si sources and not environment-friendly hydrofluoric acid are used in the synthesis. Moreover, they are very sensitive to moisture in the air and have long decay times, which limit their application.
According to the above, phosphate-based phosphors are important luminescent materials due to their excellent stability and available synthesis conditions. At the same time, the incorporation of Mn2+ ions into the β-Ca3(PO4)2-type (β-TCP) structure phosphates makes it possible to both stabilize the crystal structure [11] and to obtain photoluminescent properties from Mn2+ ions [12]. The stabilization of the lattice occurs due to the reduction of geometric stress in the octahedral site during Ca2+ → Mn2+ substitution since the ionic radii of Mn2+ (rVI = 0.83 Å) are less than Ca2+ (rVI = 1.00 Å). Mn2+-doped phosphates show a broad emission band at 600–750 nm, peaked at 650 nm [12,13,14], which corresponds to the red region of the visible spectrum. Mn2+ ions, as an activator, show a wide emission band from the 4T1(4G) → 6A1(6S) transition in the PL spectrum [13]. This emission strongly depends on the crystal field and can shift from green to red color. In an octahedral environment with a strong crystal field, Mn2+ ions usually generate red emission. If Mn2+ ions are located in a tetrahedral environment with a weak crystal field, green emission could be observed [15,16]. A serious advantage of Mn2+ doping into the β-TCP structure is a strong absorption of excitation at 450–480 nm, which is matching with the InGaN blue chip [13].
Co-doping strategy using Eu2+/Mn2+ [17] or Ce3+/Mn2+ [18] ions can improve the emission intensity due to the energy transfer processes in comparison to single-doped β-TCP-type hosts. For the CIE color adjustment and white light production, the combinations of rare-earth ions with Mn2+ at different concentrations can be used, such as Ce3+/Tb3+/Mn2+ or Eu2+/Tb3+/Mn2+. Moreover, there is a possibility to obtain Mn2+ to Eu3+ energy transfer for enhancement of red Eu3+ emission [15,19,20] while Eu2+ to Mn2+ energy transfer is commonly observed [21]. Some data on Mn2+ and RE/Mn2+ (RE—rare-earth element) doped β-TCP phosphors are summarized in Table 1.
The idea of the present research was to combine the emission from Eu3+ and Mn2+ ions in the stable and easily synthesized host to obtain ideal red phosphor. The structure’s features were studied using synchrotron X-ray diffraction. The abnormal reduction of Eu3+ in air was observed according to PL spectra and confirmed by XPS data. Moreover, a strong quenching of Eu3+ emission was detected in Ca9−xMnxEu(PO4)7, which is the opposite to other Ca9−xMxEu(PO4)7 phosphates with divalent metals, such as Mg2+ or Zn2+. The mechanisms of self-reduction and quenching are discussed in detail.

2. Materials and Methods

The series of phosphates Ca9−xMnxEu(PO4)7 was synthesized by high-temperature solid-state route from simple oxides MnO2 (99.9%), Eu2O3 (99.9%), calcium hydrogen phosphate CaHPO4·2H2O (99.9%) and calcium carbonate CaCO3 (99.9%). The reagents of standard grade were checked for purity and used without further purification. The raw materials were weighted and thoroughly grounded. The syntheses were carried out in air in alundum crucibles at 1100 °C for 50 h. Phase analysis using JCPDS PDF-4 database (ICDD, Newtown Square, PA, USA) revealed that the synthesized samples did not contain any reflections of the initial or impurity phases.
The chemical composition of Ca8MnEu(PO4)7 was determined by energy-dispersive X-ray spectrometry (EDX) using scanning electron microscope (SEM) Tescan VEGA3 (Oxford Instruments, Abingdon, UK) equipped with an Oxford Instruments X-Max 50 silicon drift. The EDX analysis results were based on the CaK, MnK, EuL and PK edge lines. The oxygen content was not quantified by EDX.
Powder X-ray diffraction (PXRD) patterns were obtained using Thermo ARL X’TRA (Bragg–Brentano geometry, Scintillator detector, CuKα radiation, λ = 1.5418 Å, Thermo Fisher Scientific, Waltham MA, USA). PXRD data were collected in 2θ range from 5° to 75° with 0.02° step at room temperature.
Synchrotron PXRD data for Ca8MnEu(PO4)7 were measured with a large Debye-Scherrer camera (home-made, NIMS, Tsukuba, Japan) at the BL15XU beamline of SPring-8. The intensity data were collected in 2θ range from 1° to 60° with step 0.003°. The incident beam was monochromatized at λ = 0.65298 Å. The samples were packed into Lindemann glass capillaries with an inner diameter of 0.1 mm, which were rotated during the measurement. The absorption coefficients were also measured. Rietveld analysis [27] was performed using JANA2006 software (by Petricek, V., Dusek, M. & Palatinus, L. Institute of Physics, Academy of Science of the Czech Republic, Praha) [28].
The second harmonic generation (SHG) signal was measured with a Q-switched YAG:Nd laser (home-made, Moscow, Russia) at λω =1064 nm in the reflection mode. The powder of α-SiO2 (3–5 μm particles size) was used as a standard to calibrate the intensity of the SHG signal (I). The final SHG value is a relation: I(sample)/I(SiO2).
Differential scanning calorimetry (DSC) measurements were performed on an NETZSCH DSC 204 F1 calorimeter (NETZSCH, Selb, Germany) in the temperature range from 323 to 973 K with heating rate 10 K·min−1 in nitrogen flow of 40 mL·min−1.
The electrical conductivity, dielectric permittivity ε and dielectric loss tangent tg δ in air were measured by the double-contact method in the frequency range of 1–106 Hz at 300–1270 K (heating rate of 5 K·min−1), with the help of precision voltmeter Solartron 7081 (Schlumberger, Houston, TX, USA) and frequency response analyzer Solartron 1260 (Schlumberger, Houston, TX, USA). Ceramic pellet from Ca8MnEu(PO4)7 (1.5 mm thick and 5–6 mm in diameter) was prepared by pressing and sintering at 1473 K for 12 h. Pt paste was put on the flat surfaces of the pellet, and then it was heated at 1023 K for 4 h to produce platinum electrodes.
Magnetic measurements were performed on a SQUID magnetometer (Quantum Design, MPMS-XL-7T, Quantum Design, San Diego, CA, USA) from 400 K to 2 K at an applied field of 10 kOe. Isothermal magnetization measurements, M vs. H, were performed from 70 kOe to 0 Oe at T = 2 K.
The surface chemical analysis of Ca9−xMnxEu(PO4)7 x = 0.2 and x = 1.0 phosphates was performed by XPS using a Axis Ultra DLD (Kratos Analytical, Manchester, UK) spectrometer with monochromatic AlKα source X-rays (1486.6 eV). The measurements were performed at pressure better than 5 × 10⁻⁷ Pa. The area of the surface analyzed was ~300 × 700 μm2, which provided statistically reliable average results that represented the general surface of the compact powder. The resolution of the spectrometer measured as the full width at half maximum (FWHM) of the Au4f7/2 line was about 0.7 eV. The experiments were performed with charge neutralization and use of the C1s level (285.0 eV) arising from the saturated hydrocarbon contamination on the sample surface as the binding energy (Eb, eV) scale reference. Selected region spectra were recorded covering the Ca2s, Ca2p, P2s, P2p, Eu3d, Eu4p, Eu4d, Mn2p, O1s and C1s photoemission peaks. The XPS spectra were measured with an energy step size of 1 eV and a pass energy of 160 eV. The high-resolution XPS spectra were performed with an energy step size of 0.1 eV and a pass energy of 40 eV.
Luminescence excitation spectra and emission spectra under excitation in the UV region were measured using a 150 W xenon lamp (Oriel Instruments, Stratford, CT, USA) as an excitation source, an MDR-206 primary monochromator (Lomo, Saint-Petersburg, Russia) and a LOT-Oriel MS-257 spectrograph (Oriel Instruments, Stratford, CT, USA) equipped with a Marconi CCD detector (Marconi Applied Technologies Limited, Chelmsford, UK). Samples were mounted into a Cryotrade LN-120 vacuum optical cryostat (Cryotrade engineering, Moscow, Russia).

3. Results

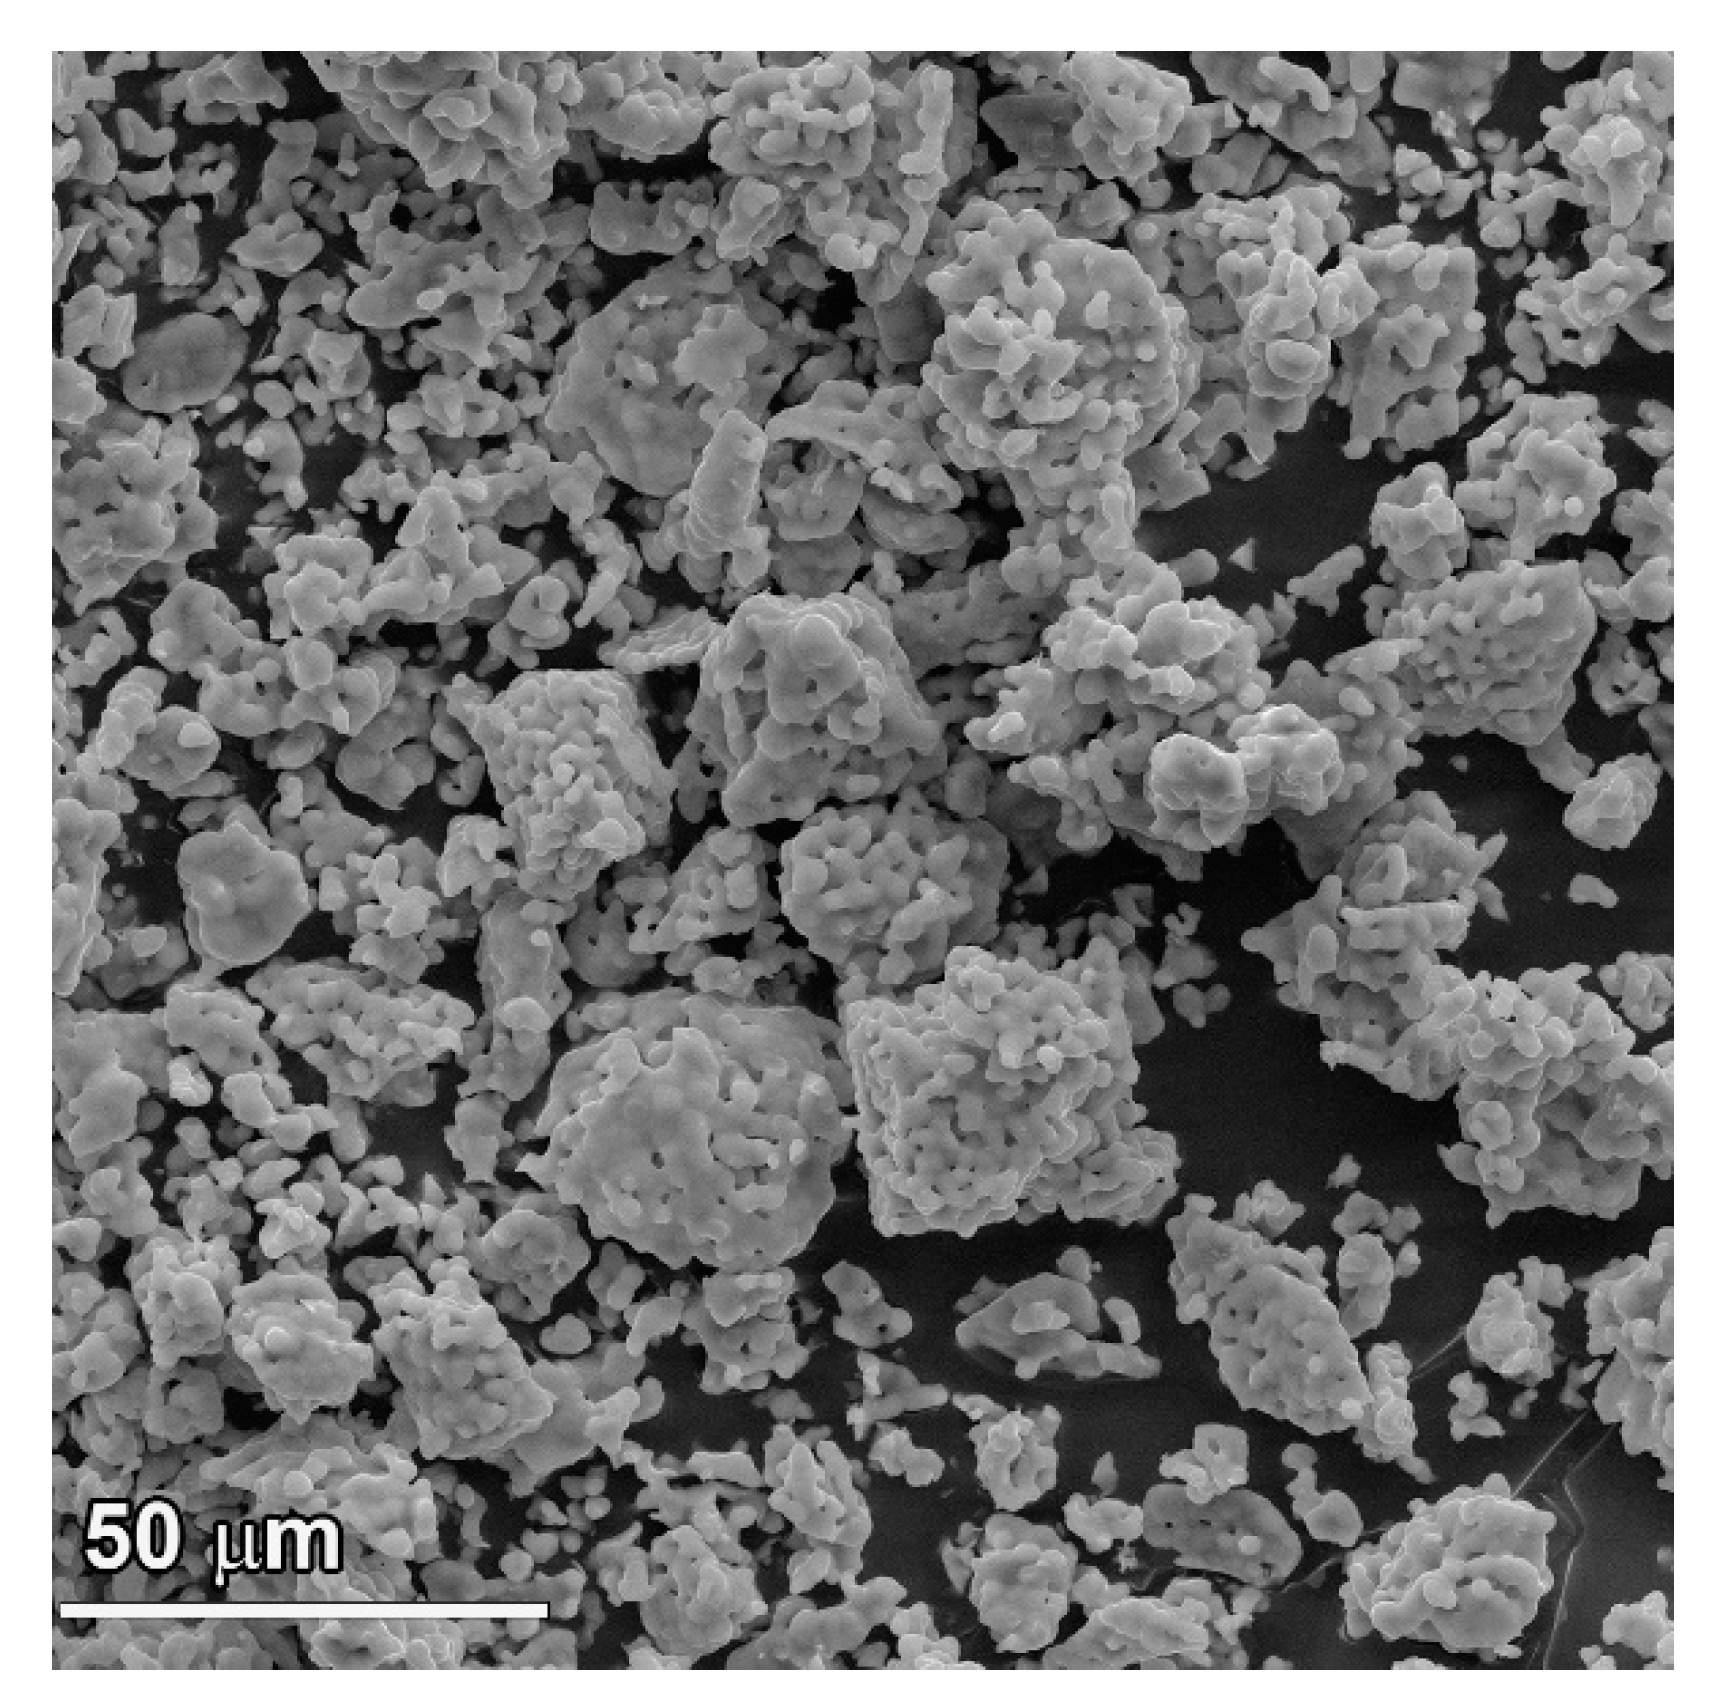
3.1. SEM Observations

The SEM image of Ca8MnEu(PO4)7 is shown in Figure 1. The sample consists of small particles from 2–5 μm which are slightly agglomerate with each other. According to the EDX data, the ratio between Ca: Mn: Eu: P in Ca8MnEu(PO4)7 was determined as 7.98 ± 0.62: 1.01 ± 0.08: 0.99 ± 0.05: 7.01 ± 0.85. This ratio, defined by EDX data, is close to the expected composition.

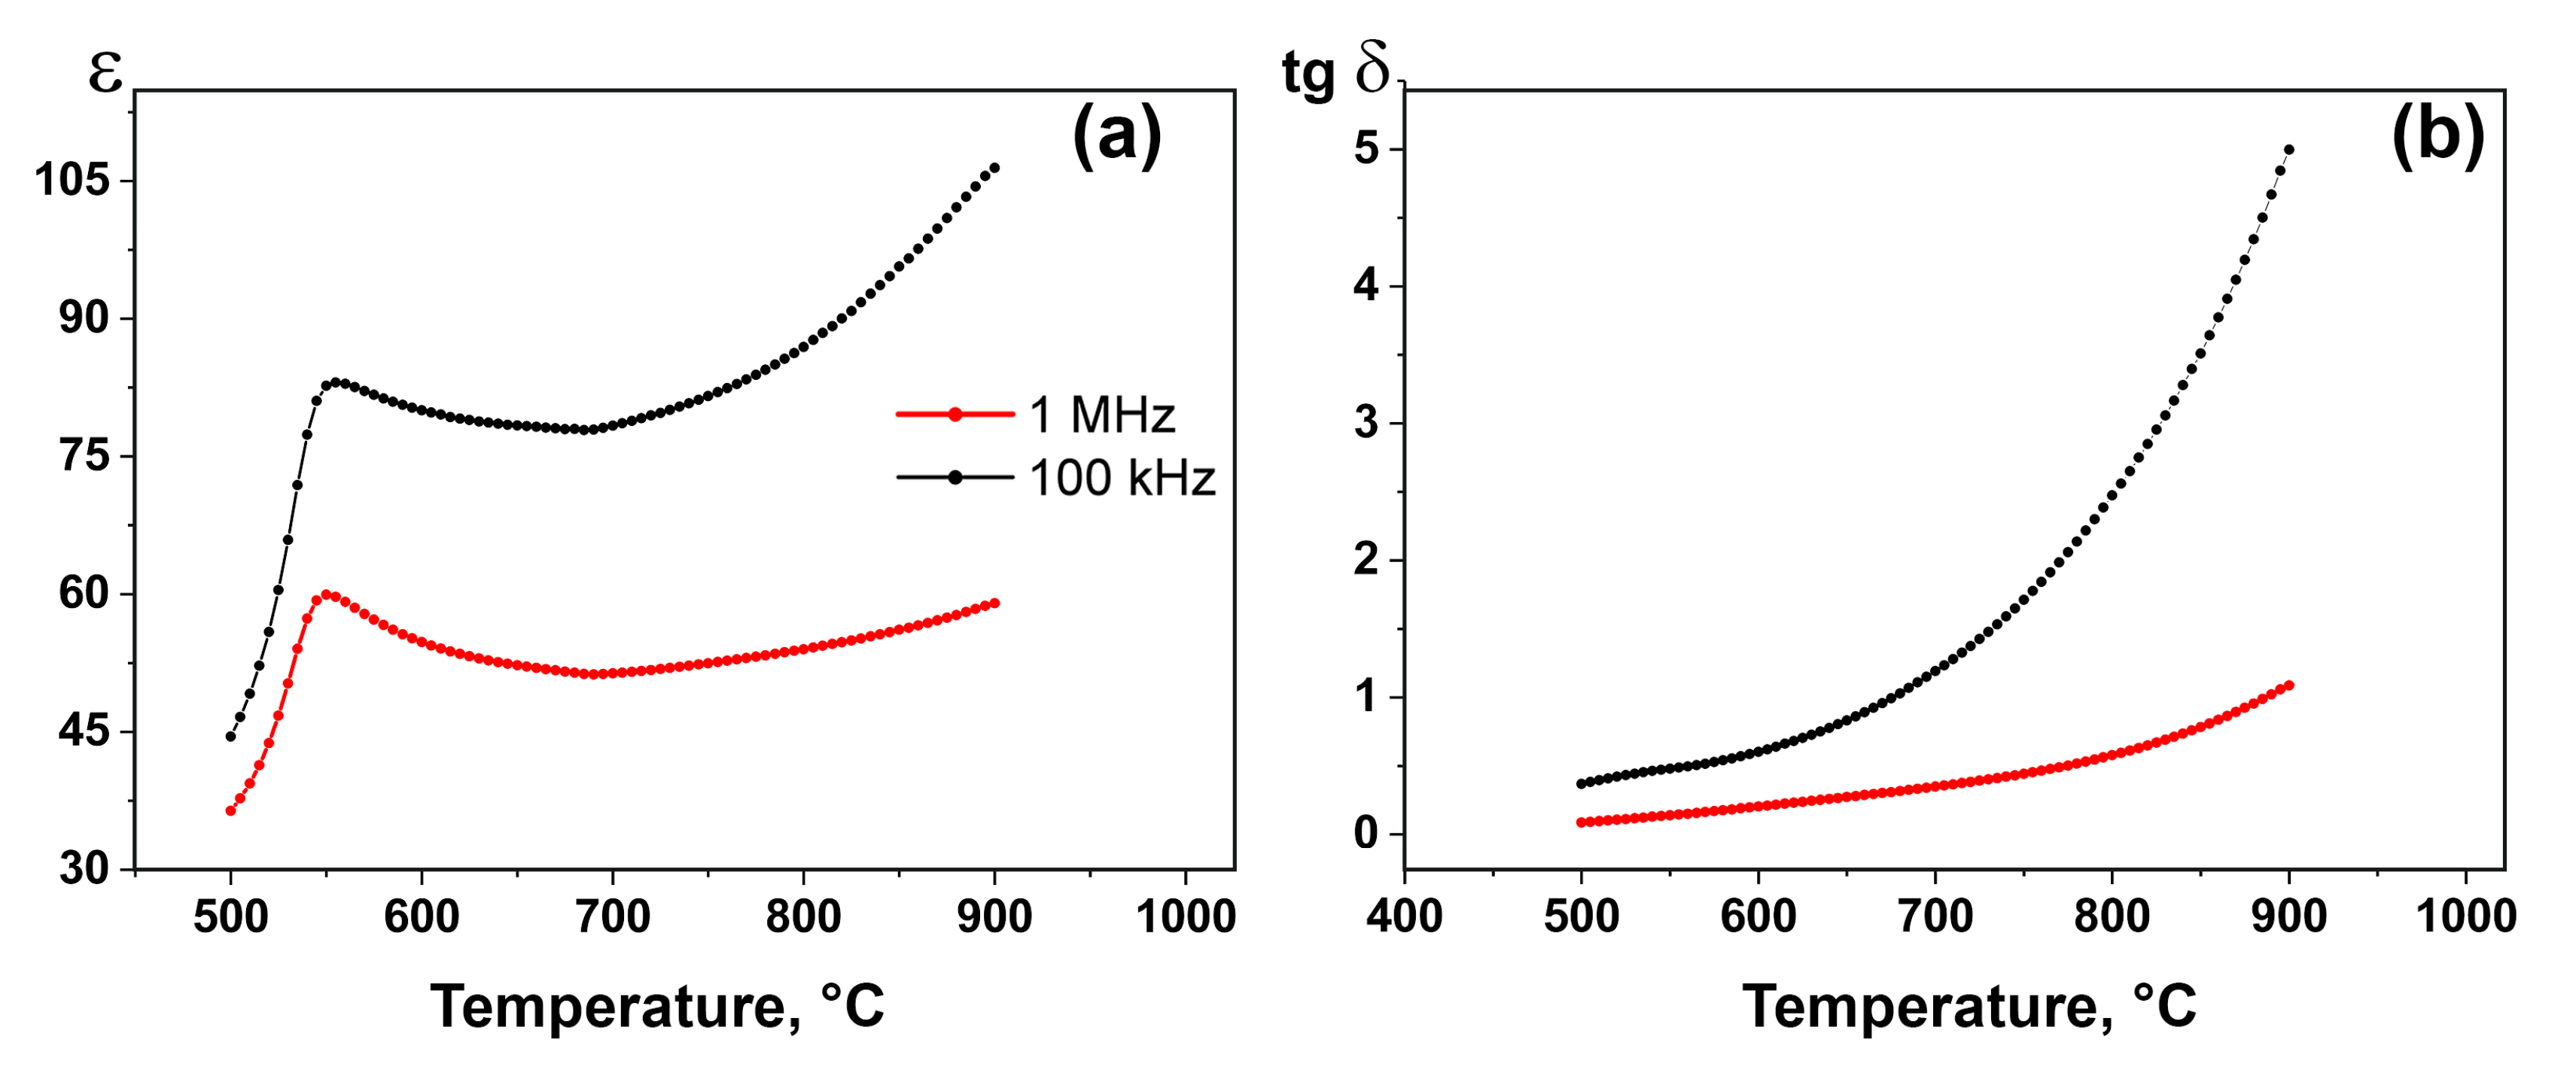
3.2. SHG, DSC and Dielectric Spectroscopy Measurements
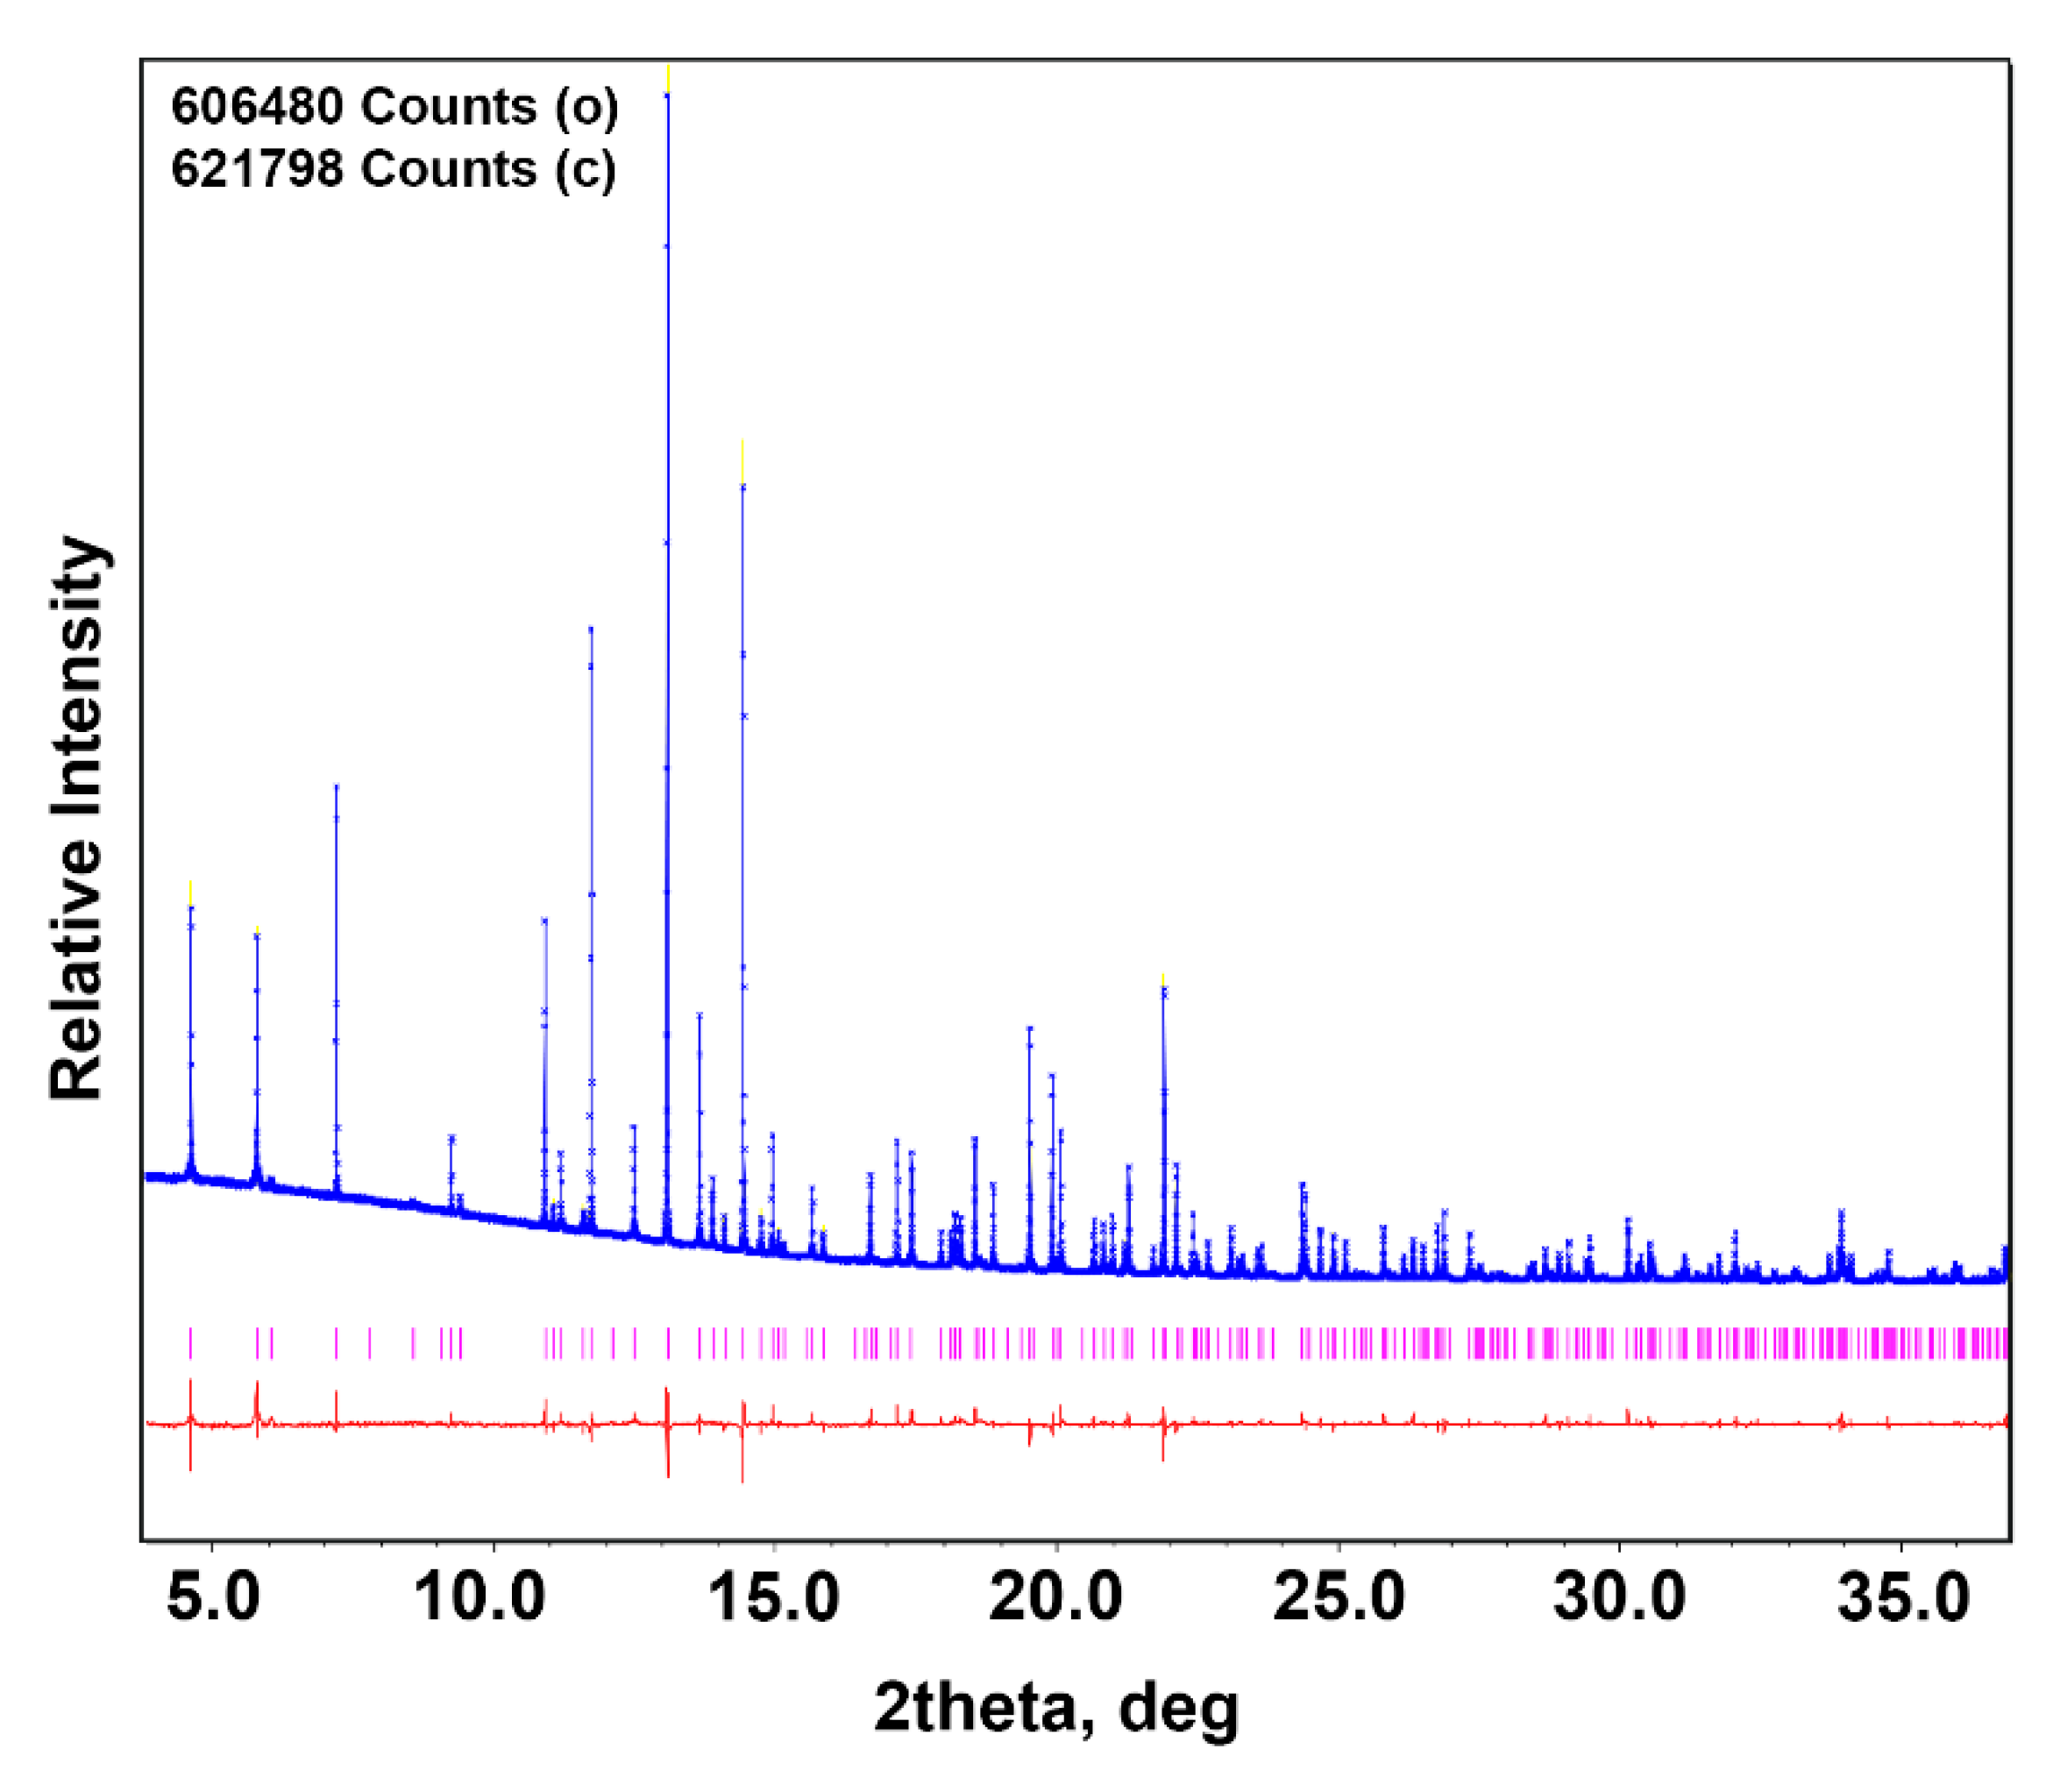
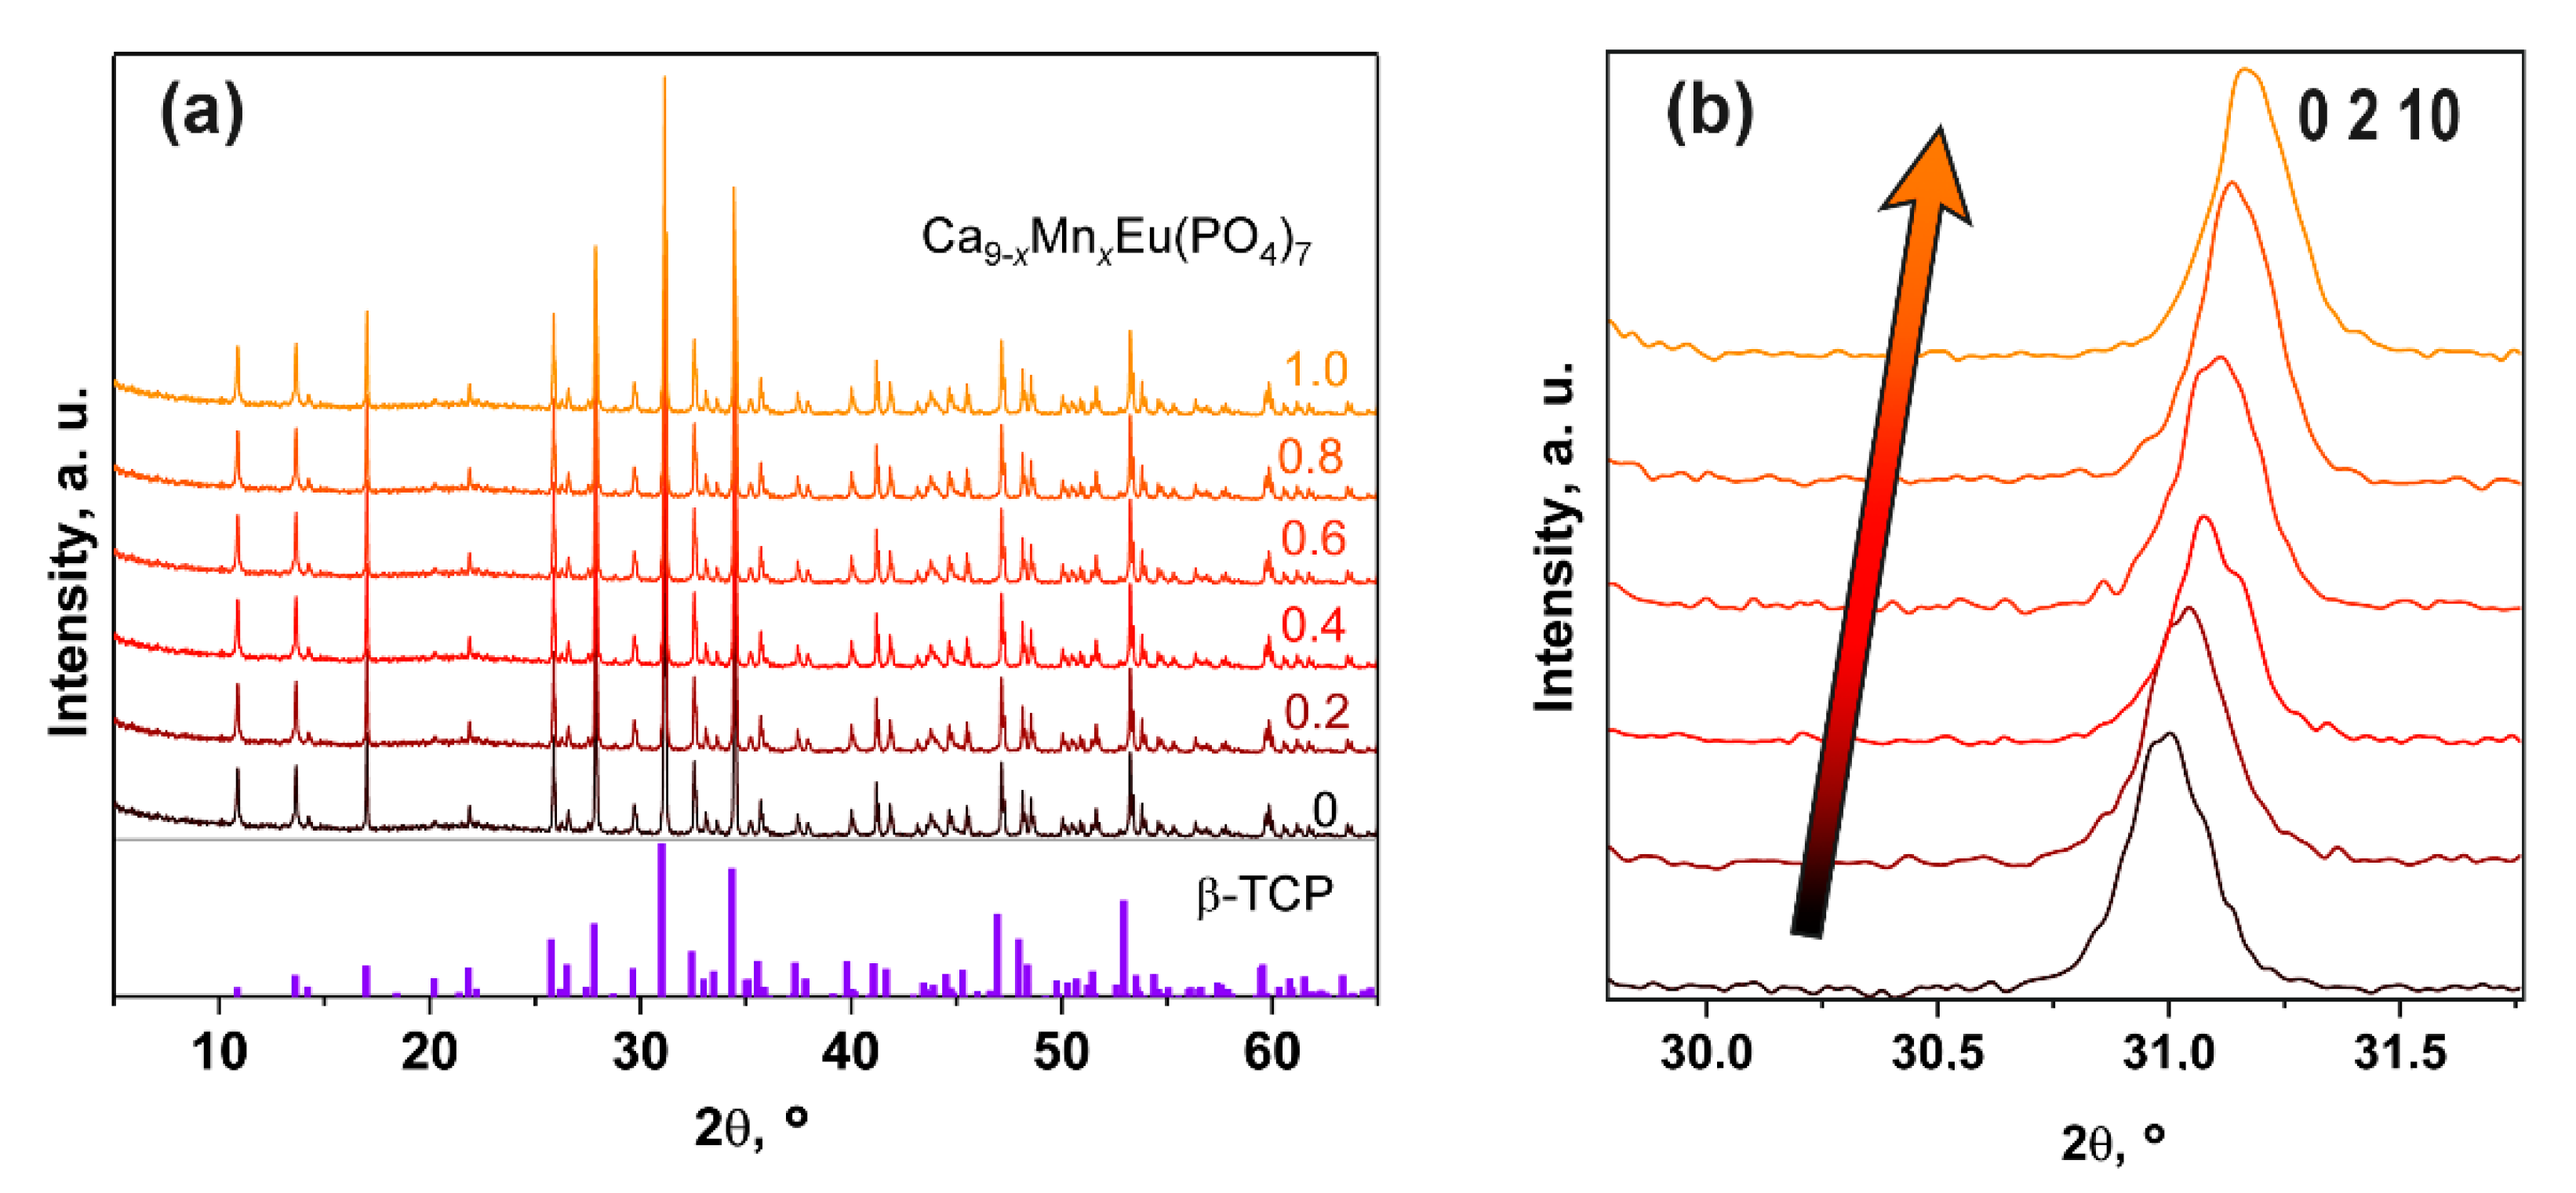
The SHG signal of Ca8MnEu(PO4)7 shows a very weak response. The value of the SHG signal (I) relative to the quartz standard I (SiO2) was I/I (SiO2) < 0.1, which corresponds to the sensitivity limit of the device. Such a small SGH signal value is attributed to a centrosymmetric structure. Previously studied Ca8M2+Eu(PO4)7 phosphates with M2+ = Zn2+ [29], Mg2+ [30], Cd2+ [31] showed similar small SGH values, and their structures were defined as centrosymmetric with the space group R 3 ¯ c. The studied Ca8MnEu(PO4)7 phosphate complements the group of centrosymmetric β-TCP-type compounds.
For the series of phosphates Ca9−xMnxEu(PO4)7, the SHG signal shows a trend to decrease from 0.4 for Ca9Eu(PO4)7 (x = 0) to 0 for Ca8MnEu(PO4)7 (x = 1). This trend was observed in other β-TCP solid solutions, Ca9−xMgxRE(PO4)7, RE = Dy3+ [32], Eu3+ [33] and Ca9−xZnxRE(PO4)7 with RE = Tb3+ [34], Ho3+ [35], Eu3+ [29], La3+ [36] according to symmetry inhomogeneity of the β-TCP structure.
The fragments of DSC curves for Ca8MnEu(PO4)7 are showed in Figure 2. DSC curves in the heating and cooling cycles point to the presence of only one peak at 501 and 520 °C, respectively. These peaks are attributed to the first-order phase transition and have a reversible character.
The temperature dependencies of the dielectric permittivity ε(T) and the dielectric loss tangent tg δ(T) at different frequencies for Ca8MnEu(PO4)7 are shown in Figure 3a and Figure 3b, respectively. ε(T) increases with heating and reaches the phase transition at 525–575 °C with maximum at 550 °C (Figure 3a). A monotonous increase of ε(T) to around Curie temperature (Tc) seems to be the characteristic behavior. The location of the maximum on the curves does not depend on the frequency (Figure 3a). Such a maximum can characterize both ferroelectric and antiferroelectric phase transitions. However, the absence of an anomaly in tgδ(T) curve at a temperature of 500–1200 °C (Figure 3b) indicates the antiferroelectric character of the phase transition [37,38].
The absence of the SHG signal and the presence of an antiferroelectric phase transition on ε(T) along with effects on DSC curves confirm the centrosymmetric structure of Ca8MnEu(PO4)7. Since the polar and nonpolar space groups R3c and R 3 ¯ c in the β-TCP-type compounds are practically indistinguishable from PXRD data [33], previously it was proved by electron diffraction that Ca8MgEu(PO4)7 [37] crystallizes in the centrosymmetric group R 3 ¯ c, and during the phase transition, the symmetry changes from R 3 ¯ c to R 3 ¯ m [37].
The temperature position of the phase transition in Ca8MnEu(PO4)7 exceeds these values for Ca8ZnEu(PO4)7 (Tc ~ 547 °C) [29] and Ca8MgEu(PO4)7 (Tc ~ 507 °C) [33]. This fact is due to the difference in the values of the ionic radii of M2+ in Ca8MEu(PO4)7. The phase transition occurs at lower temperatures when the smaller ion is placed in the M5 site. Since Mn2+ is the largest among these ions (Zn2+, Mg2+, Mn2+), Tc shows the biggest value. However, the replacement Ca2+ → Mn2+ does not significantly affect the phase transition temperature, which is 573 °C for Ca9Eu(PO4)7 [35].
The temperature dependence of the electric conductivity (σ) of Ca8MnEu(PO4)7 at 50 kHz is shown in Figure 4 in the Arrenius coordinates log(σ)–(103/T). The electroconductivity of Ca8MnEu(PO4)7 is rising with the temperature increasing. The abrupt change in σ at 820–860 K is due to the rearrangement at the antiferroelectric/paraelectric phase transition (R 3 ¯ cR 3 ¯ m). Since the conduction temperature during heating is higher than during cooling, such a change in σ also indicates a first-order phase transition. The temperature behavior of the electroconductivity in Ca8MnEu(PO4)7 is similar to other phosphates with the common formula Ca8M2+RE3+(PO4)7 [30,31,39] and is a consequence of the mobility of Ca2+ ions [40].

3.3. PXRD Study

PXRD pattern of Ca8MnEu(PO4)7 is similar to other compounds with the β-TCP-type structure (Figure 5). The absence of any impurity reflections on the PXRD pattern shows that Eu3+ and Mn2+ ions were completely involved in the structure. β-Ca3(PO4)2 structure (sp.gr. R3c, Z = 6) is a rather rigid structure and consists of isolated tetrahedra PO4 that connect CaOn polyhedra into a 3D frame by common vertices [41]. The Ca2+ ions are located in sites M1–M5, where M1–M3 and M5 sites are fully occupied, while M4 sites are partly filled and M6 sites are fully vacant.
No vacancies in the anionic sublattice can appear in the β-Ca3(PO4)2-type structure, even during heterovalent substitutions, when [PO4]3− is replaced by [GeO4]4− [42] or [SO4]2− [43], for instance. Formation of phase-pure phases in these cases requires charge compensation. So, phosphorus atoms fully occupy three (P1, P2 and P3) tetrahedra sites. The symmetry changing R3cR 3 ¯ c results in an equivalence of M1 and M2 sites in the cationic sublattice and P2O4 and P3O4 tetrahedra in the anionic sublattice. M5, M3 and P1 sites are located in the center of symmetry, and P1 is in the half-occupied special position 12c. Atoms O1 and O2 are located in half-occupied positions 12c and 36f, respectively.
The atomic coordinates for Ca8MgEu(PO4)7 were used as a starting model for synchrotron data refinement for Ca8MnEu(PO4)7. Manganese ions were refined in the octahedral M5 site, while Eu ions were distributed through M1 and M3 sites with the preference occupation in the M1 site (Table S1 of the Supporting Information). After the structure refinement in an R 3 ¯ c model, a good agreement between the calculated and the experimental synchrotron PXRD patterns was observed, as it can be seen from the Figure 5 difference plot. Figure 5 shows fragments of the observed, calculated and difference synchrotron PXRD patterns of Ca8MnEu(PO4)7. Other numerical characteristics showing the quality of the structure refinements are given in Table 2. The fractional atomic coordinates, isotropic atomic displacement parameters and cation occupancies are listed in Table S1 of the Supporting Information. The main interatomic distances are listed in Table S2 of the Supporting Information. CCDC 2237297 contains the supplementary crystallographic data for this paper.
Figure 6a shows PXRD patterns of Ca9−xMnxEu(PO4)7 solid solutions. All the diffraction peaks are matched with β-TCP (PDF#4 Card No. 00-09-0169). Moreover, a shifting of the reflections with the increasing of manganese concentration can be observed (Figure 6b). The reflections move toward larger angles according to Bragg’s rule and difference between the ionic radii of Ca2+ (rIV = 1.00 Å) and Mn2+ (rIV = 0.83 Å). The absence of the impurity phases in PXRD patterns and reflections shifting show the successful incorporation of Mn2+ ions in the β-TCP structure in all samples.

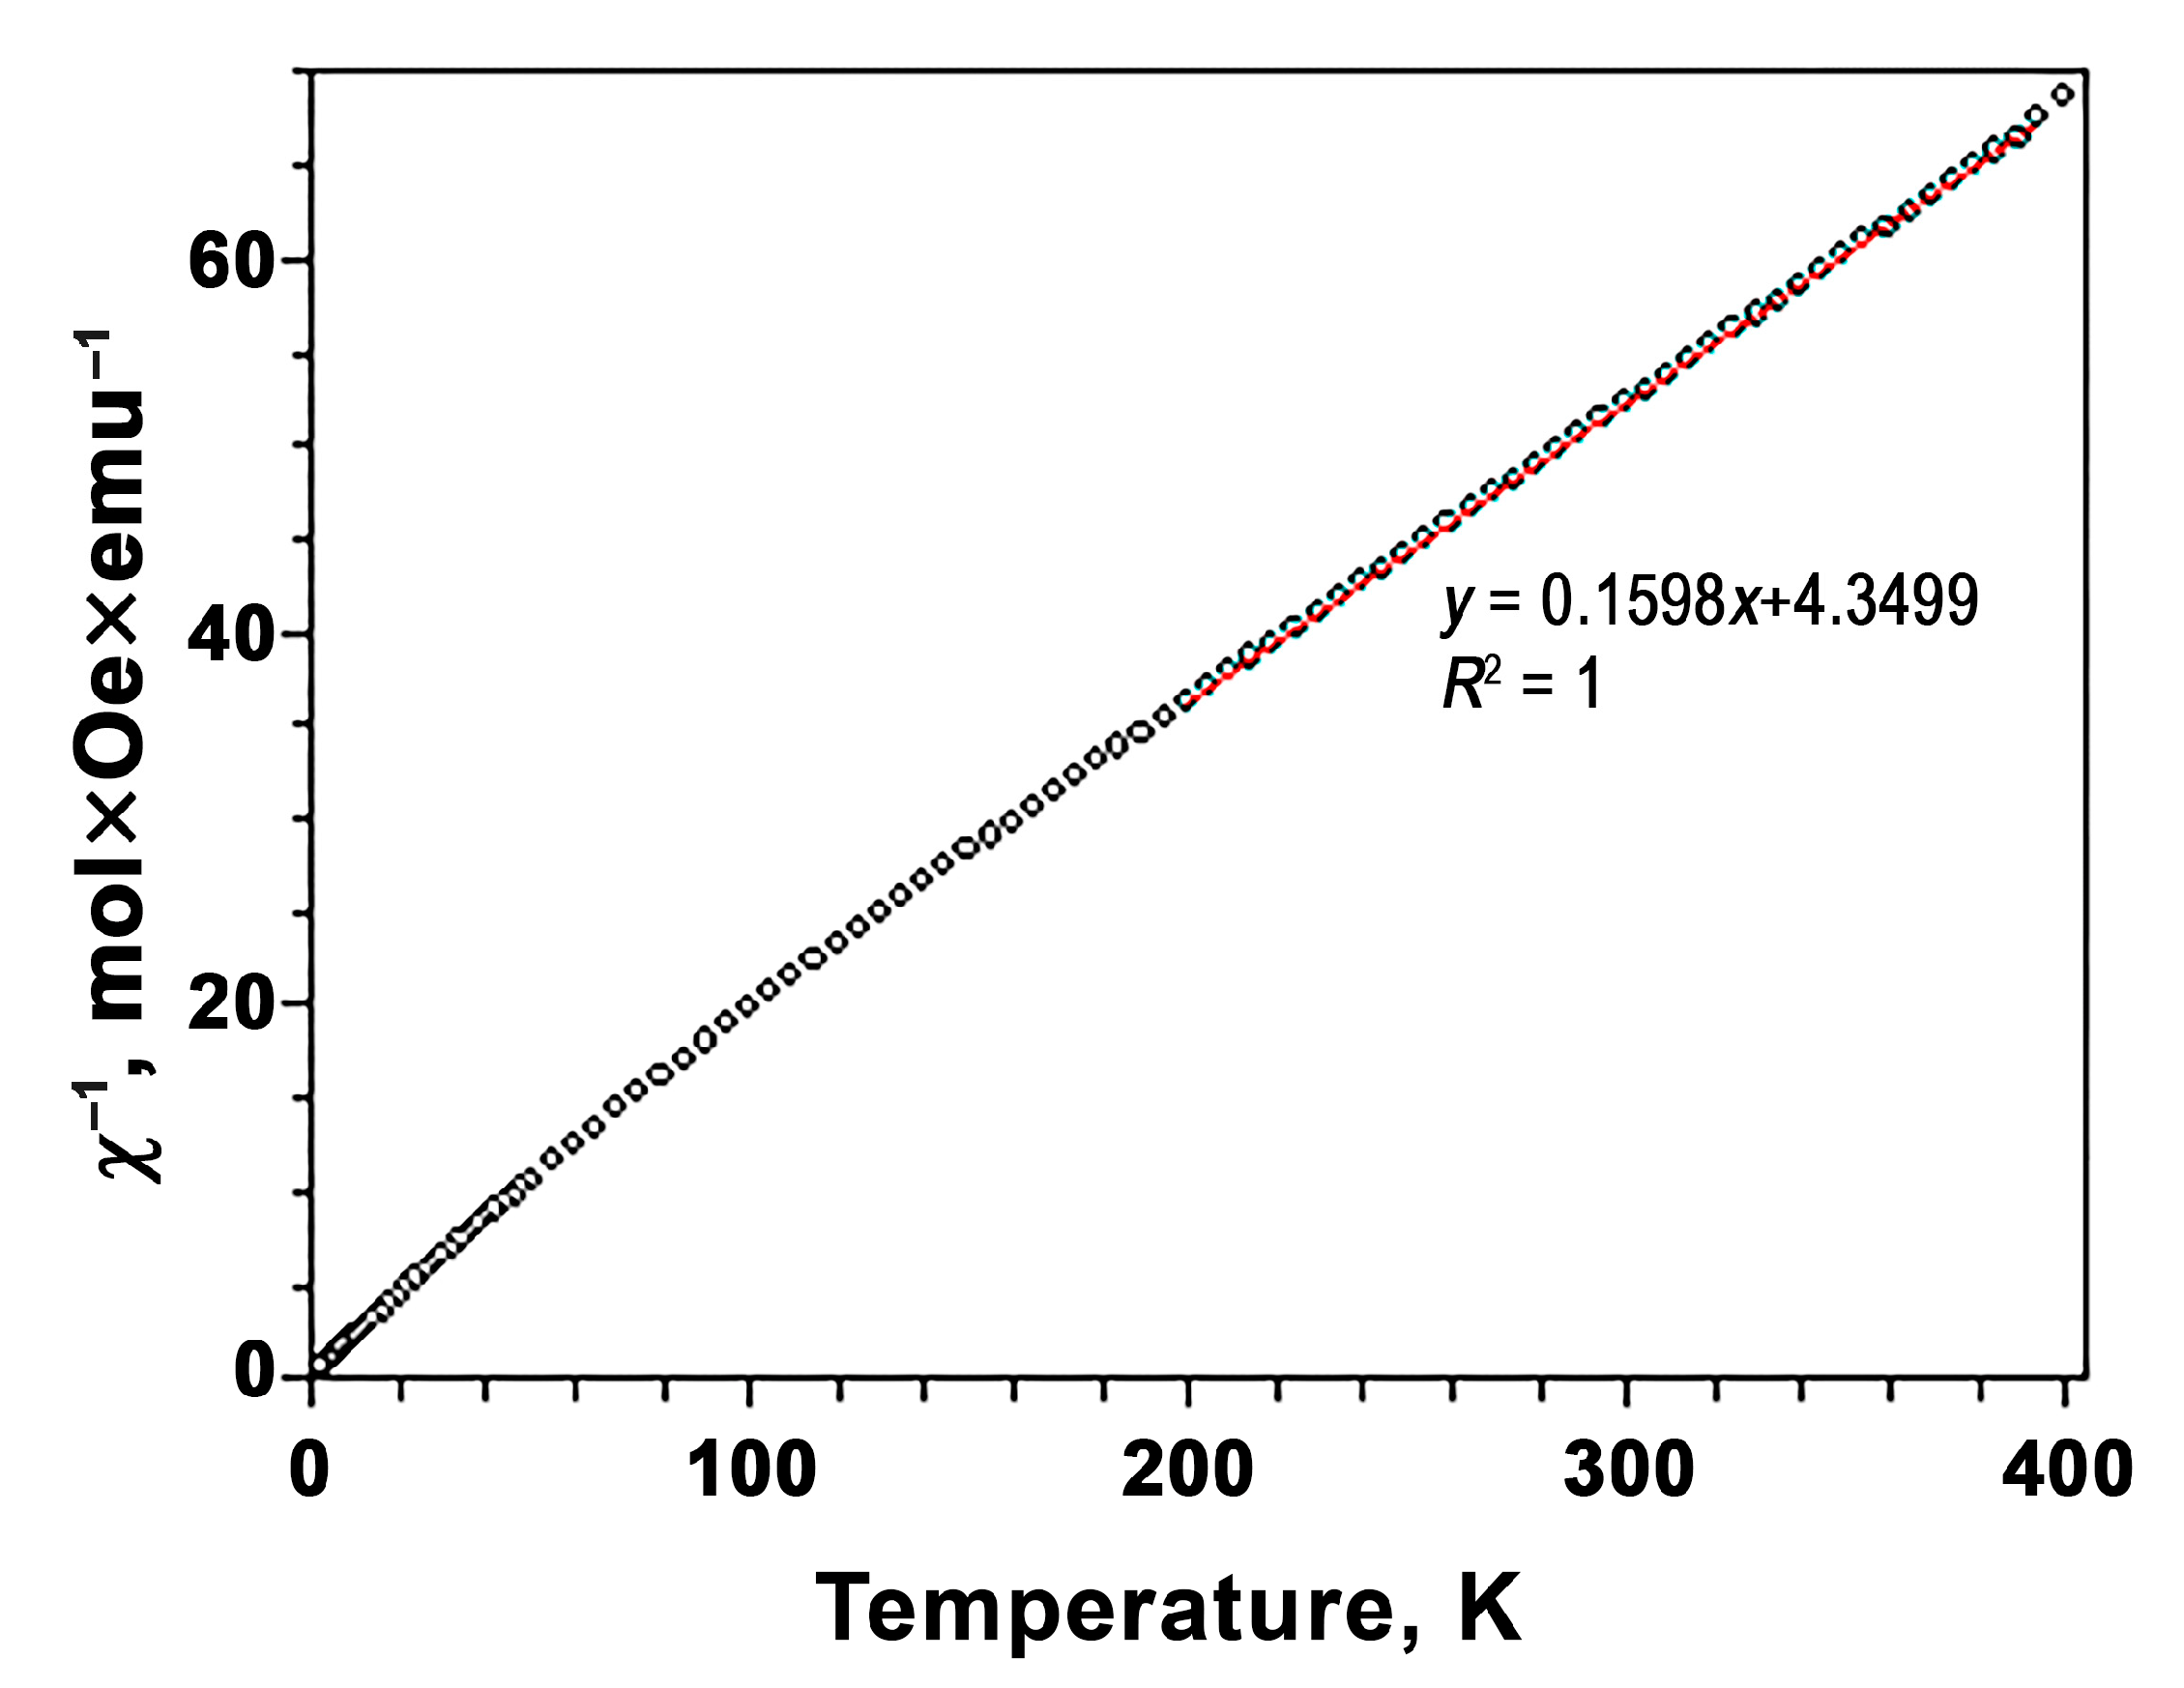
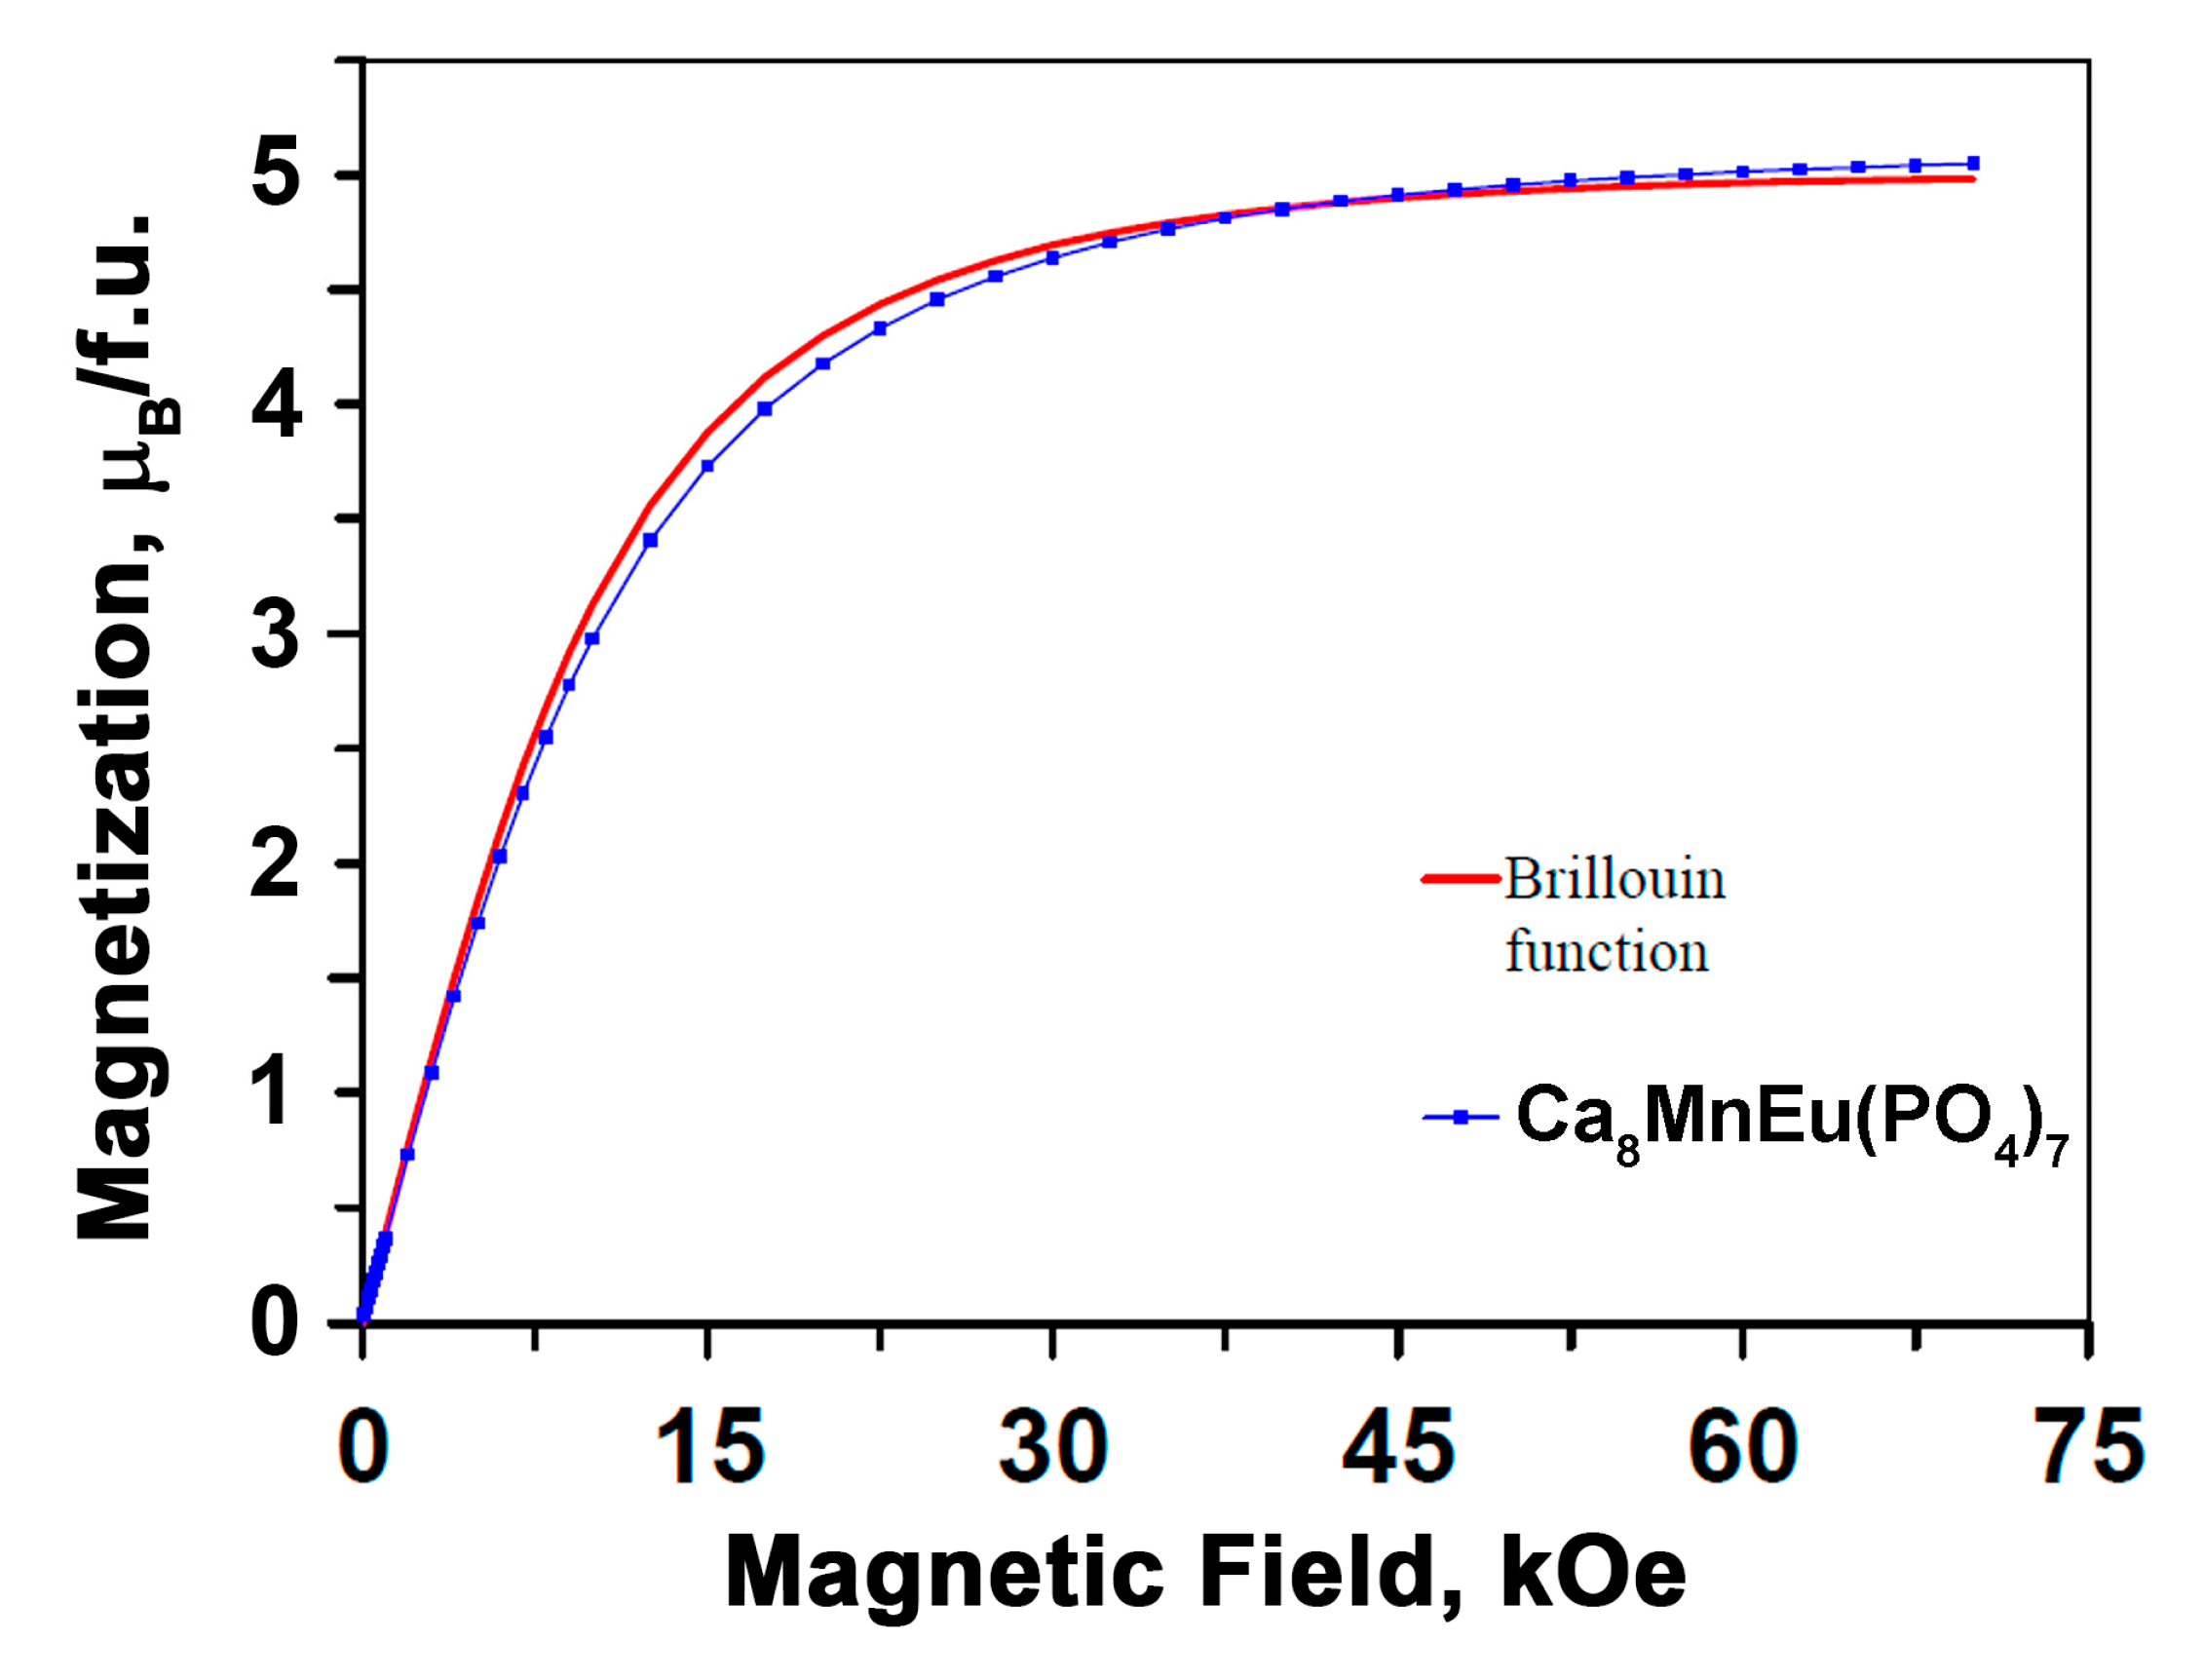
3.4. Magnetic Measurements
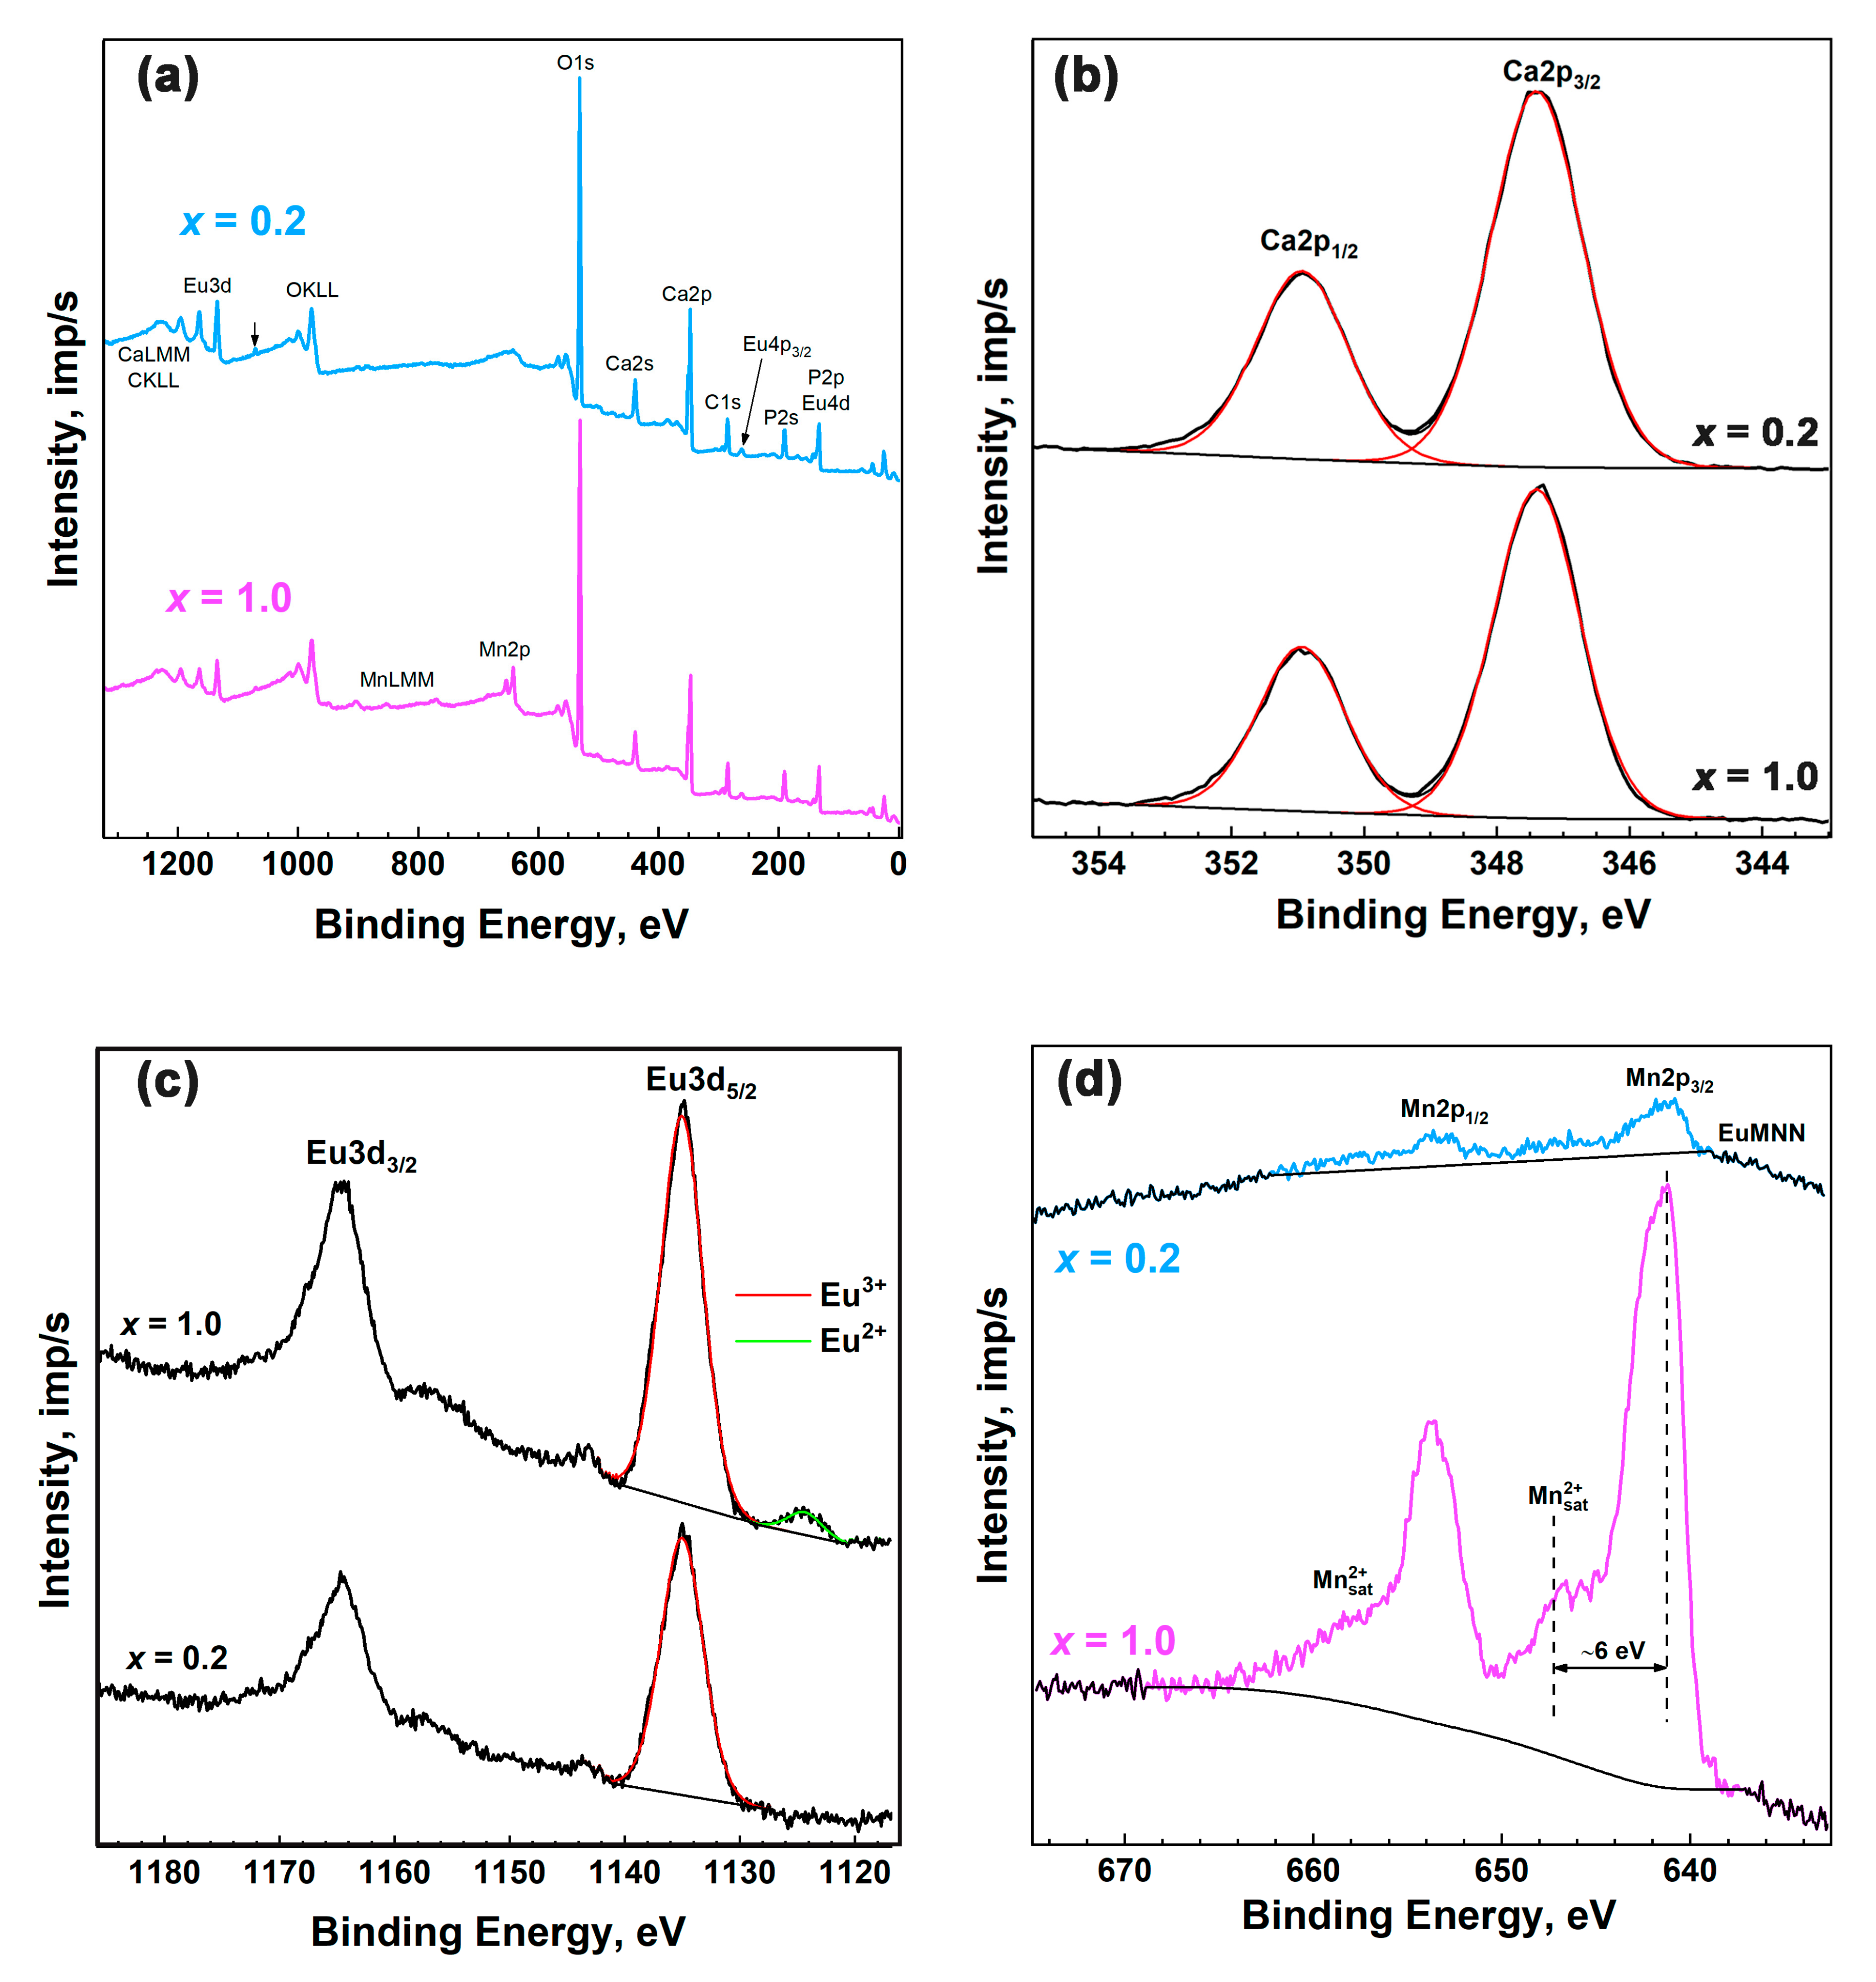
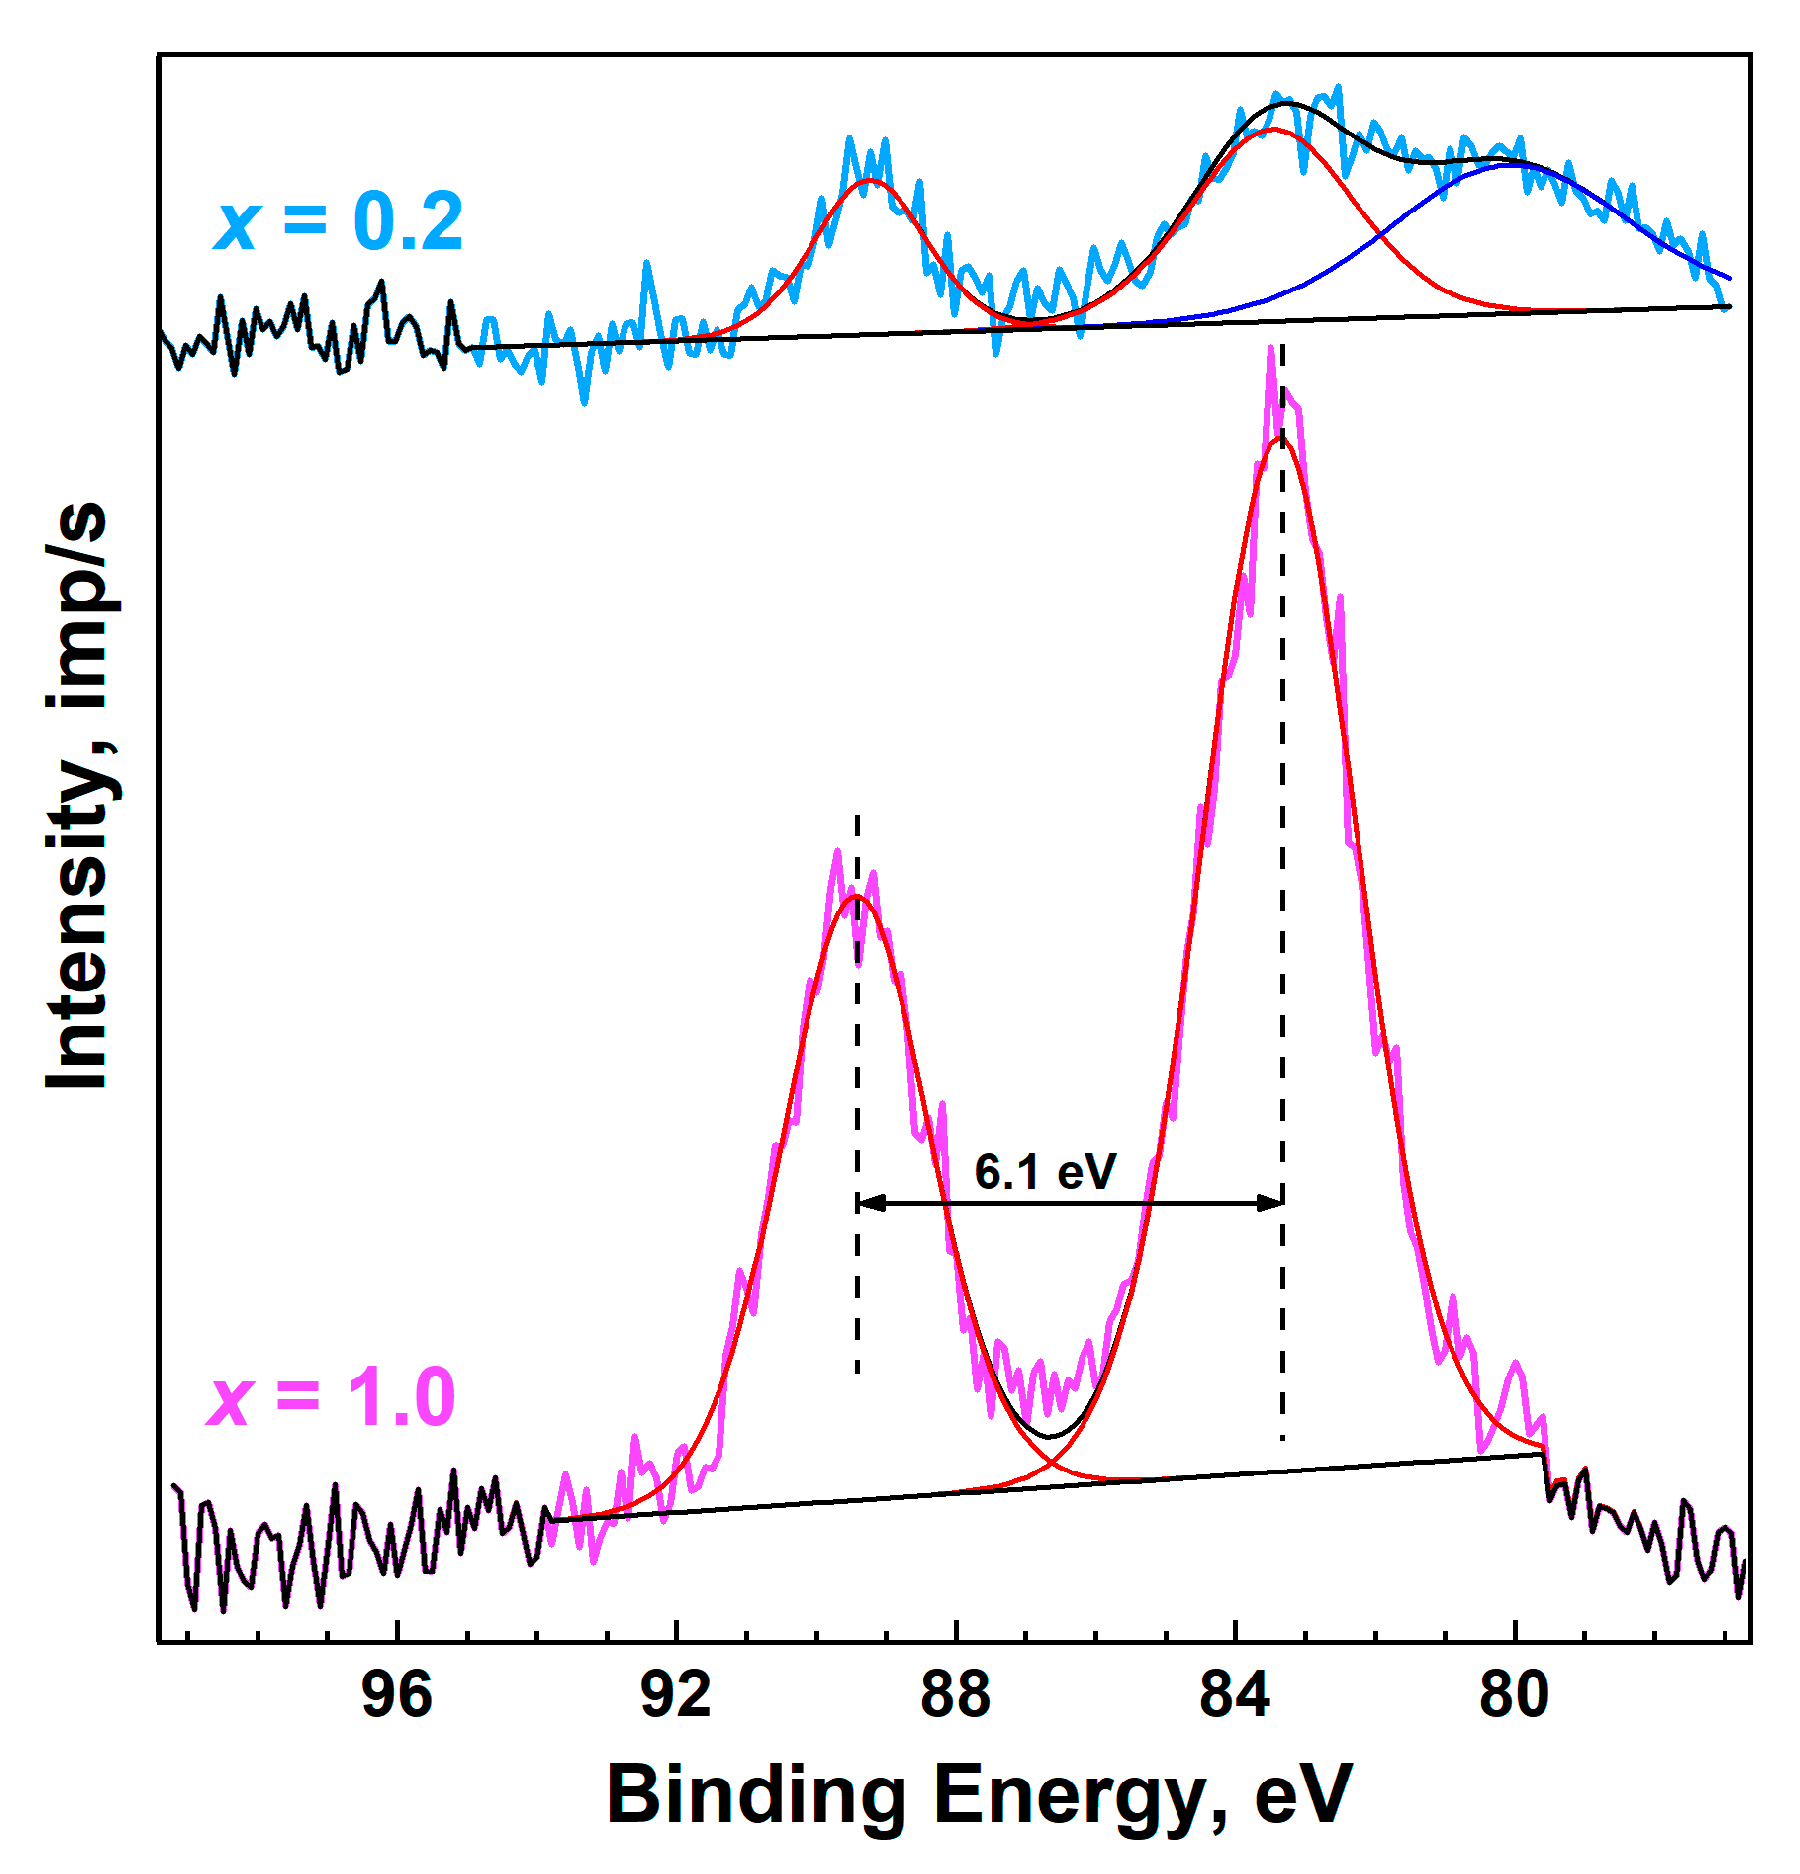
The inverse magnetic susceptibilities follow the Curie–Weiss law. Between 200 and 395 K, the inverse magnetic susceptibilities are fit by the Curie–Weiss equation:
χ(T) = μ2effN(3kB(Tθ))−1,
where μeff is an effective magnetic moment, N is Avogadro’s number, kB is Boltzmann’s constant and θ is the Curie–Weiss temperature. The fitting parameters for Ca8MnEu(PO4)7 were μeff = 7.076(2) (μB/f.u.), μcalc = 6.823 (μB/f.u.) and θ = −27.2(2) K. The μeff value was in good agreement with the theoretical value, where μcalc is calculated using 3.4μB for Eu3+ [44] (Figure 7).
The M vs. H curve of Ca8MnEu(PO4)7 followed very well the Brillouin function with g = 2, S = 5/2 and T = 2 K, as expected for a free Mn2+ cation (Figure 8). The magnetization at 2 K and 70 kOe reached 5.047 (μB/f.u.).

3.5. XPS Study

In the survey XPS scans of Ca9−xMnxEu(PO4)7 x = 0.2 and x = 1.0 samples (Figure 9a), the lines of calcium, europium, manganese, phosphorus, carbon and oxygen were observed. Ca2p XPS spectra (Figure 9b) were used for energy calibration of samples’ spectra to eliminate the charging effect.
In the Eu3d spectra of the samples (Figure 9c), the doublet of lines Eu3d5/2 and Eu3d3/2 was observed with 1135.0 and 1164.5 eV binding energies. These values are typical for the Eu3+ ion [45]. The additional Eu3d5/2 component with 1124.4 eV binding energy can be distinguished in the Ca8MnEu(PO4)7 spectrum. This component is attributed to Eu2+ [46,47,48,49]. The quantity of divalent europium in Ca8MnEu(PO4)7 is about 5% of the total europium content. At the same time, in [45,50,51], the appearance of such low-energy components is associated with shake-down satellites from the main lines of trivalent europium and indicates that the intensity of such satellites can vary depending on the specific compound of trivalent europium.
The Mn2p XPS shape of the Ca8MnEu(PO4)7 (Figure 9d) is typical of the divalent state of manganese [52]. The spectrum exhibits pronounced shake-up satellites characteristic of divalent manganese, which are shifted from the main peaks by approximately 6 eV towards higher binding energies. Similarly, in the Mn3s spectrum of Ca8MnEu(PO4)7 (Figure 10), the splitting typical for divalent manganese is observed (Table 2). The Mn2p and Mn3s spectra of Ca8.8Mn0.2Eu(PO4)7 are close in shape to Ca8MnEu(PO4)7. However, due to the significantly lower content of manganese in this sample, the spectra are observed to be noticeably noisier. The comparison of the parameters Mn2p and Mn3s spectra with reference data are listed in Table 3.

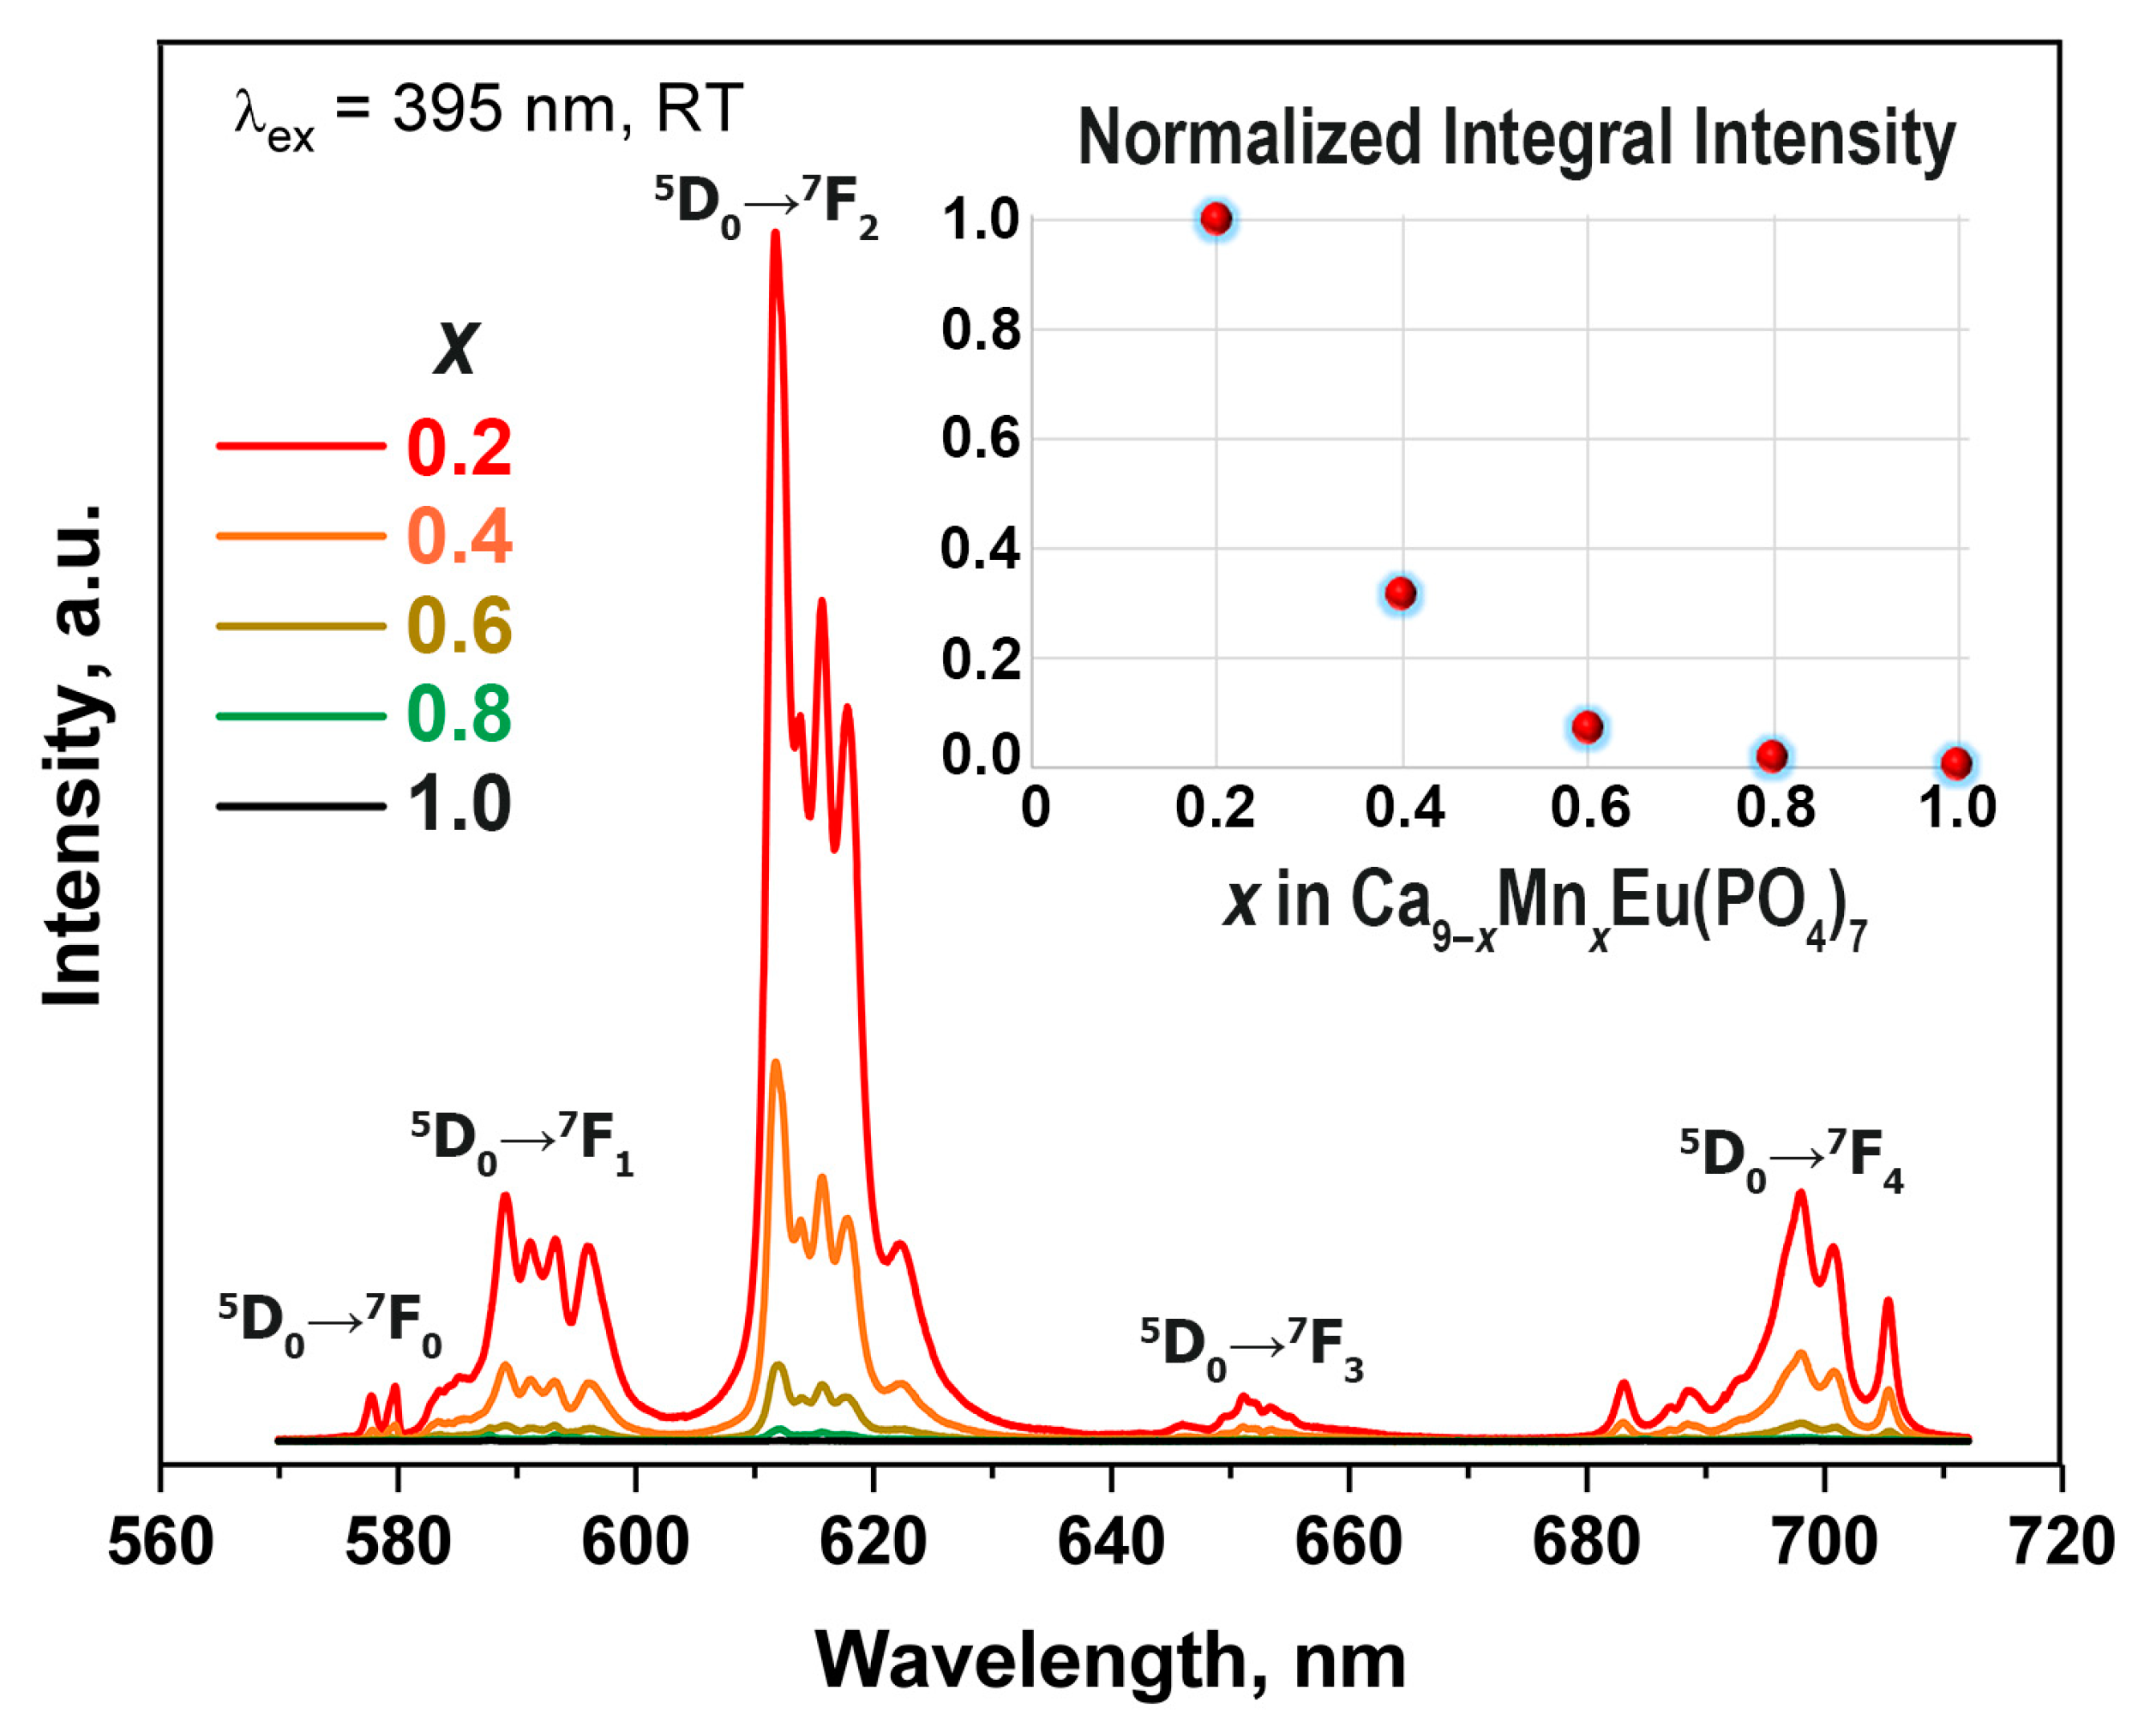
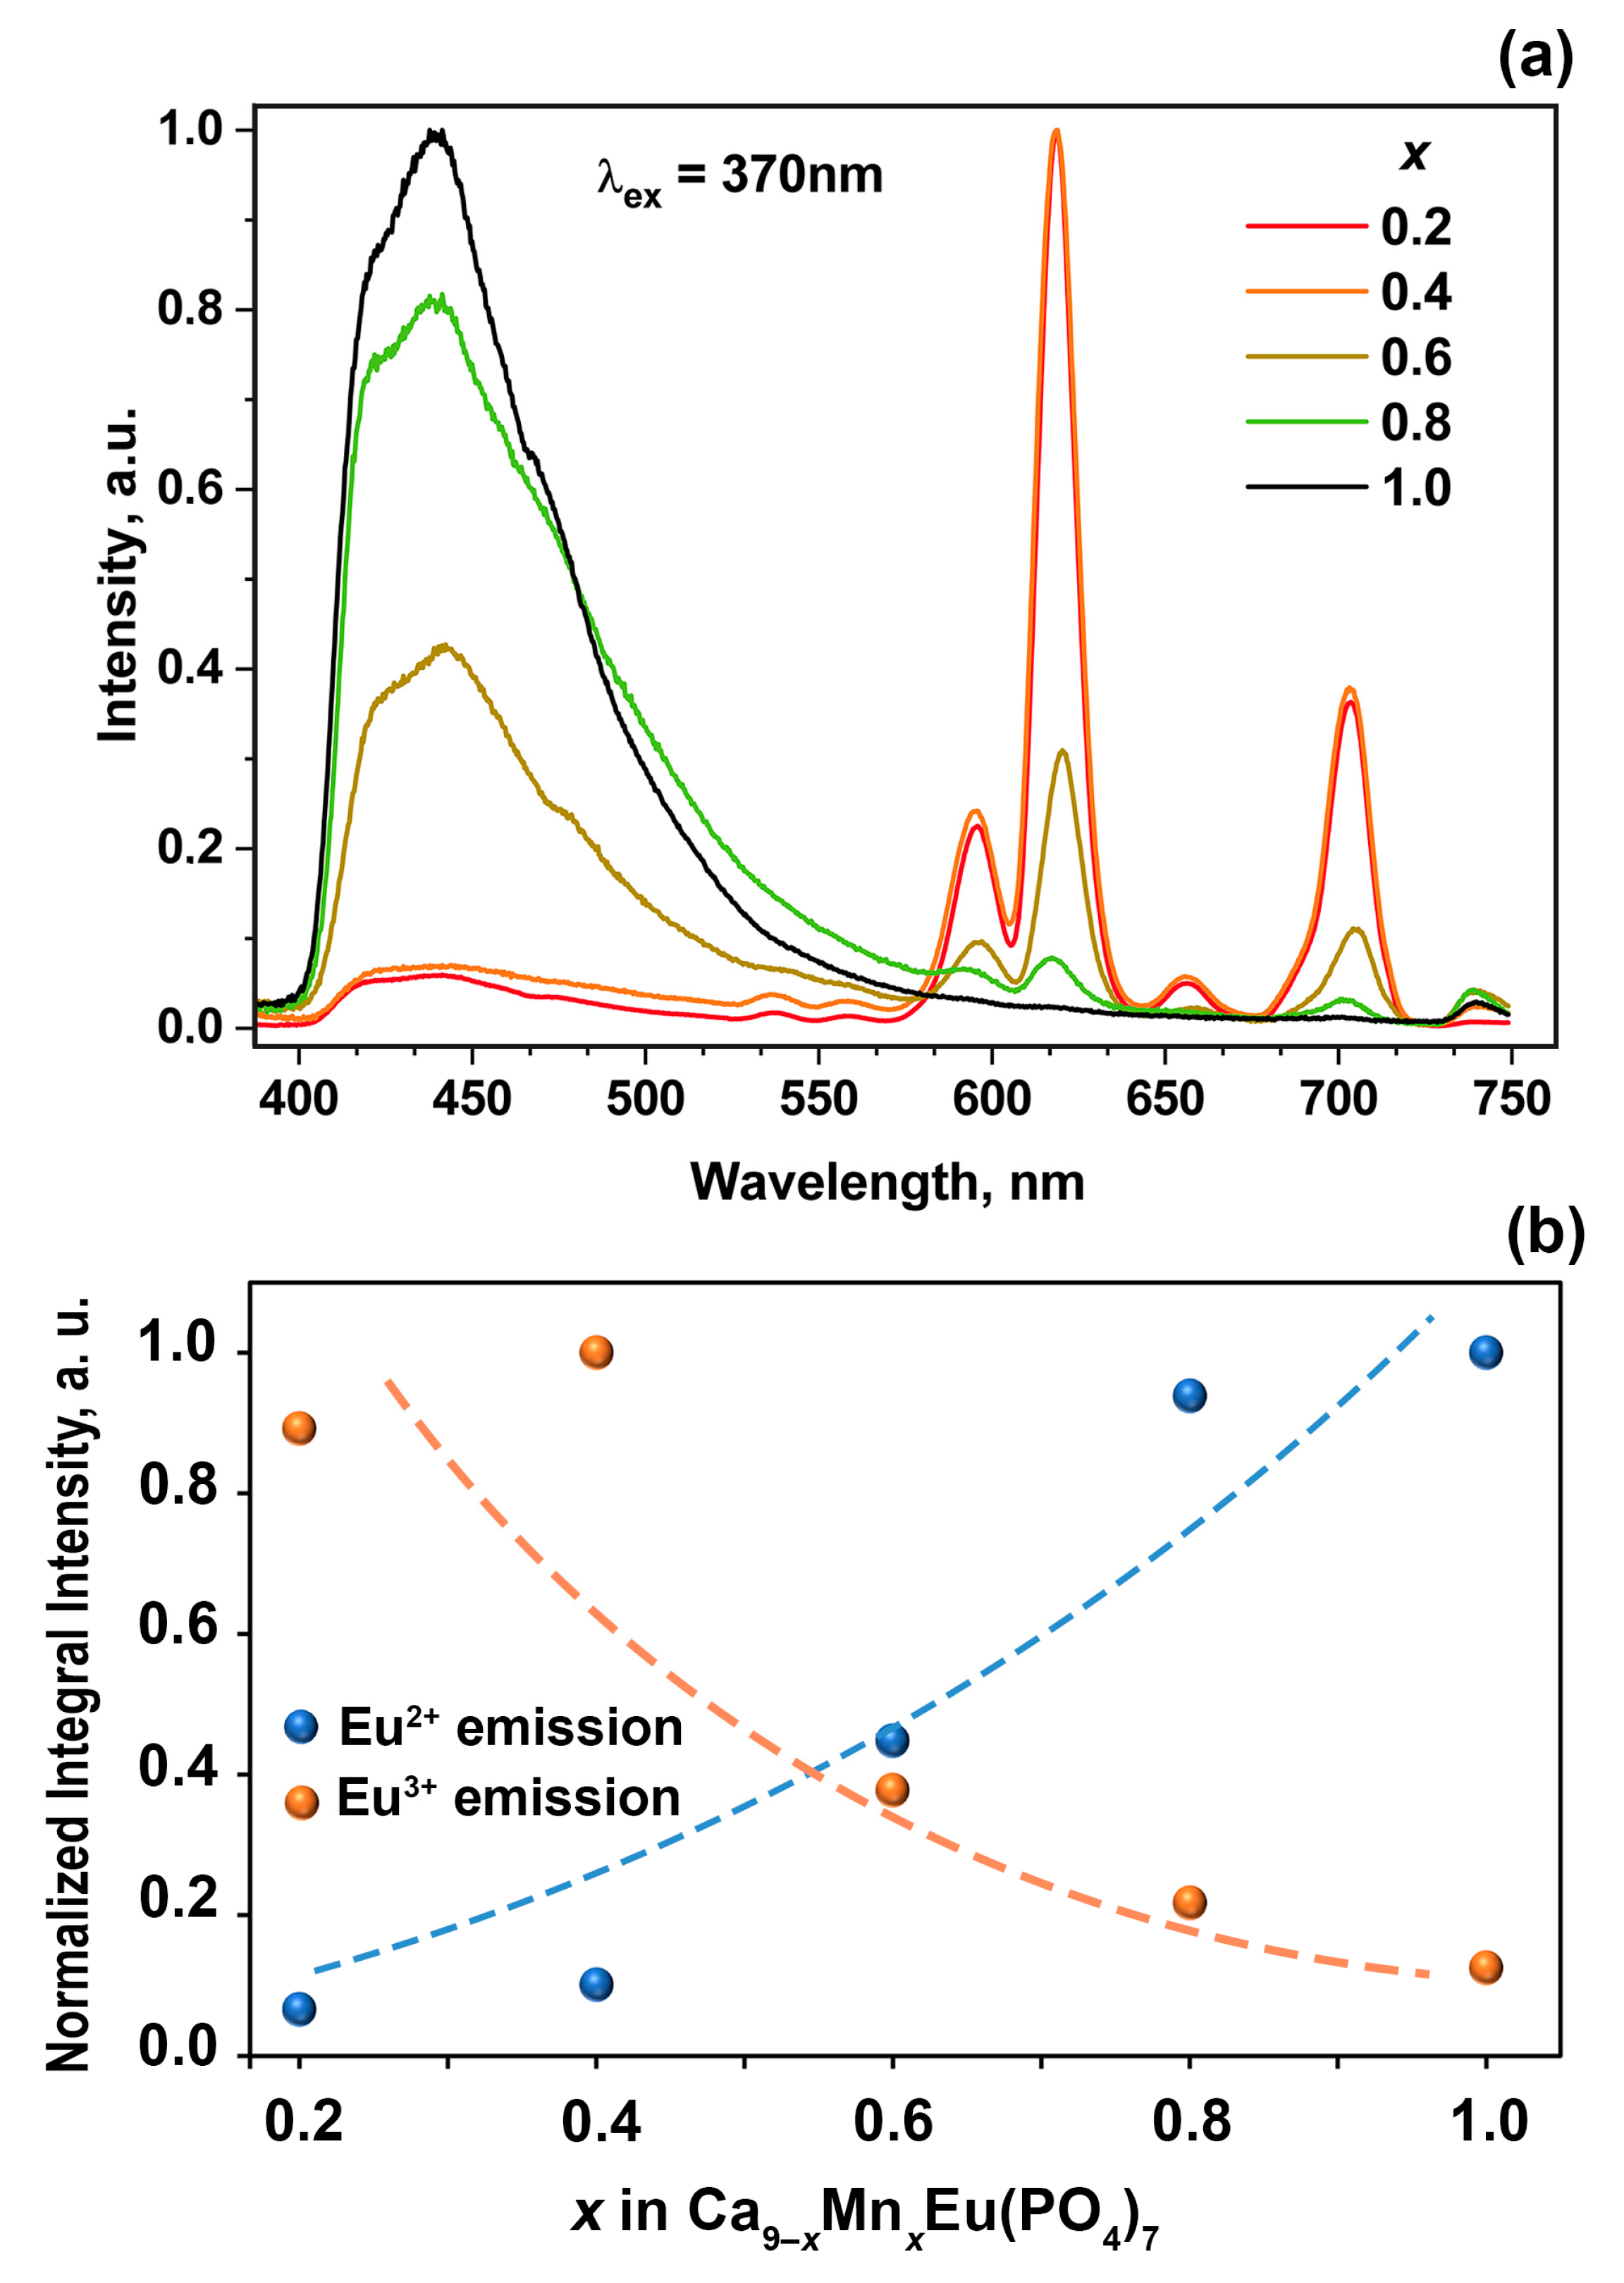
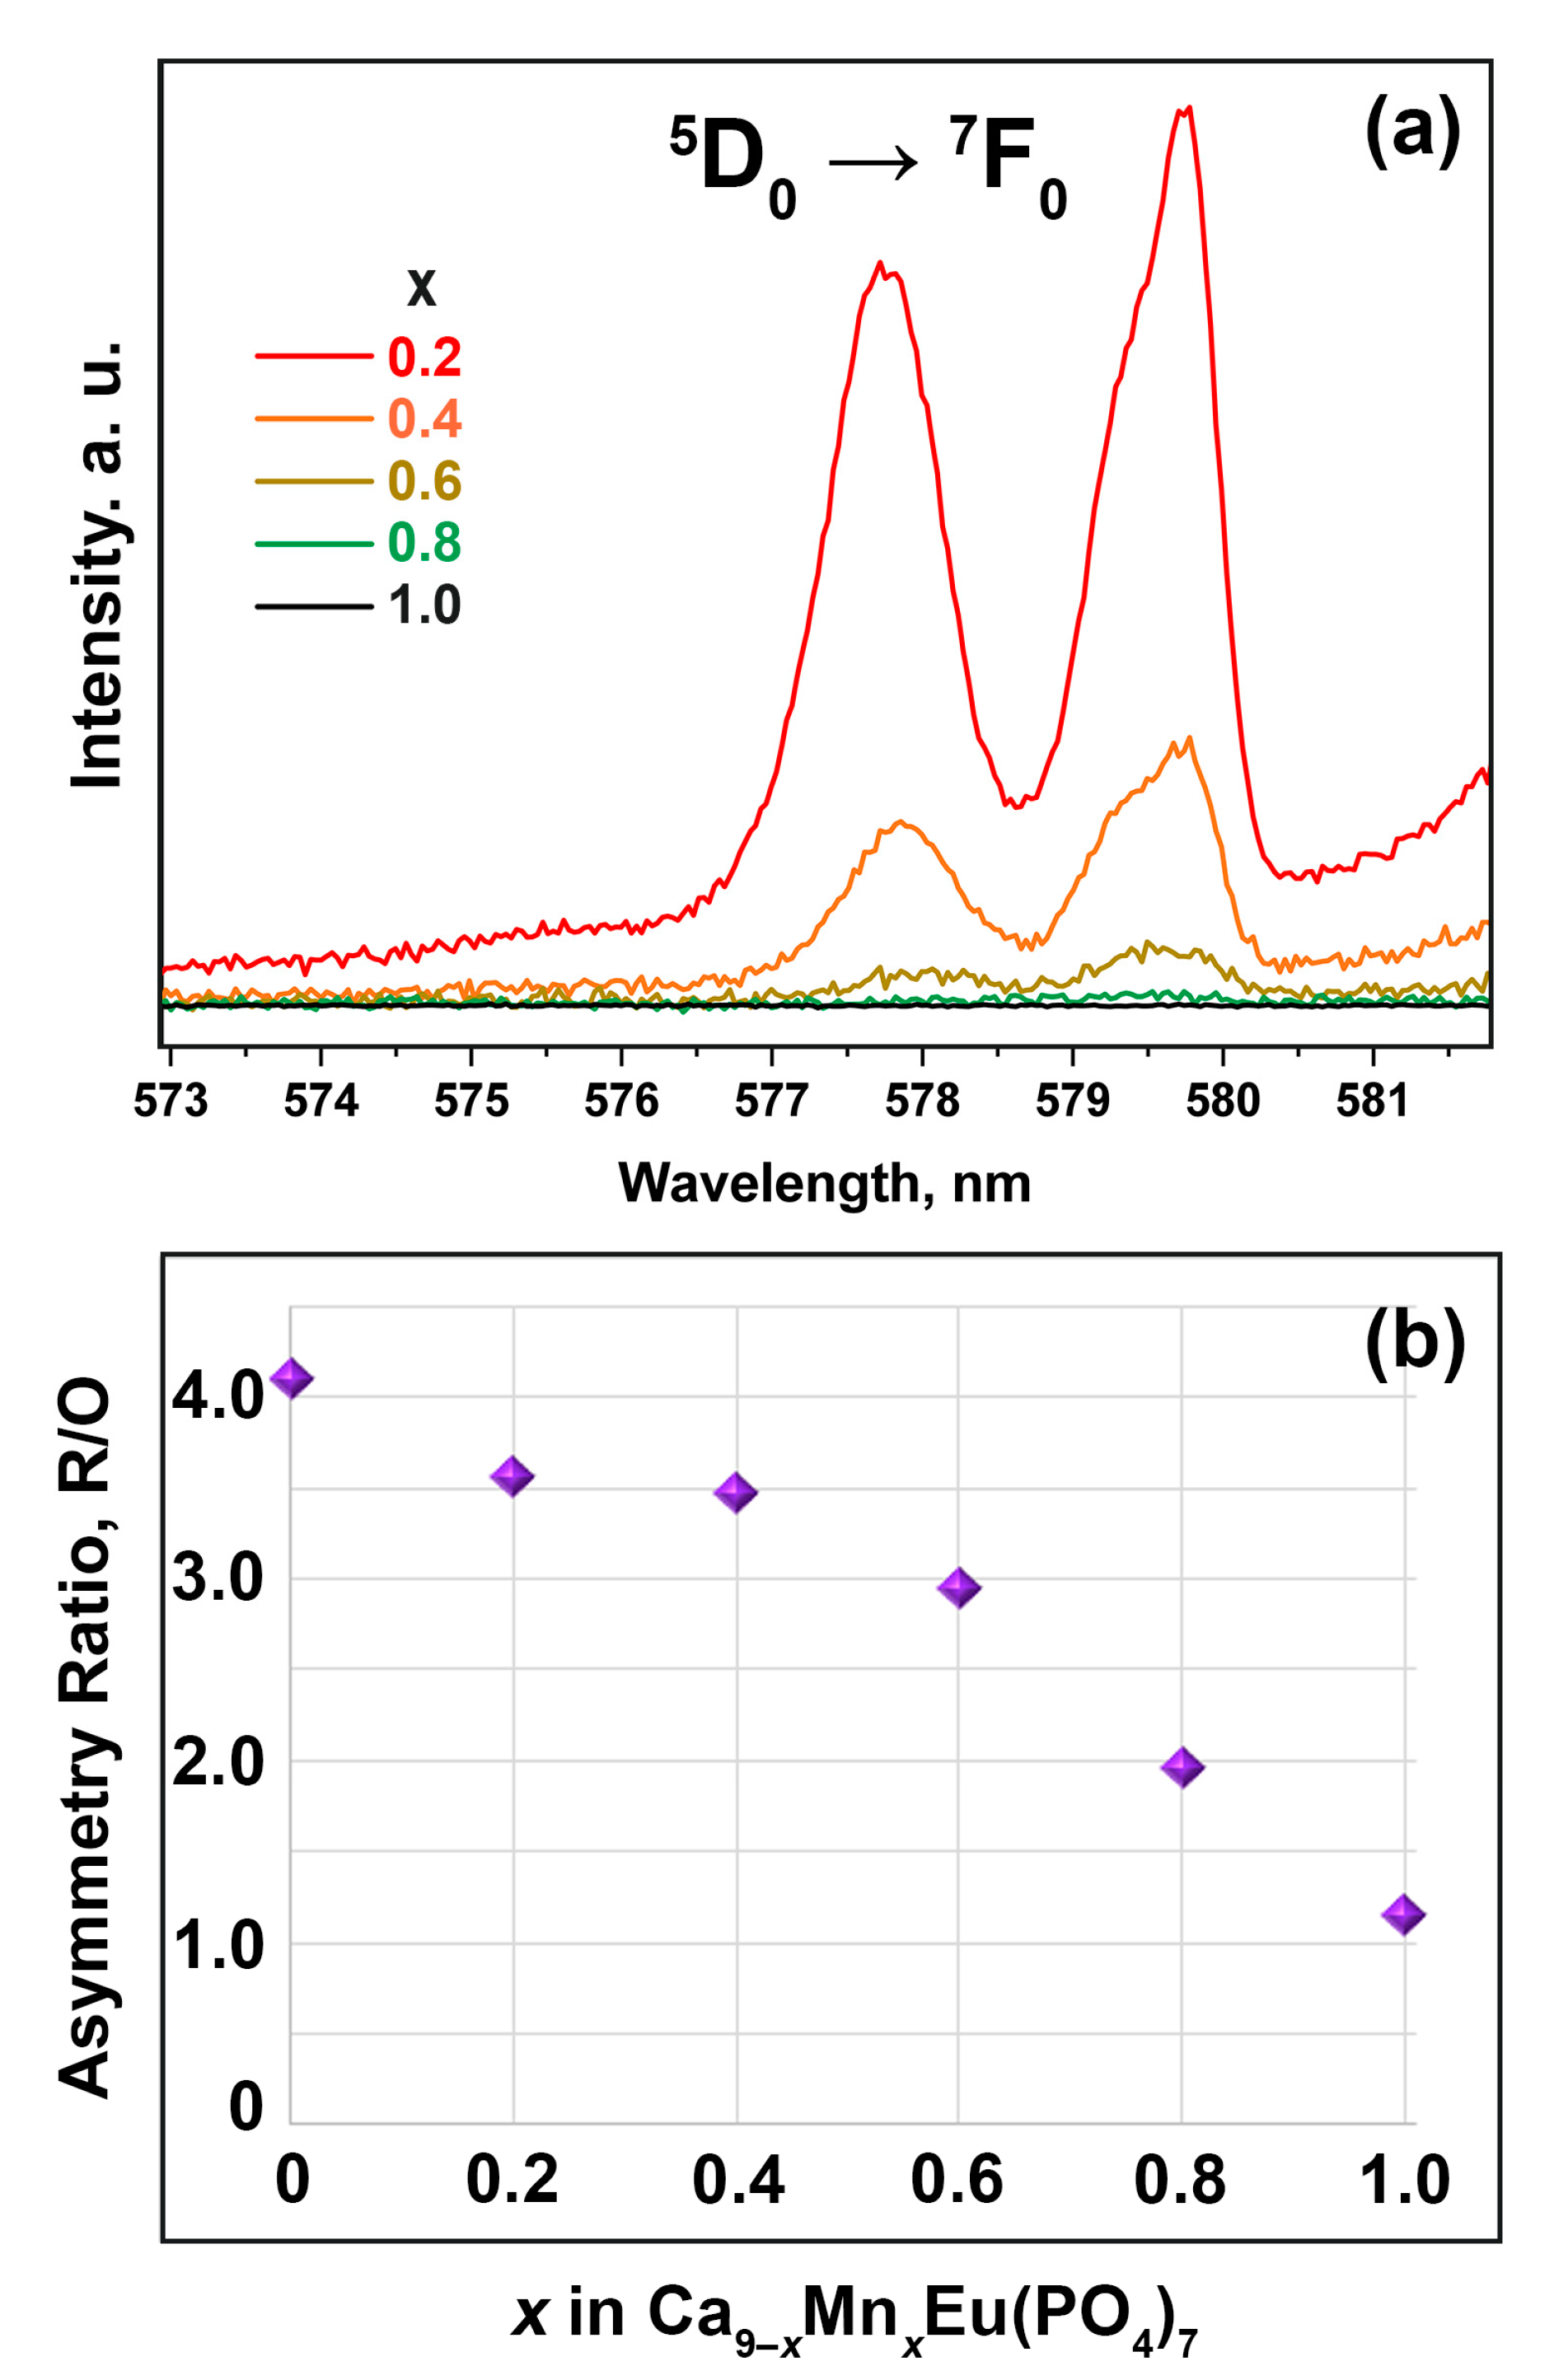
3.6. Photoluminescent Properties
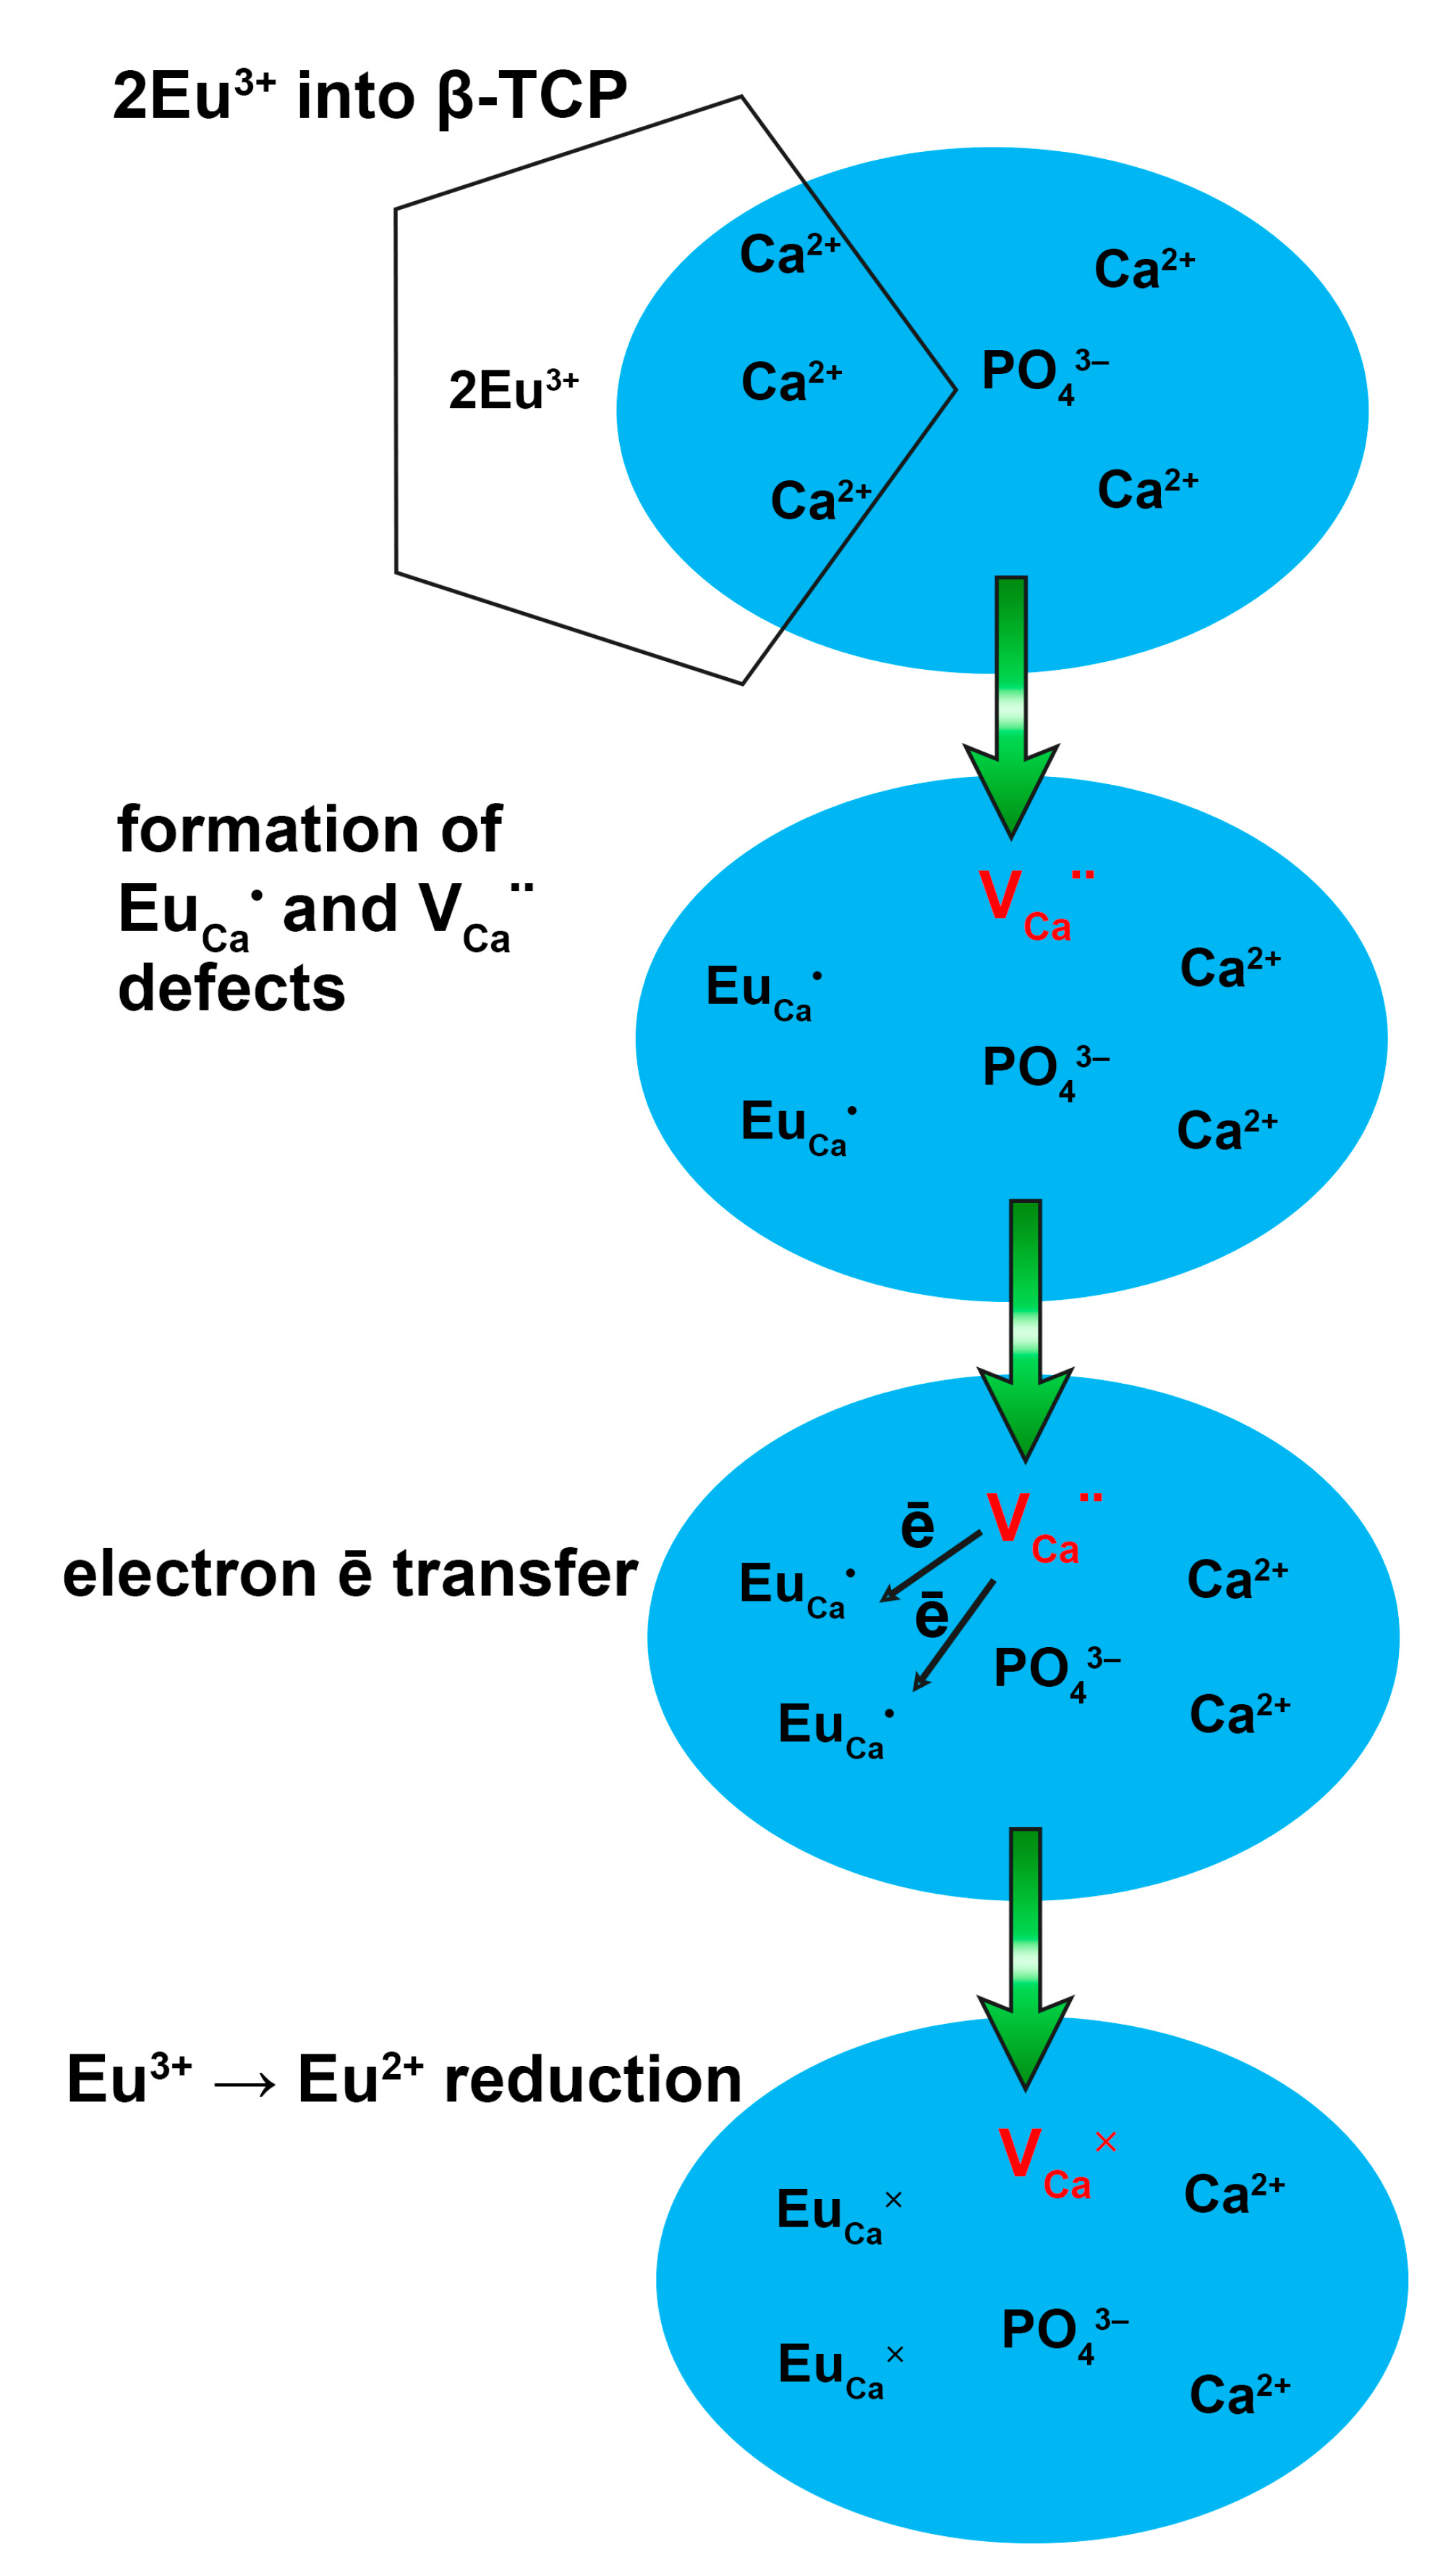
Normalized photoluminescence excitation (PLE) spectra for one of the samples are shown in Figure 11. PLE spectra monitored at 440 nm exhibit an unresolved broad band from 300 to 400 nm, peaking at 365 nm, which originated from the Eu2+ 4f-5d-allowed transition (Figure 9). At 620 nm, the PLE spectrum consists of sharp lines attributed to transitions of Eu3+ from the ground 7F0 level to excited levels. The bands are located at 318 nm (7F05H3), 362 nm (7F05D4), 378 nm (7F05GJ), 382 nm (7F05L7), 395 nm (7F05L6), 416 nm (7F05D3) and 465 nm (7F05D4), and the area at 250–300 nm is attributed to the charge transfer band (Figure 9). The other samples from the series show the same spectra, and the main difference is in the intensity of the spectra.
Figure 12 shows PL spectra of Ca8.2Mn0.8Eu(PO4)7 at different excitation wavelengths. The broad unresolved emission band from 400 to 700 nm appearing under 370 nm excitation can be attributed to the 4f65d1 → 4f7 transition of Eu2+ [57]. The band is asymmetrical and peaked at 440 nm. It arises from different crystallographic sites occupied by Eu atoms in the Ca8.2Mn0.8Eu(PO4)7 structure. Since the space group in this sample is R3c, there are M1–M3 sites occupied by Eu atoms, and several components in the Eu2+ emission can be distinguished [21]. The emission bands from Eu3+ are also observed under λex = 370 nm; however, their intensity is very low (Figure 12). The location of these lines can be determined at 591 nm (5D07F1), 615 nm (5D07F2), 652 nm (5D07F3) and 698 nm (5D07F4).
Under 395 nm, the excitation PL spectra consist of the typical bands of Eu3+ emission (Figure 12). The presence of two types of Eu emission is related to partial abnormal self-reduction in the β-TCP host in agreement with XPS data. The locations of these bands are 593 nm (5D07F1), 618 nm (5D07F2) 655 nm (5D07F3) and 701 nm (5D07F4). The insignificant shifting of the peaks from 370 nm excitation is attributed to poor resolution of Eu3+ emission at λex = 370 nm. Moreover, the transitions from higher-level 5D1 to 7F1 (535 nm) and 7F2 (555 nm) in terms of ground state can be observed (Figure 12).
PL spectra for Ca9−xMnxEu(PO4)7 solid solutions at 395 nm excitation with high resolution are shown in Figure 13. The spectra consist of transitions from 5D0 excited level to 7F0 (579 nm), 7F1 (589 nm), 7F2 (612 nm), 7F3 (652 nm) and 7F4 (697 nm) levels. The normalized integral intensity of luminescence can be observed from the inset in Figure 13. It can be seen that PL intensity dramatically decreases with Mn2+ doping. This trend contradicts with the other Ca9−xMxEu(PO4)7 (M = Zn2+, Mg2+) [29] solid solutions, where changing of the symmetry from polar R3c to nonpolar R 3 ¯ c leads to increasing of the luminescence intensity. However, such behavior of PL intensity in Eu3+ and Mn2+ co-doped isostructural Ca3(VO4)2 was observed in [58]. The quenching of Eu3+ emission by Mn2+ doping in the β-TCP host is caused by the energy transfer from Eu3+ to Mn2+; however, the effective emission from Mn2+ ions is absent (Figure 12 and Figure 13). The energy transfer can be relaxed by the 4T1 energy level of Mn2+ and then nonradiative relaxation to the 6A1 ground state of Mn2+ ions. Moreover, the emission from Mn2+ can be overlapped with the 5D07F3 transition of Eu3+. In addition, the substitution Ca2+ → Mn2+ is accompanied by the R3cR 3 ¯ c symmetry changing and the formation of defects in the structure, which may act as quenching centers of photoluminescence.
PL spectra for Ca9−xMnxEu(PO4)7 solid solutions at 370 nm excitation are shown in Figure 14a. The intensity of Eu3+ emission also decreases with rising of Mn2+ concentration. Simultaneously, the intensity of the band attributed to Eu2+ emission (at ~450 nm) increases. Such behavior can be clearly observed from the dependence of normalized integral intensity of Eu2+ and Eu3+ emission on Mn2+ concentration (Figure 14b). The position and profile of the Eu2+ band do not change with the Mn2+ concentration, which points to the invariability of the surrounding crystal field strength. Actually, since Eu and Mn atoms occupy different crystal sites in the β-TCP structure, the environment of Eu does not change. The rising of the Eu2+ band intensity (Figure 14a) can be attributed to the increasing of its concentration in the samples. This conclusion also follows from the XPS data.
To study the evolution of the β-TCP structure in Ca9−xMnxEu(PO4)7 solid solutions, the hypersensitive 5D07F0 transition was analyzed. Figure 15 shows an enlarged part of luminescence spectra with the 5D07F0 transition. For the sample with the smallest Mn2+ concentration (x = 0.2), the presence of nonsymmetrical well-separated bands can be observed (Figure 15a). These peaks reveal the nonequivalent environments of Eu atoms in the structure. The intensity of the 5D07F0 transition decreases with the rising of Mn2+ in Ca9−xMnxEu(PO4)7 and becomes indistinguishable in samples with x = 0.8 and 1.0. According to this, the analysis of the asymmetry ratio (R/O) can provide the reliable information of the structure’s evolution. R/O value can be calculated from the observed spectra using the formula [33]:
R / O = 604   nm 638   nm D 5 0 F 7 2 518   nm 604   nm D 5 0 F 7 1
The dependence of R/O on Mn2+ concentration is shown in Figure 15b. The decreasing of R/O to ~1 for Ca8MnEu(PO4)7 is attributed to the decreasing of the local distortion of the Eu environment in agreement with the structural data.

4. Discussion

The abnormal reduction Eu3+ → Eu2+ in inorganic phosphors prepared using high-temperature solid-state reactions in air was observed in numerous studies [59,60,61]. Usually, this reduction leads to the coexistence of two types of europium oxidation states. There is no information on the full reduction of Eu3+ into Eu2+ in non-reduction media, so it is difficult to control the efficiency of reduction and luminescence intensity [62]. However, it should be noted that Mn ions in our study were fully reduced from Mn4+ (MnO2 as initial phase) to the Mn2+ state, which was shown by XPS and PL measurements.
The conditions for the abnormal reduction in oxosalts phosphors obtained in air using a high-temperature solid-state reaction were proposed in [63]. These conditions meet the requirements in the β-TCP type host:
(1)
There are no oxidizing ions in the structure;
(2)
The β-TCP-type host is based on tetrahedral anion groups (PO43−);
(3)
The doped ions (Eu3+ and Mn4+) substitute the ions with lower valences (Ca2+) in the host;
(4)
The substituted cation (Ca2+) has ionic radii close to Eu2+ (see Table 4 below).
The possibilities of Eu abnormal reduction in the β-TCP-type structure can be explained by the following reasons.
The structures of phosphates with the β-TCP type are built from PO4 tetrahedra which connect all of the polyhedra by common oxygen atoms into a 3D network. These O atoms are shared by the adjacent polyhedra and tetrahedra and also lined columns A and B in the β-Ca3(PO4)2 structure. Well chemically bonded O atoms form a rigid structure. This rigid 3D structure of phosphates can shield and isolate the reduced Eu2+ and Mn2+ ions from the oxidizing attack of oxygen from the atmosphere.
Second, Mn4+ may be a luminescent center as well, and its red emission in octahedral sites is due to spin-forbidden 2Eg4A2g transitions. However, due to charge imbalance of Mn4+ and Ca2+, for such substitution, the charge compensation scheme in the anionic part is required [42]:
[ PO 4 ] 3 + 3 2 Ca 2 +     Mn 4 + + [ EO 4 ] 4 + 1 2 V ca
where VCa is a calcium vacancy, and [EO4]4− is an anion with four negative charges, such as GeO44− or SiO44−, for instance. Since no charge compensation was applied, Mn4+ could transfer to the Mn2+ state, which is more suitable for isovalent substitution. Usually, to stabilize manganese in the +2 oxidation state in the β-TCP hosts, MnCO3 is used as a raw material in a reduction atmosphere [13,14,62].
Third, there is a size mismatch between Mn4+ and Ca2+ in the β-TCP host. This mismatch can be estimated by the ionic radius percentage difference (Dr). For isomorphic substitution, this value could not exceed 30%. The calculation of the ionic radius percentage difference Dr can be made by the formula:
D r = | R h ( C N ) R d ( C N ) | R h ( C N )
where dopant Rd(CN) and host Rh(CN) ions are in the corresponding coordination numbers (CN). Dr values for different sites in the β-TCP host are given in Table 4. From the above data, Mn2+ doping into the β-TCP host is more preferable. The absence of emission from Mn4+ in the octahedra environment (red emission [9,64]) in the studied PL spectra shows its full reduction.
The reduction of Eu3+ can be explained by a charge compensation model. According to the difference in the oxidation state of Ca2+ and Eu3+ ions, two Eu3+ substitute three Ca2+ to keep the electroneutrality in the β-TCP host. Hence, one vacancy V C a with two negative charges locates in the M4 site, while two defects of the cation site E u C a with a positive charge in each could be produced:
3 Ca 2 + + 2 Eu 3 +     V C a + 2 E u C a
In this substitution, V C a acts as a donor of electrons, while E u C a is an acceptor of electrons. Thus, electrons can be transferred from the vacancy as follows during thermal treatment:
V C a     V C a × + 2 e
and the defect Eu3+ captured electrons and further reduced Eu3+ to Eu2+:
2 E u C a + 2 e     2 E u C a ×
A schematic representation of such reduction is present in Figure 16. A similar mechanism was observed in other β-TCP hosts [65] showing that Eu3+ could not be completely reduced to Eu2+, even in the reduction atmosphere due to size mismatching.
The reduction of Mn4+ can be described as follows. During thermal treatment, interstitial oxygen O i can be formed due to presence of caves along the c-axis from PO4 frameworks. In order to keep the charge balance, one Mn4+ is needed to substitute for two Ca2+ ions. So, one vacancy defect V C a with two negative charges and one M n C a · · defect with two positive charges would form. Since MnO2 is a raw material, these mechanisms can be ascribed by the following:
MnO 2     M n C a + V C a + O 0 × + O i
The cause of the full reduction of Mn4+ is the possibility of transferring negative charges both from V C a and interstitial oxygen O i during thermal treatment:
V C a     V C a × + 2 e O i     O 0 × + 2 e
So, these electrons would be released to reduce Mn4+ ions in the Ca2+ octahedral M5 site:
M n C a + 2 e     M n C a ×
Such a reduction was previously observed in oxosalt phosphors [66,67].

5. Conclusions

Phosphates Ca9−xMnxEu(PO4)7 were obtained by high-temperature solid-phase synthesis. All synthesized samples are isostructural to the β-Ca3(PO4)2. Differential scanning calorimetry and dielectric spectroscopy revealed an antiferroelectric first-order reversible phase transition. The structure of Ca8MnEu(PO4)7 was refined by the Rietveld method (sp. gr. R 3 ¯ c) using synchrotron X-ray diffraction. Ca2+ and Eu3+ ions jointly occupy two sites, M1 and M3, while Mn2+ completely occupies the M5 site. Magnetic measurements have shown that Ca8MnEu(PO4)7 contains Mn2+ and Eu3+ ions. XPS data show the coexistence of europium in +3/+2 oxidation states and manganese in the sole +2 oxidation state. The luminescence of Eu3+ and Eu2+ ions was found in Ca9−xMnxEu(PO4)7. The presence of two types of Eu2+/3+ emission is associated with the partial abnormal self-reduction of europium in the β-Ca3(PO4)2 matrix. The concentration of Eu2+ cations is low (~5% according to XPS) and does not affect the magnetic properties. The intensity of Eu3+ emission is dramatically decreased with the rising of Mn2+ in Ca9−xMnxEu(PO4)7 and attributed to the Eu3+ → Mn2+ energy transfer. The analysis of the 5D07F0 transition and R/O values points to the symmetry inhomogeneity (R3cR 3 ¯ c) in Ca9−xMnxEu(PO4)7, such as in other Ca9−xMxEu(PO4)7 solid solutions with divalent metals.

Supplementary Materials

The following supporting information can be downloaded at: https://www.mdpi.com/article/10.3390/ma16041383/s1, Table S1: Atomic coordinates, displacement parameters (Å2) and site-occupancy factors (SOFs) in the structure of Ca8MnEu(PO4)7; Table S2: Selected interatomic distances for Ca8MnEu(PO4)7.

Author Contributions

Conceptualization, D.V.D. and V.A.M.; methodology, D.A.S., A.A.B. and V.A.M.; software, E.S.Z. and M.S.M.; validation, E.V.S., N.R.K. and A.A.B.; formal analysis, E.V.S. and N.R.K.; investigation, A.A.B., E.S.Z. and N.R.K.; data curation, D.V.D.; writing—original draft preparation, E.V.S. and D.V.D.; writing—review and editing, D.V.D., N.R.K., D.A.S., V.A.M. and B.I.L.; supervision, D.V.D.; project administration, D.V.D.; funding acquisition, D.V.D. All authors have read and agreed to the published version of the manuscript.

Funding

This work was supported by RSF (project 19-77-10013-Π). The support of the Estonian Research Council (projects MOBJD613 and PUT PRG111) is also gratefully acknowledged (PL measurements). The study was supported by the Development Program of the Interdisciplinary Scientific and Educational School of Lomonosov Moscow State University’s “The future of the planet and global environmental change” and the state assignment of the Chemistry Department of Moscow State University (Agreement No. AAAA-A21-121011590086-0). The X-ray study was carried out in accordance with the state of the Russian Federation, state registration number 122011300125-2. The authors acknowledge support from the Lomonosov Moscow State University Program of Development for providing access to the XPS facility.

Institutional Review Board Statement

Not applicable.

Informed Consent Statement

Not applicable.

Data Availability Statement

Data will be available from the corresponding author on reasonable request.

Acknowledgments

The synchrotron radiation experiments were conducted at the former NIMS beamline (BL15XU) of SPring-8 with the approval of the former NIMS Synchrotron X-ray Station (proposal numbers: 2018B4502 and 2020A4501). We thank Y. Katsuya and M. Tanaka for their help at SPring-8. We thank Konstantin I. Maslakov and Serguei V. Savilov for XPS measurements.

Conflicts of Interest

The authors declare no conflict of interest.

References

  1. US Department of Energy. Solid State Lighting Research and Development Plan. Available online: https://energy.gov/sites/prod/files/2016/06/f32/ssl_rd-plan_%25%0A20jun2016_2.pdf (accessed on 4 January 2023).
  2. Lumileds Holding, B.V. Narrow Red Phosphor Technology. Available online: https://lumileds.com/company/blog/white-paper-narrow-red-phosphor-technology/ (accessed on 4 January 2023).
  3. Hu, T.; Ning, L.; Gao, Y.; Qiao, J.; Song, E.; Chen, Z.; Zhou, Y.; Wang, J.; Molokeev, M.S.; Ke, X.; et al. Glass crystallization making red phosphor for high-power warm white lighting. Light Sci. Appl. 2021, 10, 56. [Google Scholar] [CrossRef] [PubMed]
  4. Xie, R.-J.; Li, Y.Q.; Hirosaki, N.; Yamamoto, H. Nitride Phosphors and Solid-State Lighting; CRC Press: Boca Raton, FL, USA, 2016; ISBN 9780429103919. [Google Scholar]
  5. Luong, V.D.; Zhang, W.; Lee, H.-R. Preparation of Sr2Si5N8:Eu2+ for white light-emitting diodes by multi-step heat treatment. J. Alloys Compd. 2011, 509, 7525–7528. [Google Scholar] [CrossRef]
  6. Pust, P.; Weiler, V.; Hecht, C.; Tücks, A.; Wochnik, A.S.; Henß, A.-K.; Wiechert, D.; Scheu, C.; Schmidt, P.J.; Schnick, W. Narrow-band red-emitting Sr[LiAl3N4]:Eu2+ as a next-generation LED-phosphor material. Nat. Mater. 2014, 13, 891–896. [Google Scholar] [CrossRef] [PubMed]
  7. Hoerder, G.J.; Seibald, M.; Baumann, D.; Schröder, T.; Peschke, S.; Schmid, P.C.; Tyborski, T.; Pust, P.; Stoll, I.; Bergler, M.; et al. Sr[Li2Al2O2N2]:Eu2+—A high performance red phosphor to brighten the future. Nat. Commun. 2019, 10, 1824. [Google Scholar] [CrossRef]
  8. Takeda, T.; Xie, R.-J.; Suehiro, T.; Hirosaki, N. Nitride and oxynitride phosphors for white LEDs: Synthesis, new phosphor discovery, crystal structure. Prog. Solid State Chem. 2018, 51, 41–51. [Google Scholar] [CrossRef]
  9. Osborne, R.A.; Cherepy, N.J.; Seeley, Z.M.; Payne, S.A.; Drobshoff, A.D.; Srivastava, A.M.; Beers, W.W.; Cohen, W.W.; Schlagel, D.L. New red phosphor ceramic K2SiF6:Mn4+. Opt. Mater. 2020, 107, 110140. [Google Scholar] [CrossRef]
  10. Binnemans, K.; Jones, P.T. Rare Earths and the Balance Problem. J. Sustain. Metall. 2015, 1, 29–38. [Google Scholar] [CrossRef]
  11. Sinusaite, L.; Renner, A.M.; Schütz, M.B.; Antuzevics, A.; Rogulis, U.; Grigoraviciute-Puroniene, I.; Mathur, S.; Zarkov, A. Effect of Mn doping on the low-temperature synthesis of tricalcium phosphate (TCP) polymorphs. J. Eur. Ceram. Soc. 2019, 39, 3257–3263. [Google Scholar] [CrossRef]
  12. Lecointre, A.; Ait Benhamou, R.; Bessiére, A.; Wallez, G.; Elaatmani, M.; Viana, B. Red long-lasting phosphorescence (LLP) in β-TCP type Ca9.5Mn(PO4)7 compounds. Opt. Mater. 2011, 34, 376–380. [Google Scholar] [CrossRef]
  13. Wang, J.; Shang, M.; Cui, M.; Dang, P.; Liu, D.; Huang, D.; Lian, H.; Lin, J. Realizing an impressive red-emitting Ca9MnNa(PO4)7 phosphor through a dual function based on disturbing structural confinement and energy transfer. J. Mater. Chem. C 2020, 8, 285–295. [Google Scholar] [CrossRef]
  14. Liu, W.-R.; Chiu, Y.-C.; Yeh, Y.-T.; Jang, S.-M.; Chen, T.-M. Luminescence and Energy Transfer Mechanism in Ca10K(PO4)7:Eu2+,Mn2+ Phosphor. J. Electrochem. Soc. 2009, 156, J165. [Google Scholar] [CrossRef]
  15. Song, E.; Zhao, W.; Dou, X.; Zhu, Y.; Yi, S.; Min, H. Nonradiative energy transfer from Mn2+ to Eu3+ in K2CaP2O7:Mn2+,Eu3+ phosphor. J. Lumin. 2012, 132, 1462–1467. [Google Scholar] [CrossRef]
  16. Tao, P.; Liu, S.; Wong, W. Phosphorescent Manganese(II) Complexes and Their Emerging Applications. Adv. Opt. Mater. 2020, 8, 2000985. [Google Scholar] [CrossRef]
  17. Luo, J.; Zhou, W.; Fan, J.; Sun, Z.; Zhang, X. Composition modification for tuning the luminescent property in Sr19(Mg,Mn)2(PO4)14: Eu2+ phosphors. J. Lumin. 2021, 239, 118369. [Google Scholar] [CrossRef]
  18. Cao, R.; Ran, Y.; Lv, X.; Xu, L.; Wan, H.; Hu, Q.; Chen, T.; Cao, C. Tunable multicolor luminescent properties of Ca8ZnLa(PO4)7:Ce3+, Mn2+ phosphor via efficient energy transfer. J. Lumin. 2019, 214, 116549. [Google Scholar] [CrossRef]
  19. Maciejewska, K.; Poźniak, B.; Tikhomirov, M.; Kobylińska, A.; Marciniak, Ł. Synthesis, Cytotoxicity Assessment and Optical Properties Characterization of Colloidal GdPO4:Mn2+, Eu3+ for High Sensitivity Luminescent Nanothermometers Operating in the Physiological Temperature Range. Nanomaterials 2020, 10, 421. [Google Scholar] [CrossRef]
  20. Félix-Quintero, H.; Falcony, C.; Hernández, A.J.; Camarillo, G.E.; Flores, J.C.; Murrieta, S.H. Mn2+ to Eu3+ energy transfer in zinc phosphate glass. J. Lumin. 2020, 225, 117337. [Google Scholar] [CrossRef]
  21. Chen, Y.; Li, Y.; Wang, J.; Wu, M.; Wang, C. Color-Tunable Phosphor of Eu2+ and Mn2+ Codoped Ca2Sr(PO4)2 for UV Light-Emitting Diodes. J. Phys. Chem. C 2014, 118, 12494–12499. [Google Scholar] [CrossRef]
  22. Zhang, J.; Zhai, Z.; Hua, Z. Investigations on luminescence of Ca8MgGd(PO4)7:Eu2+, Mn2+, Yb3+, Er3+, Ho3+, Tm3+ phosphors. Mater. Res. Bull. 2016, 74, 34–40. [Google Scholar] [CrossRef]
  23. Belik, A.A.; Gutan, V.B.; Ivanov, L.N.; Lazoryak, B.I. Synthesis, structure, and luminescence properties of Ca9MnM(PO4)7 (M = Li, Na, K). Russ. J. Inorg. Chem. 2001, 46, 785–792. [Google Scholar]
  24. Kang, X.; Lü, W.; Wang, H.; Ling, D. Energy Transfer from Ce3+ to Tb3+/Dy3+/Mn2+ in Ca9Ga(PO4)7 Phosphors: Synthesis, Structure and Tunable Multicolor Luminescent Properties. ChemPhysChem 2019, 20, 861–867. [Google Scholar] [CrossRef] [PubMed]
  25. Guo, N.; Li, S.; Chen, J.; Li, J.; Zhao, Y.; Wang, L.; Jia, C.; Ouyang, R.; Lü, W. Photoluminescence properties of whitlockite-type Ca9MgK(PO4)7:Eu2+,Mn2+ phosphor. J. Lumin. 2016, 179, 328–333. [Google Scholar] [CrossRef]
  26. Ding, C.; Tang, W. Crystal structure, energy transfer and tunable luminescence properties of Ca8ZnCe(PO4)7:Eu2+,Mn2+ phosphor. Opt. Mater. 2018, 76, 56–62. [Google Scholar] [CrossRef]
  27. Rietveld, H.M. A profile refinement method for nuclear and magnetic structures. J. Appl. Crystallogr. 1969, 2, 65–71. [Google Scholar] [CrossRef]
  28. Petricek, V.; Dusek, M.; Palatinus, L.; Petrícek, V.; Dušek, M.; Palatinus, L. Crystallographic computing system JANA2006: General features. Z. Krist. 2014, 229, 345–352. [Google Scholar] [CrossRef]
  29. Deyneko, D.V.; Aksenov, S.M.; Nikiforov, I.; Stefanovich, S.Y.; Lazoryak, B.I. Symmetry Inhomogeneity of Ca9–xZnxEu(PO4)7 Phosphor Determined by Second-Harmonic Generation and Dielectric and Photoluminescence Spectroscopy. Cryst. Growth Des. 2020, 20, 6461–6468. [Google Scholar] [CrossRef]
  30. Nikiforov, I.V.; Deyneko, D.V.; Spassky, D.A.; Baryshnikova, O.V.; Stefanovich, S.Y.; Lazoryak, B.I. Tunable luminescence and energy transfer in Eu3+ doped Ca8MTb(PO4)7 (M = Mg, Zn, Ca) phosphors. Mater. Res. Bull. 2020, 130, 110925. [Google Scholar] [CrossRef]
  31. Deyneko, D.V.; Morozov, V.A.; Zhukovskaya, E.S.; Nikiforov, I.V.; Spassky, D.A.; Belik, A.A.; Lazoryak, B.I. The influence of second coordination-sphere interactions on the luminescent properties of β-Ca3(PO4)2-related compounds. J. Alloys Compd. 2020, 815, 152352. [Google Scholar] [CrossRef]
  32. Nikiforov, I.V.; Deyneko, D.V.; Duskaev, I.F. Structural Features of Phosphates Ca9–xMxDy(PO4)7 (M = Zn2+ or Mg2+). Phys. Solid State 2020, 62, 860–864. [Google Scholar] [CrossRef]
  33. Deyneko, D.V.; Nikiforov, I.V.; Spassky, D.A.; Dikhtyar, Y.Y.; Aksenov, S.M.; Stefanovich, S.Y.; Lazoryak, B.I. Luminescence of Eu3+ as a probe for the determination of the local site symmetry in β-Ca3(PO4)2 -related structures. CrystEngComm 2019, 21, 5235–5242. [Google Scholar] [CrossRef]
  34. Deyneko, D.V.; Morozov, V.A.; Vasin, A.A.; Aksenov, S.M.; Dikhtyar, Y.Y.; Stefanovich, S.Y.; Lazoryak, B.I. The crystal site engineering and turning of cross-relaxation in green-emitting β-Ca3(PO4)2-related phosphors. J. Lumin. 2020, 223, 117196. [Google Scholar] [CrossRef]
  35. Dikhtyar, Y.Y.; Deyneko, D.V.; Boldyrev, K.N.; Baryshnikova, O.V.; Belik, A.A.; Morozov, V.A.; Lazoryak, B.I. Crystal structure, dielectric and optical properties of β-Ca3(PO4)2-type phosphates Ca9-xZnxLa(PO4)7:Ho3+. J. Lumin. 2021, 236, 118083. [Google Scholar] [CrossRef]
  36. Dikhtyar, Y.Y.; Deyneko, D.V.; Spassk, D.A.; Lazoryak, B.I.; Stefanovich, S.Y. A novel high color purity blue-emitting Tm3+-doped β-Ca3(PO4)2-type phosphor for WLED application. Optik 2020, 227, 166027. [Google Scholar] [CrossRef]
  37. Belik, A.A.; Morozov, V.A.; Deyneko, D.V.; Savon, A.E.; Baryshnikova, O.V.; Zhukovskaya, E.S.; Dorbakov, N.G.; Katsuya, Y.; Tanaka, M.; Stefanovich, S.Y.; et al. Antiferroelectric properties and site occupations of R3+ cations in Ca8MgR(PO4)7 luminescent host materials. J. Alloys Compd. 2017, 699, 928–937. [Google Scholar] [CrossRef]
  38. Lazoryak, B.I.; Zhukovskaya, E.S.; Baryshnikova, O.V.; Belik, A.A.; Leonidova, O.N.; Deyneko, D.V.; Savon, A.E.; Dorbakov, N.G.; Morozov, V.A. Luminescence, structure and antiferroelectric-type phase transition in Ca8ZnEu(PO4)7. Mater. Res. Bull. 2018, 104, 20–26. [Google Scholar] [CrossRef]
  39. Dikhtyar, Y.Y.; Spassky, D.A.; Morozov, V.A.; Deyneko, D.V.; Belik, A.A.; Baryshnikova, O.V.; Nikiforov, I.V.; Lazoryak, B.I. Site occupancy, luminescence and dielectric properties of β-Ca3(PO4)2-type Ca8ZnLn(PO4)7 host materials. J. Alloys Compd. 2022, 908, 164521. [Google Scholar] [CrossRef]
  40. Stefanovich, S.Y.; Petrova, D.A.; Morozov, V.A.; Fortalnova, E.A.; Belov, D.A.; Deyneko, D.V.; Lazoryak, B.I. Enhanced nonlinear optical activity and Ca2+-conductivity in Ca10.5-xPbx(VO4)7 ferroelectrics. J. Alloys Compd. 2018, 735, 1826–1837. [Google Scholar]
  41. Altomare, A.; Rizzi, R.; Rossi, M.; El Khouri, A.; Elaatmani, M.; Paterlini, V.; Della Ventura, G.; Capitelli, F. New Ca2.90(Me2+)0.10(PO4)2 β-tricalcium Phosphates with Me2+ = Mn, Ni, Cu: Synthesis, Crystal-Chemistry, and Luminescence Properties. Crystals 2019, 9, 288. [Google Scholar] [CrossRef]
  42. Deyneko, D.V.; Nikiforov, I.V.; Lazoryak, B.I.; Aksenov, S.M. The role of anionic heterovalent [PO4]3− → [GeO4]4− substitution on the luminescence properties of inorganic phosphors with the β-Ca3(PO4)2-type structure: New data based on accurate crystal structure refinement. Dalt. Trans. 2022, 51, 655–663. [Google Scholar] [CrossRef]
  43. Deyneko, D.V.; Titkov, V.V.; Fedyunin, F.D.; Spassky, D.A.; Volkov, S.N.; Borovikova, E.Y.; Lazoryak, B.I.; Aksenov, S.M. «Ellestadite»-type anionic [PO4]3− → [SO4]2− substitutions in β-Ca3(PO4)2 type compounds: A new route to design the inorganic phosphors. Ceram. Int. 2022, 48, 24012–24020. [Google Scholar] [CrossRef]
  44. Kittel, C. Introduction to Solid State Physics, 8th ed.; John Wiley and Sons: New York, NY, USA, 2005. [Google Scholar]
  45. Baltrus, J.P.; Keller, M.J. Rare earth oxides Eu2O3 and Nd2O3 analyzed by XPS. Surf. Sci. Spectra 2019, 26, 014001. [Google Scholar] [CrossRef]
  46. Kumar, S.; Prakash, R.; Choudhary, R.J.; Phase, D.M. Structural, XPS and magnetic studies of pulsed laser deposited Fe doped Eu2O3 thin film. Mater. Res. Bull. 2015, 70, 392–396. [Google Scholar] [CrossRef]
  47. Shin, Y.C.; Leem, S.J.; Kim, C.M.; Kim, S.J.; Sung, Y.M.; Hahn, C.K.; Baek, J.H.; Kim, T.G. Deposition of Europium Oxide on Si and its optical properties depending on thermal annealing conditions. J. Electroceramics 2009, 23, 326–330. [Google Scholar] [CrossRef]
  48. Vercaemst, R.; Poelman, D.; Fiermans, L.; Van Meirhaeghe, R.L.; Laflère, W.H.; Cardon, F. A detailed XPS study of the rare earth compounds EuS and EuF3. J. Electron Spectros. Relat. Phenom. 1995, 74, 45–56. [Google Scholar] [CrossRef]
  49. Schneider, W.-D.; Laubschat, C.; Nowik, I.; Kaindl, G. Shake-up excitations and core-hole screening in Eu systems. Phys. Rev. B 1981, 24, 5422–5425. [Google Scholar] [CrossRef]
  50. Kang, J.-G.; Jung, Y.; Min, B.-K.; Sohn, Y. Full characterization of Eu(OH)3 and Eu2O3 nanorods. Appl. Surf. Sci. 2014, 314, 158–165. [Google Scholar] [CrossRef]
  51. Mercier, F.; Alliot, C.; Bion, L.; Thromat, N.; Toulhoat, P. XPS study of Eu(III) coordination compounds: Core levels binding energies in solid mixed-oxo-compounds EumXxOy. J. Electron Spectros. Relat. Phenom. 2006, 150, 21–26. [Google Scholar] [CrossRef]
  52. Ilton, E.S.; Post, J.E.; Heaney, P.J.; Ling, F.T.; Kerisit, S.N. XPS determination of Mn oxidation states in Mn (hydr)oxides. Appl. Surf. Sci. 2016, 366, 475–485. [Google Scholar] [CrossRef]
  53. Langell, M.; Hutchings, C.W.; Carson, G.A.; Nassir, M.H. High resolution electron energy loss spectroscopy of MnO(100) and oxidized MnO(100). J. Vac. Sci. Technol. A 1996, 14, 1656–1661. [Google Scholar] [CrossRef]
  54. Soares, E.A.; Paniago, R.; de Carvalho, V.E.; Lopes, E.L.; Abreu, G.J.P.; Pfannes, H.-D. Quantitative low-energy electron diffraction analysis of MnO(00) films grown on Ag(100). Phys. Rev. B 2006, 73, 035419. [Google Scholar] [CrossRef]
  55. Stranick, M.A. Mn2O3 by XPS. Surf. Sci. Spectra 1999, 6, 39–46. [Google Scholar] [CrossRef]
  56. Stranick, M.A. MnO2 by XPS. Surf. Sci. Spectra 1999, 6, 31–38. [Google Scholar] [CrossRef]
  57. Zhao, M.; Zhang, Q.; Xia, Z. Structural Engineering of Eu2+ -Doped Silicates Phosphors for LED Applications. Acc. Mater. Res. 2020, 1, 137–145. [Google Scholar] [CrossRef]
  58. Zhang, H.; Lü, M.; Xiu, Z.; Wang, S.; Zhou, G.; Zhou, Y.; Wang, S.; Qiu, Z.; Zhang, A. Synthesis and photoluminescence properties of a new red emitting phosphor: Ca3(VO4)2:Eu3+; Mn2+. Mater. Res. Bull. 2007, 42, 1145–1152. [Google Scholar] [CrossRef]
  59. Dai, W.B. Mechanism of the reduction and energy transfer between Eu2+ and Eu3+ in Eu-doped CaAl2Si2O8 materials prepared in air. J. Mater. Chem. C 2014, 2, 3951–3959. [Google Scholar] [CrossRef]
  60. Chen, J.; Liang, Y.; Zhu, Y.; Liu, S.; Li, H.; Lei, W. Abnormal reduction of Eu3+ to Eu2+ in Sr5(PO4)3Cl:Eu phosphor and its enhanced red emission by the charge compensation. J. Lumin. 2019, 214, 116569. [Google Scholar] [CrossRef]
  61. Li, H.; Wang, Y. Effect of Oxygen Vacancies on the Reduction of Eu3+ in Mg3Ca3(PO4)4 in Air Atmosphere. Inorg. Chem. 2017, 56, 10396–10403. [Google Scholar] [CrossRef]
  62. Dang, P.; Liu, D.; Li, G.; Liang, S.; Lian, H.; Shang, M.; Lin, J. Mixing the valence control of Eu2+/Eu3+ and energy transfer construction of Eu2+/Mn2+ in the solid solution (1 − x)Ca3(PO4)2 − x Ca9Y(PO4)7 for multichannel photoluminescence tuning. Inorg. Chem. Front. 2019, 6, 2837–2849. [Google Scholar] [CrossRef]
  63. Peng, M.; Pei, Z.; Hong, G.; Su, Q. The reduction of Eu3+ to Eu2+ in BaMgSiO4:Eu prepared in air and the luminescence of BaMgSiO4:Eu2+ phosphor. J. Mater. Chem. 2003, 13, 1202–1205. [Google Scholar] [CrossRef]
  64. Xu, W.; Chen, D.; Yuan, S.; Zhou, Y.; Li, S. Tuning excitation and emission of Mn4+ emitting center in Y3Al5O12 by cation substitution. Chem. Eng. J. 2017, 317, 854–861. [Google Scholar] [CrossRef]
  65. Yu, H.; Ruan, F.; Chen, L.; Deng, D. Dual-emitting Eu2+/Eu3+ co-doped Ca9Zn1.5(PO4)7 phosphor for self-calibrated optical thermometry. Opt. Mater. 2020, 100, 109678. [Google Scholar] [CrossRef]
  66. Lu, J.; Pan, Y.; Wang, J.; Chen, X.; Huang, S.; Liu, G. Reduction of Mn4+ to Mn2+ in CaAl12O 19 by co-doping charge compensators to obtain tunable photoluminescence. RSC Adv. 2013, 3, 4510–4513. [Google Scholar] [CrossRef]
  67. Hu, J.Q.; Song, E.H.; Ye, S.; Zhou, B.; Zhang, Q.Y. Anomalous spontaneous-reduction of Mn7+/Mn4+ to Mn2+ and luminescence properties in Zn2GeO4:Mn. J. Mater. Chem. C 2017, 5, 3343–3351. [Google Scholar] [CrossRef]
Figure 1. SEM image of Ca8MnEu(PO4)7.
Materials 16 01383 g001
Figure 2. DSC curves in the heating/cooling cycles for Ca8MnEu(PO4)7. The heating/cooling rate is 10 K/min.
Materials 16 01383 g002
Figure 3. The temperature dependence of the dielectric permittivity ε(T) (a) and the dielectric loss tangent (tg δ) (b) for Ca8MnEu(PO4)7 at 50 kHz and 1 MHz (on heating).
Materials 16 01383 g003
Figure 4. Electric conductivity of Ca8MnEu(PO4) at 50 kHz on heating (1) and cooling (2).
Materials 16 01383 g004
Figure 5. Observed (blue crosses), calculated (blue line) and difference (red line from below) synchrotron PXRD patterns for Ca8MnEu(PO4)7. Magenta bars denote the peak positions of possible Bragg reflections.
Materials 16 01383 g005
Figure 6. PXRD patterns of Ca9−xMnxEu(PO4)7 and the positions of Bragg reflections of β-TCP (β-Ca3(PO4)2, PDF#4 Card No. 00-09-0169) (a); The enlarged main reflection (0 2 10) of Ca9−xMnxEu(PO4)7 solid solution (b).
Materials 16 01383 g006
Figure 7. Temperature-dependent inverse magnetic susceptibility curve of Ca8MnEu(PO4)7 at H = 10 kOe with fitting results (line).
Materials 16 01383 g007
Figure 8. M versus H curves at T = 2 K for Ca8MnEu(PO4)7. The red line shows the Brillouin function with g = 2, S = 5/2 and T = 2 K.
Materials 16 01383 g008
Figure 9. The XPS survey spectrum (a) and high-resolution XPS spectra of Ca2p (b), Eu3d (c) and Mn2p (d) peaks of Ca9−xMnxEu(PO4)7 with x = 0.2 and 1.0.
Materials 16 01383 g009
Figure 10. High-resolution XPS spectra of Mn3s peaks of Ca9−xMnxEu(PO4)7 x = 0.2 and 1.0.
Materials 16 01383 g010
Figure 11. Normalized PLE spectra of Ca8.2Mn0.8Eu(PO4)7 at λem = 440 and 620 nm.
Materials 16 01383 g011
Figure 12. Normalized PL spectra of Ca9−xMnxEu(PO4)7 with x = 0.8 at λex = 370 nm and 395 nm.
Materials 16 01383 g012
Figure 13. PL spectra for Ca9−xMnxEu(PO4)7 at λex = 395 nm; the inset shows the dependence of normalized integral intensity on the Mn2+ concentration in Ca9−xMnxEu(PO4)7.
Materials 16 01383 g013
Figure 14. (a) PL spectra for Ca9−xMnxEu(PO4)7 at λex = 370 nm; (b) the dependence of normalized integral intensity of Eu2+ and Eu3+ emission (λex = 370 nm).
Materials 16 01383 g014
Figure 15. (a) 5D07F0 transition in Ca9−xMnxEu(PO4)7 at λex = 395 nm; (b) the dependence of normalized integral intensity of Eu2+ and Eu3+ emission (λex = 370 nm).
Materials 16 01383 g015
Figure 16. The scheme of abnormal reduction of Eu3+ to Eu2+ in the β-TCP-type host.
Materials 16 01383 g016
Table 1. The characteristics of PL spectra and some features of Mn2+ or RE/Mn2+-doped β-TCP-type phosphors.
HostRE/Mn2+ CombinationPL Spectra (Band Location/Peak of the Band)FeaturesRef.
Ca9Mn1−xNa(PO4)7:xM2+,
M = Zn, Mn
Mn2+ and Eu2+/Mn2+600–750 nm/655 nm The co-doping of Zn2+/Mg2+ and Mn2+ broke the intrinsic structural confinement of Mn2+ and improved its red emission.[13]
Sr19(Mg1−xMnx)2(PO4)14: yEu2+Eu2+/Mn2+550–750 nm/610 nm The emission bands were attributed to Eu2+ and Mn2+ in different sites.[17]
Ca8MgGd(PO4)7:Eu2+/Mn2+Eu2+/Mn2+600–750 nm/650 nm
λex = 365 nm
Efficient Eu2+ → Mn2+ energy transfer was observed, Eu2+ emission intensity decreased.[22]
Ca9MMn(PO4)7
(M = Li, Na, K)
Mn2+580–720 nm/645 nmThe excitation by β-source 90Sr-90Y. Mn2+ occupies M5 site, M+ ions (Li, Na, K) are located in M4 site.[23]
Ca8.82−zGa(PO4)7:0.18Ce3+, zMn2+Ce3+/Mn2+Two broad emission bands:
350–450 nm/380 nm
(Ce3+ emission)
600–700 nm/625 nm
(Mn2+ emission)
The concentration quenching was observed above 9 mol. % Mn2+;
the decreasing of quantum yield from 62.3% to 67 % with increasing Mn2+ concentration was explained by energy loss during Ce3+ → Mn2+ energy transfer process.
[24]
Ca10K(PO4)7:Eu2+, Mn2+Eu2+/Mn2+Two broad emission bands
ex = 347 nm):
425–500 nm/467 nm
(Eu2+ emission)
600–700 nm/634 nm
(Mn2+ emission)
Decreasing of PL intensity with increasing of Mn2+ concentration. The concentration quenching was observed above 7 mol. % Mn2+; resonant type of Eu2+ → Mn2+ energy transfer process via a dipole–quadrupole mechanism.[14]
Ca9MgK(PO4)7:Eu2+, Mn2+Eu2+/Mn2+Two broad emission bands
ex = 347 nm)
425–500 nm/467 nm
(Eu2+ emission)
600–700 nm/634 nm
(Mn2+ emission)
Resonant type of Eu2+ → Mn2+ energy transfer with mechanism via a dipole–quadrupole interaction.[25]
Ca8ZnCe(PO4)7:Eu2+, Mn2+Ce3+/Eu2+/Mn2+Three broad bands peaked
ex = 285 nm)
320–420 nm/375 nm
(Ce3+ emission)
450–575 nm/500 nm
(Eu2+ emission)
580–700 nm/645 nm
(Mn2+ emission)
The energy transfers of Ce3+→Eu2+/Mn2+ and Eu2+ → Mn2+ ions were investigated.
The emitting color can be adjusted from violet-blue to green/red-orange/white by doping/co-doping.
[26]
Table 2. Crystallographic data for Ca8MnEu(PO4)7 (SG R 3 ¯ c, Z = 6, T = 293 K).
Sample CompositionCa8MnEu(PO4)7
Lattice parameters: a, Å10.39826(1)
         c, Å37.17350(5)
Unit cell volume V, Å33480.851(7)
Calculated density, g/cm33.413
Data Collection:
DiffractometerBL15XU beamline of SPring-8
Radiation/Wavelength (λ, Å)Synchrotron/0.65298
Absorption coefficient, μ (mm−1)4.381
F(000)3462
2θ range (°)2.040–60.237
Step scan (2θ)0.003
Imax606,480
Number of points19,391
Refinement:
RefinementRietveld
Background functionLegendre polynoms, 15 terms
No. of reflections (all/observed)945/922
No. of refined parameters/refined atomic parameters43/34
R and Rw (%) for Bragg reflections (Rall/Robs)5.29/5.95 and 5.05/4.81
RP and RwP; Rexp2.06, 3.31, 0.63
Goodness of fit (ChiQ)5.25
Max./min. residual density(e) (Å3)0.65/−0.88
Table 3. Relative position of the satellite (ΔMn2psat) in Mn2p XPS spectra and splitting (ΔMn3s) Mn3s XPS spectra of the studied Ca9−xMnxEu(PO4)7 (x = 0.2 and 1.0) samples and reference manganese oxides, eV.
SampleΔMn2psatΔMn3sReference
Ca8MnEu(PO4)7~6.06.1This work
Ca8.8Mn0.2Eu(PO4)7~6.05.8This work
MnO~6.06.1[53,54]
Mn2O310.15.4[55]
MnO211.84.4[56]
Table 4. Calculated Dr values for Mn and Eu in different oxidation states in the β-TCP host.
SiteDr Value, %, for Doped Ion
Mn2+Mn4+Eu2+Eu3+
Ca1–Ca3
CN8 (r =1.12 Å)
14
(r = 0.96 Å)
-11
(r = 1.25 Å)
4
(r = 1.07 Å)
Ca5
CN6 (r =1.00 Å)
17
(r = 0.83 Å)
47
(r = 0.53 Å)
17
(r = 1.17 Å)
5
(r = 0.95 Å)
CN is a coordination number; r is the ionic radii in the corresponding CN.
Disclaimer/Publisher’s Note: The statements, opinions and data contained in all publications are solely those of the individual author(s) and contributor(s) and not of MDPI and/or the editor(s). MDPI and/or the editor(s) disclaim responsibility for any injury to people or property resulting from any ideas, methods, instructions or products referred to in the content.

