Article

Kinetics of Oxygen Exchange and N2O Decomposition Reaction over MeOx/CeO2 (Me = Fe, Co, Ni) Catalysts

1
Boreskov Institute of Catalysis SB RAS, 5, Lavrentiev Ave., 630090 Novosibirsk, Russia
2
Department of Mathematics and Mechanics, Novosibirsk State University, 2, Pirogov Str., 630090 Novosibirsk, Russia
*
Author to whom correspondence should be addressed.
Materials 2023, 16(3), 929; https://doi.org/10.3390/ma16030929
Submission received: 22 December 2022 / Revised: 13 January 2023 / Accepted: 16 January 2023 / Published: 18 January 2023

Abstract

:
MeOx/CeO2 (Me = Fe, Co, Ni) samples were tested in an 18O2 temperature-programmed isotope exchange and N2O decomposition (deN2O). A decrease in the rate of deN2O in the presence of oxygen evidences the competitive adsorption of N2O and O2 on the same sites. A study of isotope oxygen exchange revealed dissociative oxygen adsorption with the subsequent formation of surface oxygen species. The same species, more probably, result from N2O adsorption and the following N2 evolution to the gas phase. We supposed the same mechanism of O2 formation from surface oxygen species in both reactions, including the stages responsible for its mobility. A detailed analysis of the kinetics of isotope exchange has been performed, and the rates of one-atom (RI) and two-atom (RII) types of exchange were evaluated. The rate of the stage characterizing the mobility of surface oxygen was calculated, supposing the same two-step mechanism was relevant for both types of exchange. The effect of oxygen mobility on the kinetics of deN2O was estimated. An analysis of the possible pathways of isotope transfer from MeOx to CeOx showed that direct oxygen exchange on the Me–Ce interface makes a valuable contribution to the rate of this reaction. The principal role of the Me–Ce interface in deN2O was confirmed with independent experiments on FeOx/CeO2 samples with a different iron content.

1. Introduction

N2O is one of the side products of NH3 oxidation to nitric acid over Pt–Rh gauzes; its emissions into the atmosphere are strictly regulated. It is commonly considered that N2O decomposition (deN2O) is initiated by the interaction of gas-phase N2O with an active site S (oxygen vacancies, in our case), resulting in the gas-phase N2 and adsorbed oxygen species (O-S):
(1)
N2O + S ↔ N2O-S
(2)
N2O-S → N2 + O-S
The formation of O2 can proceed by either direct recombination of two O-S species [1,2]:
(3a)
2O-S ↔ O2 + 2S
or by direct reaction of gas-phase N2O with O-S [3] described by the simplified reaction:
(3b)
O-S + N2O → N2 + O2 + S
Reaction inhibition in oxygen presence was observed for most bulk oxide systems [1,2], which can be due to the competitive adsorption of N2O and oxygen on the same active sites. At 300–600 °C, oxygen desorption was shown to be the rate-controlling step of the reaction [4,5,6]. N2O decomposition in the ammonia burner with the catalyst located directly under Pt-Rh gauzes is also industrially applied as an attractive technology for N2O abatement. Such a catalyst operates at above 800 °C. Under these conditions, the importance of oxygen mobility for the deN2O activity was highlighted for La–Sr–Mn perovskite-type oxides [7] and supported MeOx/Al2O3(CeO2) (Me = Fe, Co, Ni) [8] and FeOx/(CeO2 + Al2O3) samples [9], while reaction retardation with oxygen was observed as well. The mechanism of oxygen formation through the recombination of two O-S species (step 3a) is unlikely to fit this case because oxygen species are strongly bonded with anion vacancies and cannot diffuse on the catalyst surface. Kondratenko et al. [10,11,12,13] showed that N2O decomposition over different Fe-containing oxidic systems used in a wide range of temperatures is better fitted using an intermediate scheme. With this scheme, O2 and N2O adsorb on the same active site S, as in the case of the traditional Langmuir-Hinshelwood mechanism. However, oxygen adsorption proceeds without dissociation, and the molecular form of adsorbed O2 (O2-S) has been formed by a N2O reaction with O-S:
(3c)
O2-S ↔ O2 + S
(4)
N2O + O-S N2 + O2-S
However, samples with preferentially isolated active Fe sites (Fe-ZSM-5, Fe-silicalite, and BaFeAl11O19) have been studied, and non-dissociative O2 adsorption can be supposed in this case. Data from Boreskov and Muzykantov [14] show that at >~400 °C, oxygen dissociative adsorption proceeds on the surface of bulk α-Fe2O3 and NiO. In CeO2, oxygen from the gas phase first forms adsorbed superoxide or peroxide species which incorporate into the lattice via the following sequence of reactions [15,16,17]:
O 2 ( g ) O 2 ( ads ) O 2 ( ads ) O 2 ( ads ) 2 2 O ( ads ) 2 O ( lattice ) 2
Isotopic oxygen exchange in gas-solid systems is widely used in heterogeneous catalysis for studying oxygen activation, characterization of its state on the catalyst surface, and elucidation of kinetic peculiarities of oxygen transfer, including bulk oxide oxygen atoms, depending on sample microstructure. The basic theory is based on the classification of exchange types, depending on the number of surface oxygen atoms participating in an exchange with O2 (zero-atom, single-atom, or two-atom exchange) [6,18,19,20,21,22]. Regarding the exchange type, one may reveal the most probable mechanisms of oxygen activation on the surface. The unified mechanism was proposed by Muzykantov [14,23,24] for the interpretation of different types of oxygen exchange in oxides. It includes two types of surface oxygen species resulting from oxygen adsorption on the catalyst surface, i.e., O strongly bound with oxygen vacancy (Ov) and O located on the surface (Os). The last, in turn, can diffuse on the surface and occupy the oxygen vacancy, thus transforming to Ov. Such transformation is reversible: strongly bound oxygen can diffuse to the surface as well. O2 formation proceeds by recombination of Ov and Os. According to Muzykantov’s theory, it is the mobility of Os that determines the type of exchange. Heteroexchange with the participation of two atoms of oxide surface oxygen is realized at a high diffusion rate of Os, and one oxygen atom participates in the exchange at a low rate of diffusion. Therefore, one can estimate the mobility of surface oxygen from the ratio of different types of exchange. Boreskov and Muzykantov [14] presented the characteristics of surface oxygen mobility of some simple and complex oxides and noted its high value for α-Fe2O3. We supposed that the same mechanism of oxygen species recombination could realize in the reaction of N2O decomposition.
At high temperatures, the bulk oxide oxygen atoms take part in the exchange process. That is why many recent studies focused on the estimation of the rate of bulk oxygen substitution, which may be used for characterizing the mobility of lattice oxygen [7,25,26]. The oxygen exchange behavior at high temperatures in La-Sr-Mn-O samples has been studied with a special emphasis on its relation to catalytic activity in N2O decomposition [7]. It was shown that the appearance of the second faster pathway of oxygen transfer in the bulk of the catalyst through oxygen vacancies or disordered-free channels in the perovskite structure resulted in increased catalytic activity. Evaluation of the rates of surface oxygen exchange and the coefficient of lattice oxygen diffusion in three La-Sr-Fe-O catalysts with close element content but different phases and surface compositions revealed the direct correlation between the surface exchange rate constant and the rate of N2O decomposition [27]. The results obtained can be useful for developing active catalysts.
In the present study, we investigated the main features of oxygen transfer on the surface and in the bulk of CeO2 and MeOx/CeO2 (Me = Fe, Co, Ni) samples using 18O isotope exchange. It allowed us to reveal the interdependence of these processes and the kinetics of the reaction of N2O decomposition.

2. Materials and Methods

2.1. Samples Preparation and Characterization

Ce, Co, Ni, and Fe nitrates of a purity of 99.0% and citric acid (99.8%) were purchased from Vekton, Saint Petersburg, Russia. Ethylene glycol (99.0%) was purchased from Ecros, Saint Petersburg, Russia.
CeO2 (SBET = 1.4 m2/g, pore volume 0.42 cm3/g) used as the support was obtained using calcination of Ce(NO3)3·6H2O at 900 °C for 36 h. MeOx/CeO2 samples (Me = Fe, Co, Ni) with Me concentration 6.7 × 10¹⁹ at/m2 (0.86–0.91 wt%) were prepared using incipient wetness impregnation of CeO2 with a water solution of a corresponding Me nitrate (0.37 mol/L) with added citric acid (0.41 mol/L) and ethylene glycol (0.26 mol/L). A solution 2.9 times more concentrated (with regard to all components) was taken for preparation of FeOx/CeO2 with an Fe content of 2.5 wt%. After drying first under an IR lamp at continuous mixing and then—at 150 °C for 6 h, samples were calcined at 900 °C for 4 h. SBET values for FeOx/CeO2 samples were close to that of CeO2 (1.3–1.4 m2/g). X-ray powder diffraction (XRD) patterns were recorded using a Bruker D8 diffractometer with Cu Kα monochromatic radiation. Each sample was scanned in the range of 2θ from 10° to 70° with a step 0.05° of 2θ. The surface composition of the samples was investigated using X-ray photoelectron spectroscopy (XPS) using spectrometer SPECS (SPECS, Berlin, Germany) with Al Kα irradiation (hν = 1486.6 eV). The positions of the peaks of Au 4f7/2 (84.0 eV) and Cu 2p3/2 (932.67 eV) core levels were used for calibration of the binding energy (BE) scale.

2.2. Temperature-Programmed Isotopic Exchange (TPIE) of O2

Before every experiment, the sample loaded into a reactor (quartz tube, i.d. = 3 mm) was kept in 0.5 vol.% 16O2 + He flow at 900 °C for 30 min; then, the reactor was cooled down to room temperature in the same flow. At T ≤ 100 °C, this mixture was replaced stepwise by the same one but containing 18O2 and Ar (1 vol.%) as an inert tracer, and the reactor was heated up to 900 °C (rate of heating 14.7 °C/min). Gas flow rate and catalyst loading were the same in all experiments and amounted to 5.0 L/h and 0.025 g, respectively. Transient changes in the gas isotopic composition (16O2, 16O18O, and 18O2 concentrations) were continuously monitored using a QMS 200 gas analyzer (Stanford Research Systems, Sunnyvale, CA, USA). 18O isotope fraction in the gas phase O2 (α(t)) calculated as α(t) = (16O18O + 218O2)/2OiOj, where OiOj = 16O2 + 16O18O + 18O2 was a characteristic of oxygen exchange. The general quantity of exchanged oxygen for different samples as related to the mass unit (NO, at/g) was calculated using the formula
N O = N A 2 C O 2 U g 0 t ( α i n p u t α ) d t
where αinput is the isotope fraction in the inlet mixture (0.95), CO2 is inlet O2 concentration (0.15 × 10⁻² mol/mol), U is the flow rate of the reaction mixture (mol/s), and NA is Avogadro number.

2.3. Catalytic Activity Measurement

The catalytic activity was measured in a fixed-bed U-shaped reactor (3 mm i.d. quartz tube) loaded with 0.038 g of the sample (particles of 250–500 μm in size) at a flow rate of 18–60 L/h, ambient pressure, and at a temperature range of 600–900 °C. A gas mixture containing 0.15—1.0 vol% N2O in He was used. To check out the effect of O2, 3 vol.% O2 was added to the inlet mixture. Outlet mixture composition was analyzed using a gas chromatograph equipped with Porapack T (i.d. = 3mm, l = 3 m, N2O analysis) and NaX (i.d. = 3 mm, l = 2 m, N2 analysis) columns. N2O conversion (XN2O) calculated as:
X N 2 O = ( C N 2 O 0 C N 2 O ) / C N 2 O 0 × 100 %
where C N 2 O and C N 2 O 0 —outlet and inlet concentrations of N2O were considered a measure of sample activity.

3. Results and Discussion

3.1. Qualitative Analysis of Oxygen Isotope Exchange Process

The changes in α(t) during the TPIE O2 on CeO2 and different MeOx/CeO2 samples depending on T are shown in Figure 1. The 18O fraction in O2 first decreases as isotope exchange between gas phase oxygen and catalysts starts. Then it goes across the minimum and returns to the initial value after the complete substitution of exchangeable oxygen in the catalyst. One can see that exchange in CoOx/CeO2 starts at lower temperatures and thus proceeds much faster than in other samples. The quantity of exchangeable oxygen (NO) in the CoOx/CeO2 sample is 6.4 × 10²¹ atoms/g (Table 1), which is close to the stoichiometric quantity of O atoms in CeO2 lattice (~7 × 10²¹ atoms/g). A lower quantity of oxygen was exchanged in other samples because temperature-programmed heating stopped at 900 °C, while the exchange started at higher temperatures. Based on the similarity of α(t) curves for all samples, we supposed that all oxygen of CeO2 participates in the exchange therein.
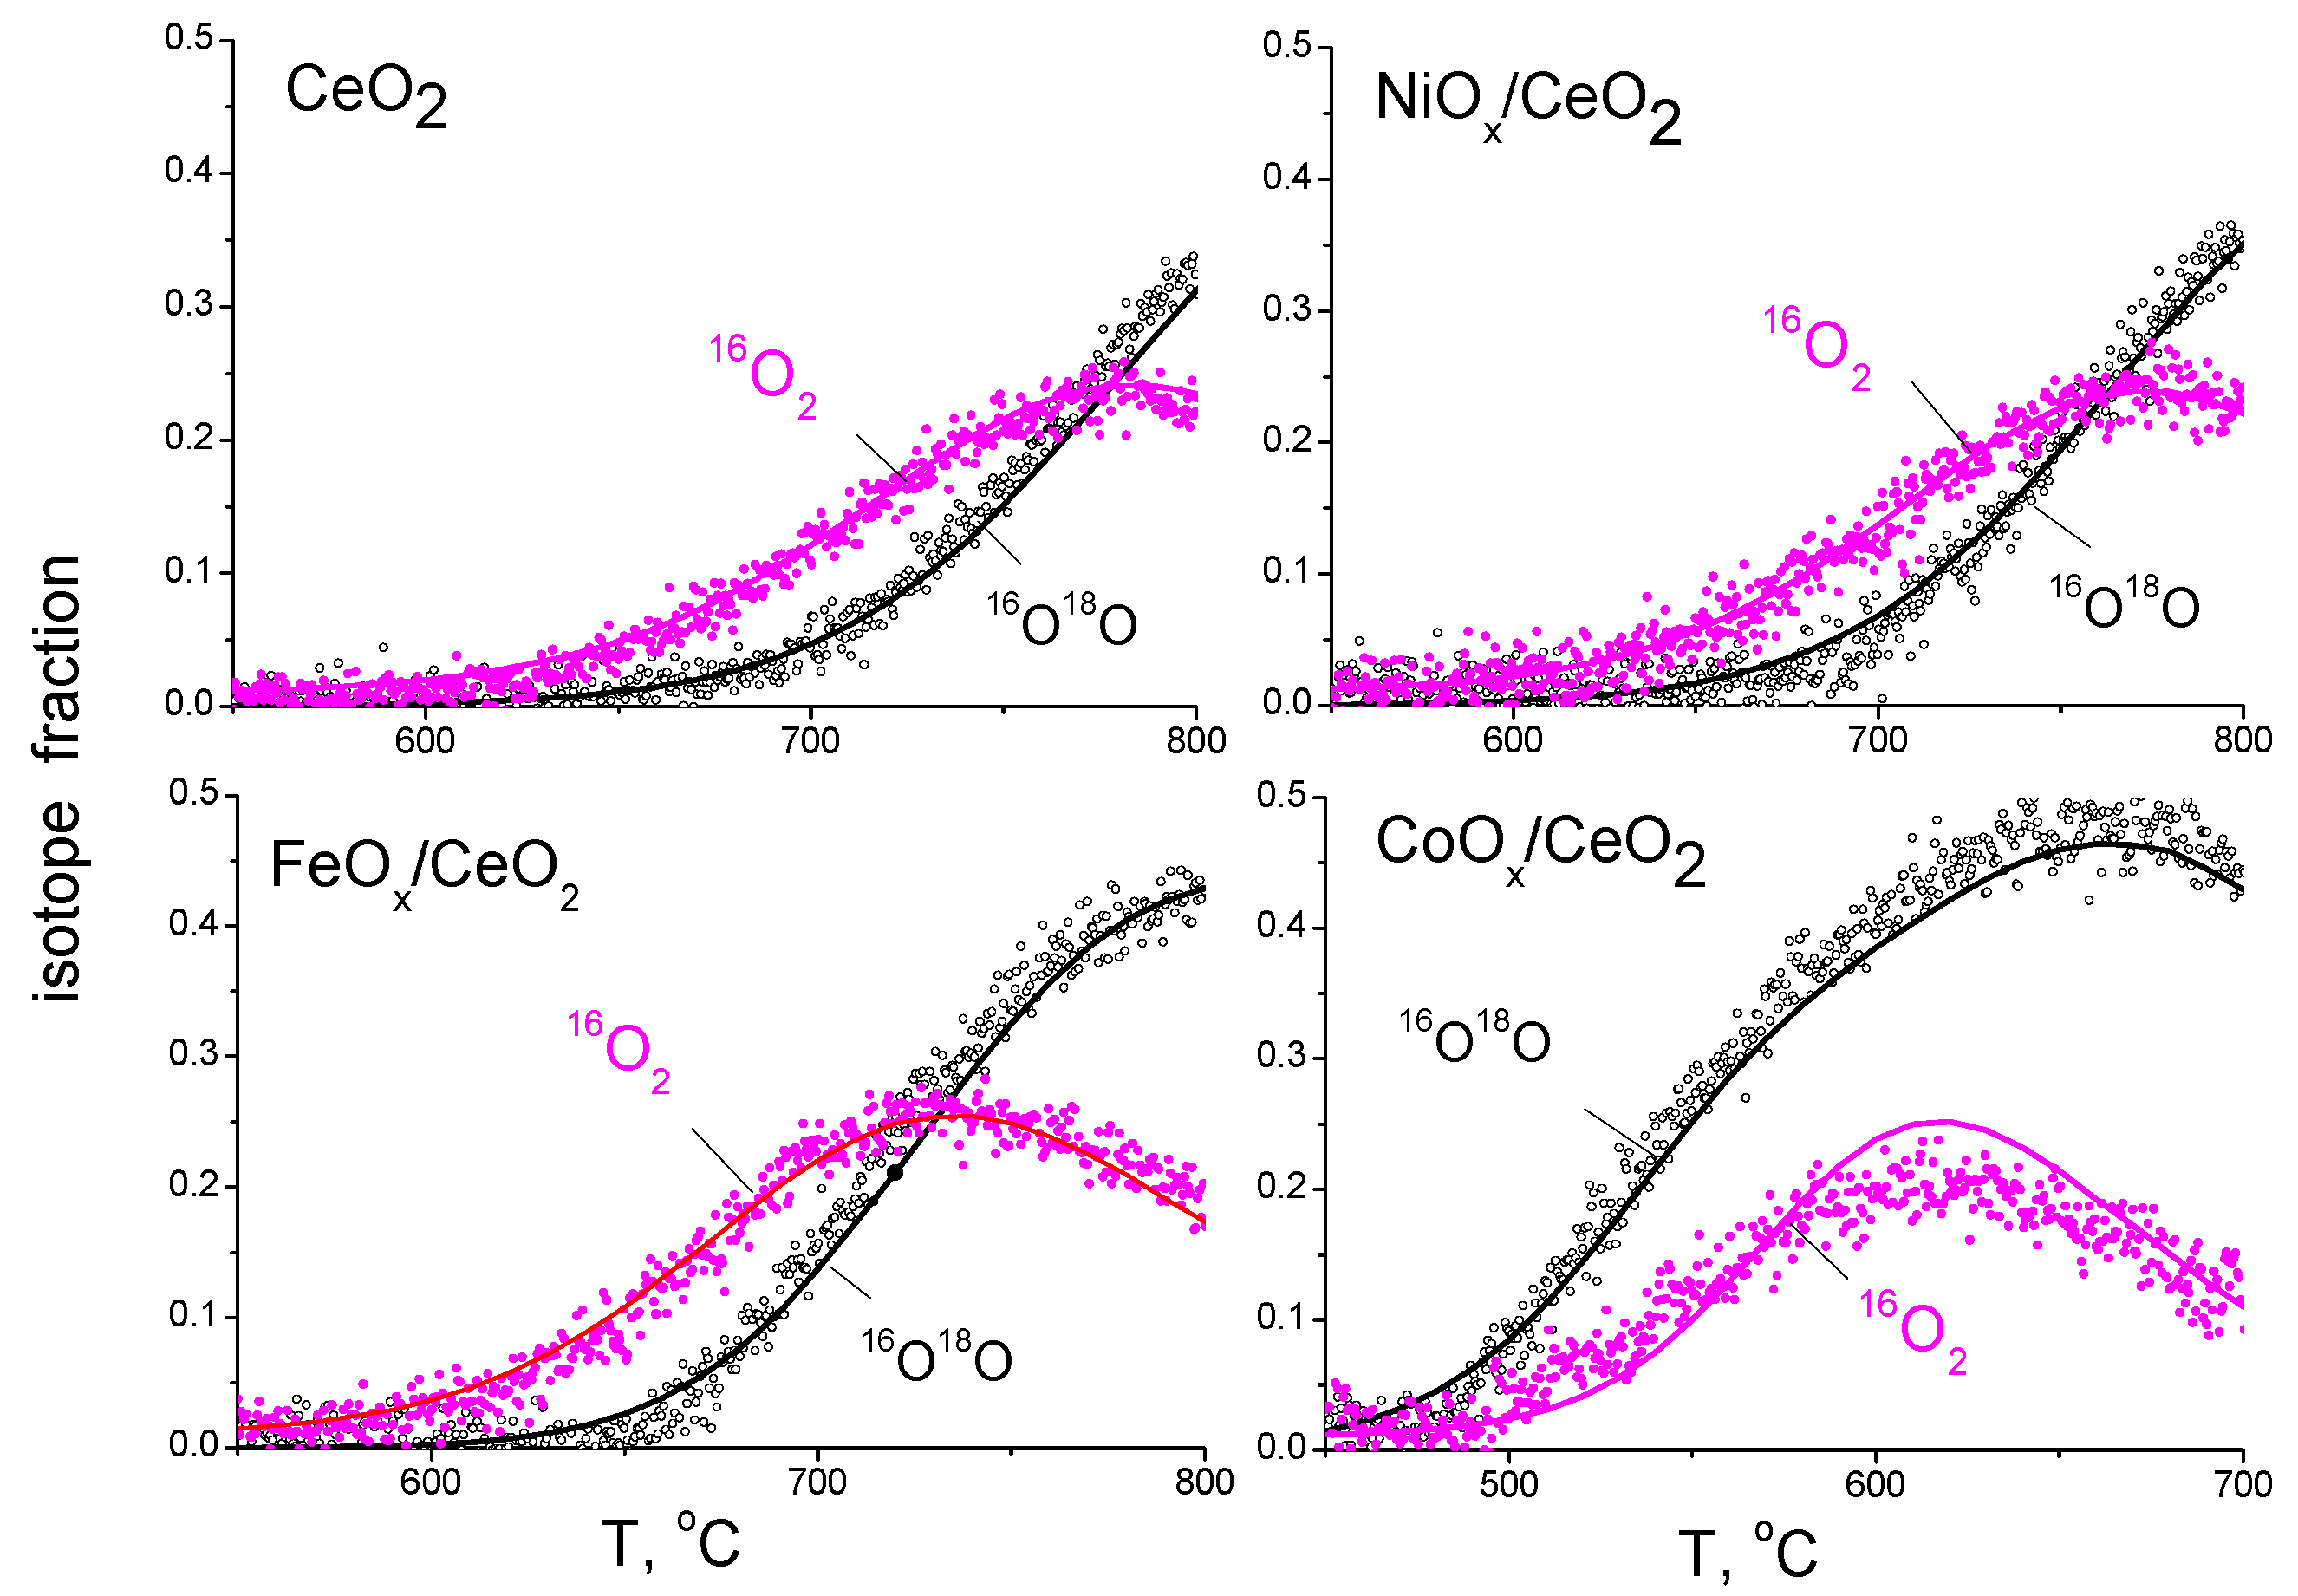
At the same time, a principally different distribution of labeled O2 molecules was observed during TPIE (Figure 2). So, in CeO2, NiOx/CeO2, and FeOx/CeO2 samples, 16O2 appears in the gas phase first, and its fraction in O2 (f32) exceeds that of 16O18O (f34) for a long period of time. In the CoOx/CeO2 sample, on the contrary, 16O18O appear first, and f34 is higher than f32 for all period of monitoring. Klier and Muzykantov [21,28] proposed the theory of isotope exchange of oxygen with solid oxides, which is currently widely used for the interpretation of mechanisms of oxygen transfer in solids [29,30,31]. With this theory, there are three kinetically distinct types of exchange depending on the number of oxygen atoms from the solid phase participating in the exchange reaction, zero-atom (R0), single-atom (RI), and two-atom (RII). The overall rate of heteroexchange R = 0.5RI + RII. Both qualitative and quantitative interdependence between the type of exchange and distribution of isotope molecules during the exchange was determined within the framework of this theory. The observed character of the curves preferentially evidences the two-atom type of exchange in CeO2, NiOx/CeO2, and FeOx/CeO2 samples where two O atoms of the catalysts participate in every act of exchange:
18O2 + [16O]cat + [16O]cat16O2+ [18O]cat + [18O]cat
In turn, only one O atom participates in the exchange in CoOx/CeO2 sample:
18O2 + [16O]cat16O18O+ [18O]cat

3.2. Quantitative Estimates of Oxygen Isotope Exchange Rates

Numerical analysis of αg (T), f32(T), and f34(T) was performed to make quantitative estimates of the rates of isotope exchange with an account of types of exchange using the model of flow reactor including diffusion of oxygen isotopes in the bulk of the catalysts (see Appendix A). It revealed that oxygen substitution in the bulk of all samples is determined by the rate of “gas phase–surface” exchange. Diffusion of isotopes in the bulk proceeds very fast. Their concentration in bulk is close to that in the surface layer, which evidences the high mobility of the lattice oxygen. Estimated values of the rates of single-atom (RI) and two-atom (RII) exchange, as well as overall rates of heteroexchange (R) and contributions of two-atom exchange to the overall rate (RII/R), have been presented in Table 1. The accuracy of estimation of the overall rates of heteroexchange is reasonably high, and the calculating error lies within ±5%. The values of the rates of different types of exchange are estimated with lower accuracy (±10%). One can see that R, RI, and RII values change in the following order: CeO2 ≤ NiOx/CeO2 < FeOx/CeO2 < CoOx/CeO2. RII values vary within one order of magnitude, and differences are more substantial for R and RI. RII/R values are as high as 0.9 for CeO2, NiOx/CeO2, and FeOx/CeO2 and are only 0.2 for CoOx/CeO2. Therefore, a substantially higher rate of exchange in the CoOx/CeO2 sample compared with other CeO2-based samples is due to one-atomic exchange in the former of them.

3.3. Comparison of the Rates of N2O Decomposition and Oxygen Isotope Exchange

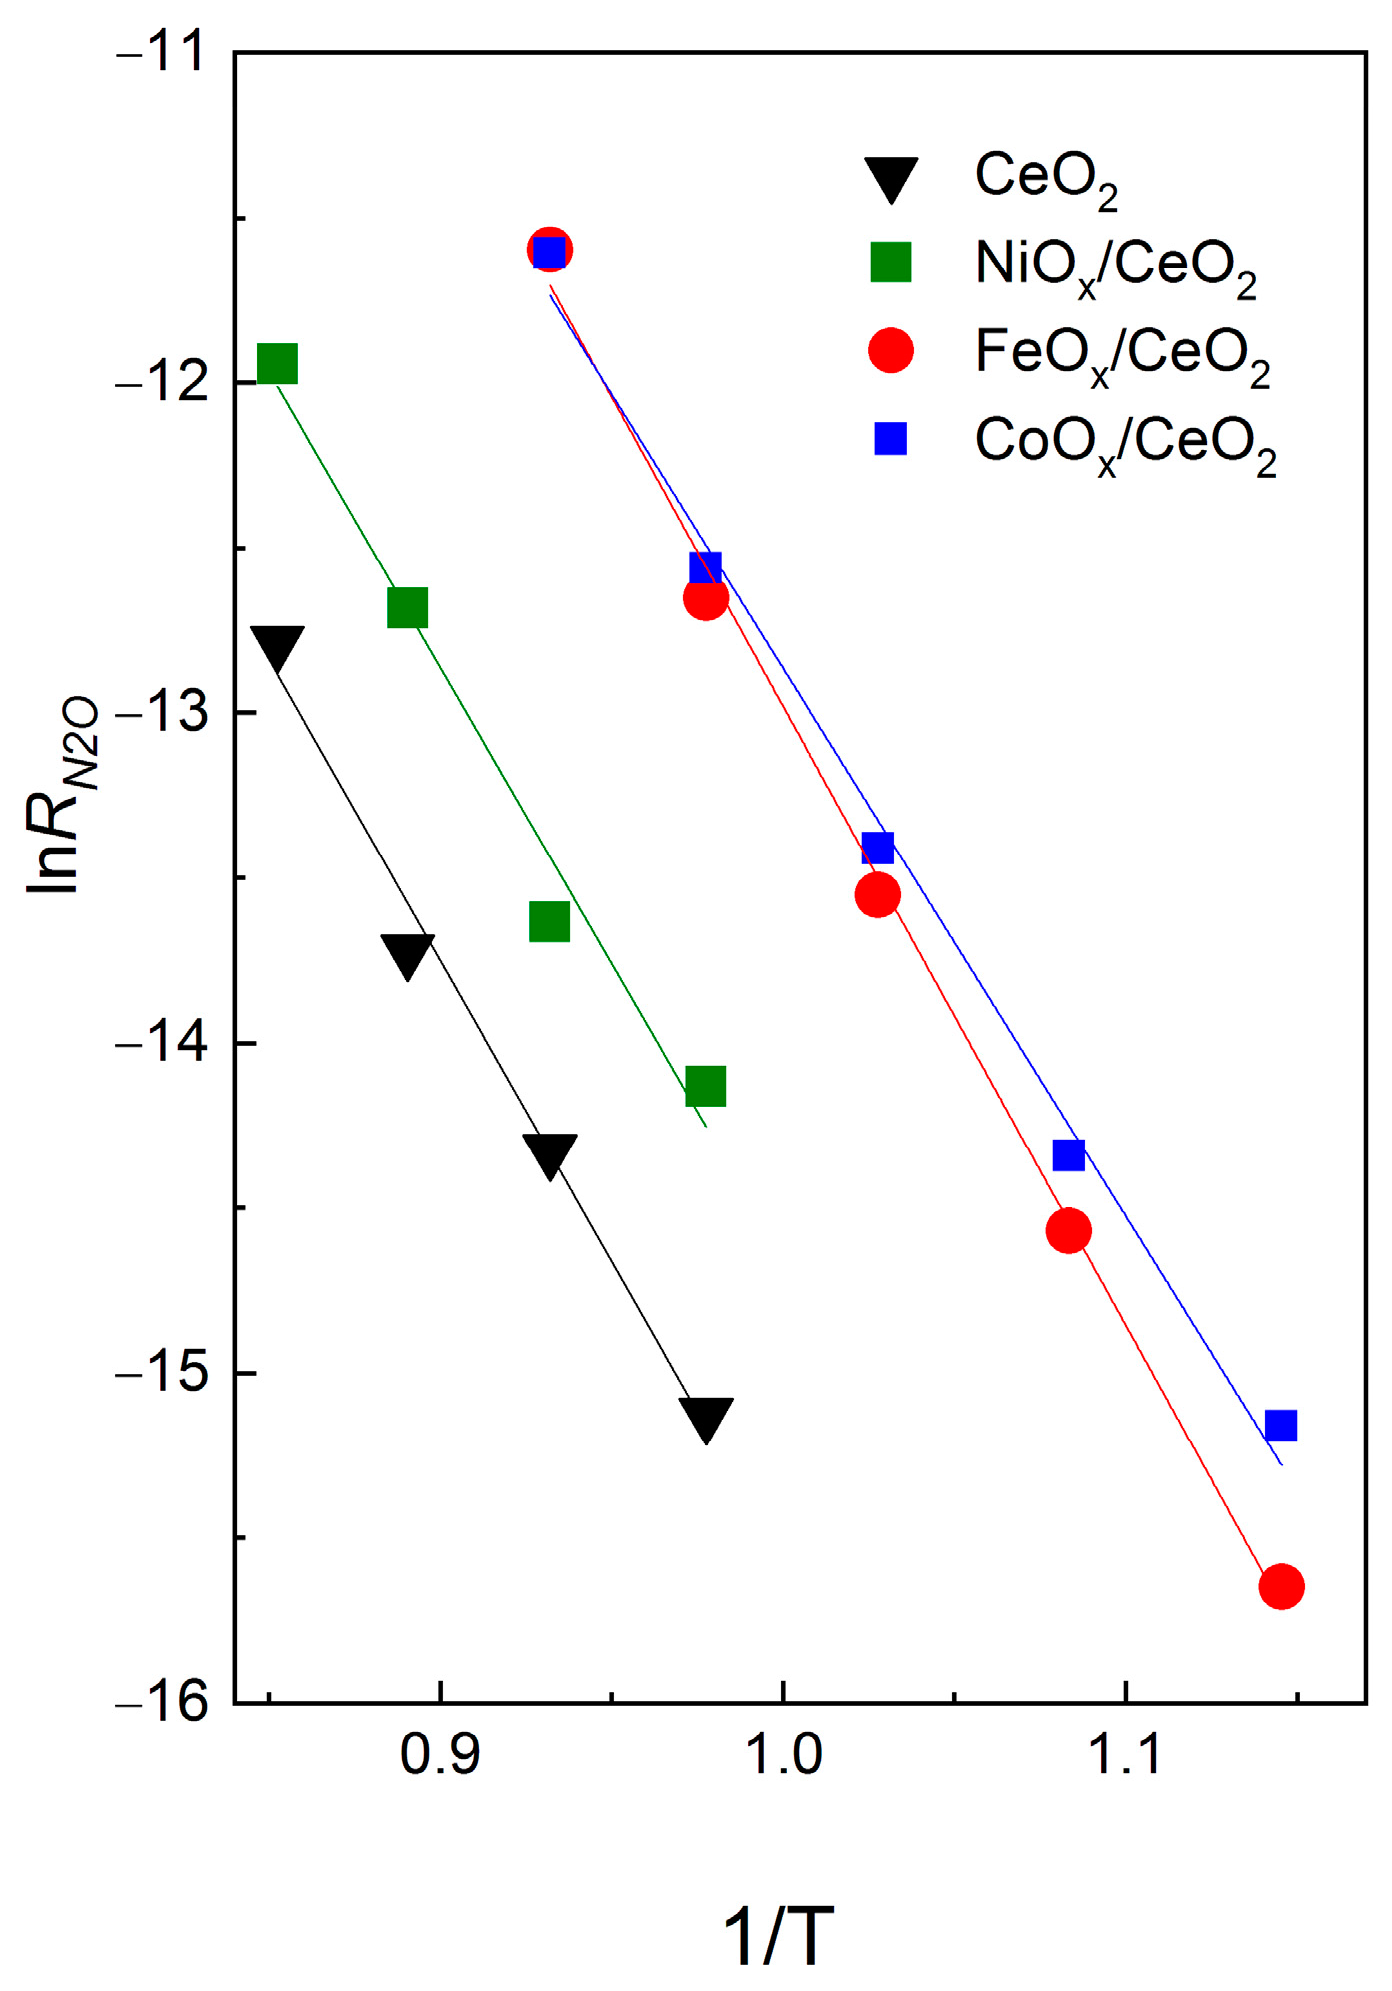
Dependences of the rates of N2O decomposition (RN2O) versus reverse temperature over different samples have been presented in Figure 3. Their values at 750 °C and activation energy values (ERN2O), as determined from the Arrhenius dependence on temperature, are presented in Table 2.
One can see that activity in N2O decomposition changes in the following order: CeO2 < NiOx/CeO2 < FeOx/CeO2 < CoOx/CeO2 excluding the temperature interval above 750 °C where RN2O value for FeOx/CeO2 and CoOx/CeO2 become close. One can suppose that such approaching activity values at the distinct difference between RI and RII can be due to the different phase composition of the CoOx/CeO2 sample under oxygen-deficient conditions (case of deN2O) and in the presence of oxygen. Indeed, the reduction of Co3O4 to CoO took place at above 750 °C during temperature-programmed heating in the inert [8,32,33], while oxygen presence shifted the temperature of the beginning of Co3O4 reduction to substantially higher temperatures [32,33]. At the same time, CeO2, NiO, Fe2O3, and supported Ni(Fe)Ox/CeO2 samples were stable during TPD in He up to 900 °C, at least [8].
RN2O values are substantially lower than RII and R, but RII/RN2O values for all samples are comparable and lie within 10 (±5), while R/RN2O values vary from 5 to 70. Therefore, some correlation between RN2O and RII, but not R, can be supposed. Below, we attempted to derive steady-state rates kinetic equations using known conceptions about the mechanisms of these reactions. Finally, the RII/RN2O ratios were derived through reaction rate constants and initial concentrations of the reagents.

3.4. Mechanism and Form of Rate Equation for Oxygen Isotope Exchange in Oxides

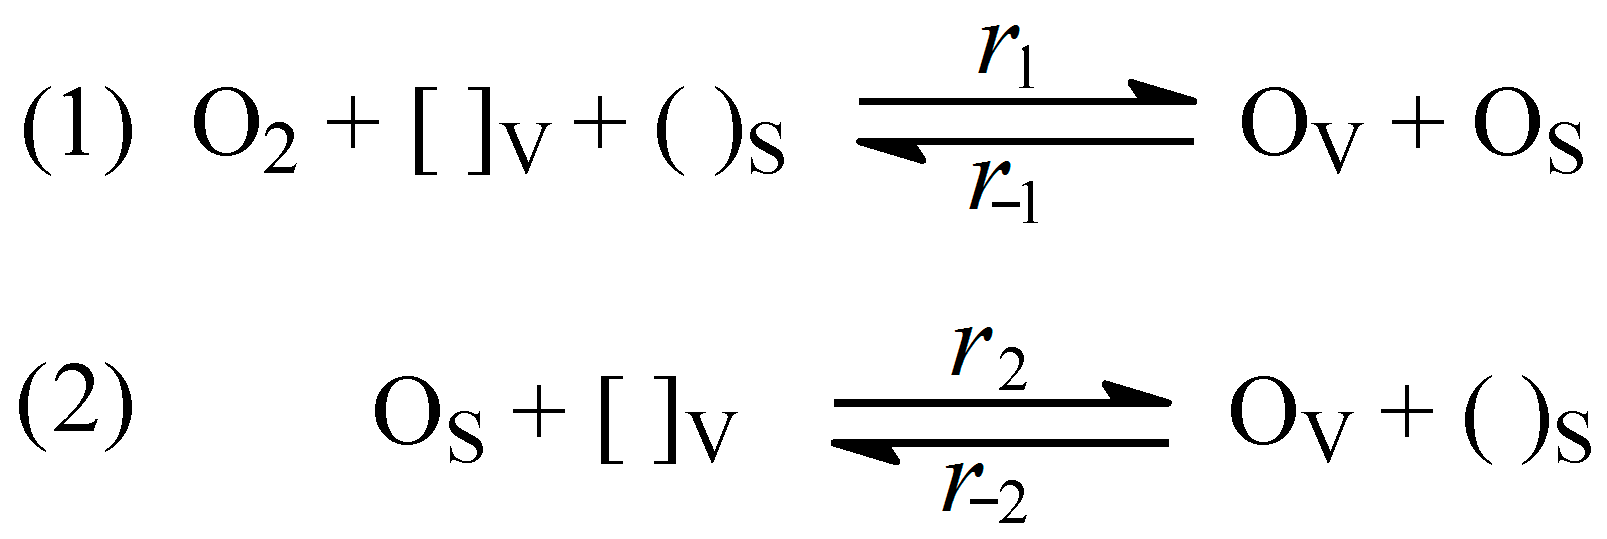
A certain set of mechanisms can describe every type of oxygen exchange (with the participation of one or two oxygen atoms) in oxides. Single-atom type of exchange is more often described by the Eley–Rideal mechanism that considers the formation of three atomic surface complexes, including two atoms of molecular oxygen and one oxygen atom of the catalyst [34]. The two-atom mechanism is usually interpreted using the two-step mechanism of Bonhoeffer and Farkas [35]. Reversible dissociation of the O2 molecule proceeds in the first stage resulting in two equivalent atoms of adsorbed oxygen. In the second stage, the incorporation of adsorbed oxygen to the lattice of oxide proceeds, followed by isotope exchange between adsorbed and lattice oxygens. However, these are the anionic surface defects (oxygen vacancies) that are responsible for the activation of O2 on the oxide surface. As a rule, their concentration is low, and it is doubtful whether simultaneous interaction of O2 with two defects, which is necessary for molecule dissociation, is possible. We consider that the two-step mechanism proposed by Muzykantov and Boreskov [14,23,24] and presented in Scheme 1 is the most well-grounded.
According to this mechanism, the O2 molecule dissociates on oxygen vacancy [ ]v resulting in a strongly bound oxygen atom Ov which is included in the oxide lattice, and oxygen atom Os weakly bound with the oxide surface (Scheme 1, stage 1). Formation of O2 proceeds by recombination of Ov and Os. At a high rate of surface diffusion Os can find and occupy another vacant site [ ]v resulting in the formation of Ov (Scheme 1, stage 2). This stage is reversible, i.e., strongly bound oxygen can leave this place and come on the surface. As a matter of fact, the second stage characterizes the mobility of Os. This mechanism allows the interpretation of both two- and single-atomic exchanges. Two-atom exchange is realized according to the following pathway: step 1 (r1) → step 2 (r2) → step −2 (r−2) → step −1 (r−1), while the single-atom mechanism includes only two steps: step 1 (r1) → step −1 (r−1). The selectivity of the reaction of isotope exchange by pathway corresponding to the two-atom exchange (S) is determined by the ratio of the rates of step −1 and step 2:
S = r 2 r 2 + r 1 = 1 1 + r 1 / r 2
Muzykantov et al. derived an equation for the rate of two-atomic exchange for the case of its strong limitation by stage 2 (Scheme 1) using this mechanism [14,23,24]. They supposed as well that the degree of the population of [ ]v by strongly bound oxygen (Ov) is close to 1, while surface coverage by Os → 0. In this case, the order of reaction for O is close to 0.5. In our study, we considered a more general case when the rate-determining step is unknown. No restrictions will be imposed on the concentration of Ov as well, and only the degree of surface coverage by Os will be supposed as negligible. In this case, rate equations for stages 1 and 2 (Scheme 1) can be represented as follows:
r 1 = k 1 C O 2 ( 1 θ V ) ( 1 θ S ) k 1 C O 2 ( 1 θ V )
r 1 = k 1 θ V θ S
r 2 = k 2 ( 1 θ V ) θ S
r 2 = k 2 θ V ( 1 θ S ) k 2 θ V
Here, θV and θS are the concentrations of Ov and Os, respectively, and ki are the reaction rate constants of the ith stage. Under the conditions of adsorption-desorption equilibrium, the rates of direct and reverse reactions are equal:
k 1 C O 2 ( 1 θ V ) = k 1 θ V θ S
k 2 θ S ( 1 θ V ) = k 2 θ V
We expressed θv and θs solving Equations (8) and (9) simultaneously. Finally, substituting them in Equations (4)–(7), we obtained:
r 1 = r 1 = k 1 C O 2 1 + k 1 C O 2 k 2 / k 1 k 2
r 2 = r 2 = k 1 C O 2 k 2 k 2 / k 1 1 + k 1 C O 2 k 2 / k 1 k 2
S = 1 1 + r 1 / r 2 = 1 1 + k 1 C O 2 k 1 / k 2 k 2
The rate of the reaction of two-atomic exchange can be expressed with the following equation:
R II = r 1 S = k 1 C O 2 1 + a 1 k 1 C O 2 k 2 / k 1 k 2 + k 1 C O 2 / k 2
where
a 1 = 1 + k 1 / k 2
Detailed derivation of the Equations (10)–(14) is given in Appendix B
In the case r 2 > > r 1 (stage 2 is not rate-determining), the following approximate equation is applicable for the description of the two-atomic isotope exchange:
R II k 1 C O 2 1 + k 1 C O 2 k 2 / k 1 k 2
According to Equation (15), the rate equation can have an order dependence on oxygen concentration (n) varying from 0.5 to 1, depending on the value of the k 1 C O 2 k 2 / k 1 k 2 ratio. In the case of k 1 C O 2 k 2 > > k 1 k 2 (reaction equilibrium is shifted to direct steps and, thus, θv → 1), the n value will be close to 0.5. In the opposite case ( k 1 C O 2 k 2 < < k 1 k 2 ) n → 1. According to Equation (13), the n value can be even less than 0.5 in the case k 1 C O 2 > k 2 (the rate of two-atomic exchange is strictly determined by stage 2).

3.5. Mechanism and Equation Rate for N2O Decomposition Reaction

We observed a decrease in N2O conversion in the presence of oxygen in the reaction mixture over FeOx/CeO2 and CoOx/CeO2 (Table 3) and FeOx/(CeO2 + Al2O3) [9] samples, which can be due to the competitive adsorption of N2O and oxygen on the same active sites. Therefore, O2 formation by step 3 is preferable for CeO2-based samples. However, oxygen species localized in anionic vacancies (Ov) are strongly bound with cations, and it is doubtful whether they can diffuse easily on the catalyst surface.
We supposed that the recombination of two oxygen atoms proceeds with the same mechanism as at oxygen exchange, i.e., with the interaction of Ov with Os. The last, in turn, is capable of diffusing on the surface and can result from Ov (lattice oxygen) coming to the surface. The mechanism of N2O decomposition accounting for the above reactions is represented in Scheme 2.
We consider that oxygen re-adsorption by reverse stage 3N (Scheme 2) is negligible because of low oxygen concentration at low N2O conversion values in the experiments done for reaction rate evaluation and fast oxygen washing out from the reactor. In this case, the degree of surface coverage with Os under reaction conditions can be supposed as negligible, like in the reaction of oxygen isotope exchange. One can see that direct and reverse stages 2N and 3N (Scheme 2) are represented in the scheme of oxygen isotope exchange (Scheme 1) as well. Therefore, the rates of these stages can be expressed in terms of rate constants of isotope exchange as follows:
r 2 N = k 2 ( 1 θ V ) θ S
r 2 N = k 2 θ V
r 3 N = k 1 θ V θ S
Designating the rate constant of the stage of N2O adsorption as k1N, one can obtain the equation for r1N:
r 1 N = k 1 N C N 2 O ( 1 θ V )
Under the steady state: r 1 N = r 2 N r 2 N = r 3 N , so the system of steady-state equations looks as follows:
2 k 1 N C N 2 O × ( 1 θ V ) = k 1 × θ V × θ S
k 2 × θ V = k 1 × θ V × θ S + k 2 × ( 1 θ V ) × θ S
Solving Equations (20) and (21) simultaneously, we found θV and θS. Finally, substituting them in the expression for r1N, we obtained the following kinetic equation for the rate of reaction of N2O decomposition (see details in Appendix C):
R N 2 O = 2 k 1 N C N 2 O ( 1 θ V ) = 2 k 1 N C N 2 O 1 + a 2 2 k 1 N C N 2 O k 2 / k 1 k 2 + k 1 N C N 2 O / k 2
where
a 2 = 1 + k 1 / k 2
The following approximate kinetic equation is applicable in the case k 1 N C N 2 O / k 2 (stage 2N is not rate-determining):
R N 2 O = 2 k 1 N C N 2 O ( 1 θ V ) 2 k 1 N C N 2 O 1 + 2 k 1 N C N 2 O k 2 / k 1 k 2
One can see that the equations for RN2O, Equation (22) and RII Equation (13), are close by the form. In the general case, the ratio between the rates of these reactions is determined with the following equation:
R I I R N 2 O = k 1 C O 2 2 k 1 N C N 2 O 1 + a 2 2 k 1 N C N 2 O k 2 / k 1 k 2 + k 1 N C N 2 O / k 2 1 + a 1 k 1 C O 2 k 2 / k 1 k 2 + k 1 C O 2 / k 2
In the case when stages 2 (Scheme 1) and 2N (Scheme 2) are not rate-determining for both reactions, the ratio between rates of these reactions is determined with the following approximate equation:
R I I R N 2 O k 1 C O 2 2 k 1 N C N 2 O 1 + 2 k 1 N C N 2 O k 2 / k 1 k 2 1 + k 1 C O 2 k 2 / k 1 k 2
According to literature data, on oxides, the rate is usually proportional to CN2O or has a slightly lower order due to the inhibition of produced oxygen [36]. In line with this, the dependence of the rate on N2O concentration (varied from 0.15 vol.% to 1.0 vol.%) was around 0.97 for FeOx/CeO2 (Appendix D). Such close to 1 order means that the value of 2 k 1 N C N 2 O k 2 / k 1 k 2 in Equations (24) and (26) is much less than unity. In this case, the ratio between the rates of reactions of two-atomic exchange and N2O decomposition depends on the values of rate constants of the stages of oxygen and N2O adsorption and their concentrations.

3.6. Mobility of Surface Oxygen and Rate Determining Steps of Two Atomic Isotope Exchange and N2O Decomposition Reaction

According to the proposed mechanisms of isotope exchange and N2O decomposition, the mobility of surface oxygen is characterized by the rate of the same stage designated as stage 2 (Scheme 1) and 2N (Scheme 2). One can estimate the rate of this stage in the reaction of isotope exchange directly from experimental data. So, at known ratios of RI and RII (Table 1) to the overall rate of oxygen adsorption-desorption, one can estimate the selectivity of exchange running by different pathways. The rate of oxygen adsorption-desorption is equal to the sum of RI and RII:
r 1 = r 1 = R II + R I
Therefore, the selectivity of the reaction of isotope exchange with the pathway corresponding to the two-atomic exchange (S) will be determined in the following way:
S = R II r 1 = R II R II + R I
At a known r 1 and S, one can calculate the rate of stage 2 (Scheme 1) using Equation (3):
r 2 = r 1 S / ( 1 S )
Calculated values of S and the rates of different stages of isotope exchange in the samples have been presented in Table 4. The value of S for CoOx/CeO2 is low, and the estimation of r2 = r−2, in this case, is quite precise. The higher the selectivity, the less precise the estimate.
The values of θV and θS in the reaction of N2O decomposition can differ from those in isotope exchange, thus resulting in the change of the ratio between rates of these stages. So, the r−2/r−1 ratio in the reaction of isotope exchange is determined with the values corresponding rate constants and θS value:
r 2 r 1 = k 2 θ V k 1 θ V θ S = k 2 k 1 θ S
The ratio r−2N/r3N that determines the rate-determining stage in the reaction of N2O decomposition is the same:
r 2 N r 3 N = k 2 θ V k 1 θ V θ S = k 2 k 1 θ S
The formation of weakly bound oxygen Os proceeds with both stage 2N and stage of oxygen adsorption 3N (Scheme 2). Gas phase oxygen concentration under the conditions of N2O decomposition (<0.01% on average by the length of the catalyst layer) is much less than during isotope exchange experiments (0.5%). Accordingly, we consider that the θS value in the reaction conditions cannot be higher than at isotope exchange. In this case
r 2 N r 3 N r 2 r 1
r 2 >> r 1 for CeO2, NiOx/CeO2, and FeOx/CeO2 samples. Therefore r 2 N >> r 3 N as well. In this case, stages 2 (Scheme 1) and 2N (Scheme 2) are not rate-determining in the reaction of oxygen isotope exchange and in N2O decomposition. The ratio between the rates of these reactions is thus determined with Equation (26) and depends mainly on the ratio of rate constants of the stages of oxygen and N2O adsorption and their concentrations.
In the case of CoOx/CeO2, r 2 < r 1 , i.e., stage 2 is rate-determining in the reaction of isotope exchange. However, it is not so obvious for the reaction of N2O decomposition because r 2 N / r 3 N can be higher than r 2 / r 1 . Finally, the ratio between rates of these reactions will be determined with Equation (25).

3.7. Role of MeOx–CeO2 Interface in the Reactions of Isotope Exchange and N2O Decomposition

Estimates of the rates of different stages made above were based on the assumption of equivalence of all active sites participating in the reactions. It is true only for CeO2. Supporting of MeOx produces other sites which can be responsible for efficient O2 adsorption as well. First of all, these are oxygen vacancies located on the surface of crystalline Fe2O3, NiO, and Co3O4 particles (Figure 4) detected in the samples or their smaller clusters and on the Me–Ce interface. The relative surface concentration of MeOx is reasonably low (Me/Ce = 0.13 ± 0.1) (Table 5), but their contribution to the rate of exchange can be prominent.
We estimated the values of RI and RII on MeOx normalized to their concentration (RI (Me,Ce) and RII (Me,Ce), respectively) using Me/Ce values on the surface as measured with XPS and supposing overall concentration of active sites as 1.67 × 10⁵ mole/m2. Then S values and rates of reactions of stages 1 and 2 (Scheme 1) for isotope exchange on different sites ((r1 = r−1) (Me,Ce) and (r2 = r−2)(Me,Ce)) were calculated as well using Equations (27)–(29) (Table 5).
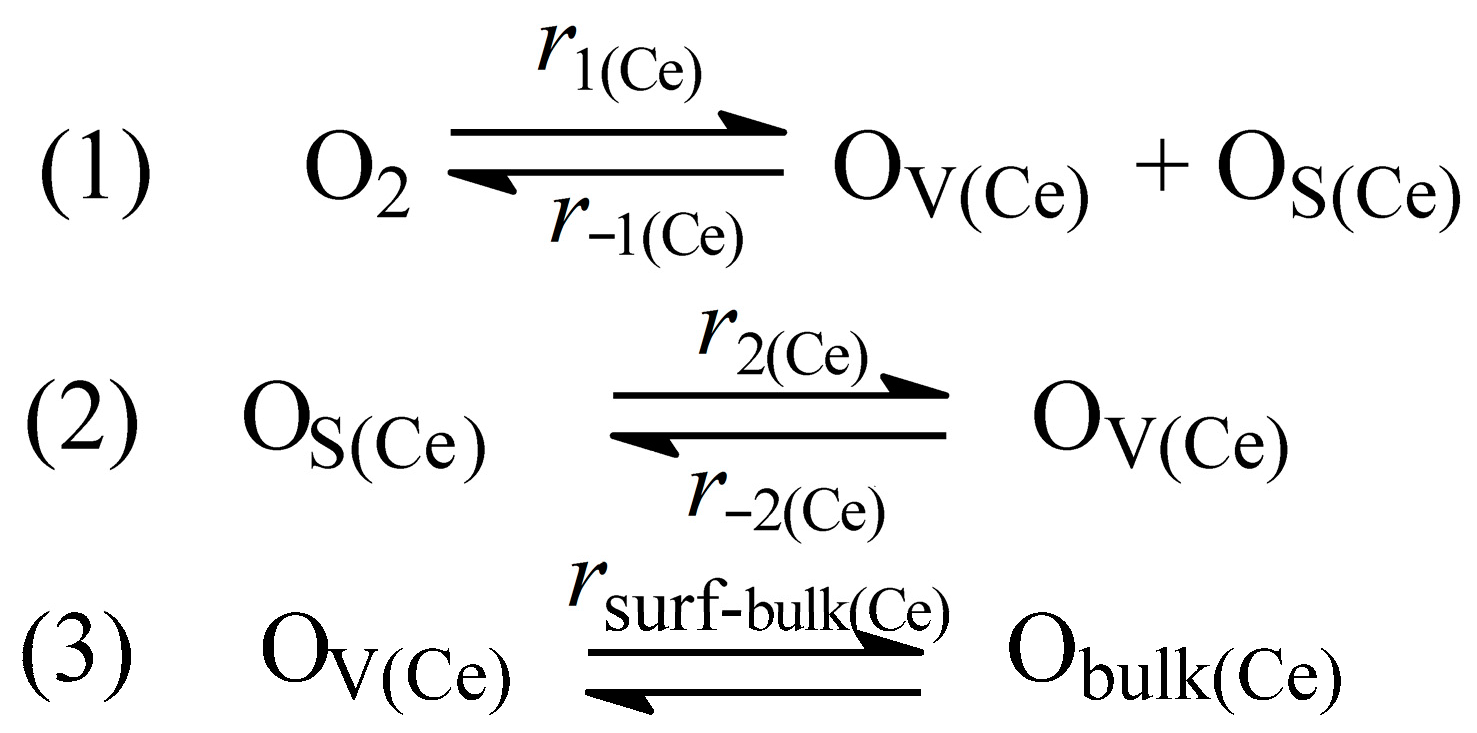
It is logical to suppose that exchange between surface and bulk oxygen on oxides proceeds with the participation of strongly bound oxygen OV. Scheme 3 describes isotope transfer between gas phase O2 and ceria bulk (Obulk(Ce)) for this case.
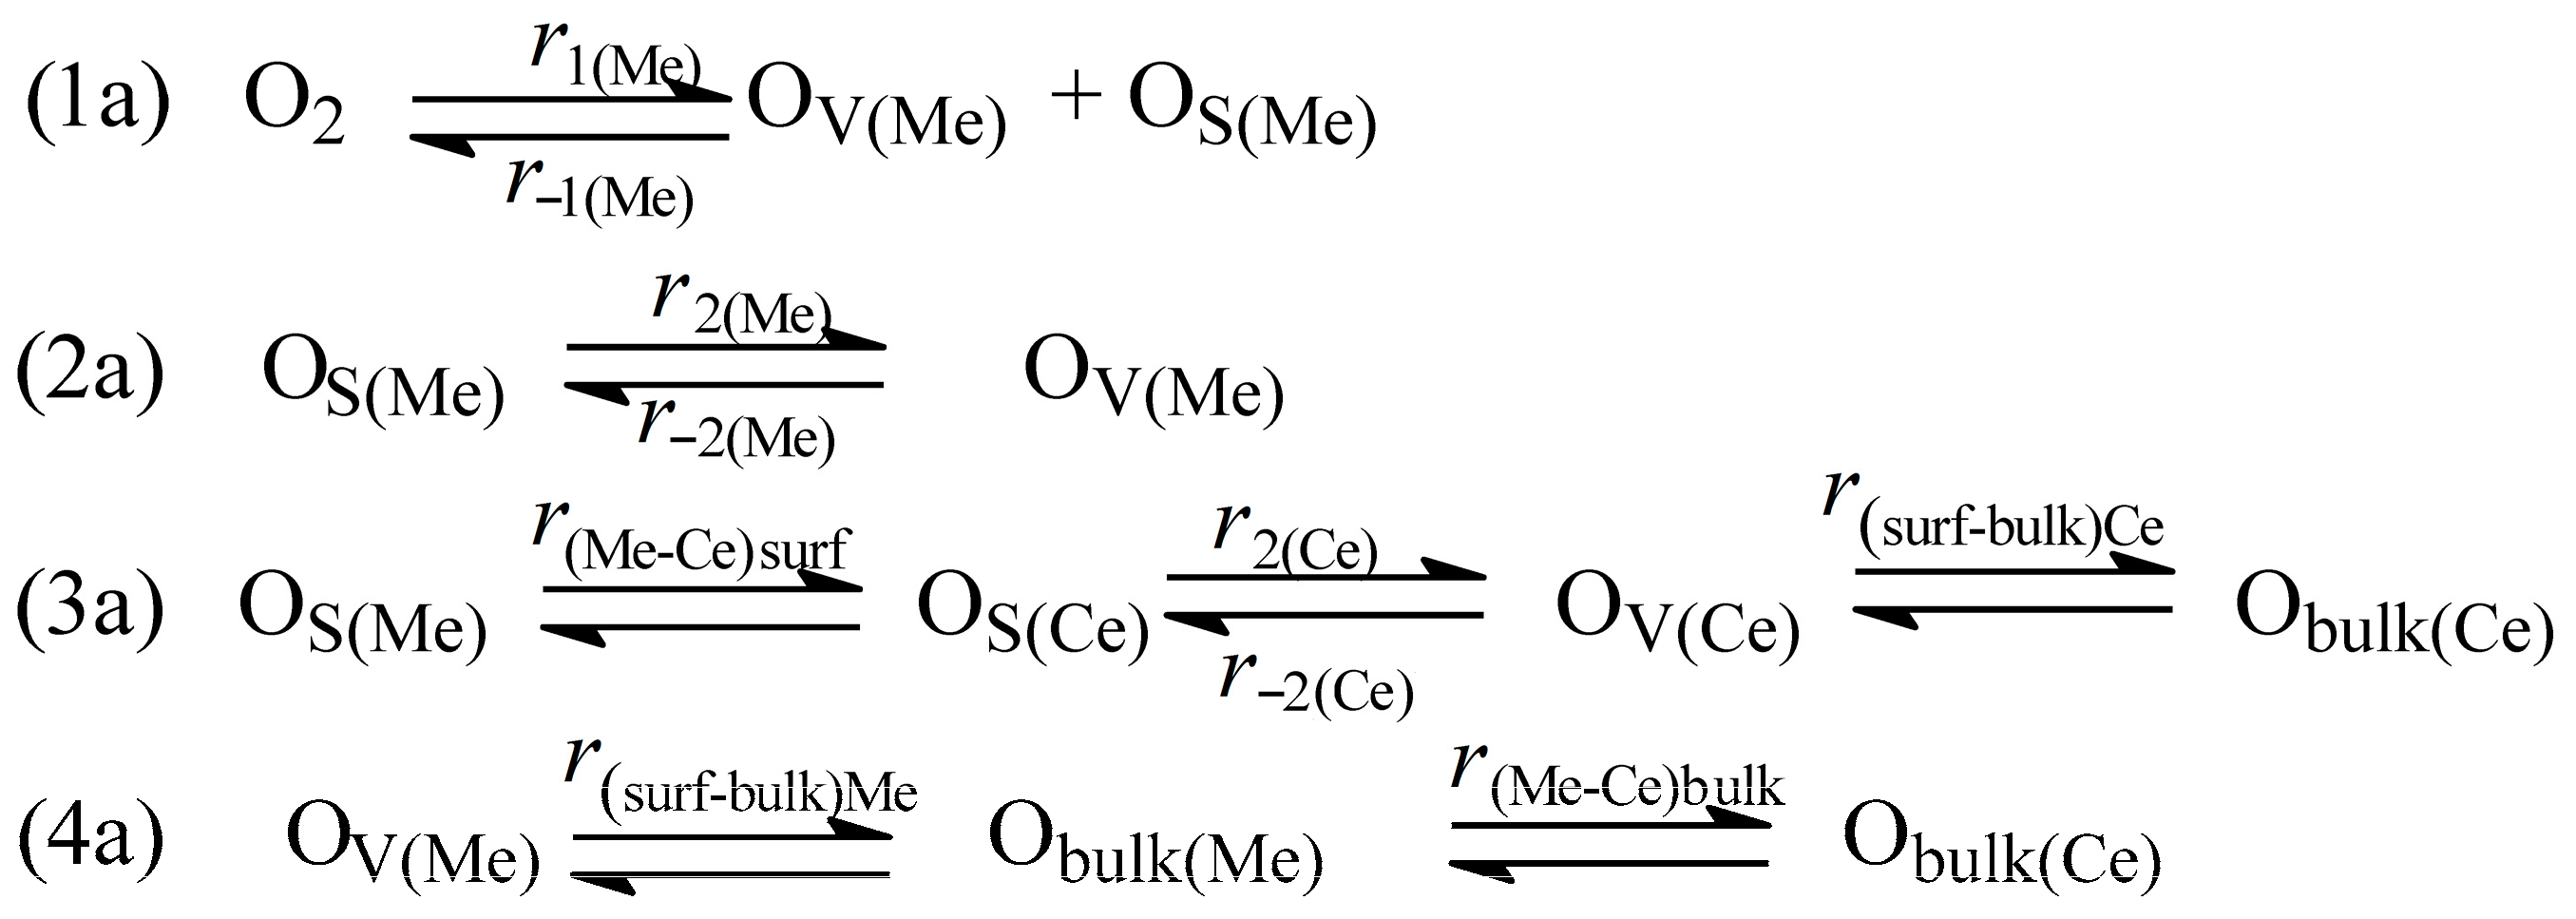
To keep the general rate of heteroexchange and selectivity to the two-atom exchange observed in the experiments, the rate of stage 3 (Scheme 3) should be at least equal to the sum of the rates of stages 1 and 2, i.e., rsurf-bulk(Ce)r1(Ce) + r2(Ce). An additional pathway of isotope transfer between O2 and ceria bulk appears in MeOx/CeO2 samples with the participation of MeOx particles (Scheme 4).
This scheme includes two pathways of isotope transfer from the MeOx particle to Obulk(Ce). Spillover of weakly bound oxygen from the MeOx surface to the CeO2 surface followed by transfer to CeO2 bulk through Ov(Ce) (stage 3a, Scheme 4) provides for the first pathway. By the second pathway (stage 4a), the exchange proceeds first—between strongly bound oxygen of MeOx (OV(Me)) and that in MeOx bulk (Obulk(Me)), and then—between Obulk(Me) and oxygen in CeO2 bulk, Obulk(Ce). The overall rate of isotope transfer by stages 3a and 4a cannot be less than r1(Me) + r2(Me).
Numerical analysis of isotope experiments showed that isotope diffusion to the bulk of CeO2 (Os(Ce) ↔ Obulk(Ce)) is not the rate-determining step of the isotope exchange reaction. This agrees with the results of earlier studies performed on ceria [37], where higher mobility of the oxygen in the lattice than the rate of exchange with the gas phase has been shown. In contrast with CeO2, the rate of isotope exchange of the surface and the bulk oxygen in Fe, Co, Ni, or mixed La-Fe-O oxides is much lower than the rate of exchange with gas phase O2 [37,38,39]. So, in the LaFeO3 sample representing a mixture of perovskite, α-Fe2O3, and La2O3, the rate constant of heteroexchange at 800 °C was 8 s−1, while the rate of oxygen diffusion in bulk was three orders of magnitude lower (6 × 10⁻³ s−1). In CeO2, vice versa, these values were 1.2 s−1 and >0.1 s−1, respectively [39]. Solsona et al. performed 18O2 TPIE experiments and showed that the addition of ceria into the NiO catalysts increases the diffusion of oxygen in the bulk of the samples [40]. Hence, we suppose that the rate of stage 4a in all MeOx/CeO2 samples is negligible compared with the rate of oxygen exchange on the surface of the MeOx particle.
We tried to estimate whether the rate of stage 3a (Scheme 4) can provide an increase in the rate of heteroexchange in MeOx/CeO2 compared with CeO2. At the known Me/Ce value (Table 5), the rate of transfer of isotope label by stage 3a (Scheme 4) will be not higher than r2(Ce)/0.11 = 42 (±20) mole/(mole(Me) × s) for any of MeOx/CeO2 samples. For the case of FeOx/CeO2 and CoOx/CeO2, this value is less than r1(Me) + r2(Me) (Table 5). Therefore, one can conclude that the increase of the rate of isotope exchange in FeOx/CeO2 and CoOx/CeO2 samples compared with that in CeO2 is due to sites on the Me–CeO2 interface characterized by increased concentration of oxygen vacancies promoting oxygen exchange [41,42,43].
For the case of FeOx/CeO2, this is confirmed with 18O2 TPIE experiments on the samples with different Fe content. One can see (Figure 5a) that the increase of Fe content in the sample from 0.86 wt% to 2.5 wt% resulted in a high-temperature shift in the isotope fraction curve, thus evidencing a decrease in the rate of exchange. Non-proportional growth of the Fe/Ce surface ratio (as measured with XPS) from 0.13 to 0.19 only with Fe content in the sample can be due to the enlargement of Fe2O3 particles decreasing the concentration of sites on the Fe–Ce interface. It is interesting that FeOx/CeO2 sample with higher Fe content was also less active in deN2O (Figure 5b). Therefore, reaction on the Me–CeO2 interface contributes more substantially to the overall reaction rate than that on Fe sites.
The results of TG-DTA-MS experiments performed in an oxygen-containing stream [33] showed that cobalt in CoOx–CeO2 catalysts are present in the form of Co3O4/CoO particles and a CoOx–CeO2 system formed on the cobalt oxide–ceria interface. The decrease of N2O conversion under oxygen-deficient conditions at T > 800 °C resulted from the reduction of Co3O4 to CoO in the particles weakly interacting with CeO2. The authors, therefore, concluded that the activity of these catalysts originates from the interaction of cobalt oxide with CeO2. A strong dispersion effect of the cobalt spinel active phase spread over ceria on the turnover rate of deN2O was observed due to the progressive agglomeration of the Co3O4 nanocrystallites into compact domains with the increasing cobalt loading [44]. Model supposing the cylindrical shape of Co3O4 domains permitted normalizing the deN2O reaction rate with respect to the cobalt content and the length of the Co3O4/CeO2 interface periphery. The authors proposed a two-step mechanism operating at the interface, where the redox properties of the cobalt component were responsible for the dissociation of N2O molecules and formation of oxygen intermediates, whereas the ceria periphery was responsible for the enhanced diffusion and recombination of oxygen adspecies, closing the catalytic cycle.
For the NiOx/CeO2 sample, we did not observe the effect of the Ni-ceria interface on the rate of oxygen transfer. Indeed, a minimal red shift of the CeO2 absorption edge was observed in the UV-vis DR spectra of the NiOx/CeO2 sample compared to that in the CeO2 (Eg value of 3.35 eV and 3.27 eV, respectively). For the CoOx/CeO2 and FeOx/CeO2 samples, Eg values were substantially lower (3.18–3.22 eV) [8]. It indicates that either (1) Fe/Co ions substitute Ce into the CeO2 lattice, or (2) the isolated Me ions form a mixed Me–Ce oxide and strongly interact with CeO2 leading to the electronic structure changes [45]. The additional absorption band at ~20,000–23,500 cm−1 in the spectra of Co(Fe)Ox/CeO2 samples [8] is due to O2 adsorption on the structural defect; more obviously, clusters of oxygen vacancies arose on Fe(Co)-CeO2 interface.

4. Conclusions

Oxygen transfer on the surface and in the bulk of CeO2 and MeOx/CeO2 (Me = Fe, Co, Ni) catalysts was studied using 18O isotope exchange. The relationship between this process and the kinetics of the reaction of N2O decomposition was elucidated.
Supporting of MeOx onto CeO2 increased the rate of isotope exchange by 20% (Ni), threefold (Fe), and more than ten times (Co). Both single-atom and two-atom exchanges proceed simultaneously in all samples: two-atom exchange predominates in CeO2, NiOx/CeO2, and FeOx/CeO2, while the one-atom exchange prevails in CoOx/CeO2. One can interpret both types of exchange using a two-step mechanism [14,18,19], considering two forms of surface oxygen. With this mechanism, weakly bound oxygen (Os) can diffuse on the surface and can transform into a strongly bound form (Ov) after interaction with anionic vacancy. The contribution of every type of exchange to the overall rate of heteroexchange depends on the ratio of the rate of recombination of Os and Ov and the rate of their interconversion. The last, in turn, characterizes the mobility of the surface oxygen. We obtained estimates of the surface oxygen mobility in CeO2-based samples using such a model. It turned out that CeO2 promotion using FeOx and NiOx increases the mobility of surface oxygen, while it doesn’t change in the case of CoOx. It is shown that the mobility of surface oxygen can determine the rate of the reaction of N2O decomposition on CoOx/CeO2. On other samples, it is determined by the rate of N2O adsorption.
Detailed analysis of the kinetics of isotope exchange accounting for the surface concentration of MeOx made it possible to estimate their contribution to the rates of different types of exchange and quantify the rates of oxygen transfer from MeOx to the bulk of CeO2 by different pathways. Oxygen transfer from MeOx to the bulk of CeO2 realized on the Me–Ce interface is shown to be important in FeOx/CeO2 and CoOx/CeO2 and makes a prominent contribution to the overall rate of exchange in these samples. Direct dependence of the rate of isotope exchange in FeOx/CeO2 samples with different Fe content on the length of the FeOx-CeO2 interface was shown. The analogous effect was observed for the rate of deN2O reaction, which points to the principal role of the interface in both reactions.

Author Contributions

Conceptualization, L.P. and E.S.; methodology, E.S. and L.P., investigation, L.P., E.S. and I.P.; writing—original draft preparation, E.S., L.P. and I.P.; visualization, E.S. and L.P.; writing—review and editing E.S. and L.P.; formal analysis, E.S. and V.S.; supervision, L.P. All authors have read and agreed to the published version of the manuscript.

Funding

This work was supported by the Ministry of Science and Higher Education of the Russian Federation within the governmental order for the Boreskov Institute of Catalysis (project AAAA-A21-121011390010-7).

Conflicts of Interest

The authors declare no conflict of interest.

Appendix A. Numerical Analysis of Temperature Programmed Isotope Exchange of Oxygen

The model of isotope exchange in the plug flow reactor represents the system of hyperbolic and ordinary differential equations:
β α T + 1 τ α ξ = b ( 0.5 R I + R II ) ( α O X α )
β α s T = ( 0.5 R 1 + R 2 ) ( α g α s ) N b u l k N S D h 2 α b u l k η | η = 1
β α O b u l k T = D h 2 2 α O b u l k η 2
β f 34 T + 1 τ f 34 ξ = b [ R I ( α ( 1 α O X ) + α O X ( 1 α ) f 34 ( I ) ) + R II ( 2 α O X ( 1 α O X ) f 34 ( II ) ) ]
R ( i ) = R r e f ( i ) exp ( E / R T * ) ,   D ( i ) = D r e f ( i ) exp ( E / R T * ) ,   T * = T T r e f T r e f T
Initial and boundary conditions:
T = T 0 :   α = α O X = f 34 = 0
ξ = 0 :   α = α i n p u t
η = 1 :   α b u l k = α s ,   η = 0 :   α b u l k η = 0
Here, α is an atomic fraction of 18O in O2, f34 is a fraction of 16O18O in O2, β is the rate of heating, τ is the residence time (s), and ξ is the dimensionless reactor length. The atomic fraction of 16O2 ( f 32 ) is expressed in terms of α and f 34 as f 32 = 1 α 0.5 f 34 .
Values τ and b in the plug flow reactor can be determined as follows:
τ = V R U ,   b = N O X N G = L O X W 2 C O 2 N A V R
where U is the flow rate [cm3/s], V is the gas phase volume [cm3], L is the number of oxygen atoms per gram of catalyst [mol/g], W is the catalyst weight [g], C O 2 is the gas phase oxygen concentration (mol/mol), NA is the number of gas molecules per unit volume [mol/cm3].
The system of Equations (A1)–(A4) was solved numerically. ξ derivatives were replaced with difference quotients of second-order approximation. A derived system of ordinary differential equations (ODE) was solved using the fifth-order Runge-Kutta-Merson method. Calculations with 2- and 10-fold decreased increments of ξ were used to estimate the accuracy of the solution and check out the stability of the system.

Appendix B. Derivation of an Equation for the Rate Oxygen Two-Atom Exchange

The system of equations of material balance of oxygen under the conditions of adsorption-desorption equilibrium is written as follows:
k 1 C O 2 ( 1 θ V ) = k 1 θ V θ S
k 2 θ S ( 1 θ V ) = k 2 θ V
One can express θS from Equation (A6):
θ S = k 2 θ V k 2 ( 1 θ V )
and substitute it for Equation (A5):
k 1 C O 2 ( 1 θ V ) = k 1 θ V k 2 θ V k 2 ( 1 θ V )
or
θ V 1 θ V = k 1 C O 2 k 2 / k 1 k 2
One can express θV and (1 − θV) from Equation (A9):
θ V = k 1 C O 2 k 2 / k 1 k 2 1 + k 1 C O 2 k 2 / k 1 k 2
1 θ V = 1 1 + k 1 C O 2 k 2 / k 1 k 2
and substitute them to Equation (A7), resulting in:
θ S = k 2 θ V k 2 ( 1 θ V ) = k 1 C O 2 k 2 / k 1 k 2
Substitution of Equations (A10)–(A12) in the equations of the rates of steps 1 and 2 results in:
r 1 = r 1 = k 1 C O 2 1 + k 1 C O 2 k 2 / k 1 k 2
r 2 = r 2 = k 2 k 1 C O 2 k 2 / k 1 k 2 1 + k 1 C O 2 k 2 / k 1 k 2
r 1 / r 2 = k 1 C O 2 k 2 k 1 C O 2 k 2 / k 1 k 2 = k 1 C O 2 k 1 / k 2 k 2
In this case selectivity of two-atom exchange can be represented using the following equation:
S = 1 1 + r 1 / r 2 = 1 1 + k 1 C O 2 k 1 / k 2 k 2
As a result, we obtained the following equation describing the rate of two-atom exchange:
R II = r 1 S = k 1 C O 2 ( 1 + k 1 C O 2 k 2 / k 1 k 2 ) ( 1 + k 1 C O 2 k 1 / k 2 k 2 ) = k 1 C O 2 1 + ( 1 + k 1 / k 2 ) k 1 C O 2 k 2 / k 1 k 2 + k 1 C O 2 / k 2
Provided r 1 / r 2 = k 1 C O 2 k 1 / k 2 k 2 << 1, i.e., r1 is rate-determining (S ≈ 1), then:
R II r 1 = k 1 C O 2 1 + k 1 C O 2 k 2 / k 1 k 2

Appendix C. Derivation of an Equation for Steady State Rate of N2O Decomposition

The system of equations of material balance under steady-state conditions of N2O decomposition reaction can be written as follows:
2 k 1 N C N 2 O ( 1 θ V ) = k 1 θ V θ S
k 2 θ V = k 1 θ V θ S + k 2 ( 1 θ V ) θ S
One can express θS from Equation (A20):
θ S = k 2 θ V k 1 θ V + k 2 ( 1 θ V )
and substitute it for Equation (A19):
2 k 1 N C N 2 O ( 1 θ V ) = k 1 θ V k 2 θ V k 1 θ V + k 2 ( 1 θ V )
or
θ V 2 ( 1 θ V ) 2 2 k 1 N C N 2 O k 2 θ V ( 1 θ V ) 2 k 1 N C N 2 O k 2 k 1 k 2 = 0
Designating B = k 1 N C N 2 O / k 2 one can obtain the following quadratic equation:
θ V 2 ( 1 θ V ) 2 2 B θ V ( 1 θ V ) 2 B k 2 k 1 = 0
Its solving results in:
θ V ( 1 θ V ) = B + B + 2 B k 2 / k 1
One can express θV and (1 − θV) from Equation (A25):
θ V = B + B + 2 B k 2 / k 1 1 + ( B + B + 2 B k 2 / k 1 )
( 1 θ V ) = 1 1 + B + B + 2 B k 2 / k 1
Substitution of Equation (A27) to the equation of the rate for stage 1 results in:
R N 2 O = 2 r 1 N = 2 k 1 N C N 2 O ( 1 θ V ) = 2 k 1 N C N 2 O 1 + B + B + 2 B k 2 / k 1 = 2 k 1 N C N 2 O 1 + k 1 N C N 2 O / k 2 + k 1 N C N 2 O / k 2 + 2 k 1 N C N 2 O k 2 / k 1 k 2 = 2 k 1 N C N 2 O 1 + 2 k 1 N C N 2 O k 2 / k 1 k 2 1 + k 1 / k 2 + k 1 N C N 2 O / k 2
In the case k 1 N C N 2 O < < k 2 , i.e., stage of N2O adsorption is rate-determining, then Equation (A28) can be reduced to:
R N 2 O 2 k 1 N C N 2 O 1 + 2 k 1 N C N 2 O k 2 / k 1 k 2

Appendix D. Determination of the Order of deN2O Reaction Rate on FeOx/CeO2

We used the standard procedure of linearization for logarithmic dependence of the reaction rate on the logarithm of concentration (Figure A1) to determine the order of reaction for N2O. Data of the rates were obtained at two concentrations of N2O (0.15% and 1.0%) and three temperatures (600 °C, 650 °C, and 700 °C). The calculated order of the reaction (n) in this temperature interval was close to 1: n = 0.94 (700 °C), n = 1.00 (650 °C), n = 0.91 (600 °C). We did not reveal any dependence of n on the temperature and consider that observed dispersion is due to an error in reaction rate value measuring. The average value of n in this temperature interval is 0.97.
Figure A1. Dependence of the logarithm of the reaction rate on the logarithm of N2O concentration (% vol) at different temperatures.
Materials 16 00929 g0a1

References

  1. Kapteijn, F.; Marban, G.; Rodriguez-Mirasol, J.; Moulijn, J.A. Kinetic Analysis of the Decomposition of Nitrous Oxide over ZSM-5 Catalysts. J. Catal. 1997, 167, 256–265. [Google Scholar] [CrossRef]
  2. Pérez-Ramírez, J.; Mul, G.; Kapteijn, F.; Moulijn, J.A. NO-Assisted N2O Decomposition over Fe-Based Catalysts: Effects of Gas-Phase Composition and Catalyst Constitution. J. Catal. 2002, 208, 211–223. [Google Scholar] [CrossRef]
  3. Fu, C.M.; Korchak, V.N.; Hall, W.K. Decomposition of nitrous oxide on FeY zeolite. J. Catal. 1981, 68, 166–171. [Google Scholar] [CrossRef]
  4. Raj, S.L.; Srinivasan, V. Decompositi90049on of nitrous oxide on rare earth manganites. J. Catal. 1980, 65, 121–126. [Google Scholar] [CrossRef]
  5. Sazonov, L.A.; Moskvina, Z.V.; Artamonov, E.V. Investigation of catalytic properties of LnMeO3 oxides in oxygen homomolecular exchange reaction. Kinet. Catal. 1974, 15, 120–126. (In Russian) [Google Scholar]
  6. Winter, E.R.S. Exchange reactions of oxides. Part IX. J. Chem. Soc. A 1968, 2889–2902. [Google Scholar] [CrossRef]
  7. Ivanov, D.V.; Sadovskaya, E.M.; Pinaeva, L.G.; Isupova, L.A. Influence of oxygen mobility on catalytic activity of La–Sr–Mn–O composites in the reaction of high temperature N2O decomposition. J. Catal. 2009, 267, 5–13. [Google Scholar] [CrossRef]
  8. Pinaeva, L.G.; Prosvirin, I.P.; Dovlitova, L.S.; Danilova, I.G.; Sadovskaya, E.M.; Isupova, L.A. MeOx/Al2O3 and MeOx/CeO2 (Me = Fe, Co, Ni) catalysts for high temperature N2O decomposition and NH3 oxidation. Catal. Sci. Technol. 2016, 6, 2150–2161. [Google Scholar] [CrossRef] [Green Version]
  9. Pinaeva, L.; Prosvirin, I.; Chesalov, Y.; Atuchin, V. High-Temperature Abatement of N2O over FeOx/CeO2-Al2O3 Catalysts: The Effects of Oxygen Mobility. Catalysts 2022, 12, 938. [Google Scholar] [CrossRef]
  10. Kondratenko, E.V.; Pérez-Ramírez, J. Mechanism and Kinetics of Direct N2O Decomposition over Fe−MFI Zeolites with Different Iron Speciation from Temporal Analysis of Products. J. Phys. Chem. B 2006, 110, 22586–22595. [Google Scholar] [CrossRef]
  11. Kondratenko, E.V.; Pérez-Ramírez, J. Micro-kinetic analysis of direct N2O decomposition over steam-activated Fe-silicalite from transient experiments in the TAP reactor. Catal. Today 2007, 121, 197–203. [Google Scholar] [CrossRef]
  12. Kondratenko, E.V.; Kondratenko, V.A.; Santiago, M.; Pérez-Ramírez, J. Mechanistic origin of the different activity of Rh-ZSM-5 and Fe-ZSM-5 in N2O decomposition. J. Catal. 2008, 256, 248–258. [Google Scholar] [CrossRef]
  13. Kondratenko, E.V.; Kondratenko, V.A.; Santiago, M.; Pérez-Ramírez, J. Mechanism and micro-kinetics of direct N2O decomposition over BaFeAl11O19 hexaaluminate and comparison with Fe-MFI zeolites. Appl. Catal. B Environ. 2010, 99, 66–73. [Google Scholar] [CrossRef]
  14. Boreskov, G.K.; Muzykantov, V.S. Investigation of Oxide-Type Oxidation Catalysts by Reactions of Oxygen Isotopic Exchange. Ann. N. Y. Acad. Sci. 1973, 213, 137–170. [Google Scholar] [CrossRef] [PubMed]
  15. Li, C.; Domen, K.; Maruya, K.; Onishi, T. Oxygen exchange reactions over cerium oxide: An FT-IR study. J. Catal. 1990, 123, 436–442. [Google Scholar] [CrossRef]
  16. Binet, C.; Daturi, M.; Lavalley, J.C. IR study of polycrystalline ceria properties in oxidised and reduced states. Catal. Today 1999, 50, 207–225. [Google Scholar] [CrossRef]
  17. Gross, M.S.; Ulla, M.A.; Querini, C.A.J. Diesel particulate matter combustion with CeO2 as catalyst. Part I: System characterization and reaction mechanism. Mol. Catal. A 2012, 352, 86–94. [Google Scholar] [CrossRef]
  18. Winter, E.R.S. The reactivity of oxide surfaces. Adv. Catal. 1958, 10, 196–241. [Google Scholar] [CrossRef]
  19. Duprez, D. Isotopes in Heterogeneous Catalysis; Imperial College Press: London, UK, 2006; pp. 133–181. [Google Scholar] [CrossRef]
  20. Boreskov, G.K. The catalysis of isotopic exchange in molecular oxygen. Adv. Catal. 1965, 15, 285–339. [Google Scholar] [CrossRef]
  21. Klier, K.; Nováková, J.; Jíru, P. Exchange Reactions of Oxygen between Oxygen Molecules and Solid Oxides. J. Catal. 1963, 2, 479–484. [Google Scholar] [CrossRef]
  22. Klier, K.; Kučera, E. Theory of exchange reactions between fluids and solids with tracer diffusion in the solid. J. Phys. Chem. Solids 1966, 27, 1087–1095. [Google Scholar] [CrossRef]
  23. Muzykantov, V.S. Isotopic Studies of Dioxygen Activation on Oxide Catalysts for Oxidation: Problems, Results and Perspectives. React. Kinet. Catal. Lett. 1987, 35, 437–447. [Google Scholar] [CrossRef]
  24. Muzykantov, V.S.; Kemnitz, E.; Sadykov, V.A.; Lunin, V.V. Interpretation of Isotope Exchange Data “without Time”: Nonisothermal Exchange of Dioxygen with Oxides. Kinet. Catal. 2003, 44, 319–322. [Google Scholar] [CrossRef]
  25. Borovskikh, L.; Mazo, G.; Kemnitz, E. Reactivity of oxygen of complex cobaltates La1−xSrxCoO3−δ and LaSrCoO4. Solid State Sci. 2003, 5, 409–417. [Google Scholar] [CrossRef]
  26. Galdikas, A.; Duprez, D.; Descorme, C. A novel dynamic kinetic model of oxygen isotopic exchange on a supported metal catalyst. Appl. Surf. Sci. 2004, 236, 342–355. [Google Scholar] [CrossRef]
  27. Ivanov, D.V.; Pinaeva, L.G.; Isupova, L.A.; Sadovskaya, E.M.; Prosvirin, I.P.; Gerasimov, E.Y.; Yakovleva, I.S. Effect of surface decoration with LaSrFeO4 on oxygen mobility and catalytic activity of La0.4Sr0.6FeO3−δ in high-temperature N2O decomposition, methane combustion and ammonia oxidation. Appl. Catal. A 2013, 457, 42–51. [Google Scholar] [CrossRef]
  28. Muzykantov, V.S.; Popovskii, V.V.; Boreskov, G.R. Kinetics of isotope exchange in a mocecular oxygen-solid oxide system. Kinet. Catal. 1964, 5, 624–629. (In Russian) [Google Scholar]
  29. Vasiliades, M.A.; Harris, D.; Stephenson, H.; Boghosian, S.; Efstathiou, A.M. A Novel Analysis of Transient Isothermal 18O Isotopic Exchange on Commercial CexZr1−xO2−δ-based OSC Materials. Top. Catal. 2019, 62, 219–226. [Google Scholar] [CrossRef]
  30. Cortés-Reyes, M.; Martínez-Munuera, J.C.; Herrera, C.; Larrubia, M.Á.; Alemany, L.J.; García-García, A. Isotopic study of the influence of oxygen interaction and surface species over different catalysts on the soot removal mechanism. Catal. Today 2022, 384–386, 33–44. [Google Scholar] [CrossRef]
  31. Artsiusheuski, M.A.; van Bokhoven, J.A.; Sushkevich, V.L. Oxygen Isotope Exchange over Copper-Containing Mordenite: The Effect of Copper Loading and Si/Al Ratio. J. Phys. Chem. C 2021, 125, 26512–26521. [Google Scholar] [CrossRef]
  32. Wilczkowska, E.; Krawczyk, K.; Petryk, J.; Sobczak, J.W.; Kaszkur, Z. Direct nitrous oxide decomposition with a cobalt oxide catalyst. Appl. Catal. A Gen. 2010, 389, 165–172. [Google Scholar] [CrossRef]
  33. Iwanek, E.K.; Krawczyk, J.; Petryk, J.W.; Sobczak, J.W.; Kaszkur, Z. Direct nitrous oxide decomposition with CoOx-CeO2 catalysts. Appl. Catal. B Environ. 2011, 106, 416–422. [Google Scholar] [CrossRef]
  34. Eley, D.D.; Rideal, E.K. The catalysis of the parahydrogen conversion by tungsten. Proc. R. Soc. Lond. 1941, 178, 429–451. [Google Scholar] [CrossRef]
  35. Farkas, A.; Farkas, L. Experiments on heavy hydrogen—Part I. Proc. R. Soc. A Math. Phys. Eng. Sci. 1934, 144, 467–480. [Google Scholar] [CrossRef]
  36. Kaptein, F.; Rodrigues-Mirasol, J.; Moulijn, J.A. Heterogeneous catalytic decomposition of nitrous oxide. Appl. Catal. B Environ. 1996, 9, 25–64. [Google Scholar] [CrossRef]
  37. Boreskov, G.K.; Kasatkina, L.A. Catalysis of Isotope Exchange in Molecular Oxygen and Its Application to the Study of Catalysts. Russ. Chem. Rev. 1968, 37, 613–628. [Google Scholar] [CrossRef]
  38. Popovskij, V.V.; Boreskov, G.K. Kinetics of isotope exchange of molecular oxygen and oxygen of the surface of iron, cobalt, nickel and copper oxides. Kinet. Catal. 1960, 1, 566–575. (In Russian) [Google Scholar]
  39. Pinaeva, L.; Isupova, L.; Prosvirin, I.; Sadovskaya, E.; Danilova, I.; Ivanov, D.; Gerasimov, E. La–Fe–O/CeO2 Based Composites as the Catalysts for High Temperature N2O Decomposition and CH4 Combustion. Catal. Lett. 2013, 143, 1294–1303. [Google Scholar] [CrossRef]
  40. Solsona, B.; Concepción, P.; Hernández, S.; Demicol, B.; López Nieto, J.M. Oxidative dehydrogenation of ethane over NiO–CeO2 mixed oxides catalysts. Catal. Today 2012, 180, 51–58. [Google Scholar] [CrossRef]
  41. Nagasawa, T.; Kobayashi, A.; Sato, S.; Kosaka, H.; Kim, K.; You, H.M.; Hanamura, K.; Terada, A.; Mishima, T. Visualization of oxygen storage process in Pd/CeO2-ZrO2 three-way catalyst based on isotope quenching technique. Chem. Eng. J. 2023, 453, 139937. [Google Scholar] [CrossRef]
  42. Zasada, F.; Grybos, J.; Budiyanto, E.; Janas, J.; Sojka, Z. Oxygen species stabilized on the cobalt spinel nano-octahedra at various reaction conditions and their role in catalytic CO and CH4 oxidation, N2O decomposition and oxygen isotopic exchange. J. Catal. 2019, 371, 224–235. [Google Scholar] [CrossRef]
  43. Marinho, A.L.A.; Rabelo-Neto, R.C.; Epron, F.; Bion, N.; Noronha, F.B.; Toniolo, F.S. Pt nanoparticles embedded in CeO2 and CeZrO2 catalysts for biogas upgrading: Investigation on carbon removal mechanism by oxygen isotopic exchange and DRIFTS. J. CO2 Util. 2021, 49, 101572. [Google Scholar] [CrossRef]
  44. Grzybek, G.; Stelmachowski, P.; Gudyka, S.; Indyka, P.; Sojka, Z.; Guillén-Hurtado, N.; Rico-Pérez, V.; Bueno-López, A.; Kotarba, A. Strong dispersion effect of cobalt spinel active phase spread over ceriafor catalytic N2O decomposition: The role of the interface periphery. Appl. Catal. B 2016, 180, 622–629. [Google Scholar] [CrossRef] [Green Version]
  45. Zhang, R.; Miller, J.T.; Baertsch, C.D. Identifying the active redox oxygen sites in a mixed Cu and Ce oxide catalyst by in situ X-ray absorption spectroscopy and anaerobic reactions with CO in concentrated H2. J. Catal. 2012, 294, 69–78. [Google Scholar] [CrossRef]
Figure 1. Change of 18O fraction in O2 during temperature-programmed isotope exchange in different CeO2-based catalyst samples. Me = 0.86–0.91 wt.%. Points—experiment, lines—calculation.
Materials 16 00929 g001
Figure 2. Change of 16O2 and 16O18O fractions in O2 during TPIE in different samples. Me concentration—0.86–0.91 wt.%. Points—experiment, lines—calculation.
Materials 16 00929 g002
Figure 3. Rates of the reaction of N2O decomposition (RN2O) versus reverse temperature dependencies for different catalysts. Me concentration—0.86–0.91 wt.%. Inlet reaction mixture composition: 0.15%N2O in He. T = 600–900 °C.
Materials 16 00929 g003
Scheme 1. Mechanism of oxygen isotope exchange on the surface of solid oxide.
Materials 16 00929 sch001
Scheme 2. Mechanism of the reaction of N2O decomposition.
Materials 16 00929 sch002
Figure 4. XRD patterns of MeOx/CeO2 (Me = Fe, Co, Ni) samples. Me concentration—0.86–0.91 wt.%.
Materials 16 00929 g004
Scheme 3. Mechanism of isotope transfer in CeO2.
Materials 16 00929 sch003
Scheme 4. Mechanism of isotope transfer in MeOx/CeO2 samples.
Materials 16 00929 sch004
Figure 5. Oxygen isotope fraction during 18O2 TPIE (a) and N2O conversion variation with temperature (b) for FeOx/CeO2 samples with different Fe content (•—0.86 wt.% Fe, o—2.5 wt.% Fe). Inlet mixture composition: 0.15% N2O in He, 60 L/h.
Materials 16 00929 g005
Table 1. Quantities of exchangeable oxygen during TPIE (NO, 1 × 10²¹ at/g), rate values R, RI, RII (mole/m2s) for different types of oxygen exchange at reference temperature 750 °C and their activation energies ER (kJ/mole) for different samples.
SampleNOR × 105RI × 105RII × 105RII/RER
CeO24.5 10.42 (±0.02)0.03 (±0.01)0.4 (±0.02)0.95 (±0.05)170 (±10)
NiOx/CeO22.2 20.52 (±0.02)0.03 (±0.01)0.5 (±0.02)0.96 (±0.55)170 (±10)
FeOx/CeO25.4 11.4 (±0.08)0.1 (±0.02)1.3 (±0.08)0.93 (±0.04)175 (±10)
CoOx/CeO26.426 (±1)41 (±1)5.5 (±0.5)0.21 (±0.02)160 (±10)
1 not complete exchange (see Figure 1). 2 not complete exchange (heating up to 820 °C only, afterward, the constant temperature was kept, see Figure 1).
Table 2. Rates of the reaction of N2O decomposition (RN2O) and oxygen isotope exchange (R, RII) at 750 °C. Inlet reaction mixture compositions: 0.15% N2O in He and 0.5% O2 in He, respectively.
SampleRN2O × 106, mol/m2sERN2O, kJ/moleRII/RN2OR/RN2O
CeO20.271521516
NiOx/CeO20.7315377
FeOx/CeO23.215655
CoOx/CeO23.71381470
Table 3. Effect of oxygen presence in the 0.15% N2O in He mixture on N2O conversion over CeO2-based samples. 900 °C.
SampleN2O Conversion, %
0.15% N2O in He0.15% N2O + 3% O2 in He
FeOx/CeO272.863.8
CoOx/CeO270.865.4
Table 4. Selectivity to two-atom exchange (S) and rates of different stages of oxygen isotope exchange.
SampleS(r1 = r−1) × 105
mol/m2s
(r2 = r−2) × 105
mol/m2s
r2(−2)/r1(−1)
CeO20.93 (±0.04)0.43 (±0.03)8 (±3)20 (±10)
NiOx/CeO20.94 (±0.04)0.53 (±0.03)15 (±7)30 (±20)
FeOx/CeO20.92 (±0.04)1.4 (±0.1)16 (±5)12 (±5)
CoOx/CeO20.12 (±0.01)46 (±1.5)7 (±1)0.15
Table 5. Me/Ce (Me = Ni, Fe, Co) atomic ratios in the surface layers (XPS) of different MeOx/CeO2 samples, normalized rates of isotope exchange on MeOx and CeO2 (RI (Me,Ce) and RII (Me,Ce)) and rates of reactions of stages 1 and 2 (Scheme 1) of isotope exchange on different sites ((r1 = r−1) (Me,Ce) and (r2 = r−2) (Me,Ce)). Me concentration—0.86–0.91 wt.%.
SampleMe/CeRI (Me,Ce), s−1RII (Me,Ce), s−1(r1 = r−1) (Me,Ce), s−1(r2 = r−2) (Me,Ce), s−1
CeO2 0.0150.2450.26 (±0.02)4.8 (±2)
NiOx/CeO20.120.040.680.72 (±0.02)12 (±6)
FeOx/CeO20.130.44.34.7 (±0.05)48 (±15)
CoOx/CeO20.1419023210 (±7)25 (±3)
Disclaimer/Publisher’s Note: The statements, opinions and data contained in all publications are solely those of the individual author(s) and contributor(s) and not of MDPI and/or the editor(s). MDPI and/or the editor(s) disclaim responsibility for any injury to people or property resulting from any ideas, methods, instructions or products referred to in the content.