
Green Synthesis of ZnO/SnO2 Hybrid Nanocomposite for Degradation of Cationic and Anionic Dyes under Sunlight Radiation


Abstract
:1. Introduction
2. Materials and Methods
2.1. Materials and Reagents
2.2. Preparation of Catalysts
2.3. Photocatalytic Dye Degradation
2.4. Characterization
3. Results and Discussion
3.1. Catalyst Characterizations
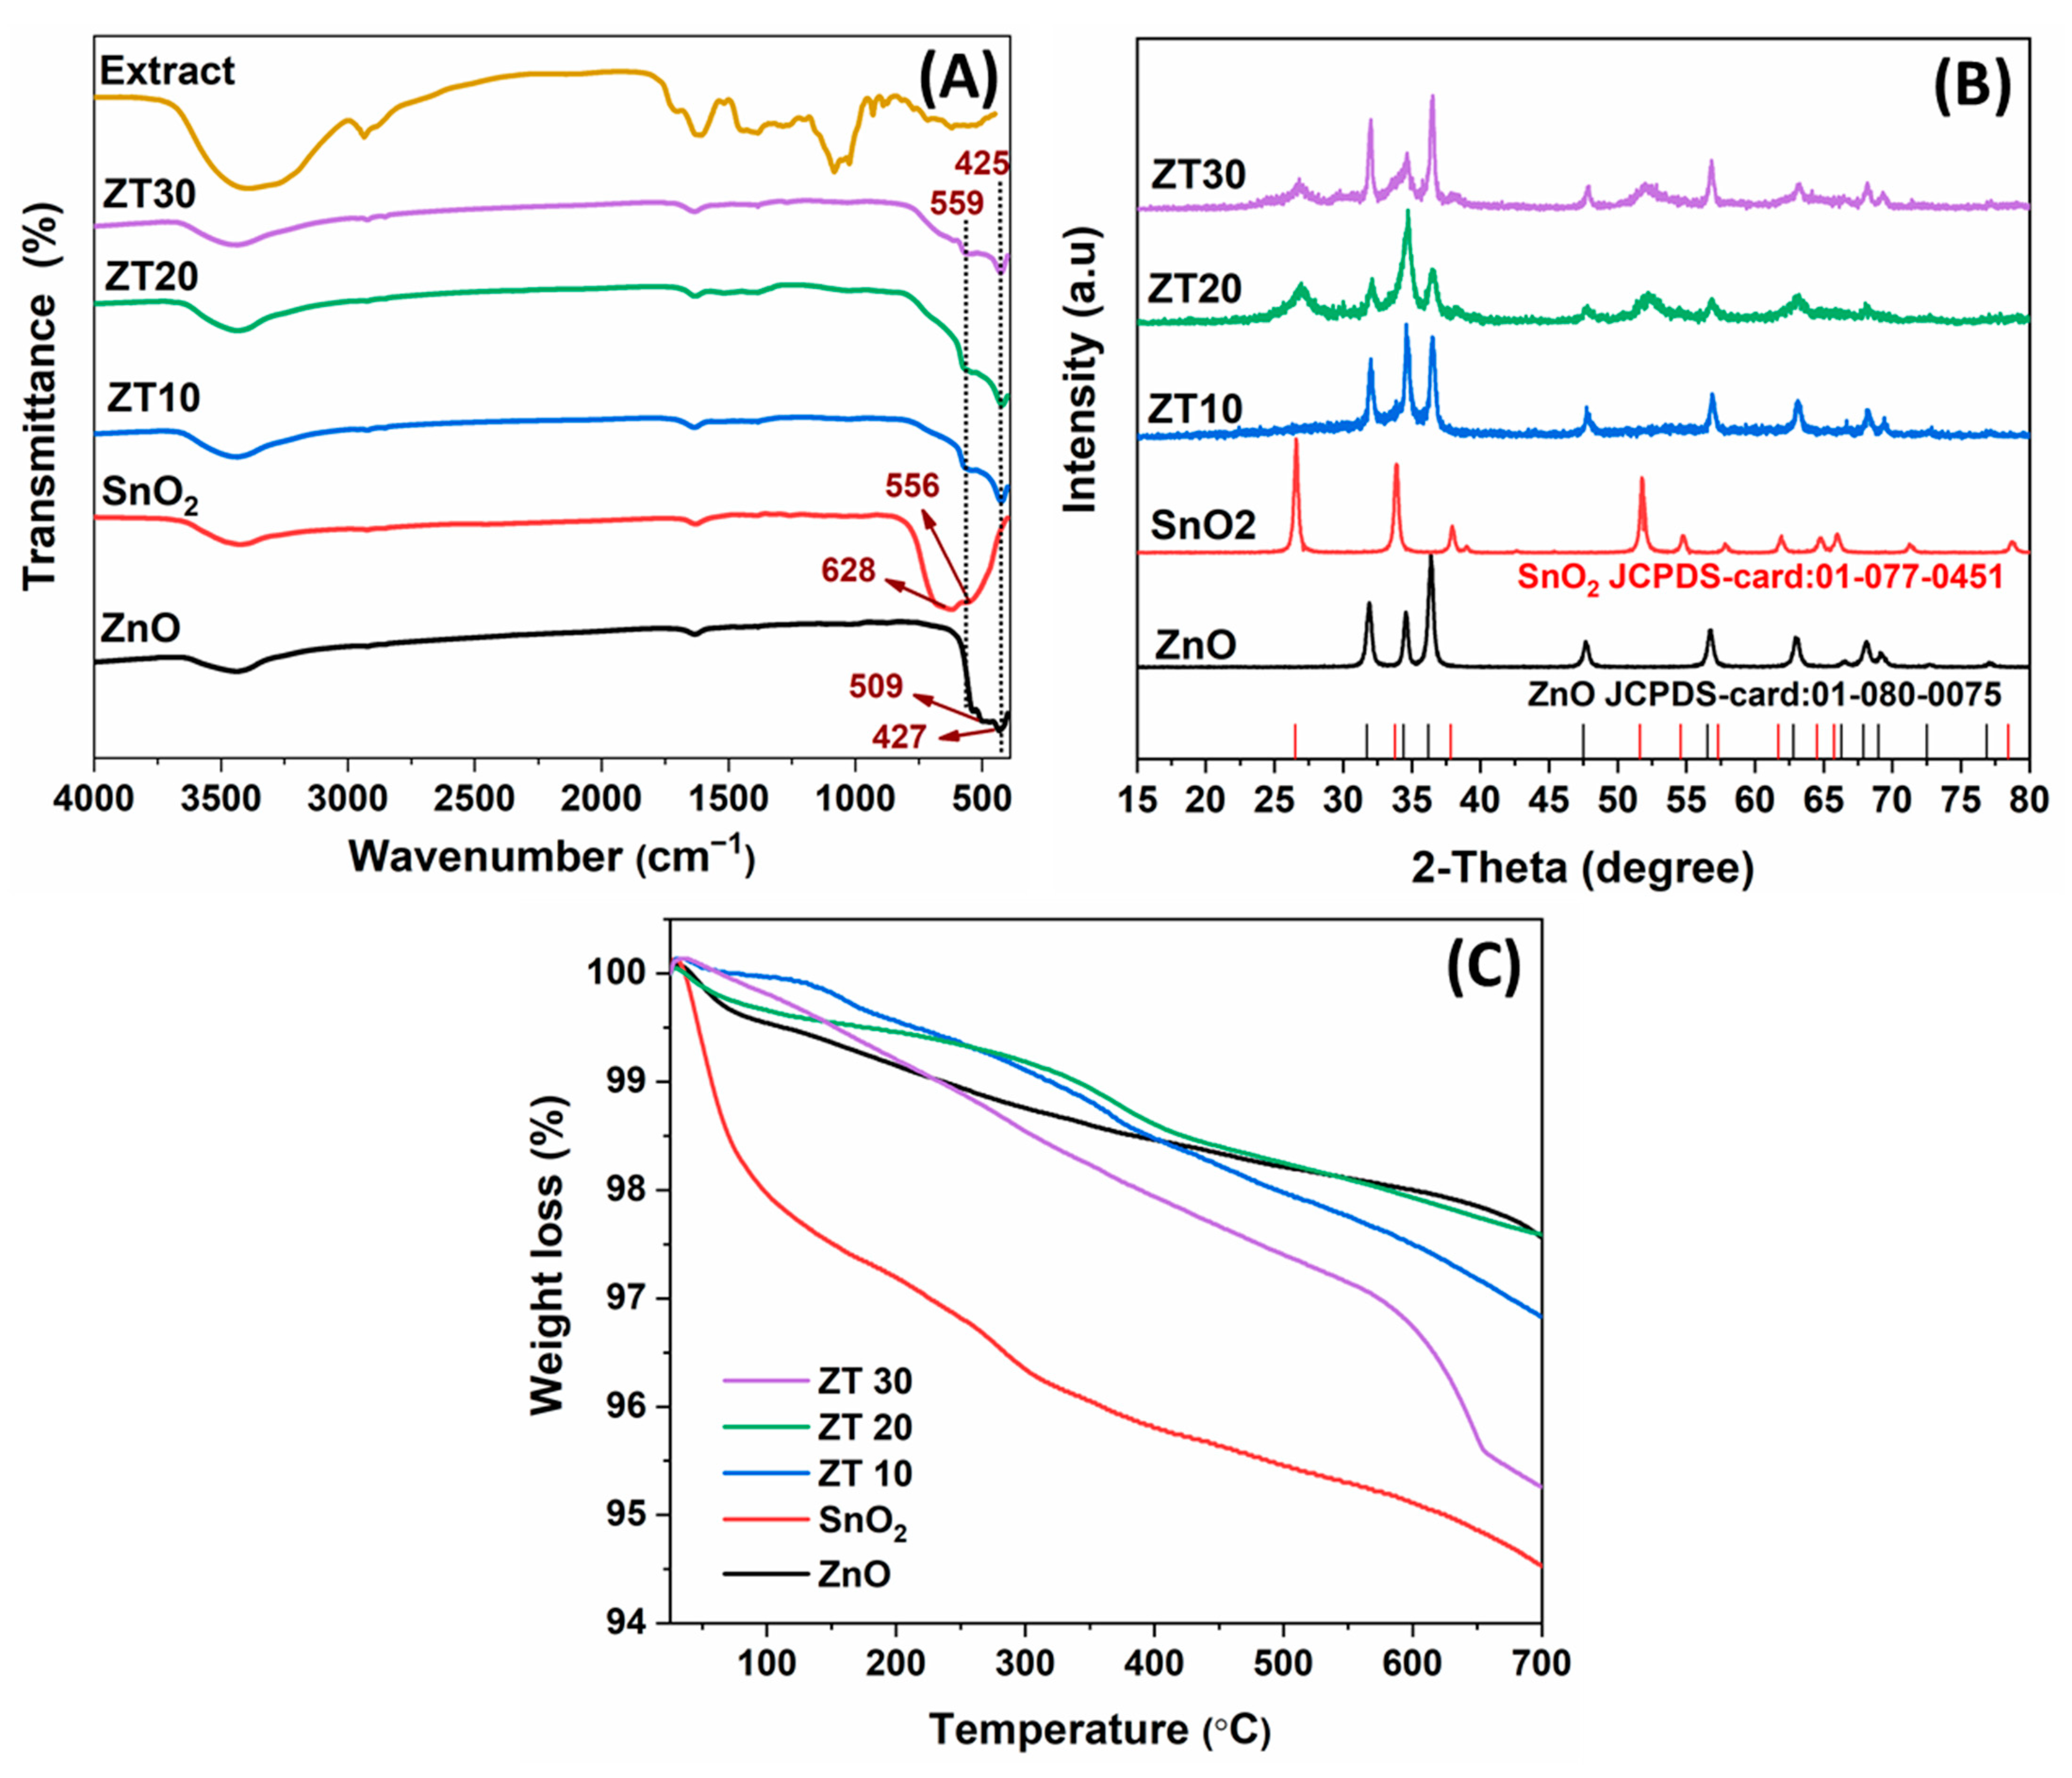
3.1.1. FTIR Analysis
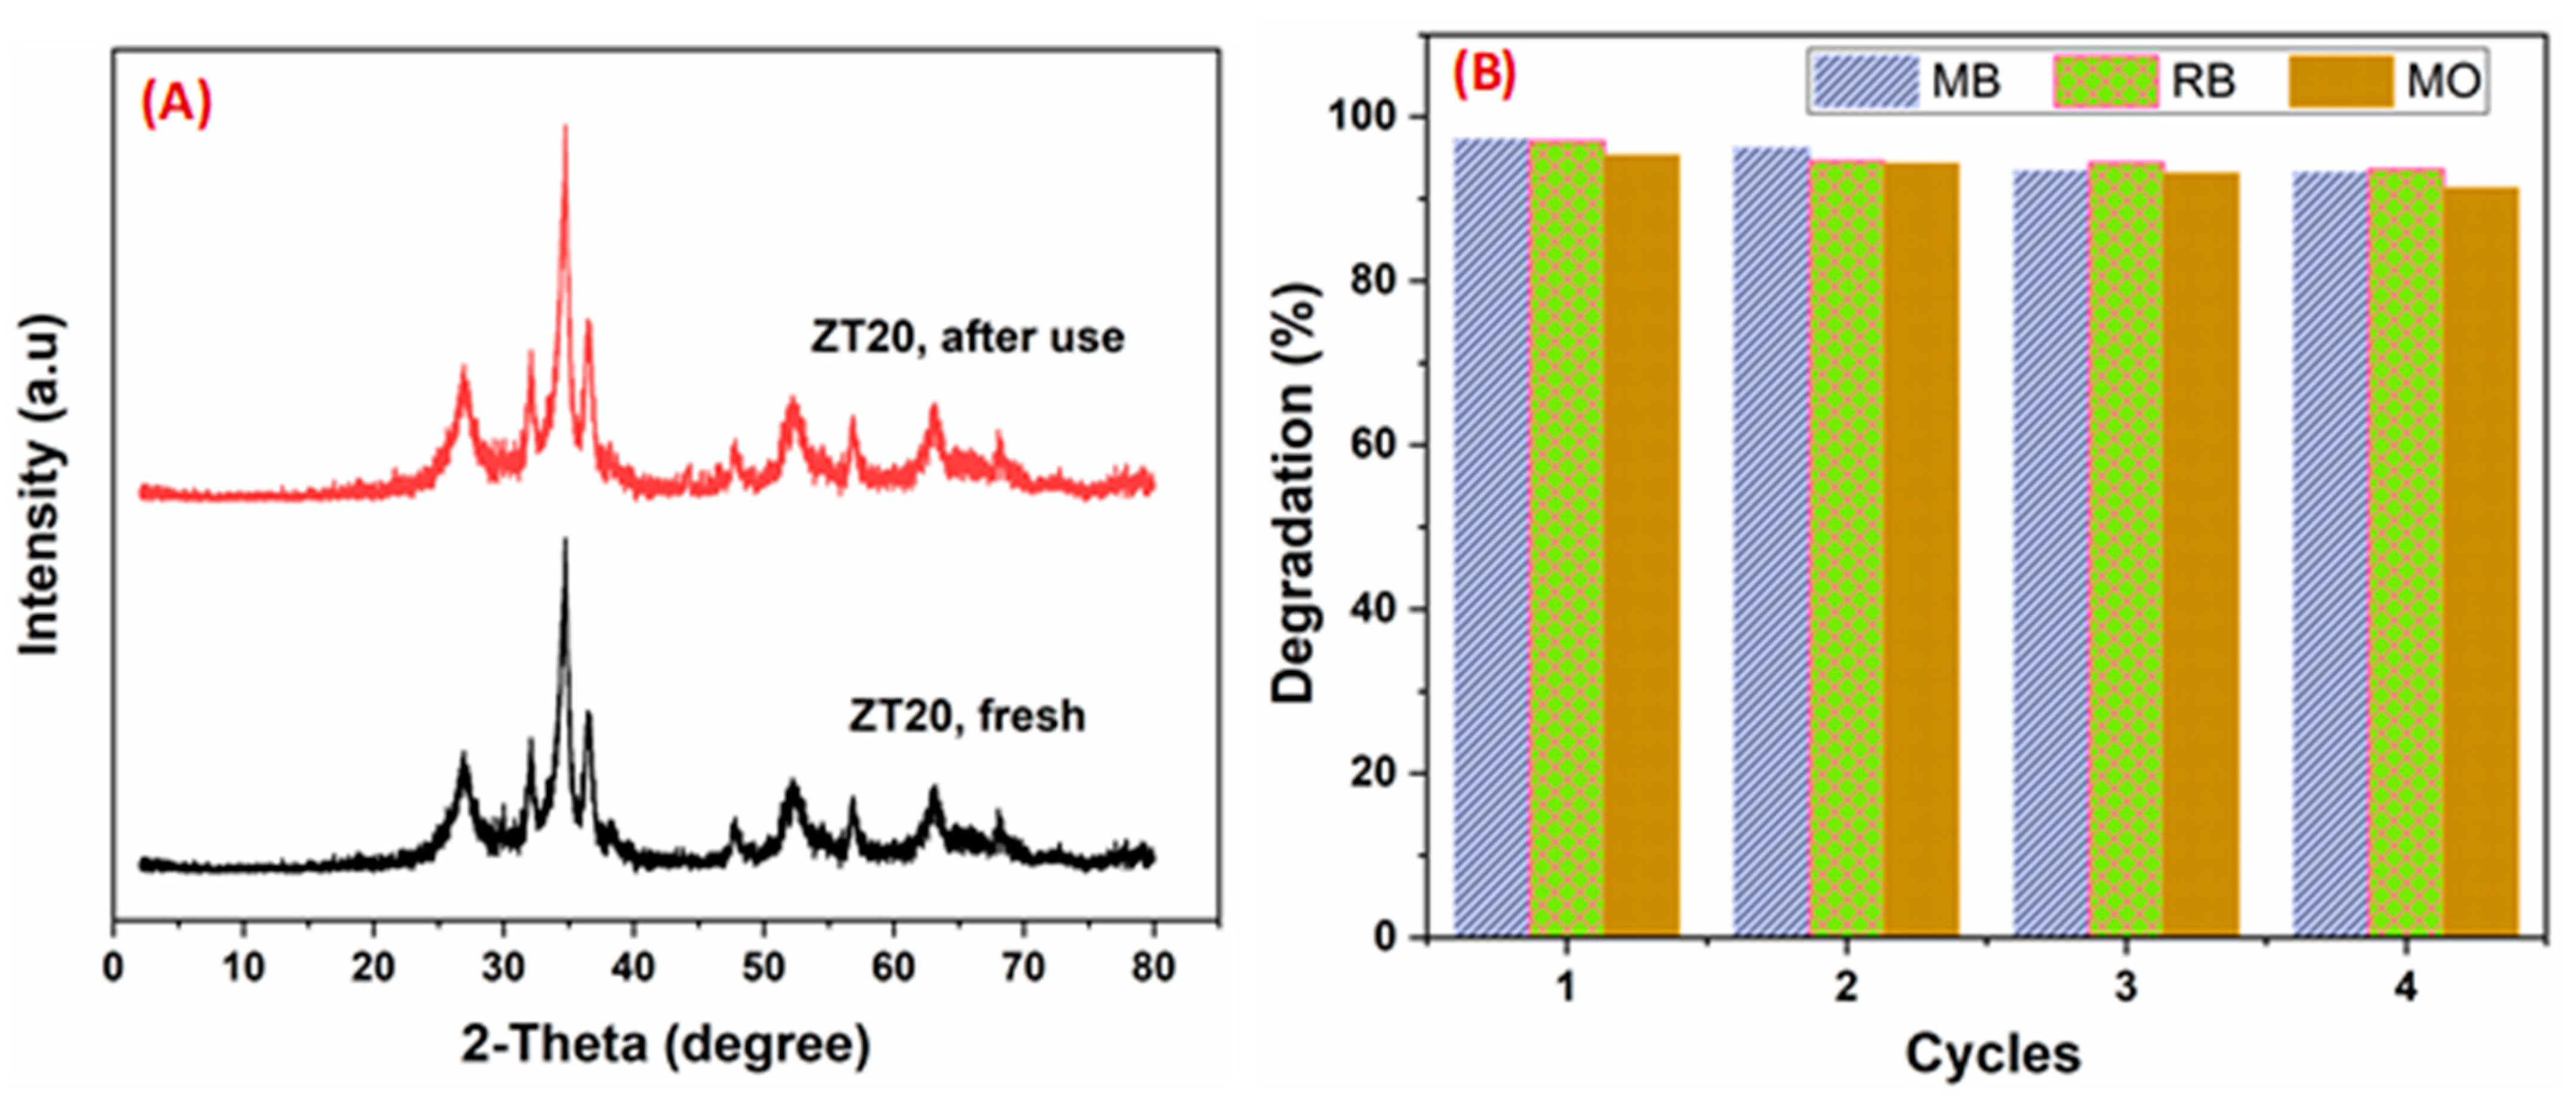
3.1.2. XRD Analysis
3.1.3. TGA Analysis
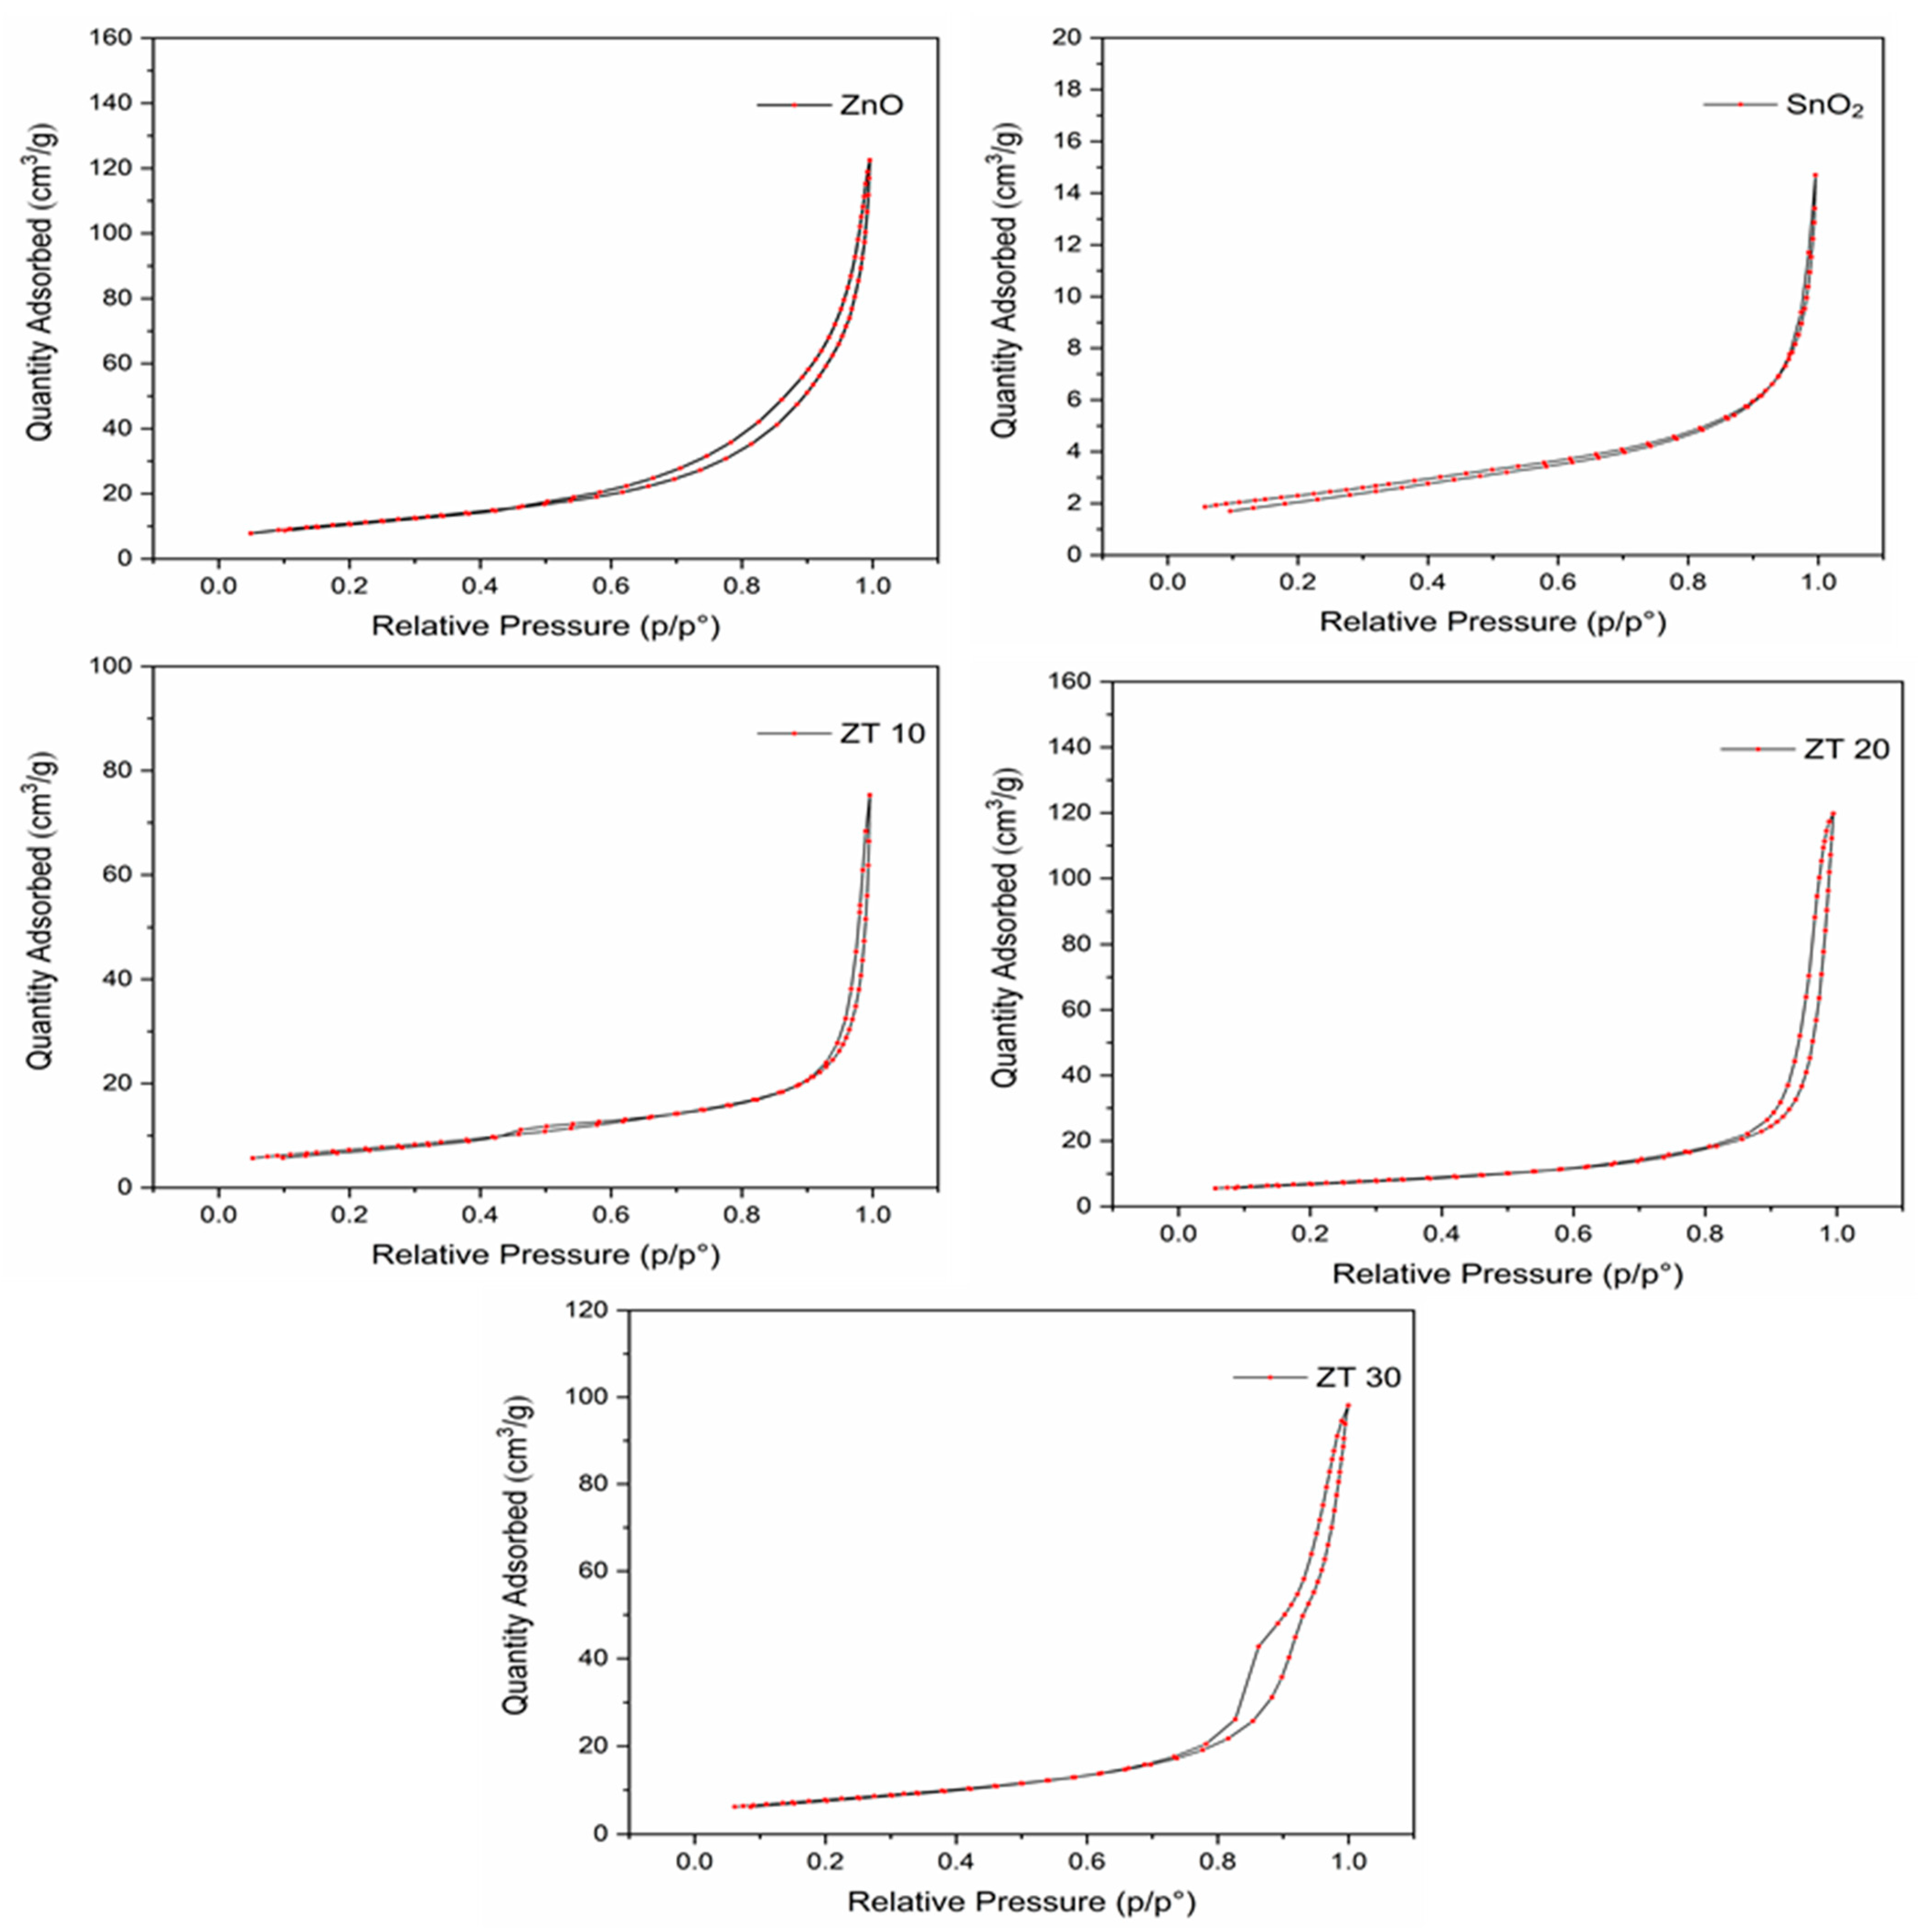
3.1.4. BET-Surface Analysis
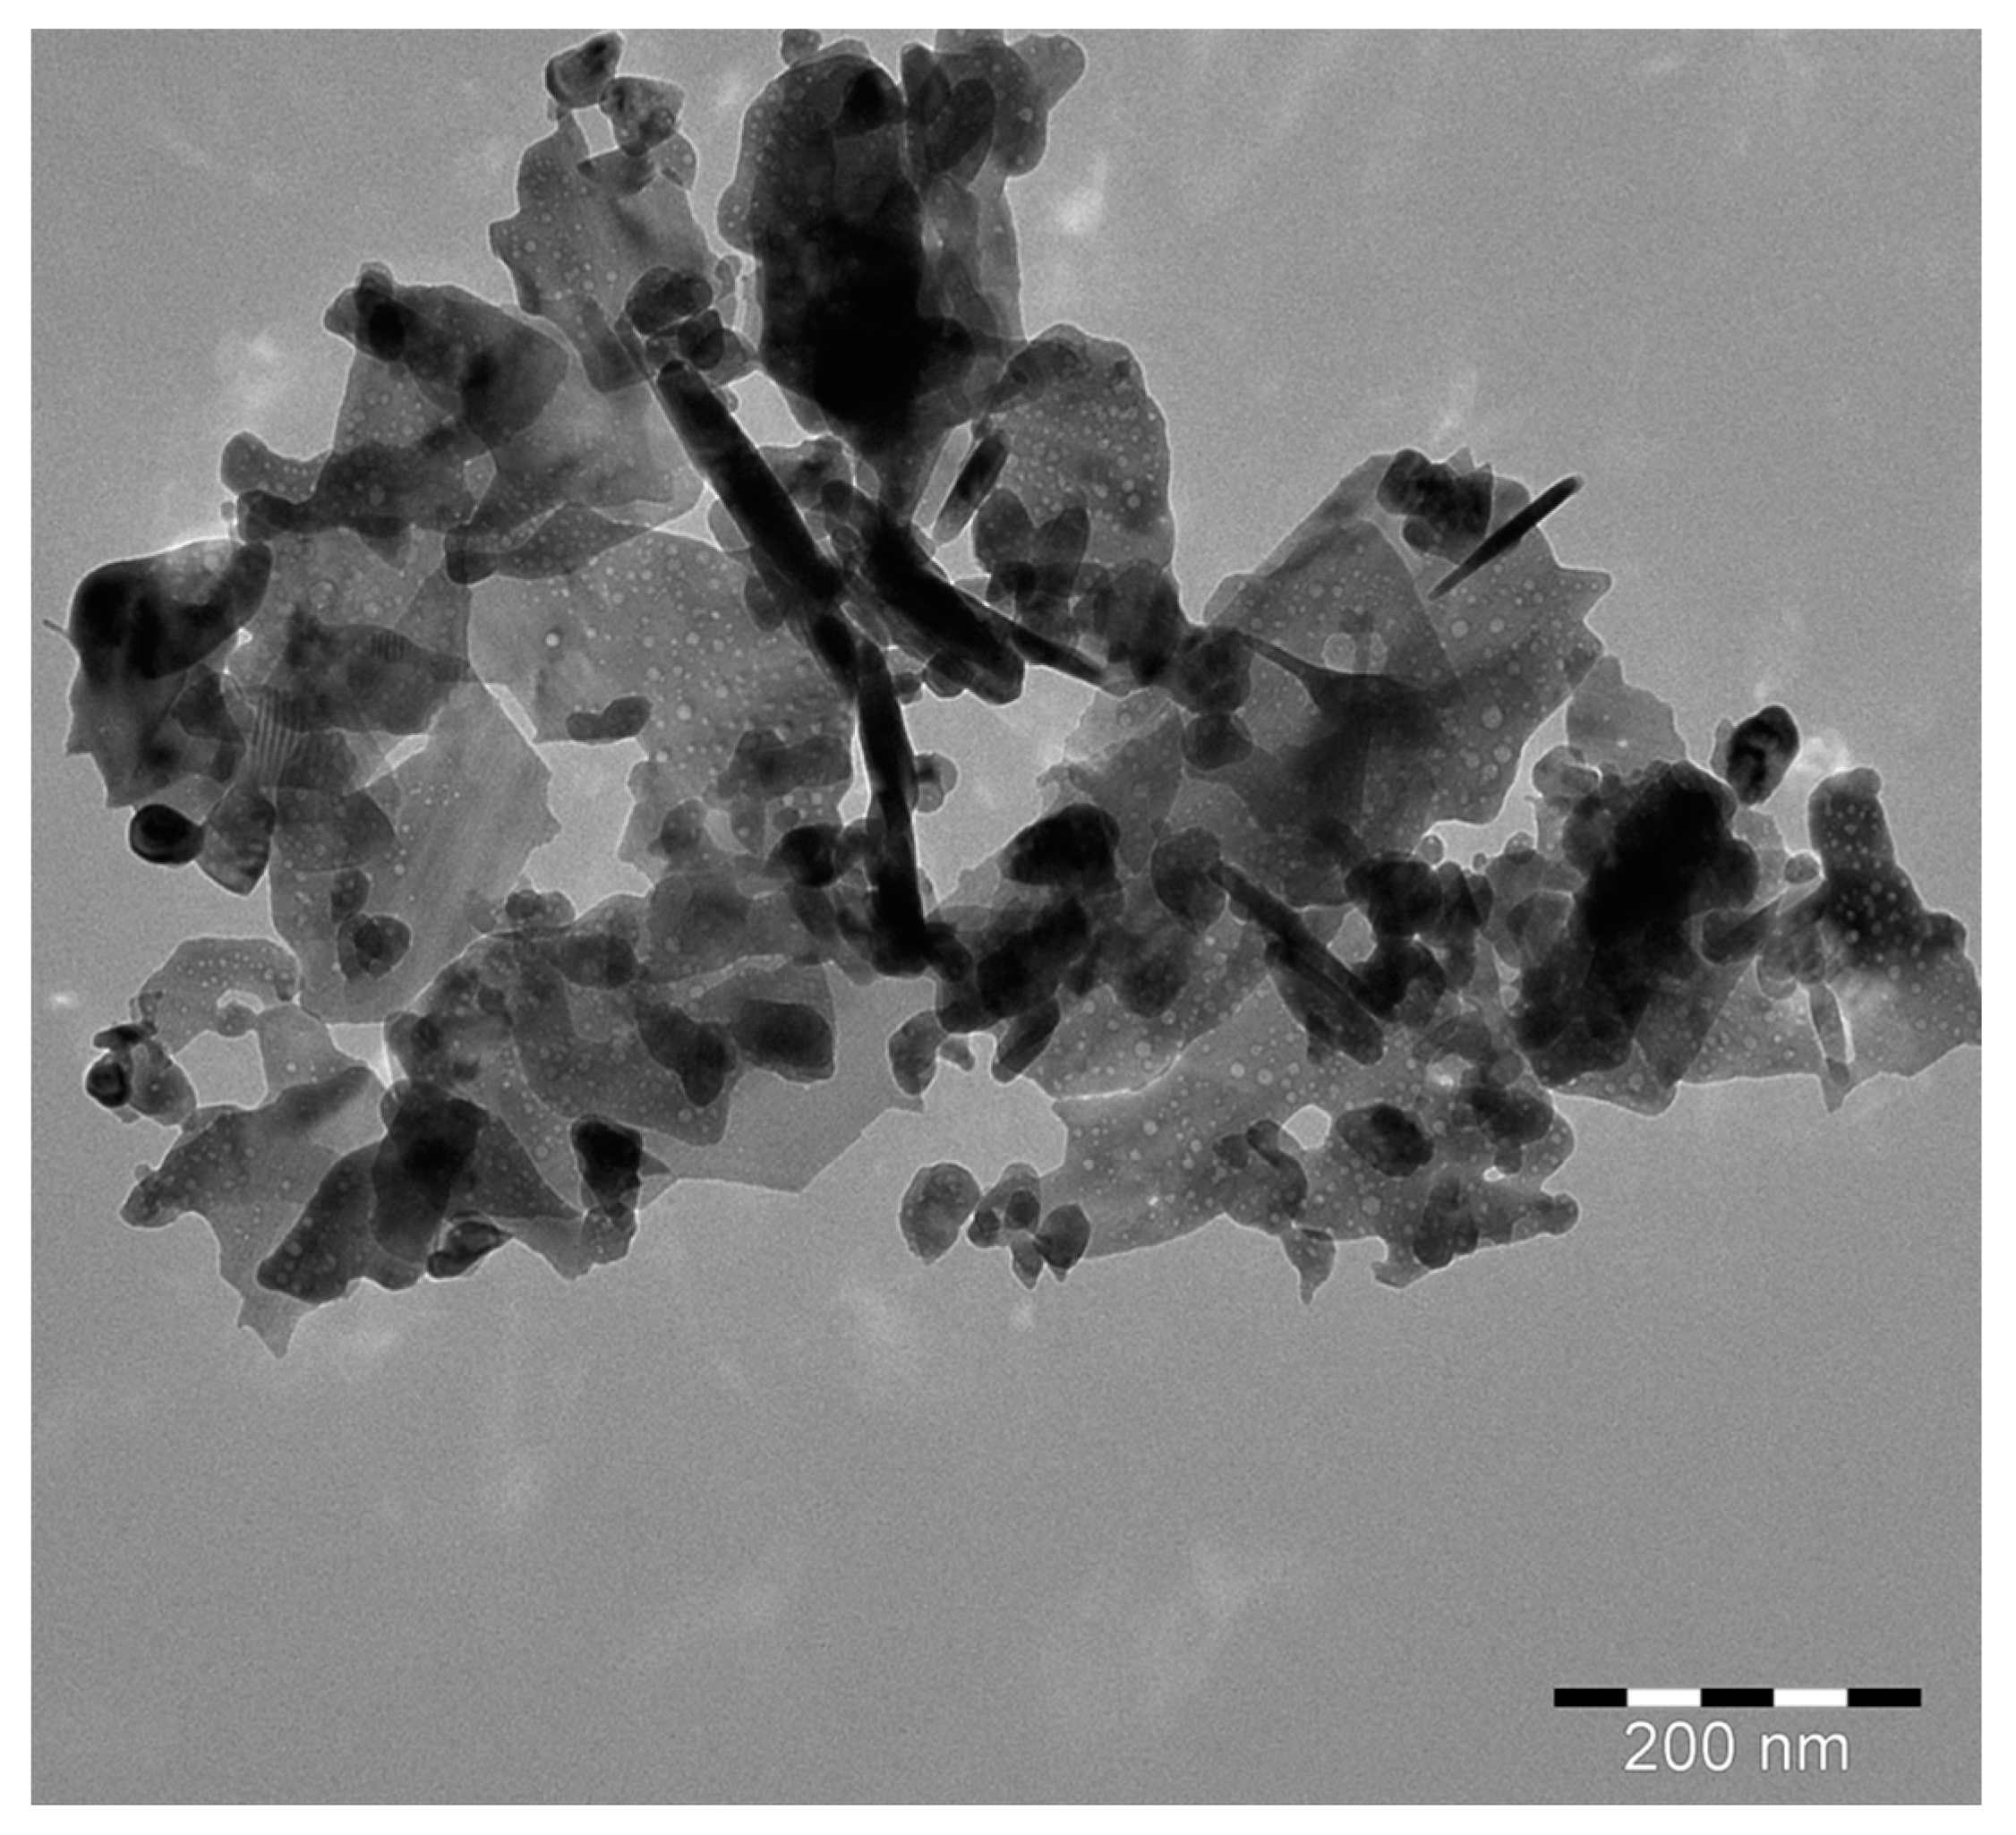
3.1.5. TEM Analysis
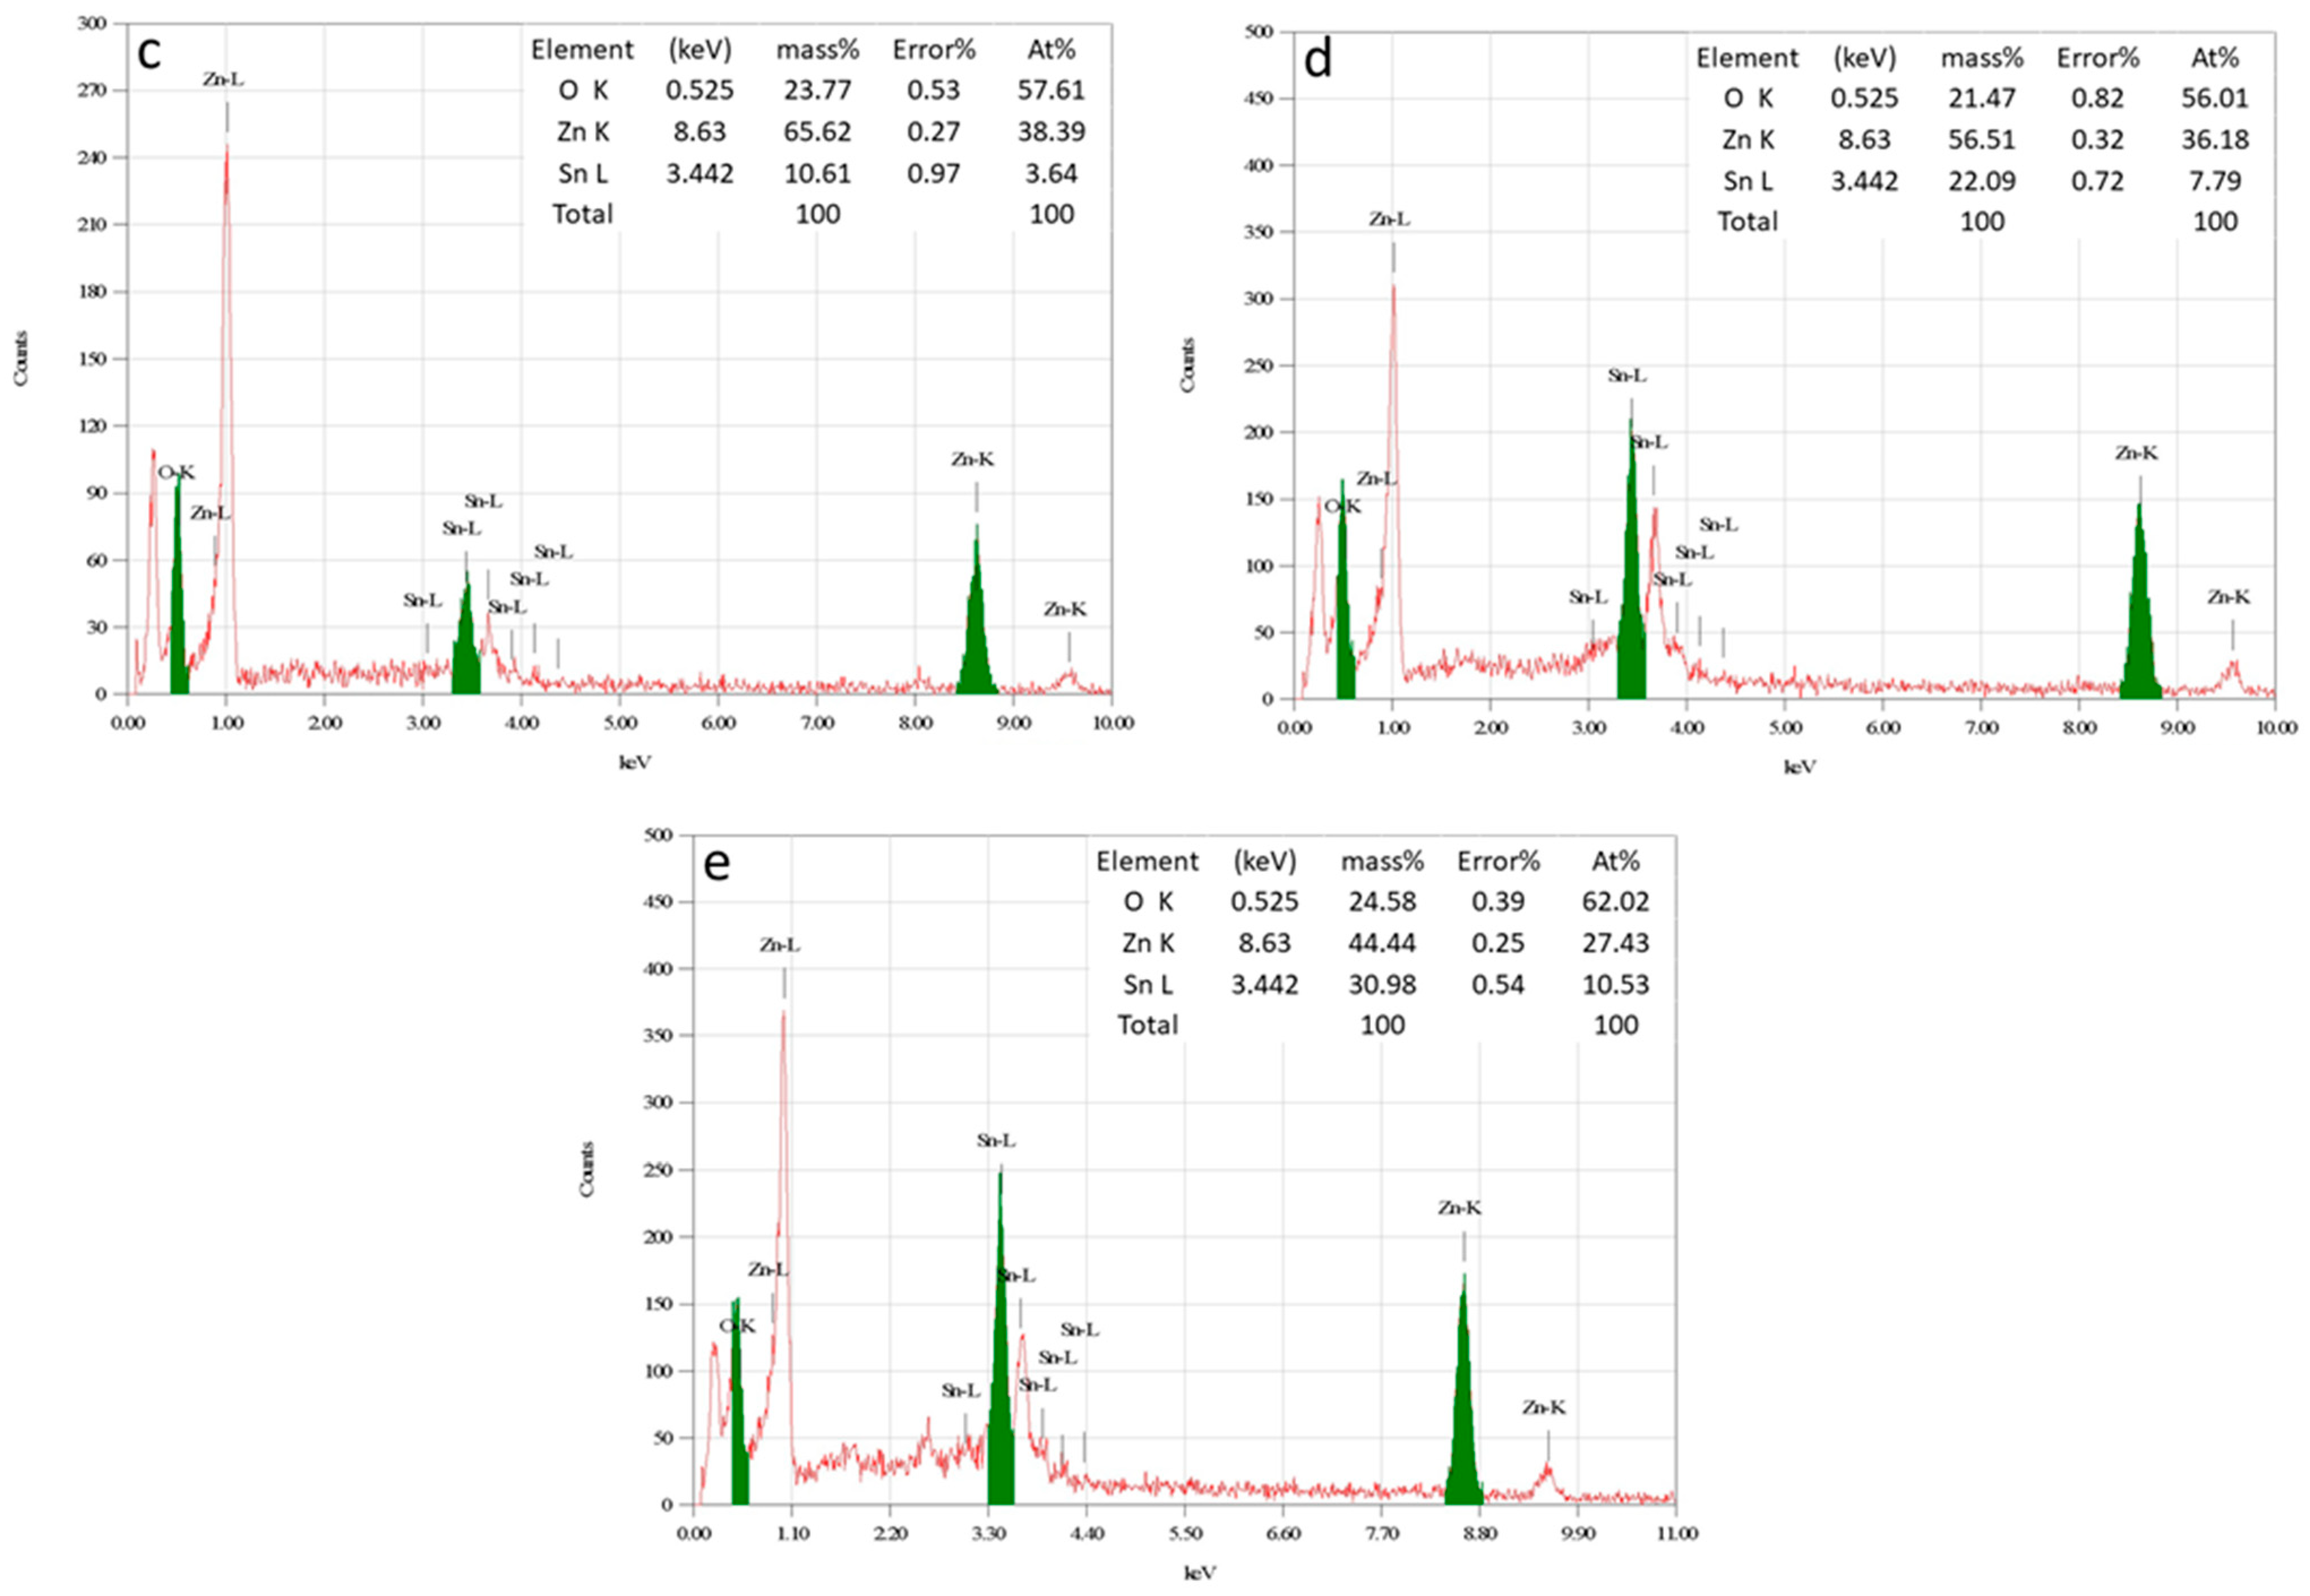
3.1.6. EDS Analysis
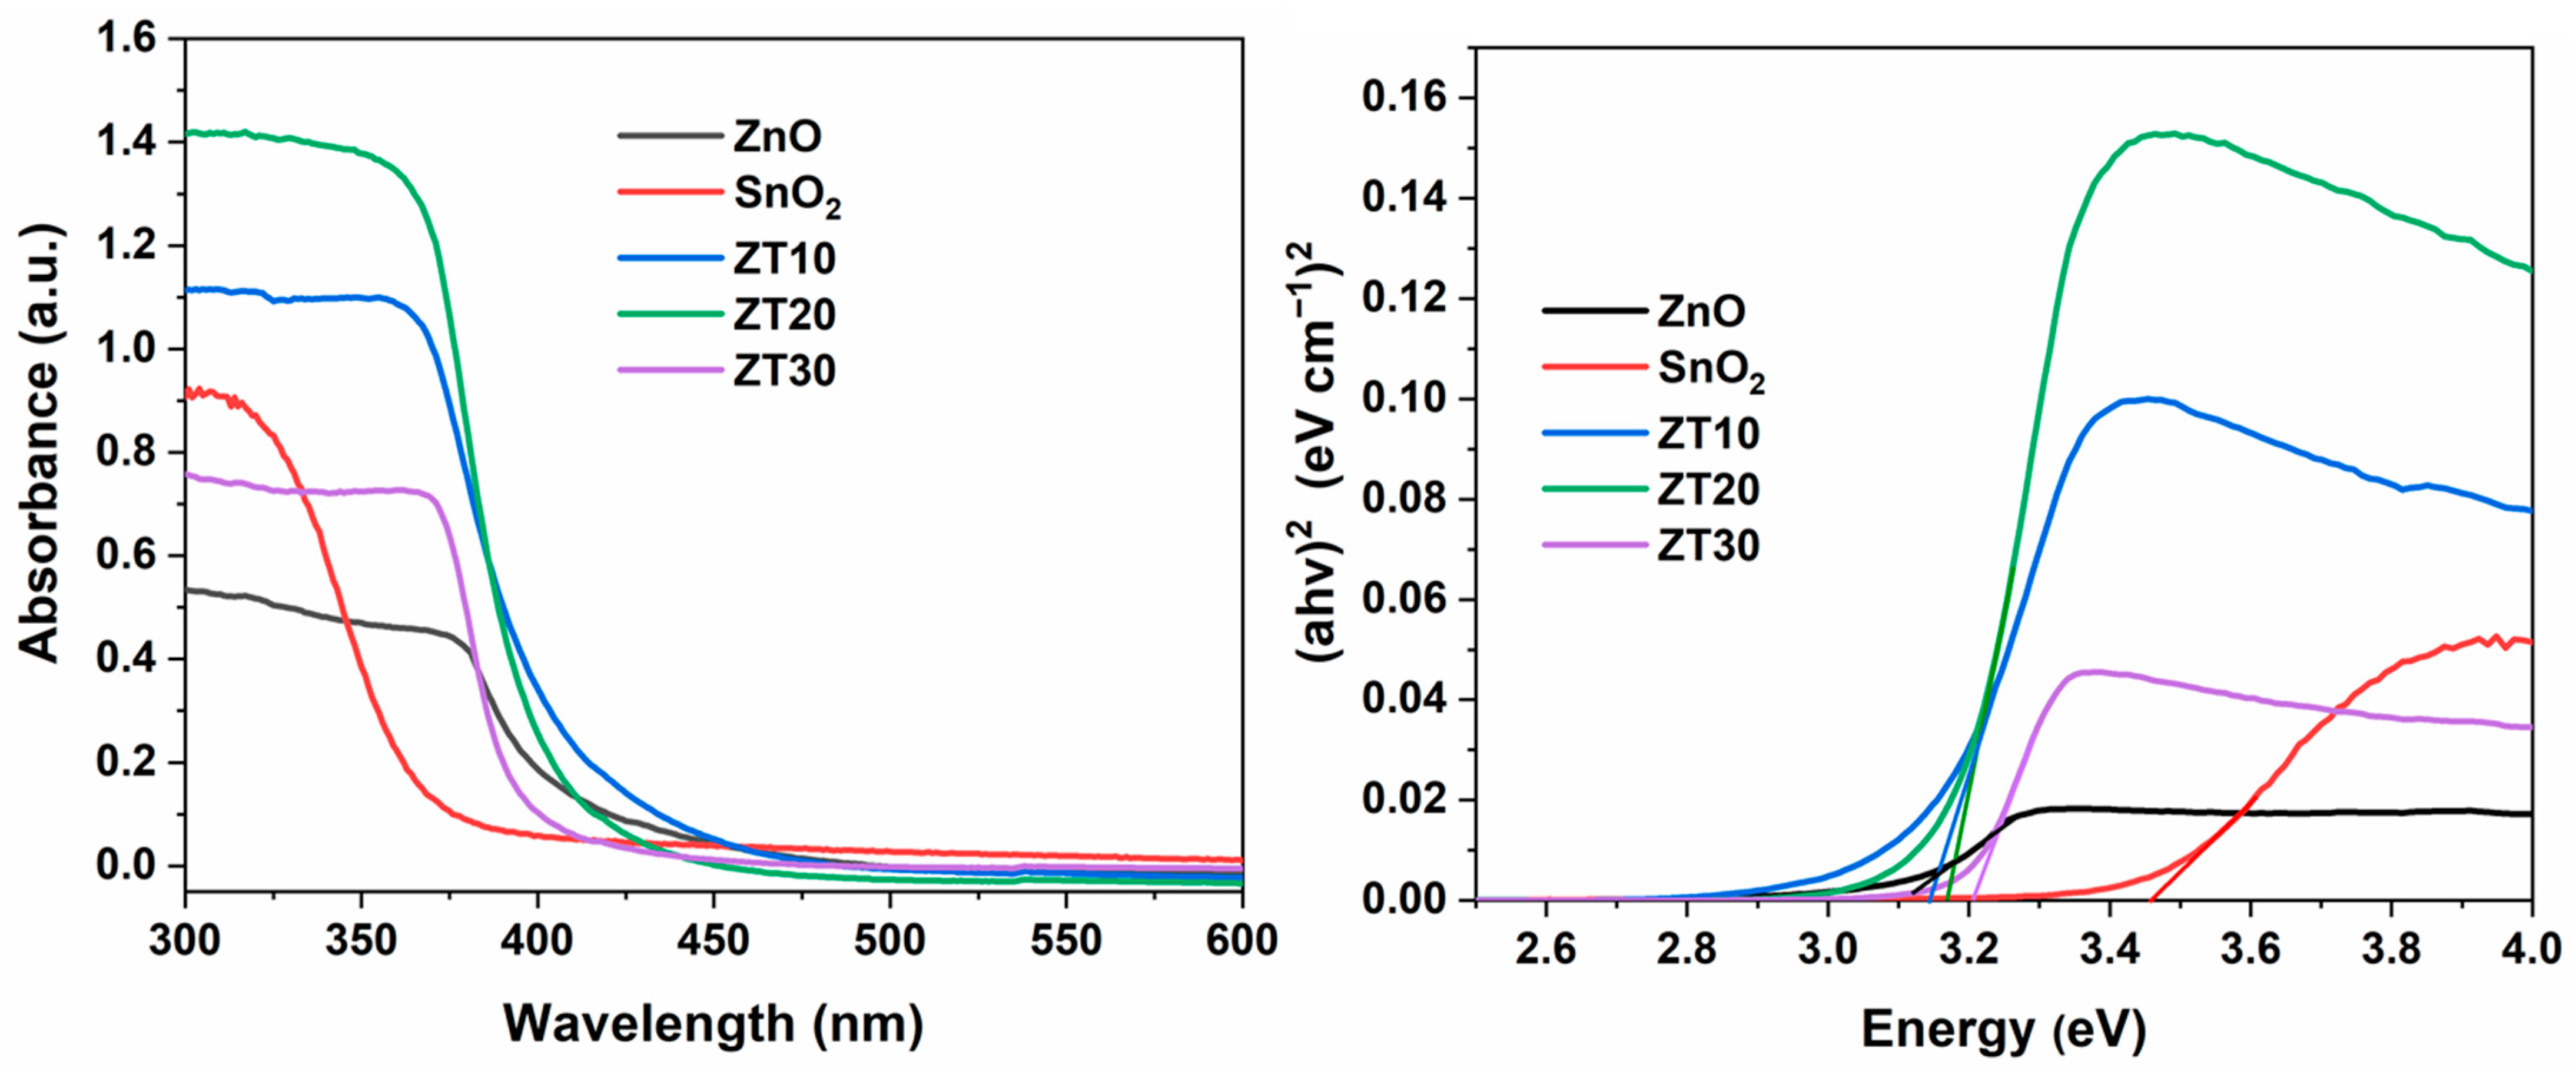
3.1.7. UV-Visible Analysis
3.1.8. PL Analysis
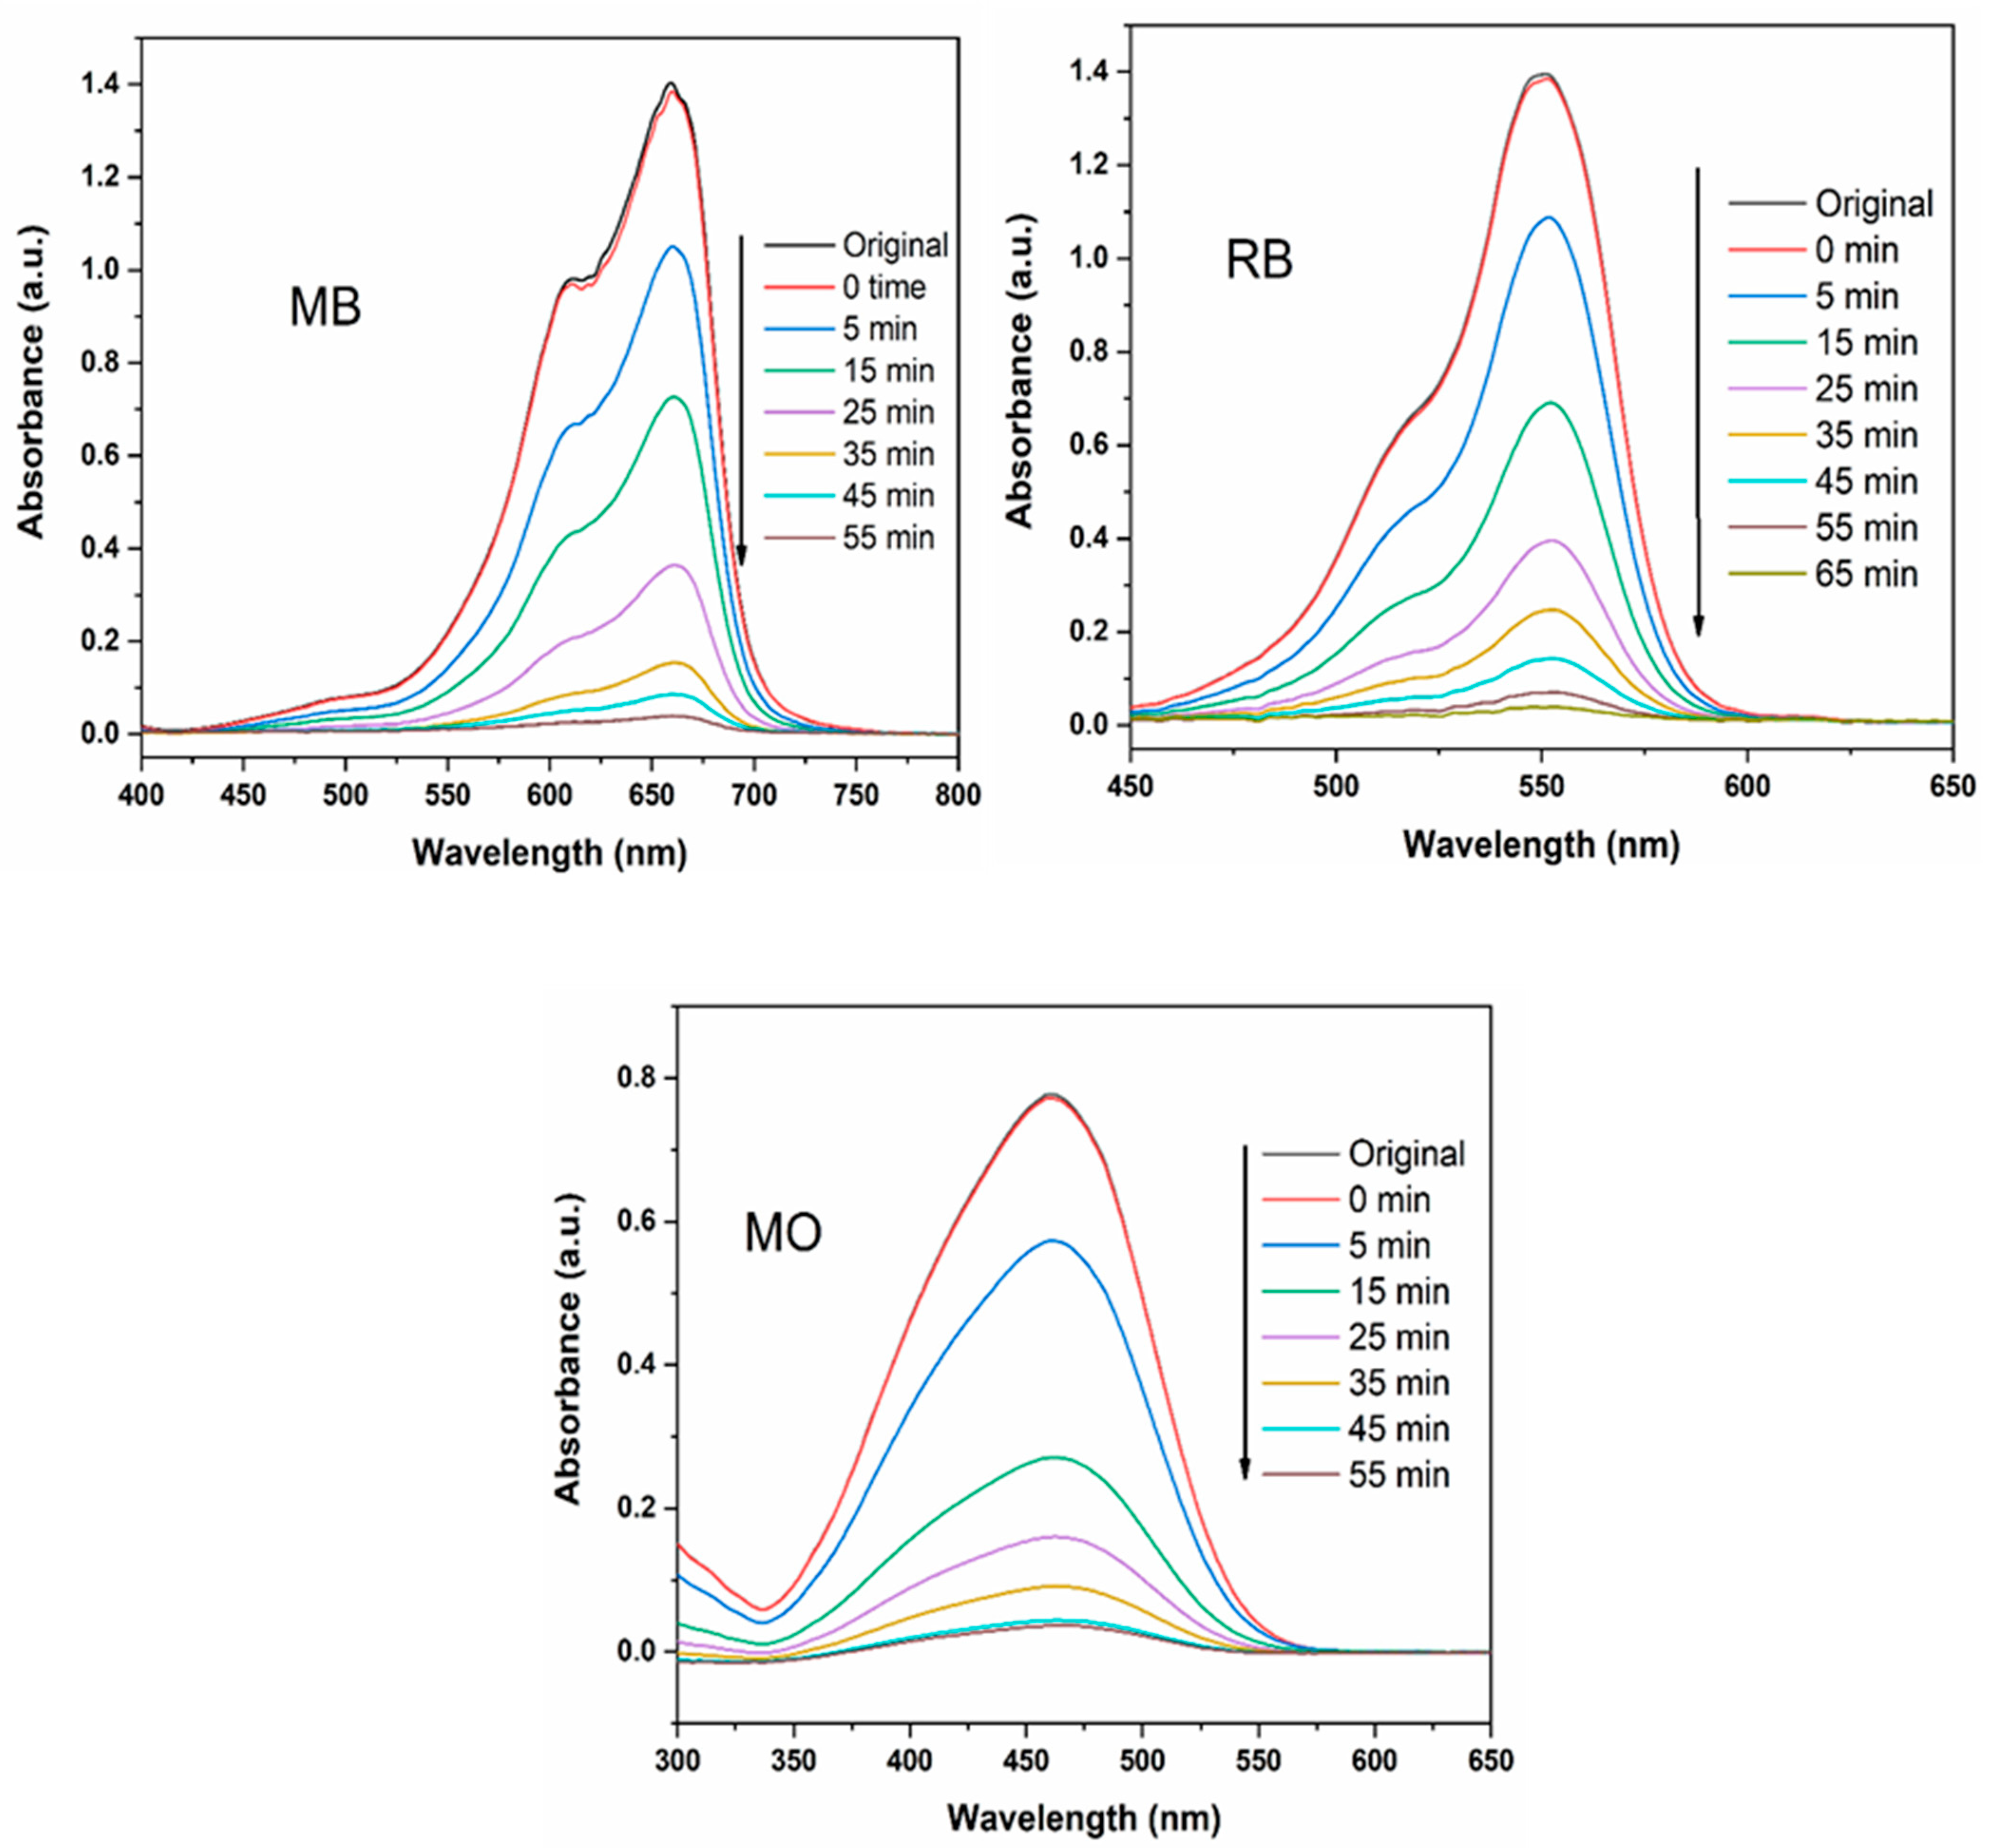
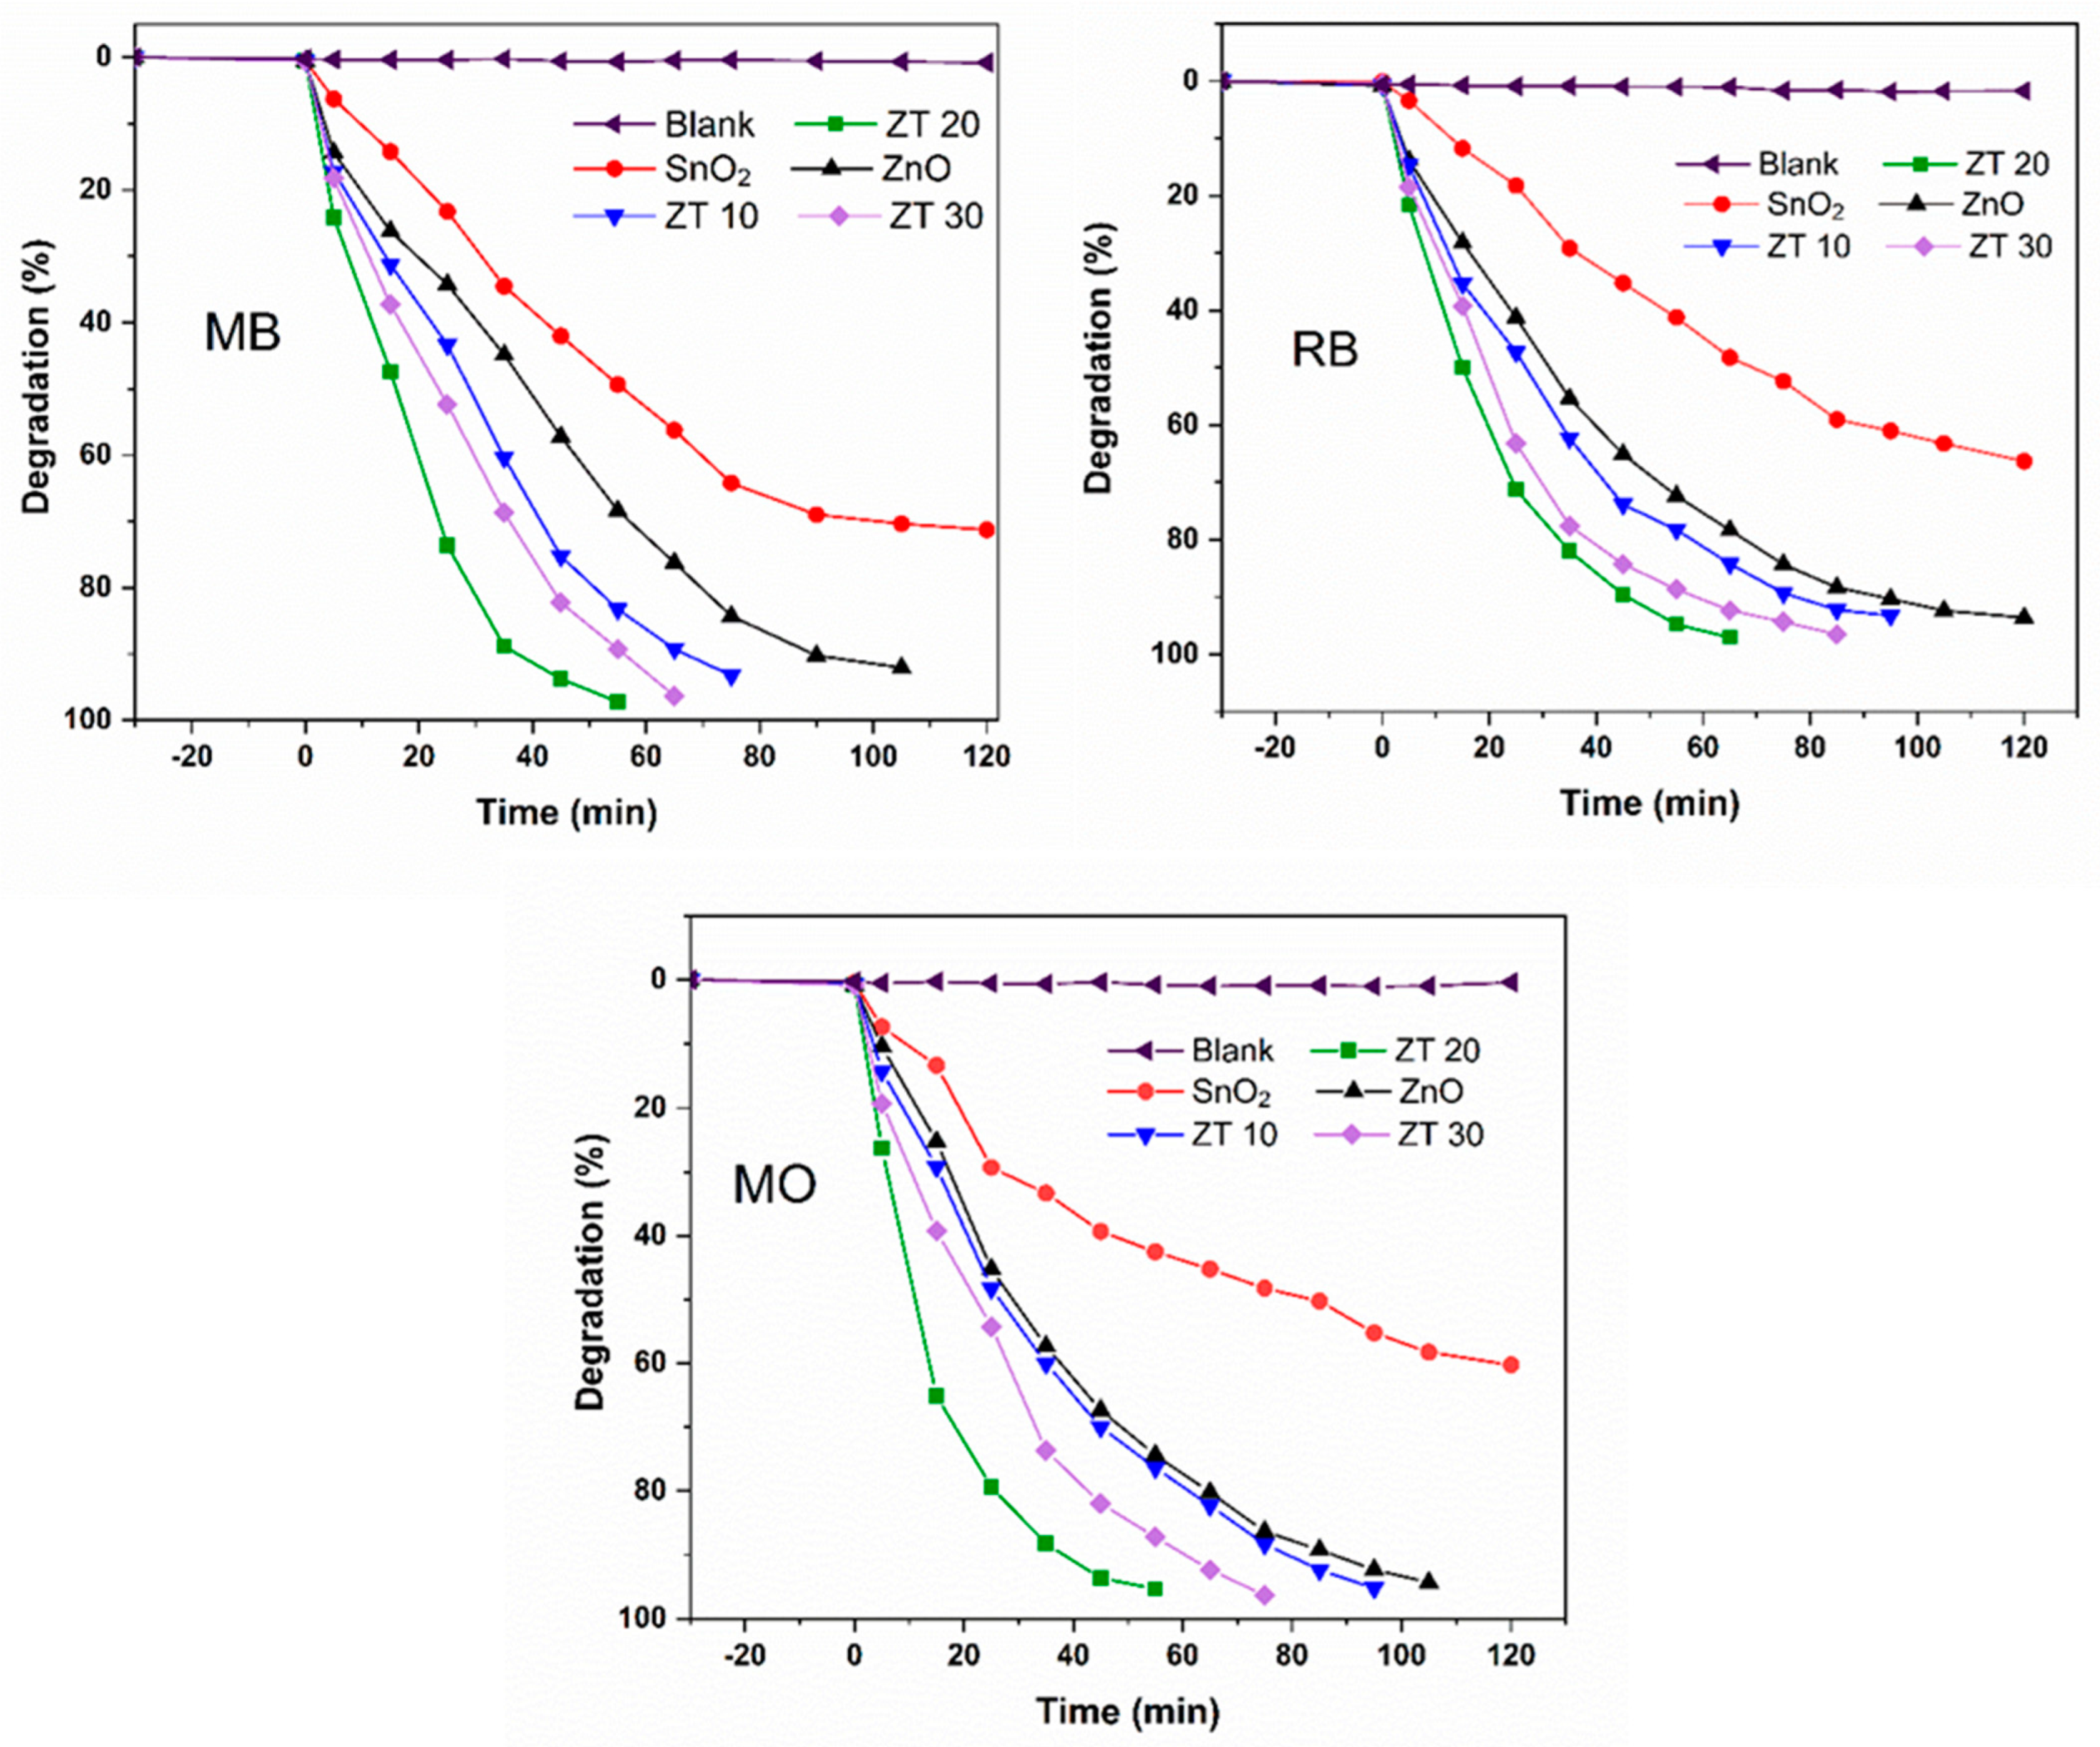
3.2. Catalytic Activity
3.3. Reusability
3.4. Relative Catalytic Performance of ZT
4. Conclusions
Author Contributions
Funding
Institutional Review Board Statement
Informed Consent Statement
Data Availability Statement
Acknowledgments
Conflicts of Interest
References
- Menariya, B.; Ameta, R.; Ameta, S. A Comparative Study on Photocatalytic Activity of ZnO, SnO2 and ZnO-SnO2 Composites. Int. J. Chem. Sci 2017, 15, 174. [Google Scholar]
- Lellis, B.; Fávaro-Polonio, C.Z.; Pamphile, J.A.; Polonio, J.C. Effects of textile dyes on health and the environment and bioremediation potential of living organisms. Biotechnol. Res. Innov. 2019, 3, 275–290. [Google Scholar] [CrossRef]
- Muthu, S. Sustainable Textiles: Production, Processing, Manufacturing & Chemistry; Springer: Berlin/Heidelberg, Germany, 2020; ISBN 978-3-030-38545-3. [Google Scholar]
- Waliullah, R.; Rehan, A.I.; Awual, M.E.; Rasee, A.I.; Sheikh, M.C.; Salman, M.S.; Hossain, M.S.; Hasan, M.M.; Kubra, K.T.; Hasan, M.N. Optimization of toxic dye removal from contaminated water using chitosan-grafted novel nanocomposite adsorbent. J. Mol. Liq. 2023, 388, 122763. [Google Scholar] [CrossRef]
- Roy, A.; Murthy, H.A.; Ahmed, H.M.; Islam, M.N.; Prasad, R. Phytogenic synthesis of metal/metal oxide nanoparticles for degradation of dyes. J. Renew. Mater. 2022, 10, 1911. [Google Scholar] [CrossRef]
- Rehan, A.I.; Rasee, A.I.; Awual, M.E.; Waliullah, R.; Hossain, M.S.; Kubra, K.T.; Salman, M.S.; Hasan, M.M.; Hasan, M.N.; Sheikh, M.C. Improving toxic dye removal and remediation using novel nanocomposite fibrous adsorbent. Colloids Surf. A Physicochem. Eng. Asp. 2023, 673, 131859. [Google Scholar] [CrossRef]
- Salman, M.S.; Sheikh, M.C.; Hasan, M.M.; Hasan, M.N.; Kubra, K.T.; Rehan, A.I.; Awual, M.E.; Rasee, A.I.; Waliullah, R.; Hossain, M.S. Chitosan-coated cotton fiber composite for efficient toxic dye encapsulation from aqueous media. Appl. Surf. Sci. 2023, 622, 157008. [Google Scholar] [CrossRef]
- Guo, W.; Yang, Z.; Zhou, X.-J.; Wu, Q. Degradation and mineralization of dyes with advanced oxidation processes (AOPs): A brief review. In Proceedings of the 2015 International Forum on Energy, Environment Science and Materials, Shenzhen, China, 25–26 September 2015; pp. 341–344. [Google Scholar]
- Byrne, J.A.; Dunlop, P.S.M.; Hamilton, J.W.J.; Fernández-Ibáñez, P.; Polo-López, I.; Sharma, P.K.; Vennard, A.S.M. A review of heterogeneous photocatalysis for water and surface disinfection. Molecules 2015, 20, 5574–5615. [Google Scholar] [CrossRef] [PubMed]
- Molinari, R.; Lavorato, C.; Argurio, P. Visible-light photocatalysts and their perspectives for building photocatalytic membrane reactors for various liquid phase chemical conversions. Catalysts 2020, 10, 1334. [Google Scholar] [CrossRef]
- Kumar, S.; Ahlawat, W.; Bhanjana, G.; Heydarifard, S.; Nazhad, M.M.; Dilbaghi, N. Nanotechnology-based water treatment strategies. J. Nanosci. Nanotechnol. 2014, 14, 1838–1858. [Google Scholar] [CrossRef] [PubMed]
- Rafiq, A.; Ikram, M.; Ali, S.; Niaz, F.; Khan, M.; Khan, Q.; Maqbool, M. Photocatalytic degradation of dyes using semiconductor photocatalysts to clean industrial water pollution. J. Ind. Eng. Chem. 2021, 97, 111–128. [Google Scholar] [CrossRef]
- Joshi, N.C.; Gururani, P.; Gairola, S.P. Metal oxide nanoparticles and their nanocomposite-based materials as photocatalysts in the degradation of dyes. Biointerface Res. Appl. Chem 2022, 12, 6557–6579. [Google Scholar]
- Khan, M.M.; Adil, S.F.; Al-Mayouf, A. Metal oxides as photocatalysts. J. Saudi Chem. Soc. 2015, 19, 462–464. [Google Scholar] [CrossRef]
- Kumar, Y.; Kumar, R.; Raizada, P.; Khan, A.A.P.; Nguyen, V.-H.; Kim, S.Y.; Van Le, Q.; Selvasembian, R.; Singh, A.; Gautam, S. Recent progress on elemental sulfur based photocatalysts for energy and environmental applications. Chemosphere 2022, 305, 135477. [Google Scholar] [CrossRef] [PubMed]
- Raizada, P.; Soni, V.; Kumar, A.; Singh, P.; Khan, A.A.P.; Asiri, A.M.; Thakur, V.K.; Nguyen, V.-H. Surface defect engineering of metal oxides photocatalyst for energy application and water treatment. J. Mater. 2021, 7, 388–418. [Google Scholar] [CrossRef]
- Hernández, S.; Hidalgo, D.; Sacco, A.; Chiodoni, A.; Lamberti, A.; Cauda, V.; Tresso, E.; Saracco, G. Comparison of photocatalytic and transport properties of TiO 2 and ZnO nanostructures for solar-driven water splitting. Phys. Chem. Chem. Phys. 2015, 17, 7775–7786. [Google Scholar] [CrossRef]
- Saleh, S.M. Metal oxide nanomaterials as photo-catalyst for dye degradation. Res. Dev. Mater. Sci 2019, 9, 1–8. [Google Scholar] [CrossRef]
- Singh, S. Natural sunlight driven photocatalytic performance of Ag/ZnO nanocrystals. Mater. Today Commun. 2022, 33, 104438. [Google Scholar] [CrossRef]
- Zarei, S.; Hasheminiasari, M.; Masoudpanah, S.; Javadpour, J. Photocatalytic properties of ZnO/SnO2 nanocomposite films: Role of morphology. J. Mater. Res. Technol. 2022, 17, 2305–2312. [Google Scholar] [CrossRef]
- Celić, N.; Banić, N.; Jagodić, I.; Yatskiv, R.; Vaniš, J.; Štrbac, G.; Lukić-Petrović, S. Eco-Friendly Photoactive Foils Based on ZnO/SnO2-PMMA Nanocomposites with High Reuse Potential. ACS Appl. Polym. Mater. 2023, 5, 3792–3800. [Google Scholar] [CrossRef]
- Uddin, M.T.; Hoque, M.E.; Bhoumick, M.C. Facile one-pot synthesis of heterostructure SnO2/ZnO photocatalyst for enhanced photocatalytic degradation of organic dye. RSC Adv. 2020, 10, 23554–23565. [Google Scholar] [CrossRef]
- Długosz, O.; Staroń, A.; Brzoza, P.; Banach, M. Synergistic effect of sorption and photocatalysis on the degree of dye removal in single and multicomponent systems on ZnO-SnO2. Environ. Sci. Pollut. Res. 2022, 29, 27042–27050. [Google Scholar] [CrossRef] [PubMed]
- Yu, Y.; Yao, B.; Cao, B.; Ma, W. Morphology-controlled Fabrication of SnO2/ZnO Nanocomposites with Enhanced Photocatalytic Performance. Photochem. Photobiol. 2019, 95, 1131–1141. [Google Scholar] [CrossRef] [PubMed]
- Verma, N.; Yadav, S.; Marí, B.; Mittal, A.; Jindal, J. Synthesis and charcterization of coupled ZnO/SnO2 photocatalysts and their activity towards degradation of cibacron red dye. Trans. Indian Ceram. Soc. 2018, 77, 1–7. [Google Scholar] [CrossRef]
- Hamrouni, A.; Moussa, N.; Parrino, F.; Di Paola, A.; Houas, A.; Palmisano, L. Sol–gel synthesis and photocatalytic activity of ZnO–SnO2 nanocomposites. J. Mol. Catal. A Chem. 2014, 390, 133–141. [Google Scholar] [CrossRef]
- Wang, W.W.; Zhu, Y.J.; Yang, L.X. ZnO–SnO2 hollow spheres and hierarchical nanosheets: Hydrothermal preparation, formation mechanism, and photocatalytic properties. Adv. Funct. Mater. 2007, 17, 59–64. [Google Scholar] [CrossRef]
- Alprol, A.E.; Mansour, A.T.; Abdelwahab, A.M.; Ashour, M. Advances in Green Synthesis of Metal Oxide Nanoparticles by Marine Algae for Wastewater Treatment by Adsorption and Photocatalysis Techniques. Catalysts 2023, 13, 888. [Google Scholar] [CrossRef]
- Golmohammadi, M.; Hassankiadeh, M.N.; Zhang, L. Facile biosynthesis of SnO2/ZnO nanocomposite using Acroptilon repens flower extract and evaluation of their photocatalytic activity. Ceram. Int. 2021, 47, 29303–29308. [Google Scholar] [CrossRef]
- Hamrouni, A.; Lachheb, H.; Houas, A. Synthesis, characterization and photocatalytic activity of ZnO-SnO2 nanocomposites. Mater. Sci. Eng. B 2013, 178, 1371–1379. [Google Scholar] [CrossRef]
- Wan, W.; Li, Y.; Ren, X.; Zhao, Y.; Gao, F.; Zhao, H. 2D SnO2 nanosheets: Synthesis, characterization, structures, and excellent sensing performance to ethylene glycol. Nanomaterials 2018, 8, 112. [Google Scholar] [CrossRef]
- Anžlovar, A.; Orel, Z.C.; Kogej, K.; Žigon, M. Polyol-mediated synthesis of zinc oxide nanorods and nanocomposites with poly (methyl methacrylate). J. Nanomater. 2012, 2012, 31. [Google Scholar] [CrossRef]
- Saeidi, M.; Abrari, M.; Ahmadi, M. Fabrication of dye-sensitized solar cell based on mixed tin and zinc oxide nanoparticles. Appl. Phys. A 2019, 125, 409. [Google Scholar] [CrossRef]
- Lin, C.-C.; Chiang, Y.-J. Preparation of coupled ZnO/SnO2 photocatalysts using a rotating packed bed. Chem. Eng. J. 2012, 181, 196–205. [Google Scholar] [CrossRef]
- Wang, L.; Li, J.; Wang, Y.; Yu, K.; Tang, X.; Zhang, Y.; Wang, S.; Wei, C. Construction of 1D SnO2-coated ZnO nanowire heterojunction for their improved n-butylamine sensing performances. Sci. Rep. 2016, 6, 35079. [Google Scholar] [CrossRef] [PubMed]
- Dall’Oglio, D.F.; Garcia, M.A.; Fiorio, J.L.; Abreu, W.C.d.; Pereira, L.N.; Braga, A.; Moura, E.M.d.; Guldhe, A.; Bux, F.; de Moura, C.V. Reusable heterogeneous SnO2/ZnO catalyst for biodiesel production from acidified/acid oils. J. Braz. Chem. Soc. 2021, 32, 182–193. [Google Scholar] [CrossRef]
- Boudjouan, F.; Chelouche, A.; Touam, T.; Djouadi, D.; Mahiou, R.; Chadeyron, G.; Fischer, A.; Boudrioua, A. Doping effect investigation of Li-doped nanostructured ZnO thin films prepared by sol–gel process. J. Mater. Sci. Mater. Electron. 2016, 27, 8040–8046. [Google Scholar]
- Taha, S.A.; Ezzeldien, M.; Omran, K.; El-sadek, A.; Sayed, M. Zn1-xMgxO Nanocomposites: Synthesis, Structural, Optical Properties and Antibacterial Activity. Egypt. J. Phys. 2023, 51, 35–56. [Google Scholar]
- Rehman, M.-u.; Rehman, W.; Waseem, M.; Hussain, S.; Haq, S.; Rehman, M.A.-U. Adsorption mechanism of Pb2+ ions by Fe3O4, SnO2, and TiO2 nanoparticles. Environ. Sci. Pollut. Res. 2019, 26, 19968–19981. [Google Scholar] [CrossRef]
- Khan, M.; Ware, P.; Shimpi, N. Synthesis of ZnO nanoparticles using peels of Passiflora foetida and study of its activity as an efficient catalyst for the degradation of hazardous organic dye. SN Appl. Sci. 2021, 3, 528. [Google Scholar] [CrossRef]
- Mahlaule-Glory, L.M.; Mathobela, S.; Hintsho-Mbita, N.C. Biosynthesized bimetallic (ZnOSnO2) nanoparticles for photocatalytic degradation of organic dyes and pharmaceutical pollutants. Catalysts 2022, 12, 334. [Google Scholar] [CrossRef]
- Aljboar, M.T.; Alghamdi, A.A.; Al-Odayni, A.-B.; Al-Zaben, M.I.; Al-Kahtani, A.; Saeed, W.S. Synthesis of Poly (aniline-co-benzene)-Based Hypercrosslinked Polymer for Hg (II) Ions Removal from Polluted Water: Kinetic and Thermodynamic Studies. Water 2023, 15, 3009. [Google Scholar] [CrossRef]
- Sinha, K. Tunable structural, optical and electrical properties of annealed ZnO-SnO2 composite thin films deposited by pulsed laser deposition. Adv. Mater. Lett. 2016, 7, 319–324. [Google Scholar] [CrossRef]
- Suthakaran, S.; Dhanapandian, S.; Krishnakumar, N.; Ponpandian, N. Surfactants assisted SnO2 nanoparticles synthesized by a hydrothermal approach and potential applications in water purification and energy conversion. J. Mater. Sci. Mater. Electron. 2019, 30, 13174–13190. [Google Scholar] [CrossRef]
- Das, I.; Sagadevan, S.; Chowdhury, Z.Z.; Hoque, M.E. Development, optimization and characterization of a two step sol–gel synthesis route for ZnO/SnO2 nanocomposite. J. Mater. Sci. Mater. Electron. 2018, 29, 4128–4135. [Google Scholar] [CrossRef]
- Singh, N.K.; Saha, S.; Pal, A. Solar light-induced photocatalytic degradation of methyl red in an aqueous suspension of commercial ZnO: A green approach. Desalination Water Treat. 2015, 53, 501–514. [Google Scholar] [CrossRef]
- Zhang, M.; An, T.; Hu, X.; Wang, C.; Sheng, G.; Fu, J. Preparation and photocatalytic properties of a nanometer ZnO–SnO2 coupled oxide. Appl. Catal. A Gen. 2004, 260, 215–222. [Google Scholar] [CrossRef]
- Kumar, R.; Umar, A.; Kumar, R.; Chauhan, M.; Al-Hadeethi, Y. ZnO–SnO2 nanocubes for fluorescence sensing and dye degradation applications. Ceram. Int. 2021, 47, 6201–6210. [Google Scholar] [CrossRef]
- Pascariu, P.; Cojocaru, C.; Olaru, N.; Airinei, A. Photocatalytic activity of ZnO–SnO2 ceramic nanofibers for RhB dye degradation: Experimental design, modeling, and process optimization. Phys. Status Solidi (B) 2019, 256, 1800474. [Google Scholar] [CrossRef]
- Wang, C.; Wang, X.; Xu, B.-Q.; Zhao, J.; Mai, B.; Sheng, G.; Fu, J. Enhanced photocatalytic performance of nanosized coupled ZnO/SnO2 photocatalysts for methyl orange degradation. J. Photochem. Photobiol. A Chem. 2004, 168, 47–52. [Google Scholar] [CrossRef]


| Catalyst | Crystalline Size (nm) | Band Gap (eV) |
|---|---|---|
| ZnO | 17.24 | 3.10 |
| SnO2 | 19.07 | 3.45 |
| ZT10 | 13.99 | 3.14 |
| ZT20 | 6.45 | 3.17 |
| ZT30 | 12.30 | 3.21 |
| Catalyst | Surface Area (m2/g) | Pore Volume (cm³/g) | Pore Size (Å) |
|---|---|---|---|
| ZnO | 38.5387 | 0.179606 | 168.217 |
| SnO2 | 7.9516 | 0.019655 | 123.150 |
| ZT10 | 24.1879 | 0.175623 | 312.886 |
| ZT20 | 25.3492 | 0.096356 | 170.283 |
| ZT30 | 27.1261 | 0.143314 | 209.602 |
| Composition (Sn/Zn, mol) | D | Dye Pollutant | Light Source | Degradation Time (~100%) | Efficiency (Catalyst/Dye; g/g) | Ref. |
|---|---|---|---|---|---|---|
| 0.05:1 | MB | Ultraviolet | 90 min | 16 | [30] | |
| Visible | 240 min (70%) | |||||
| Solar | 240 min (75%) | |||||
| 2:1 | MO | Ultraviolet | 30 min | 125 | [47] | |
| 1:1 | 16.5 | MO | Ultraviolet | 60 min (42%) | 50 | [48] |
| MB | 15 min (97%) | |||||
| 1:0.03 | RB | Ultraviolet | 240 min | 100 | [49] | |
| Visible | 13.3 hrs | |||||
| 1:2 | MO | Ultraviolet | 60 min | 125 | [50] | |
| 1:4 | 6.5 | MB | Solar | 55 min | 100 | This work |
| MO | 55 min | |||||
| RB | 65 min |
Disclaimer/Publisher’s Note: The statements, opinions and data contained in all publications are solely those of the individual author(s) and contributor(s) and not of MDPI and/or the editor(s). MDPI and/or the editor(s) disclaim responsibility for any injury to people or property resulting from any ideas, methods, instructions or products referred to in the content. |
© 2023 by the authors. Licensee MDPI, Basel, Switzerland. This article is an open access article distributed under the terms and conditions of the Creative Commons Attribution (CC BY) license (https://creativecommons.org/licenses/by/4.0/).
Share and Cite
Abduh, N.A.Y.; Al-Odayni, A.-B. Green Synthesis of ZnO/SnO2 Hybrid Nanocomposite for Degradation of Cationic and Anionic Dyes under Sunlight Radiation. Materials 2023, 16, 7398. https://doi.org/10.3390/ma16237398
Abduh NAY, Al-Odayni A-B. Green Synthesis of ZnO/SnO2 Hybrid Nanocomposite for Degradation of Cationic and Anionic Dyes under Sunlight Radiation. Materials. 2023; 16(23):7398. https://doi.org/10.3390/ma16237398
Chicago/Turabian StyleAbduh, Naaser A. Y., and Abdel-Basit Al-Odayni. 2023. "Green Synthesis of ZnO/SnO2 Hybrid Nanocomposite for Degradation of Cationic and Anionic Dyes under Sunlight Radiation" Materials 16, no. 23: 7398. https://doi.org/10.3390/ma16237398
APA StyleAbduh, N. A. Y., & Al-Odayni, A.-B. (2023). Green Synthesis of ZnO/SnO2 Hybrid Nanocomposite for Degradation of Cationic and Anionic Dyes under Sunlight Radiation. Materials, 16(23), 7398. https://doi.org/10.3390/ma16237398