
Robust Machine Learning Framework for Modeling the Compressive Strength of SFRC: Database Compilation, Predictive Analysis, and Empirical Verification


Abstract
:1. Introduction
2. Methodological Approach
2.1. Background
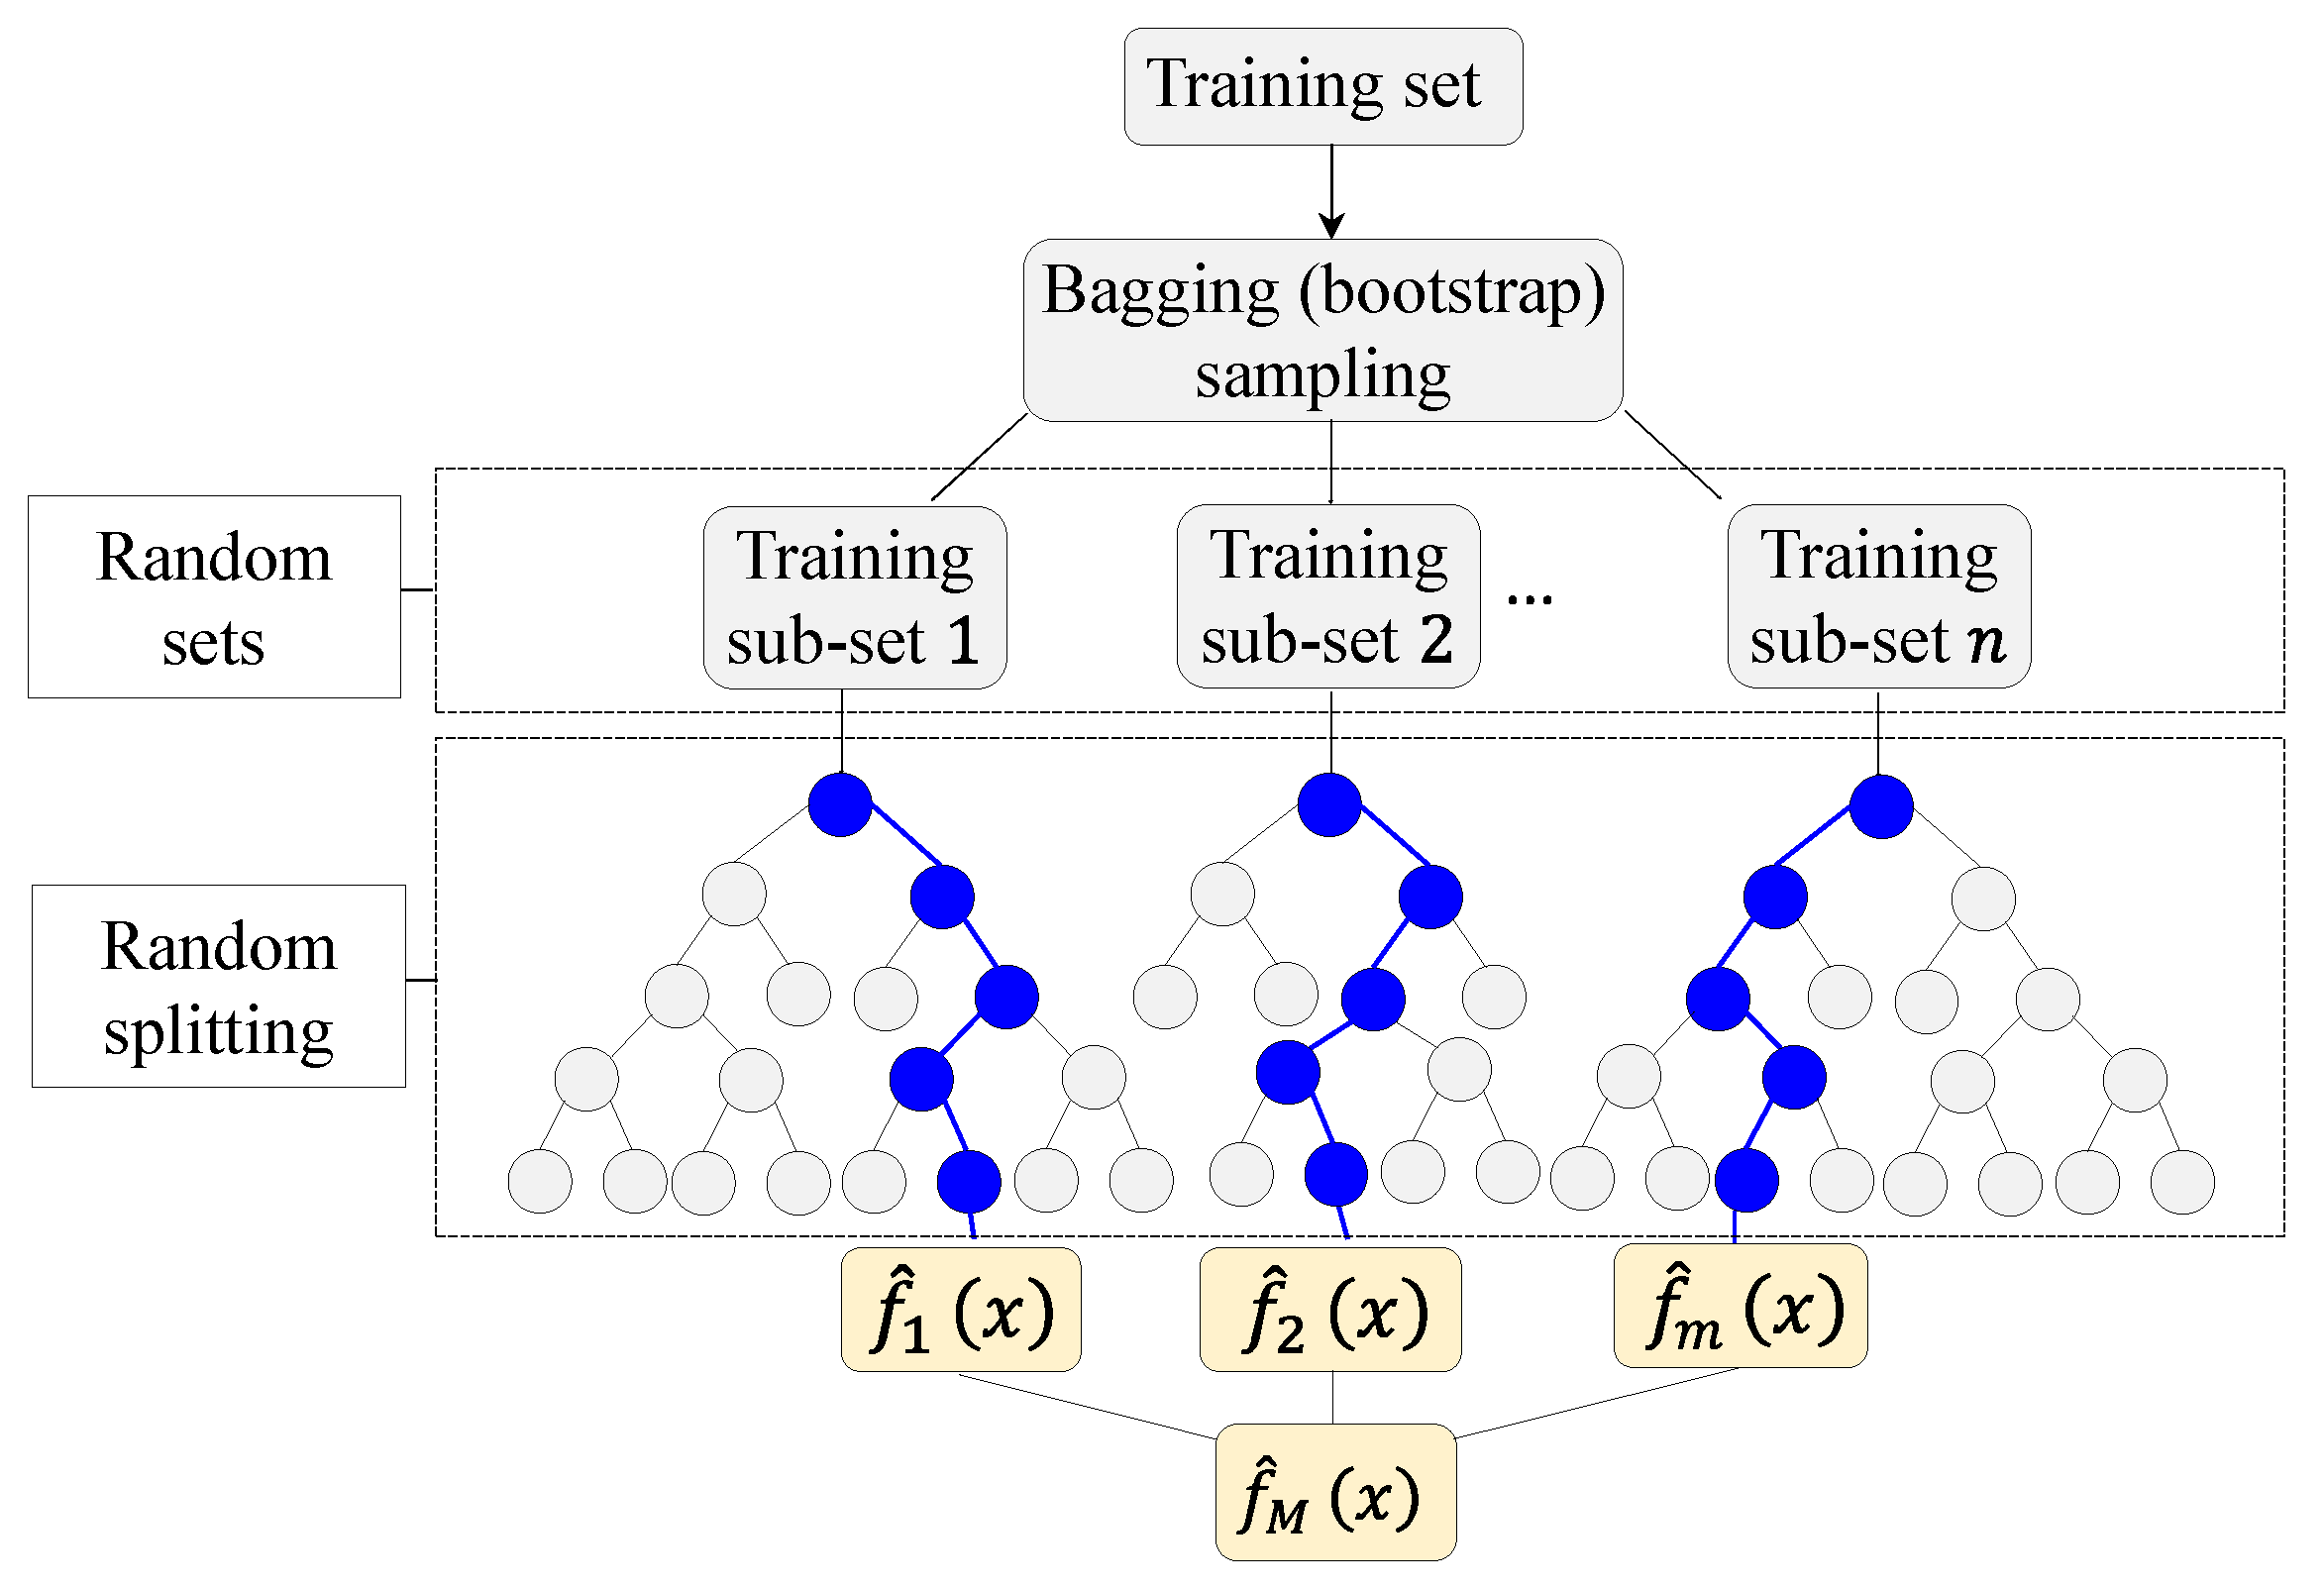
2.2. XG Boost Algorithm Development
2.3. Indicators of Prediction Performance
3. Data Collection, Characteristics, and Handling
3.1. Data Compilation
3.2. Data Wrangling and Statistical Analysis
3.2.1. Treatment of Outliers
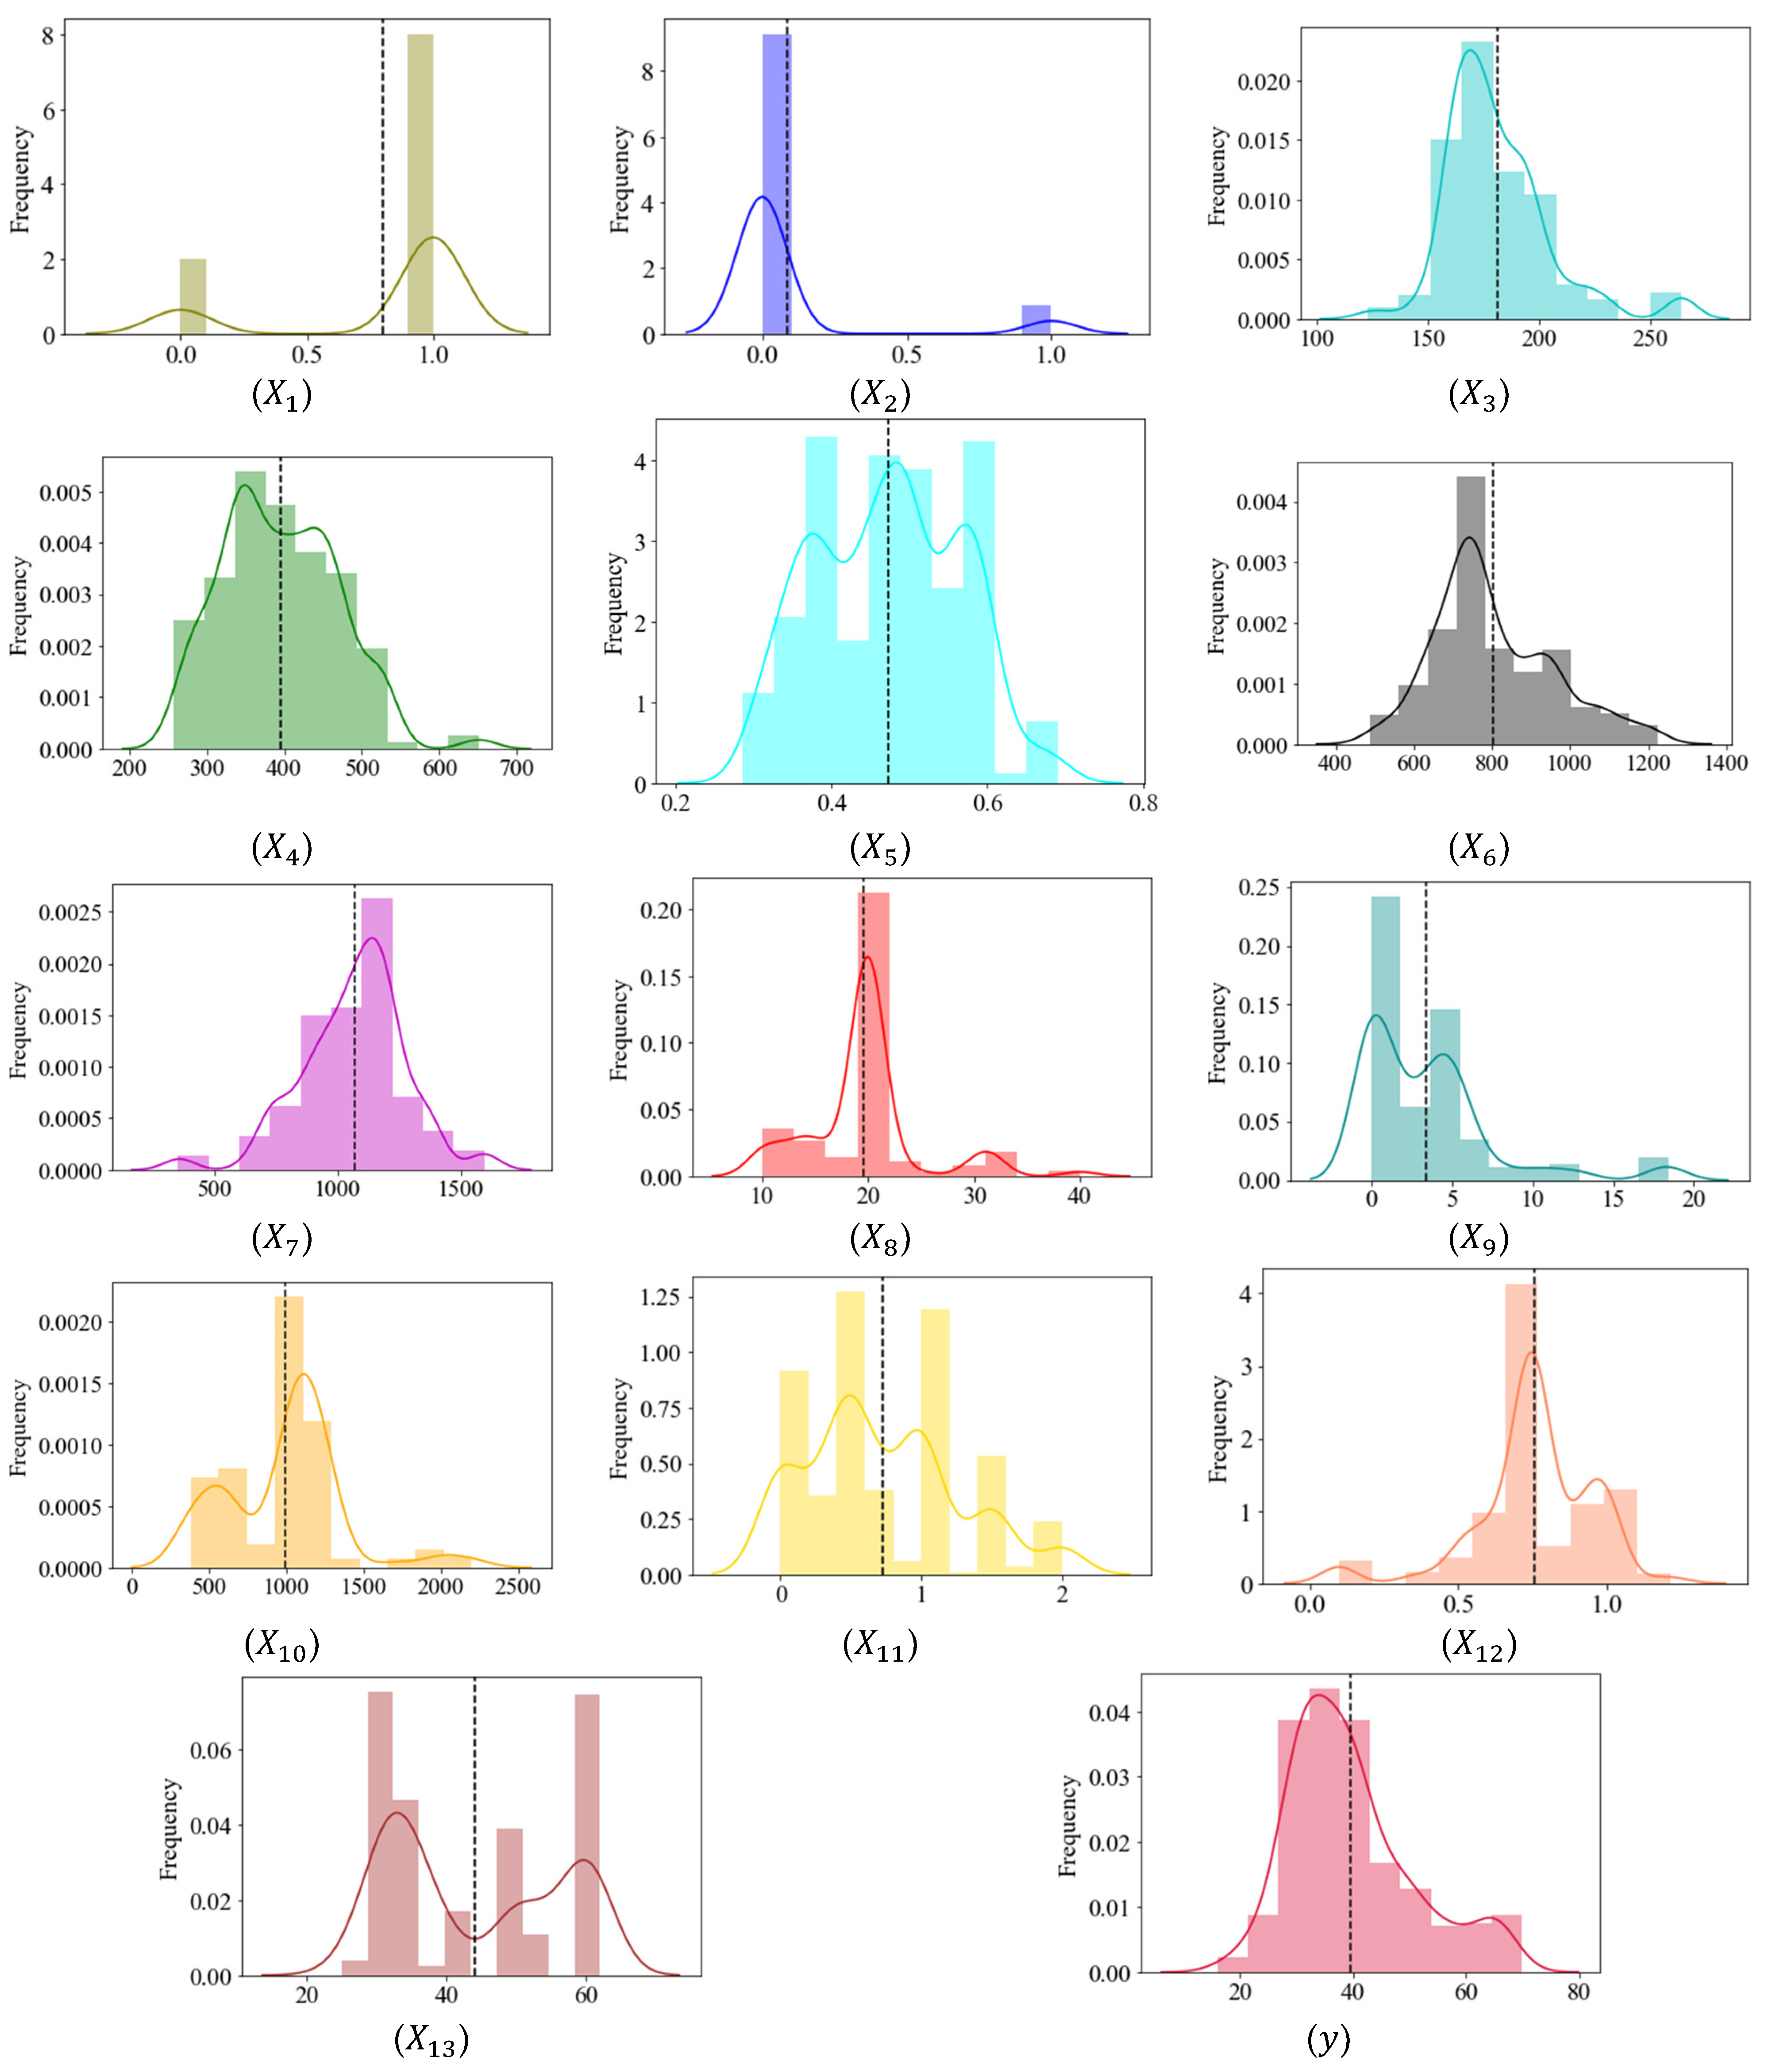
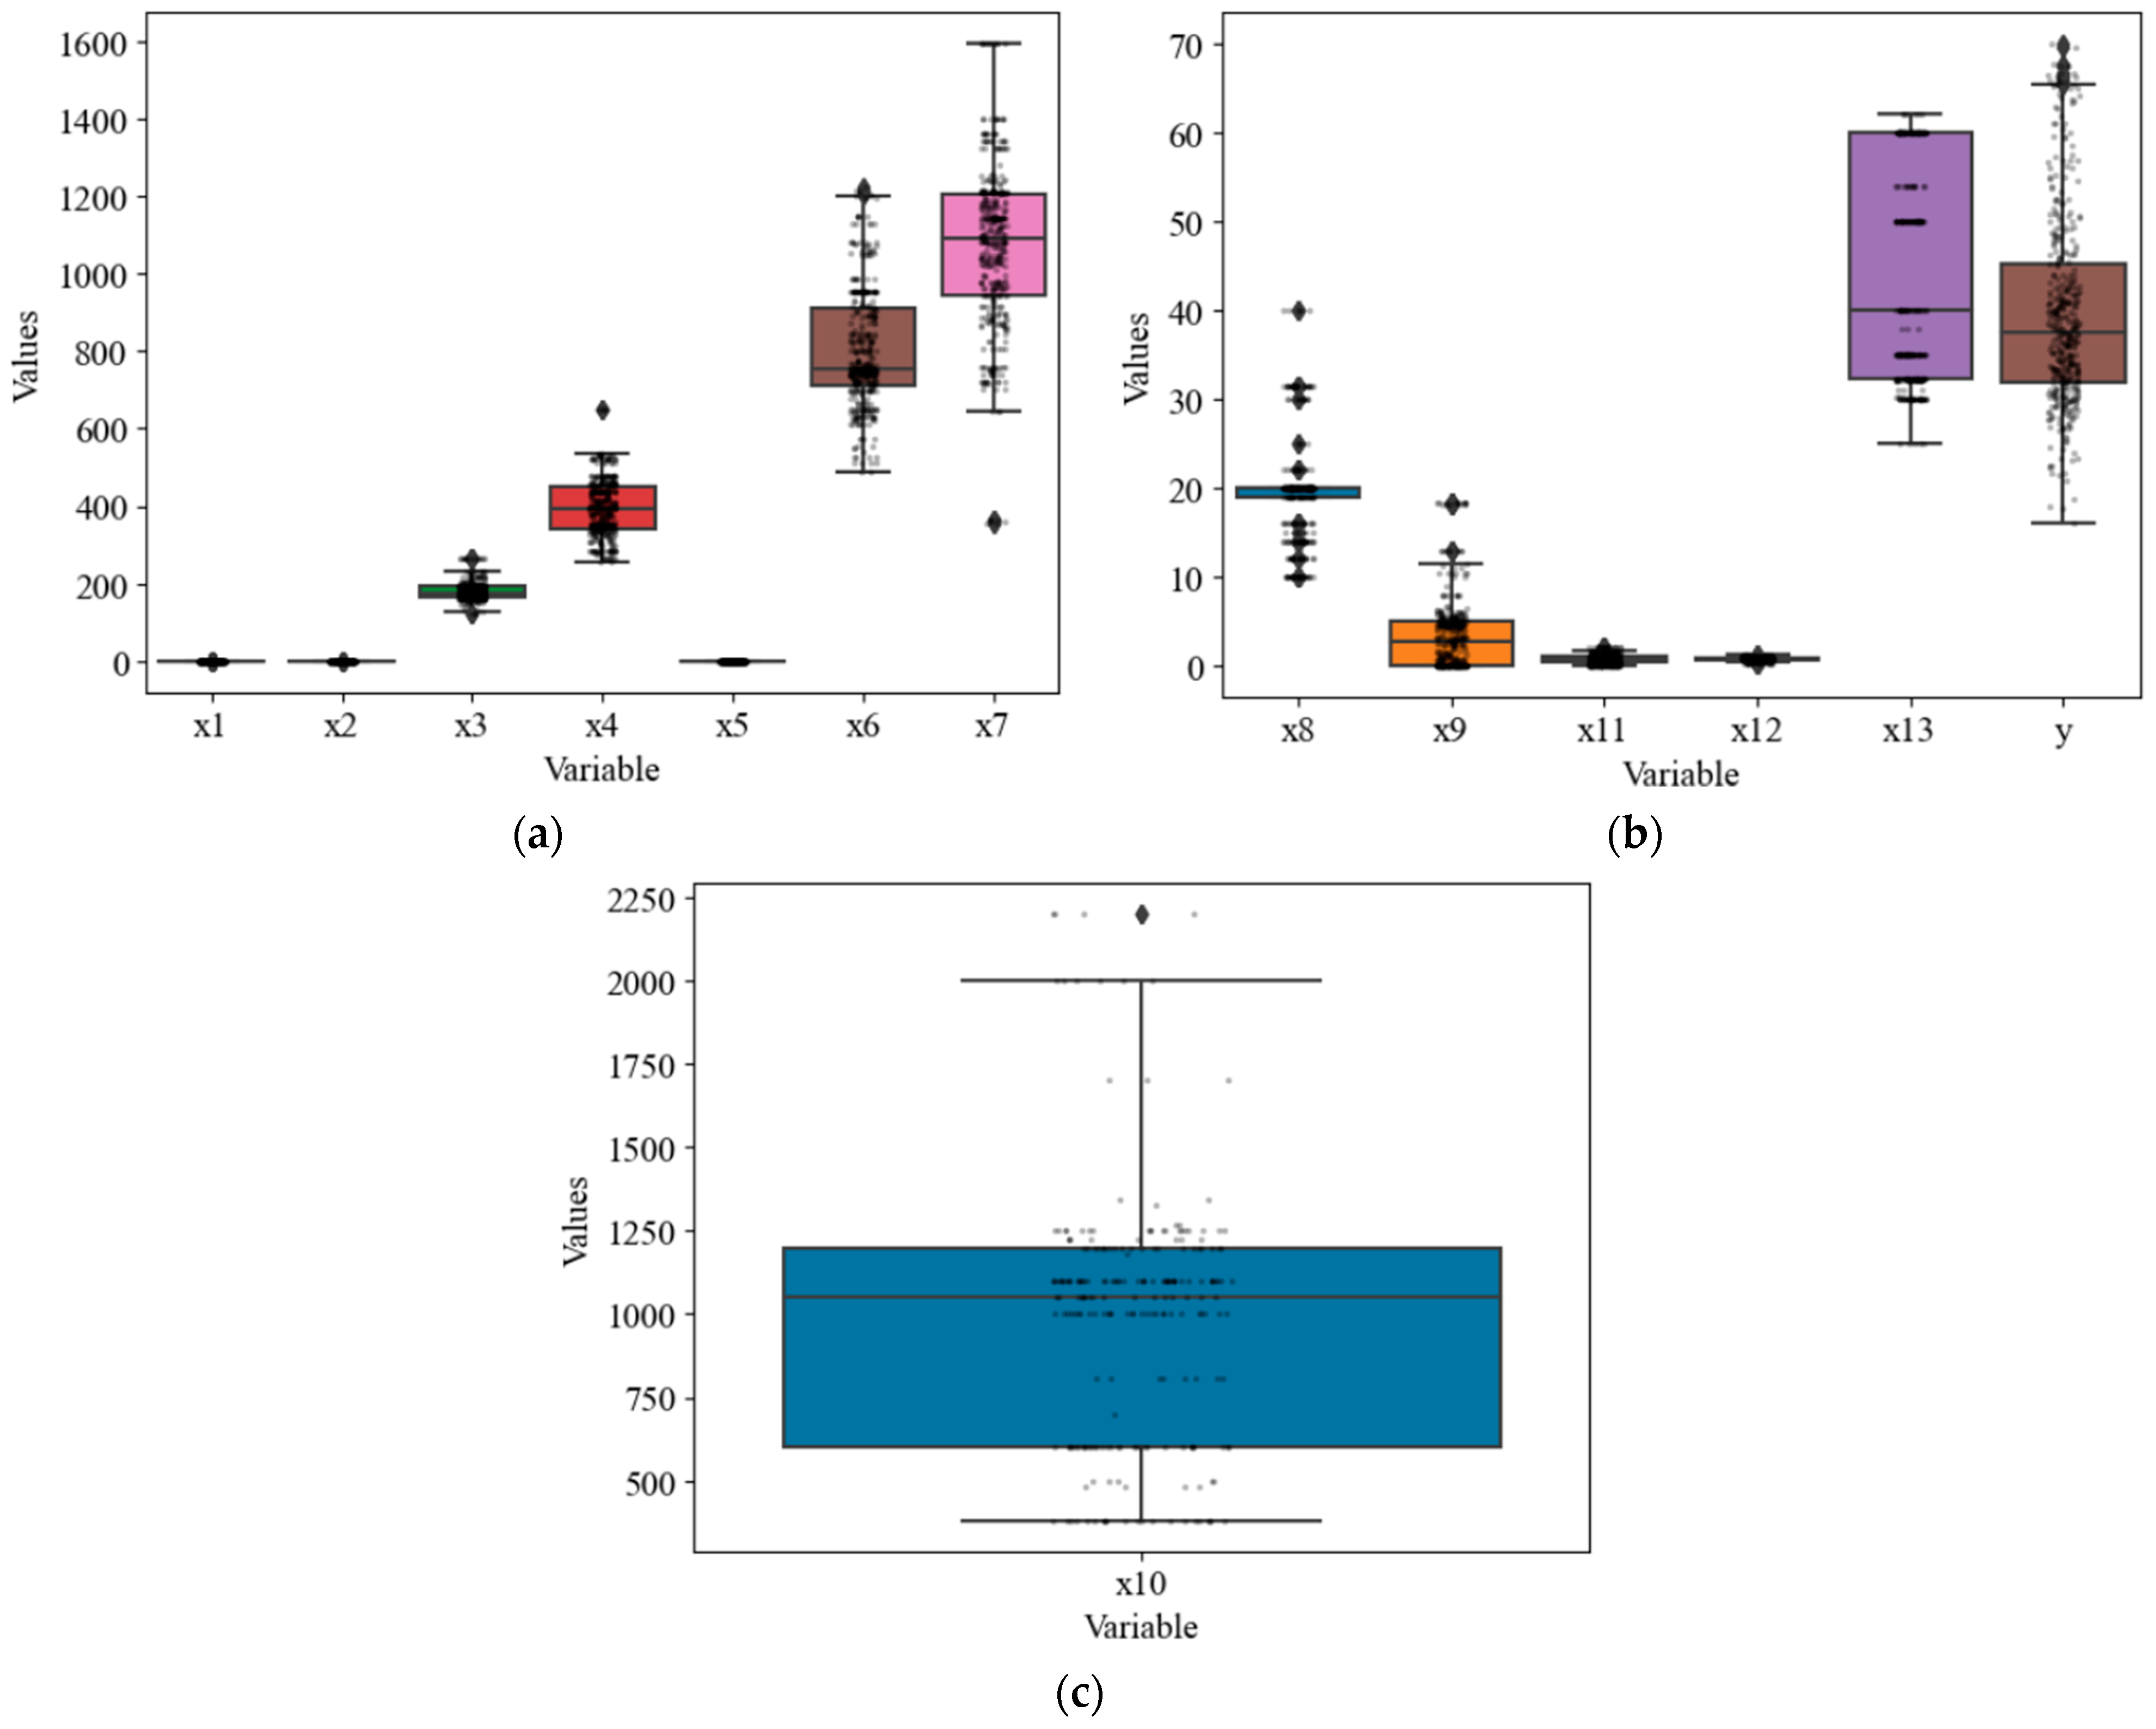
3.2.2. Data Descriptive Statistics and Visualization
4. Results and Discussion
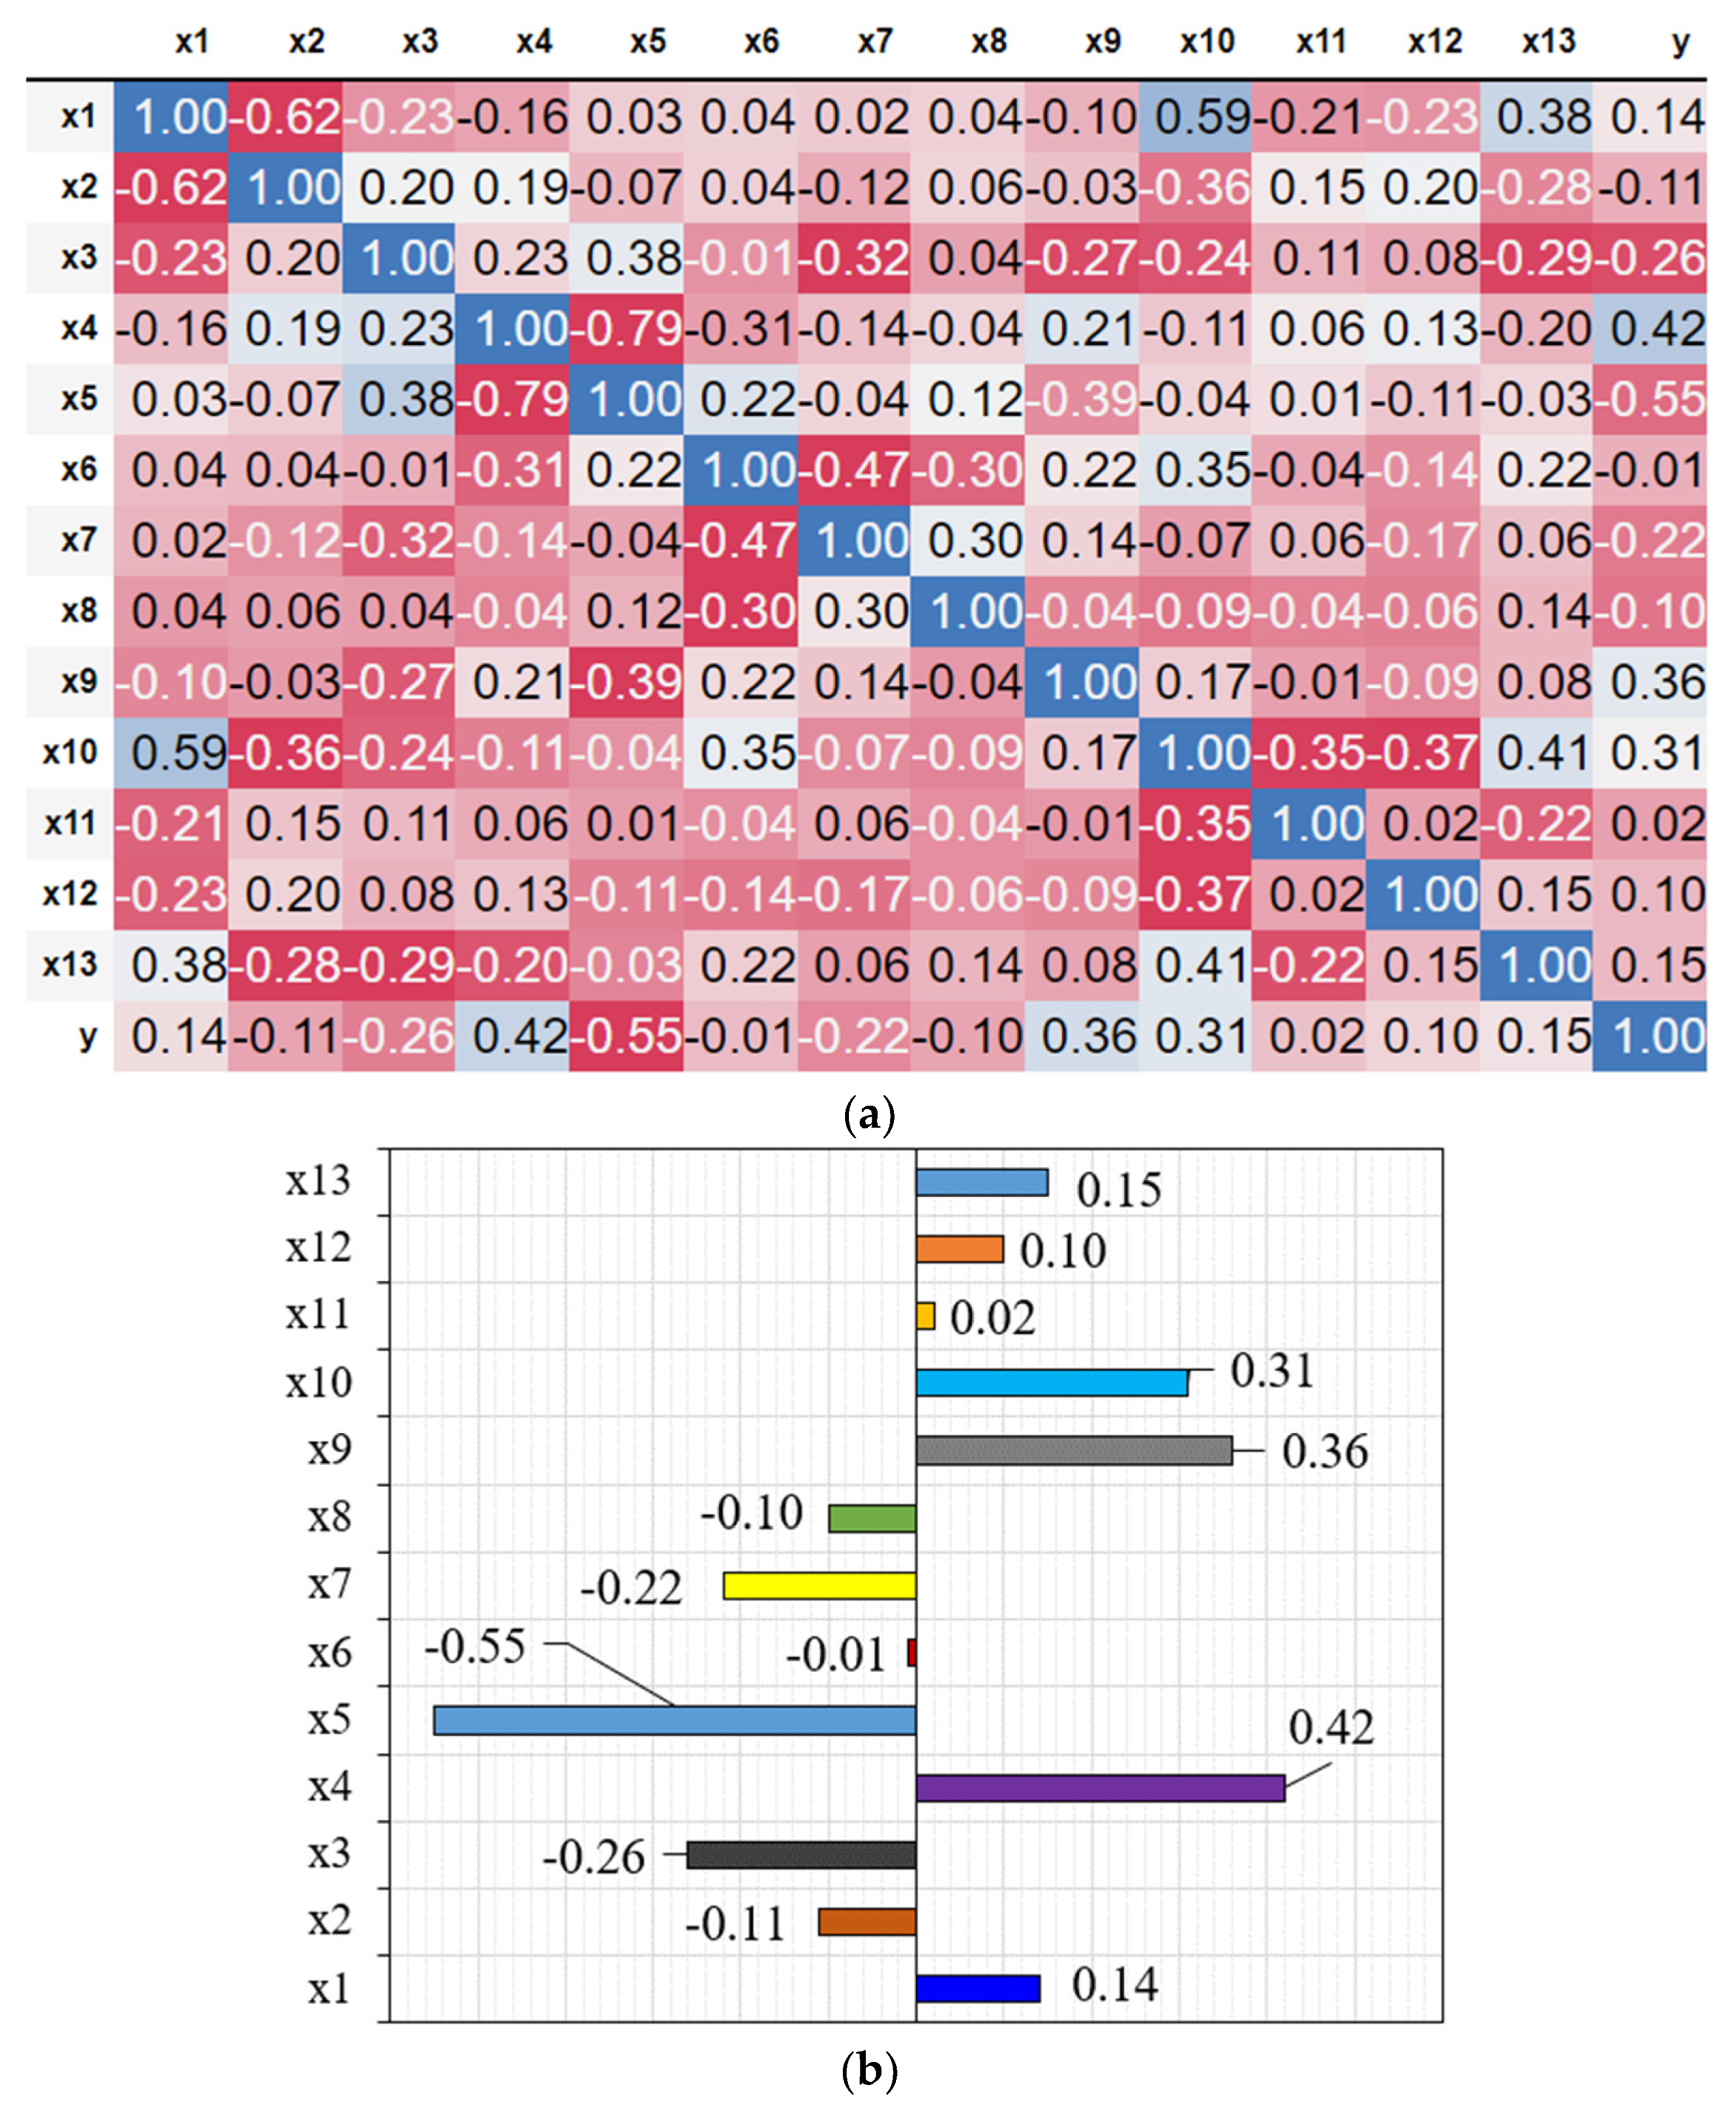
4.1. Features and Label Relations
4.2. Development and Performance of the Initial Model
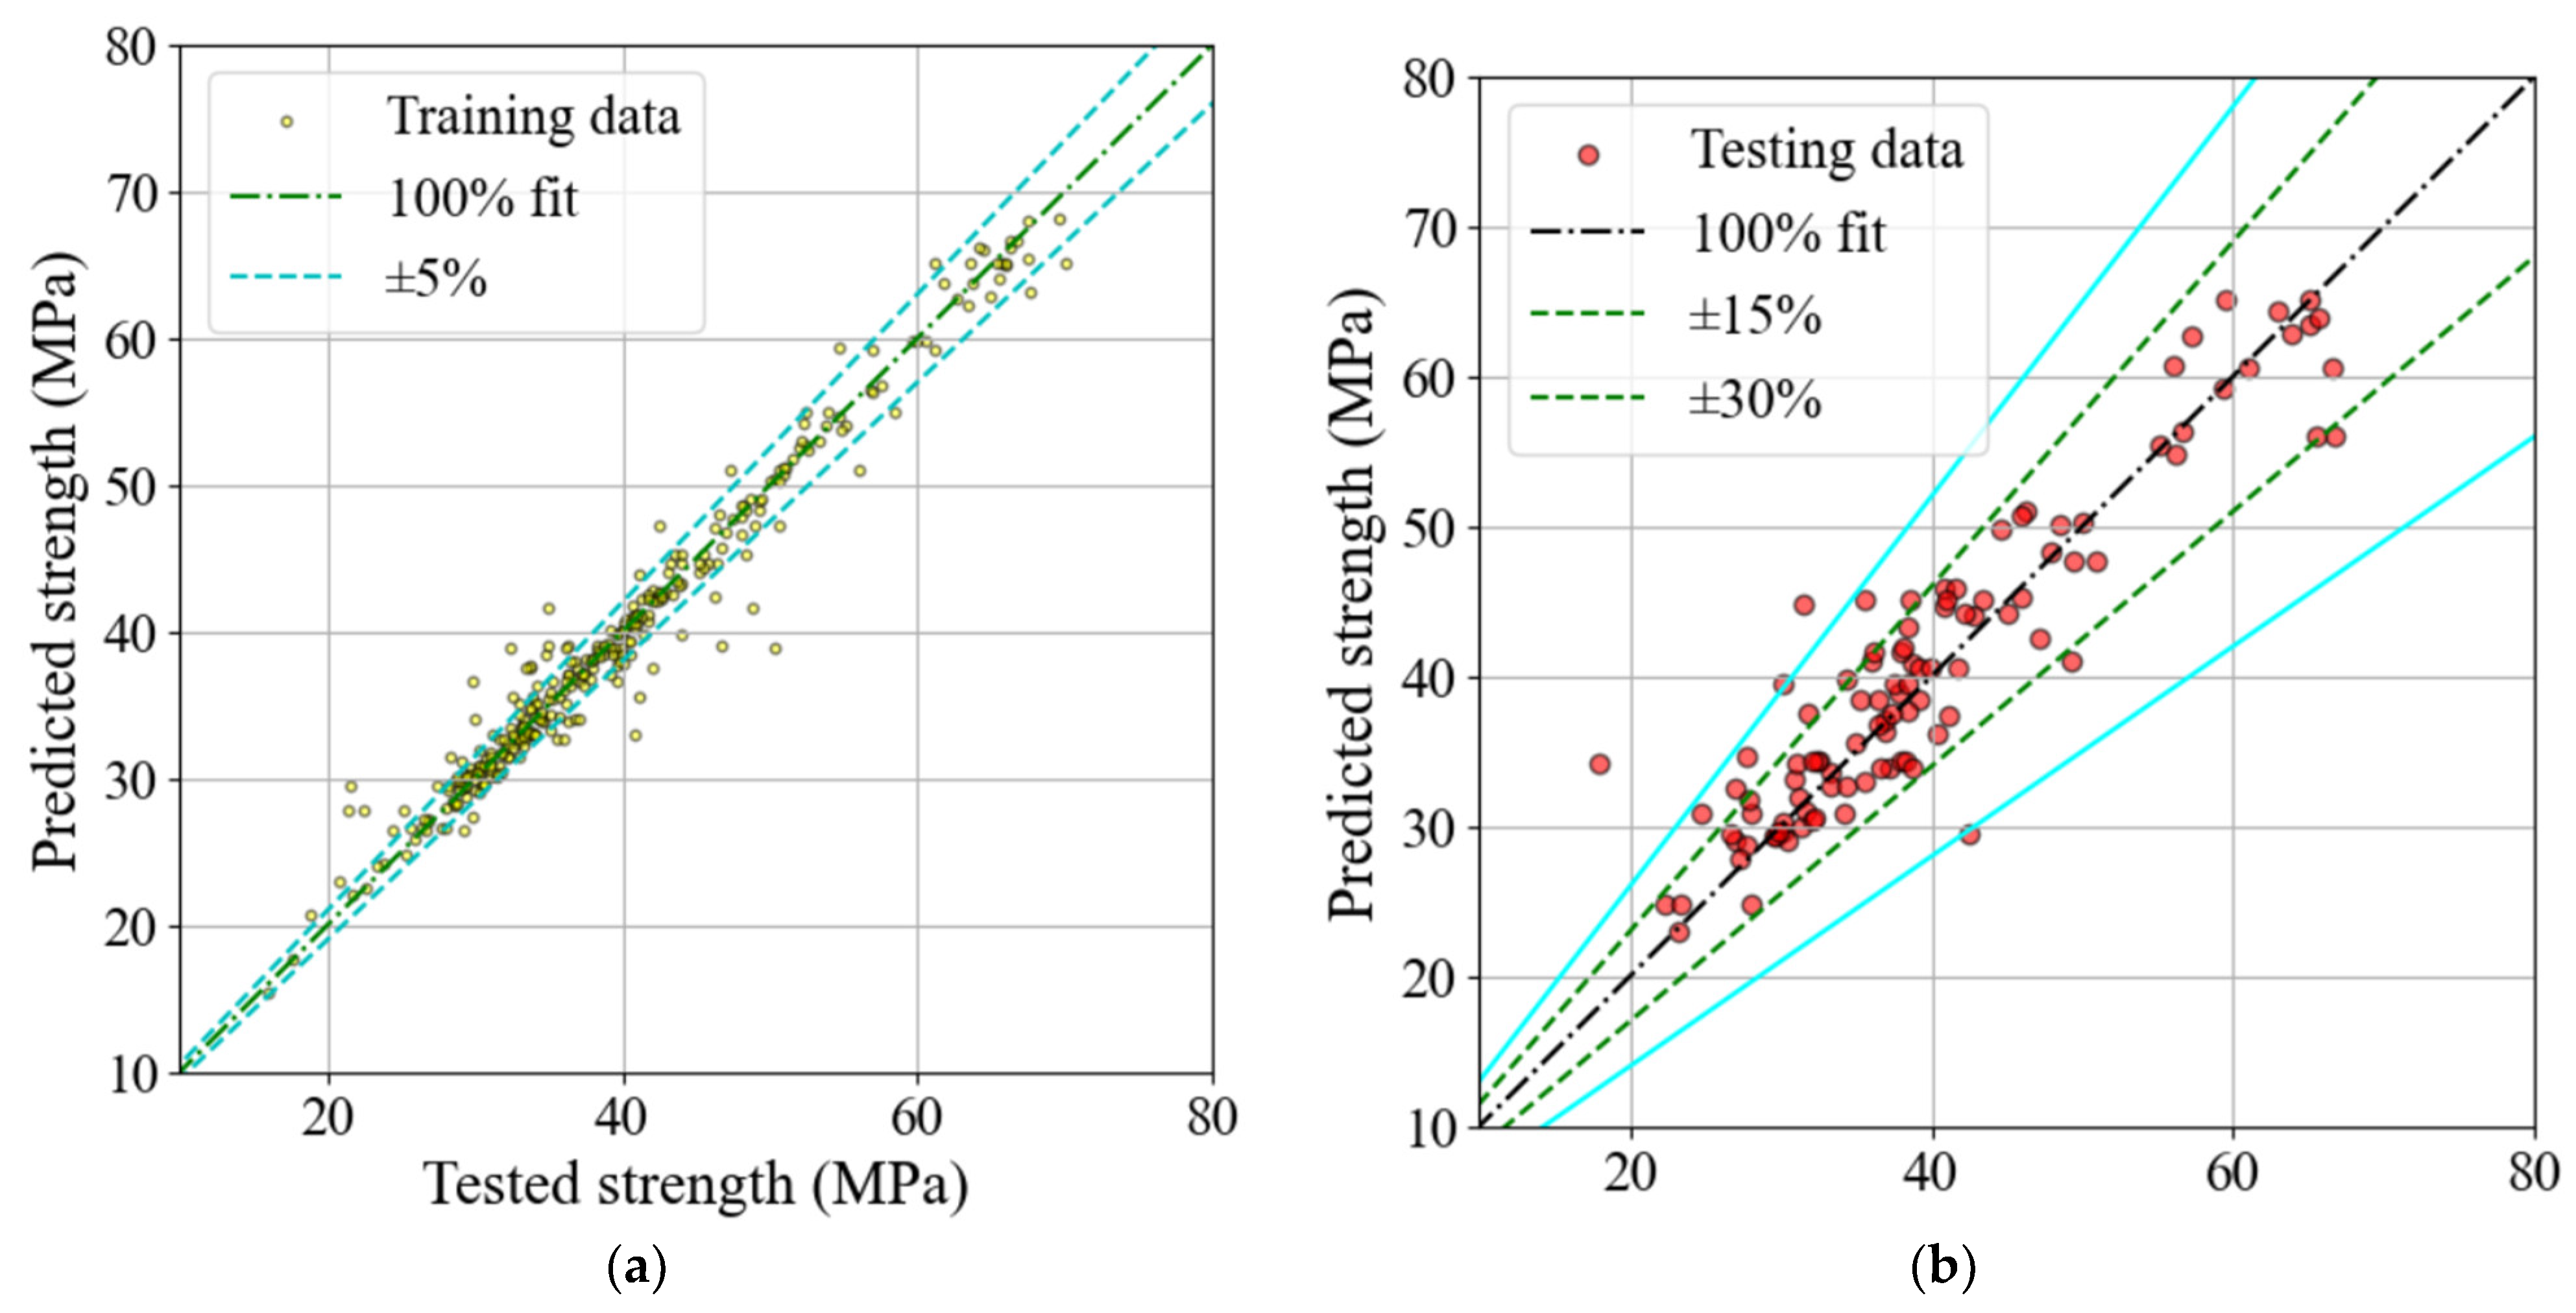
4.3. Fine-Tuned Model
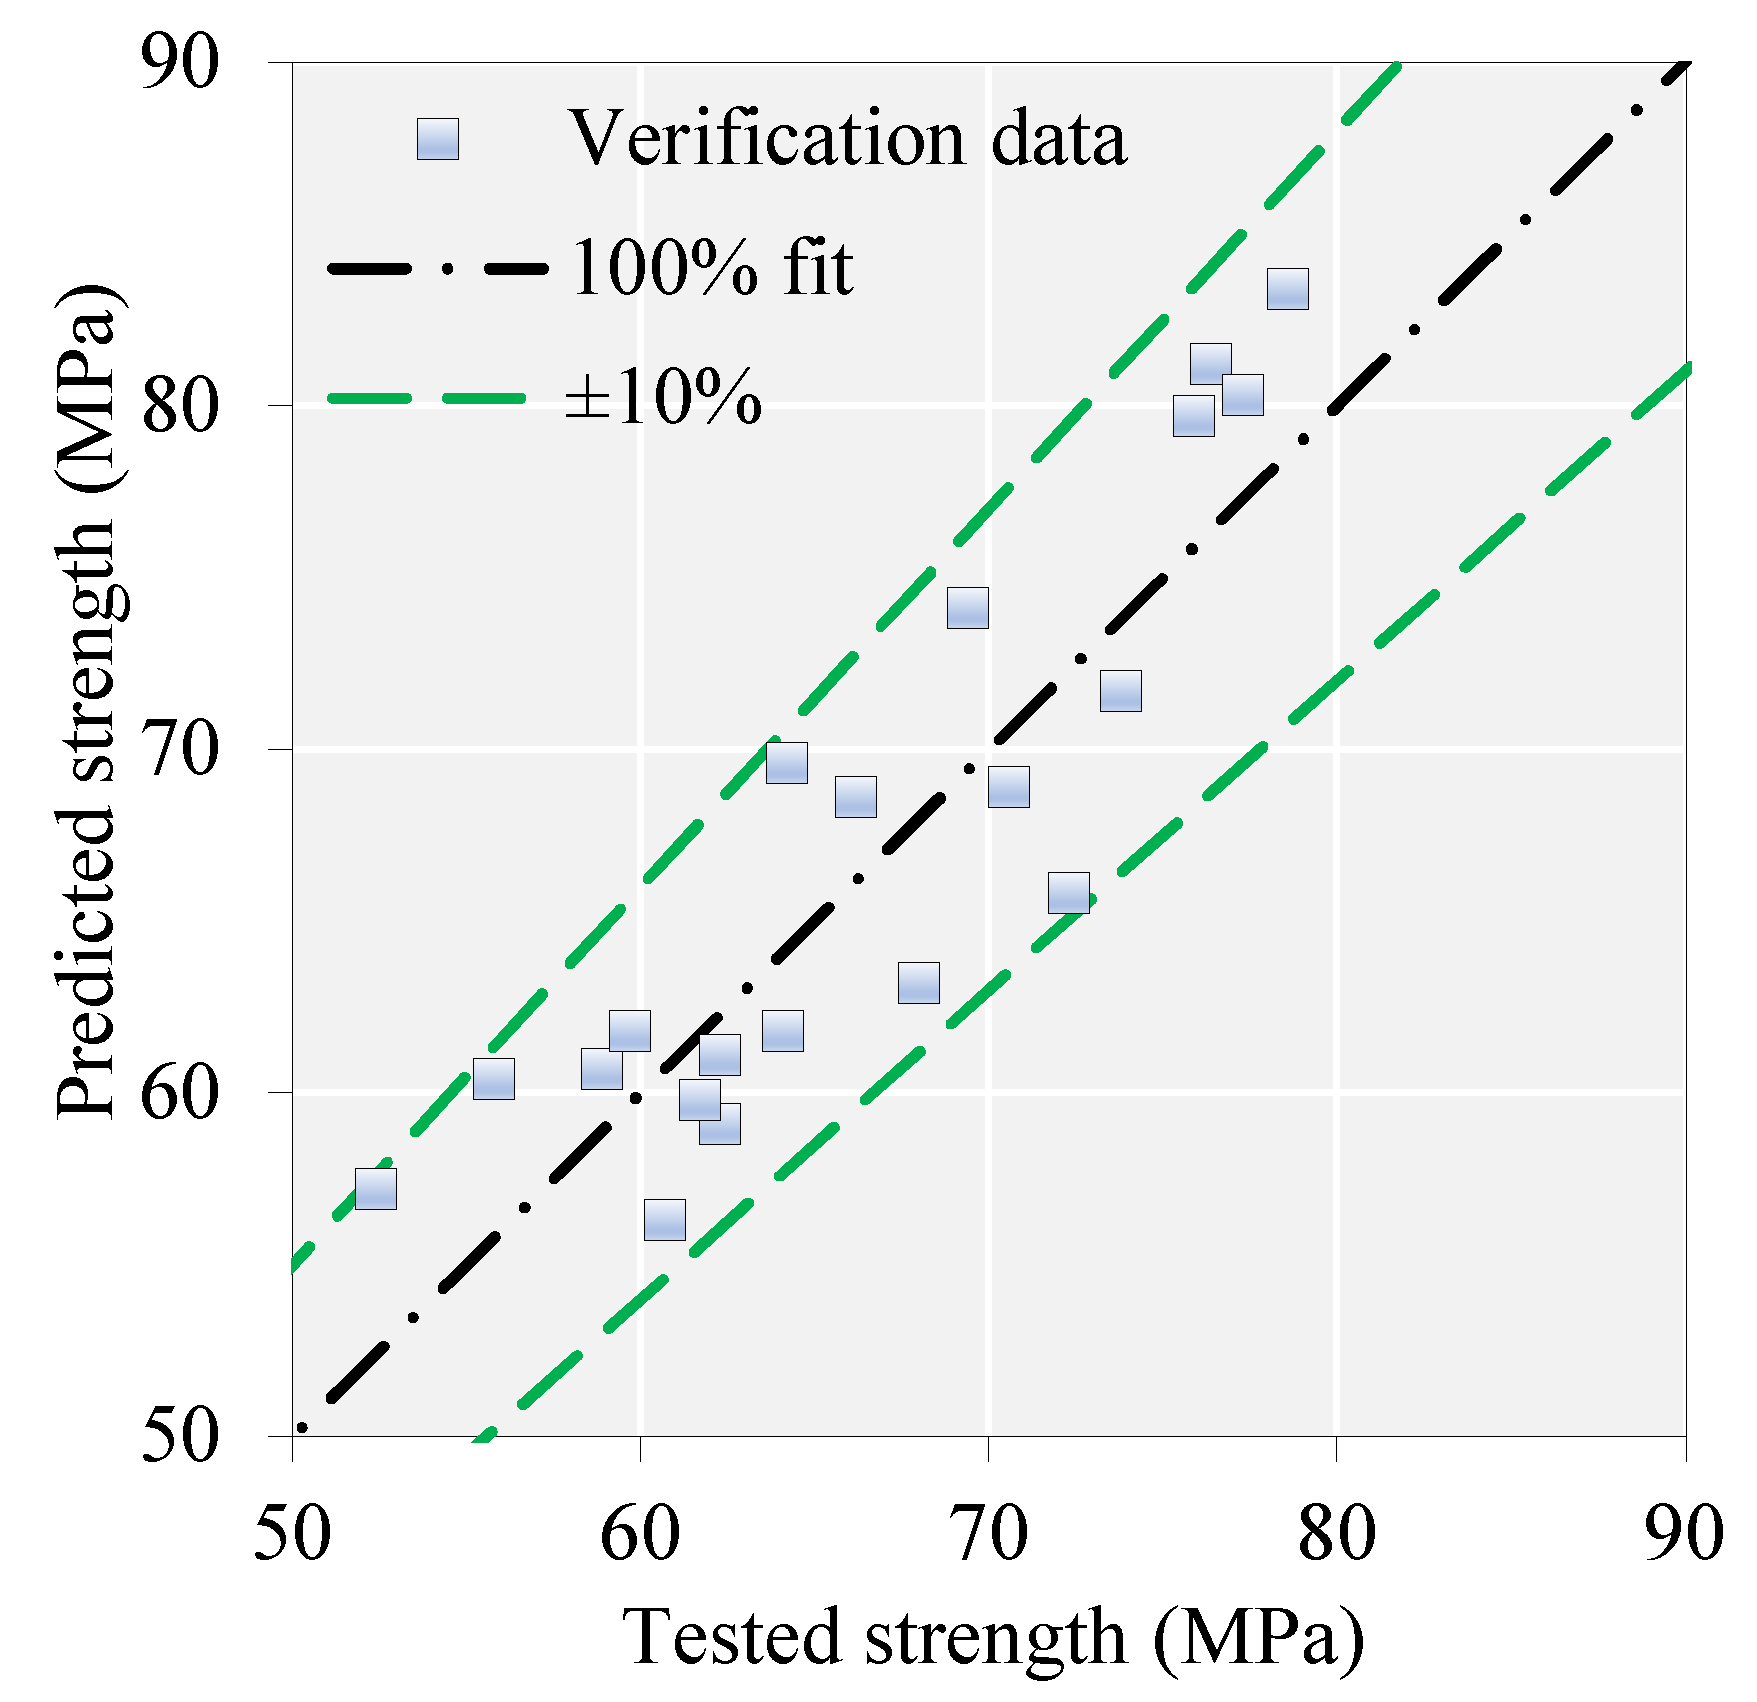
4.4. Experimental Verification
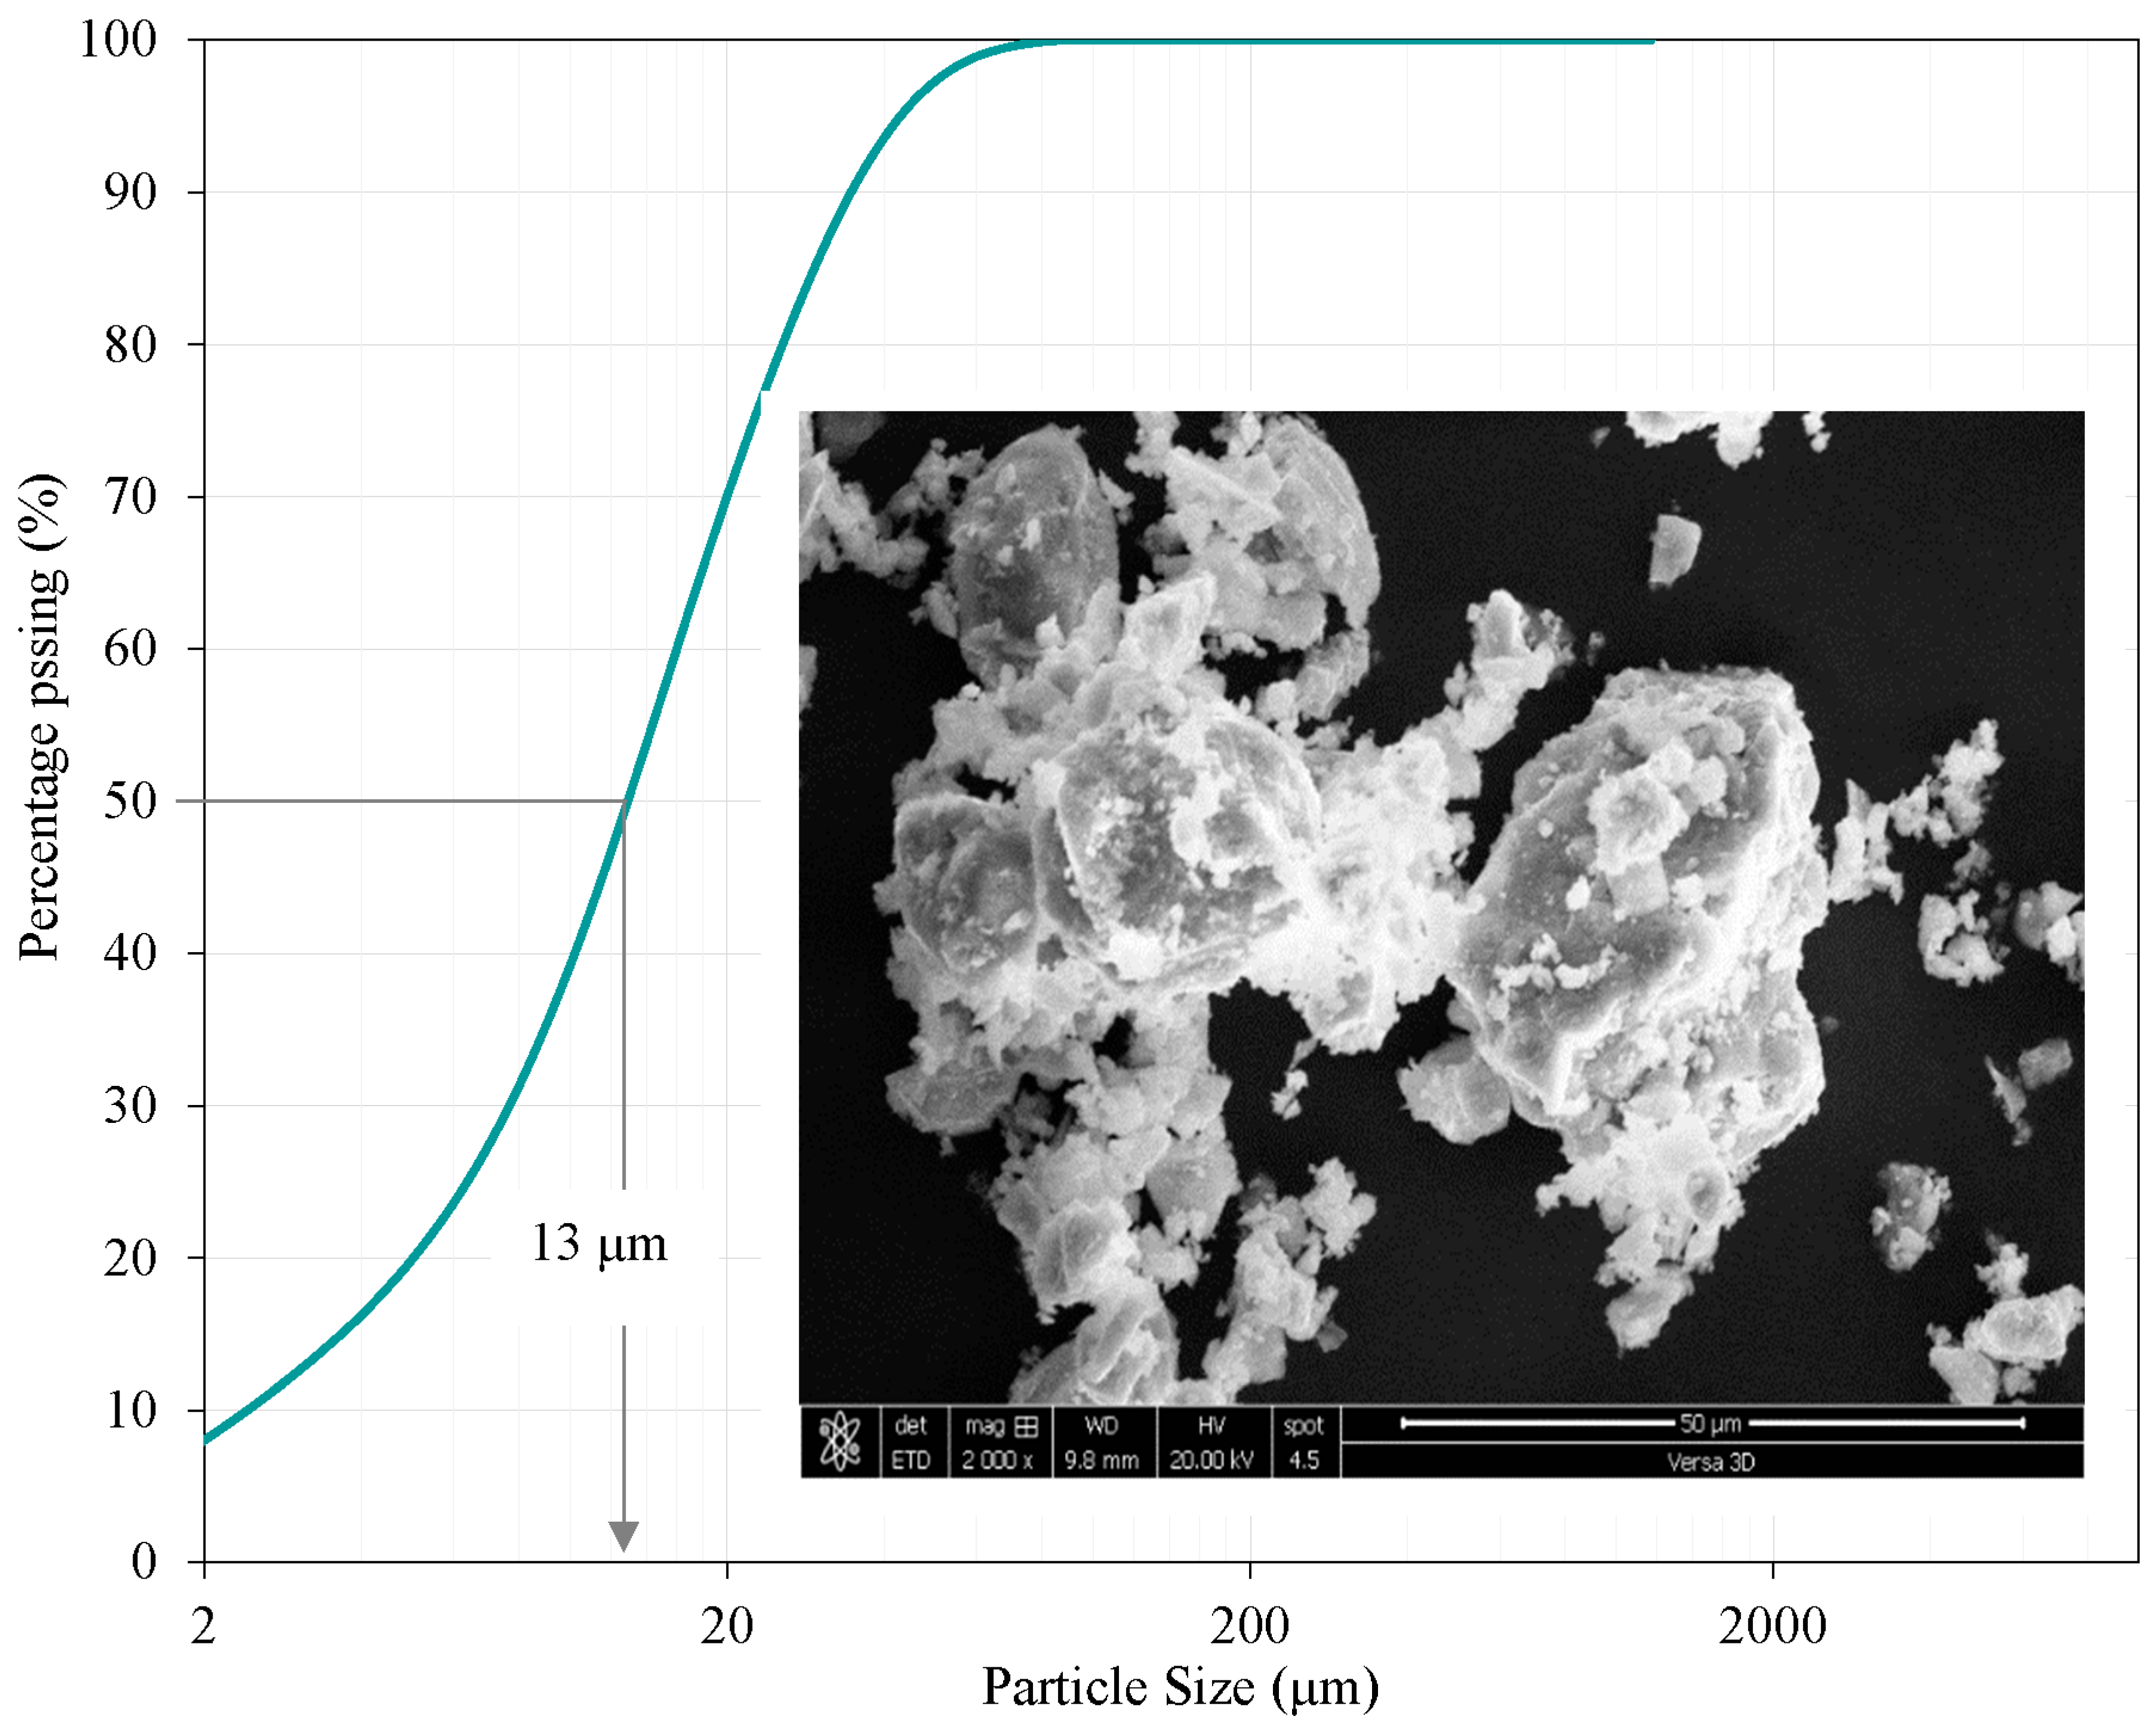
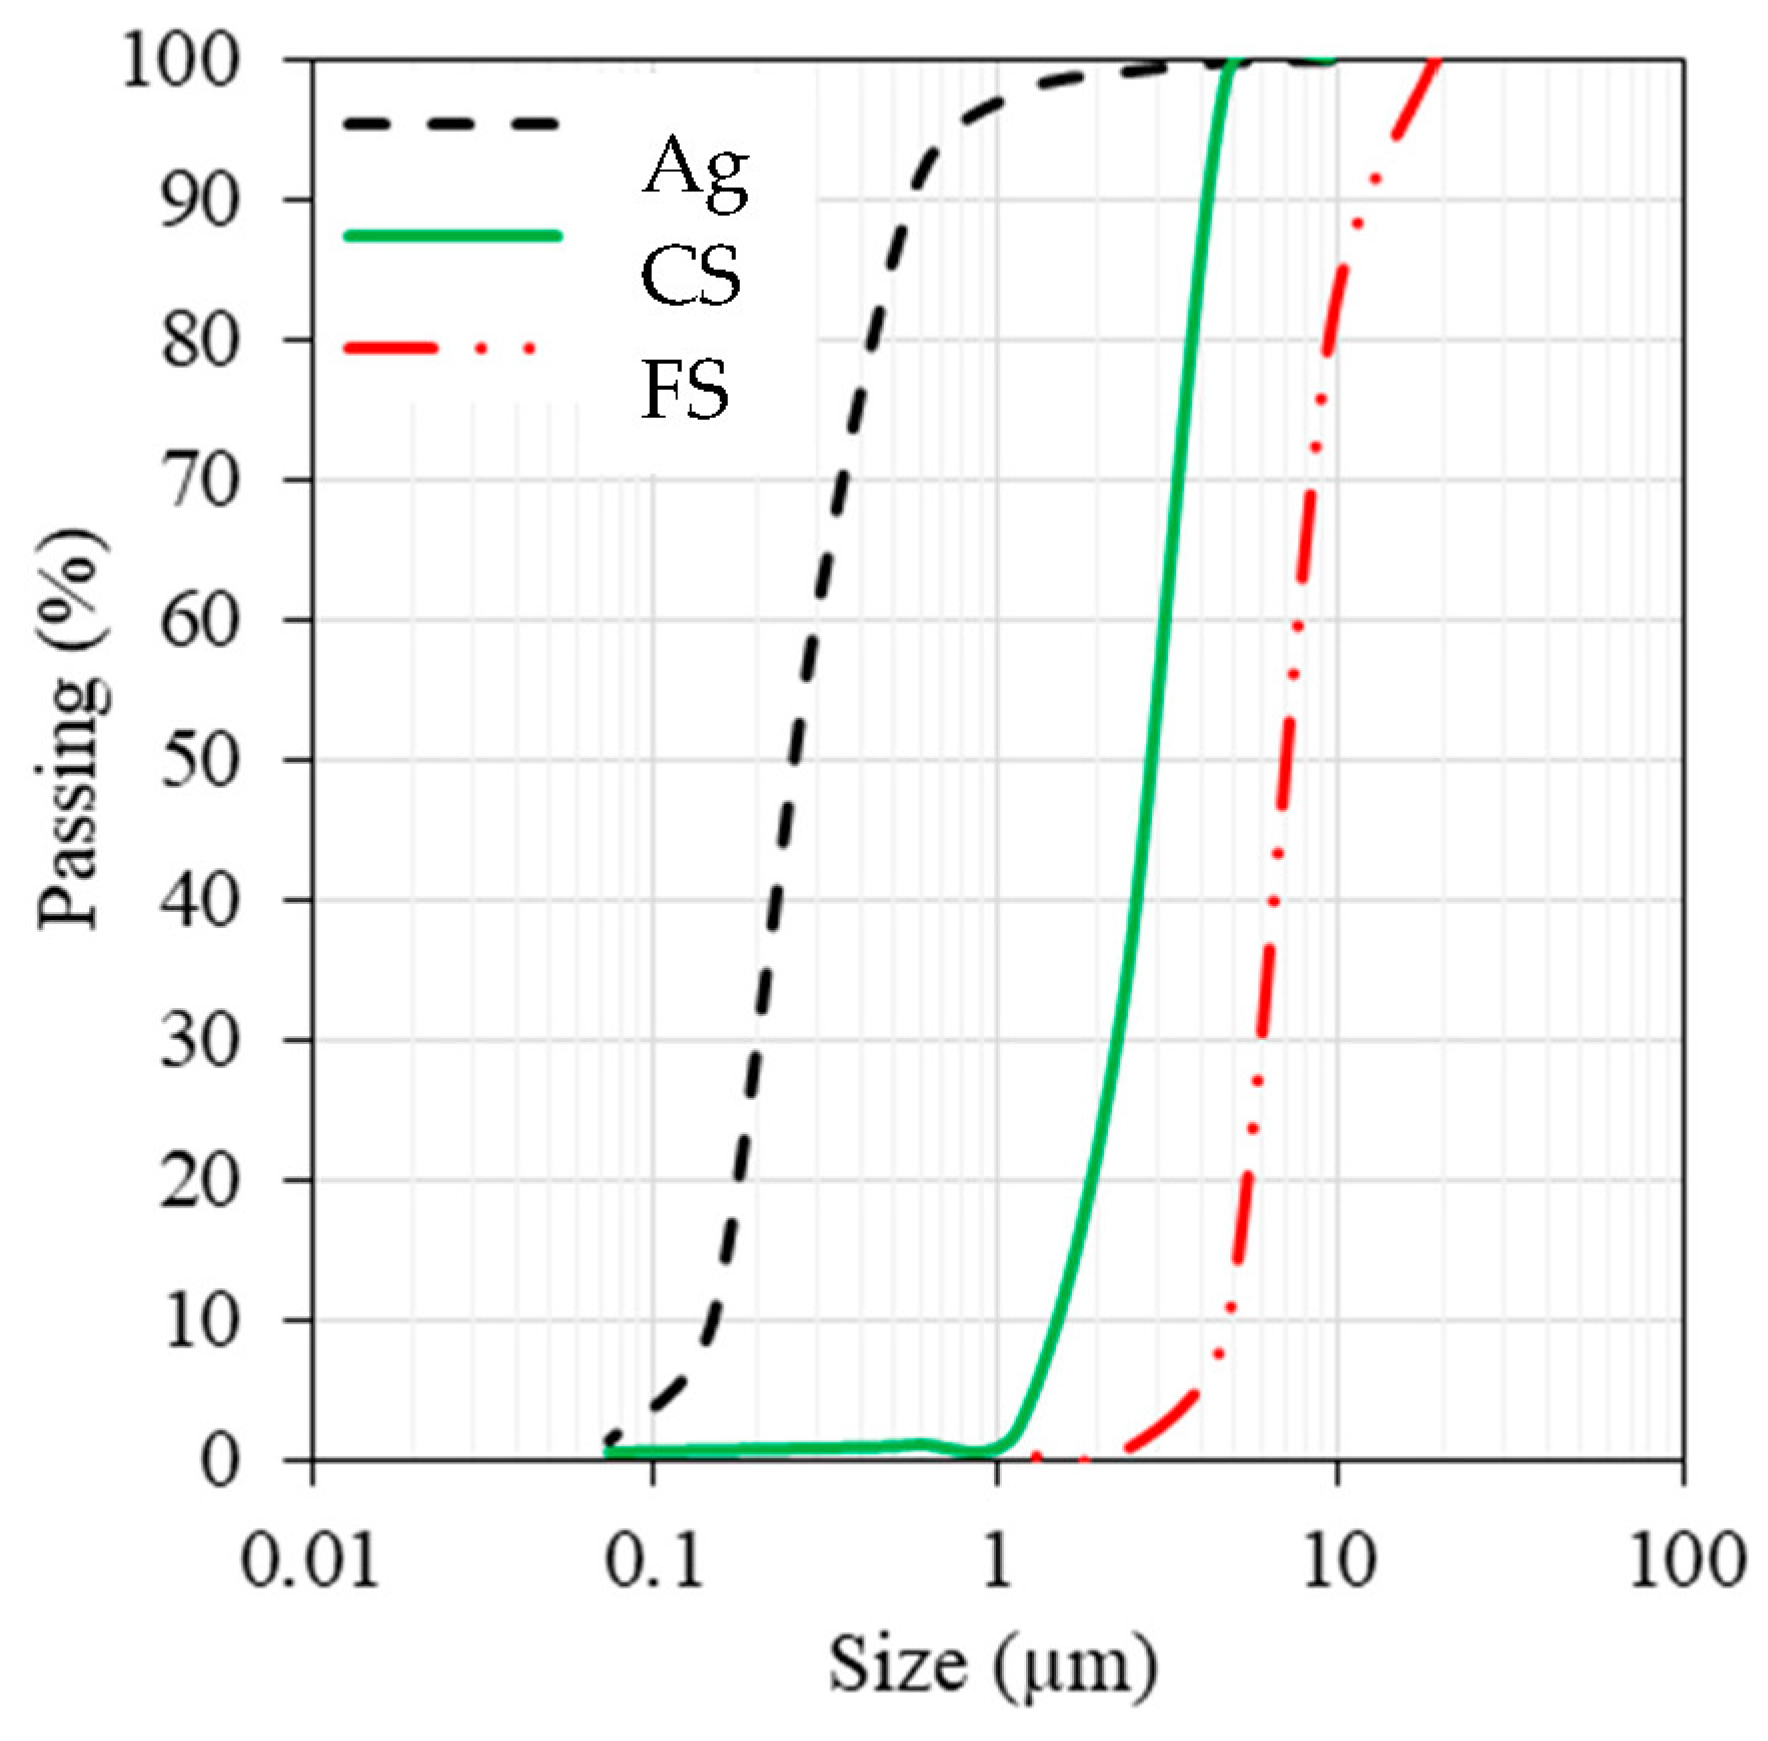
4.4.1. Materials
4.4.2. Methods
Mixing, Casting, and Curing
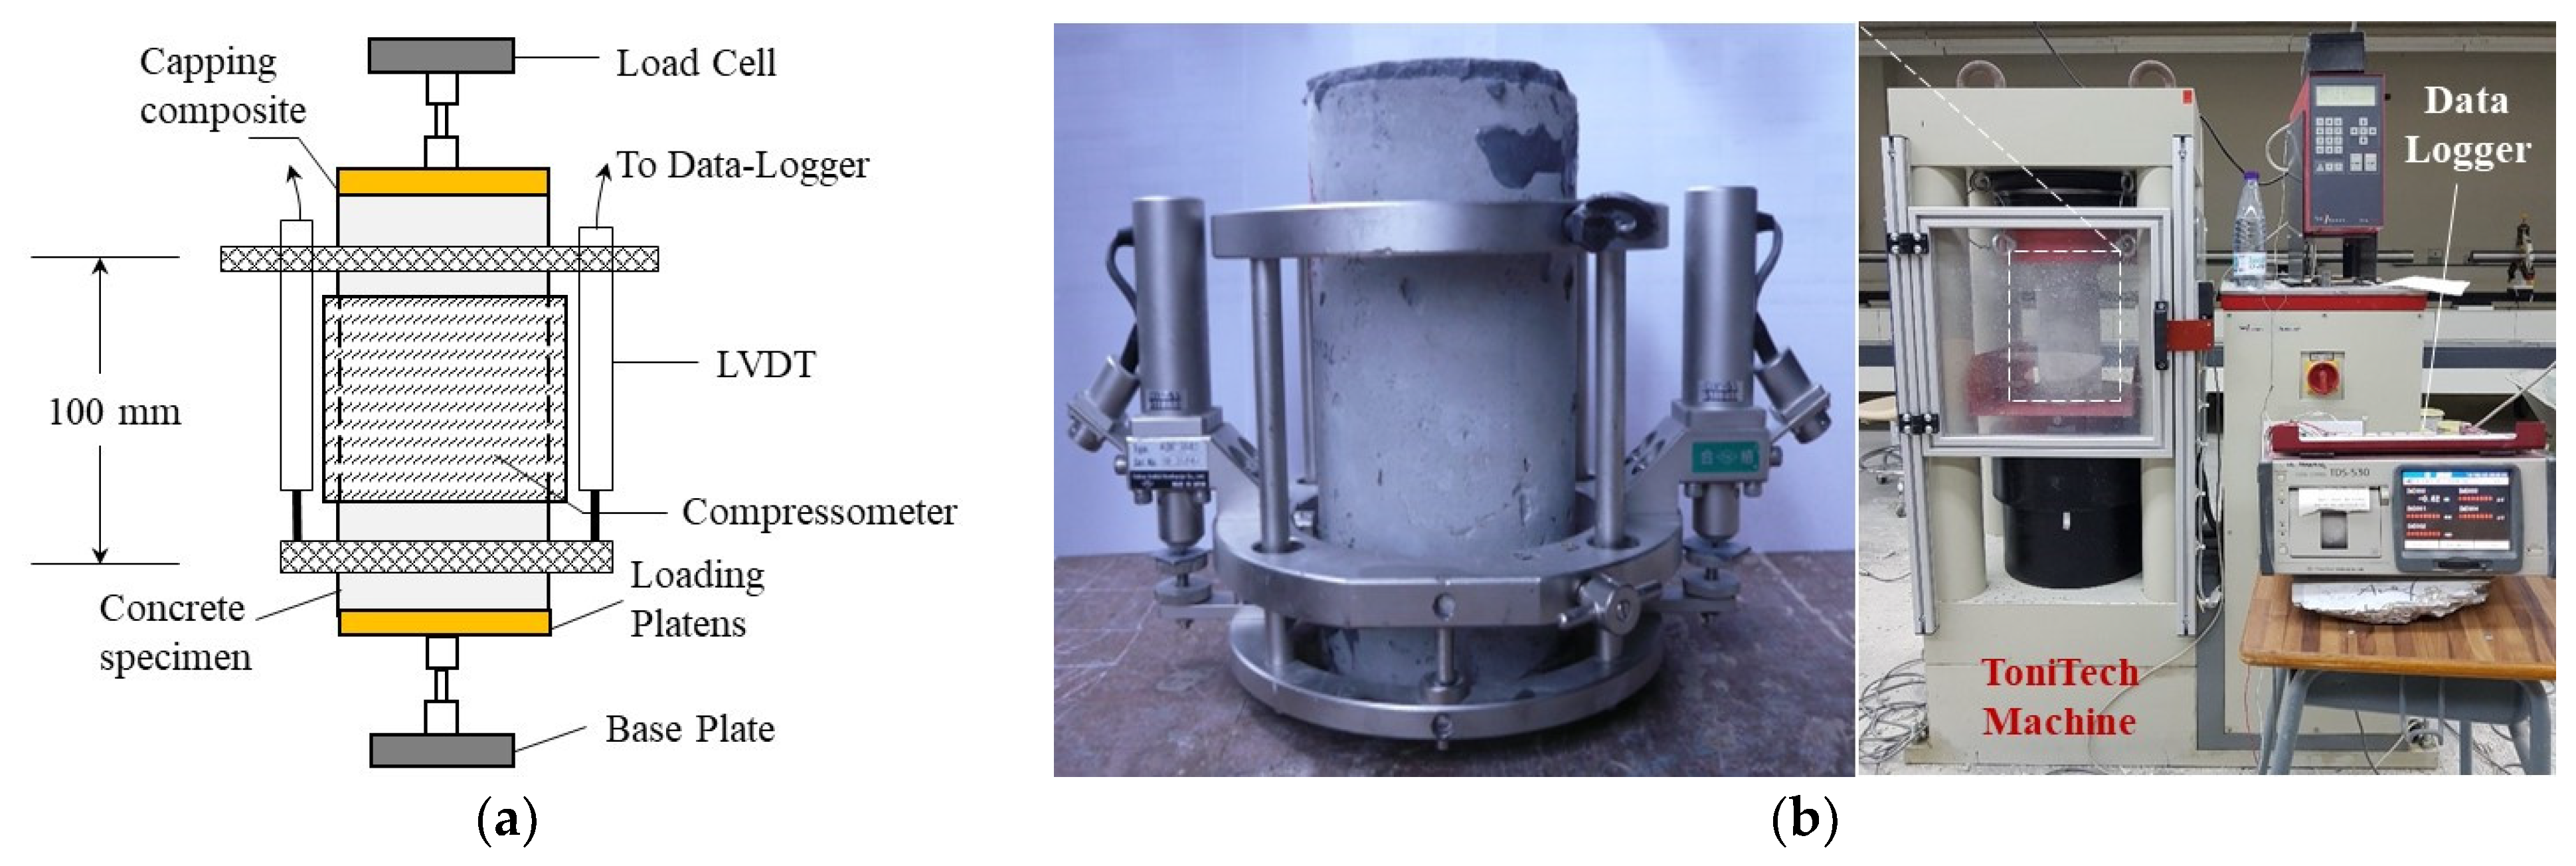
Method of Testing
4.4.3. Test and Model Results
5. Model Implementation
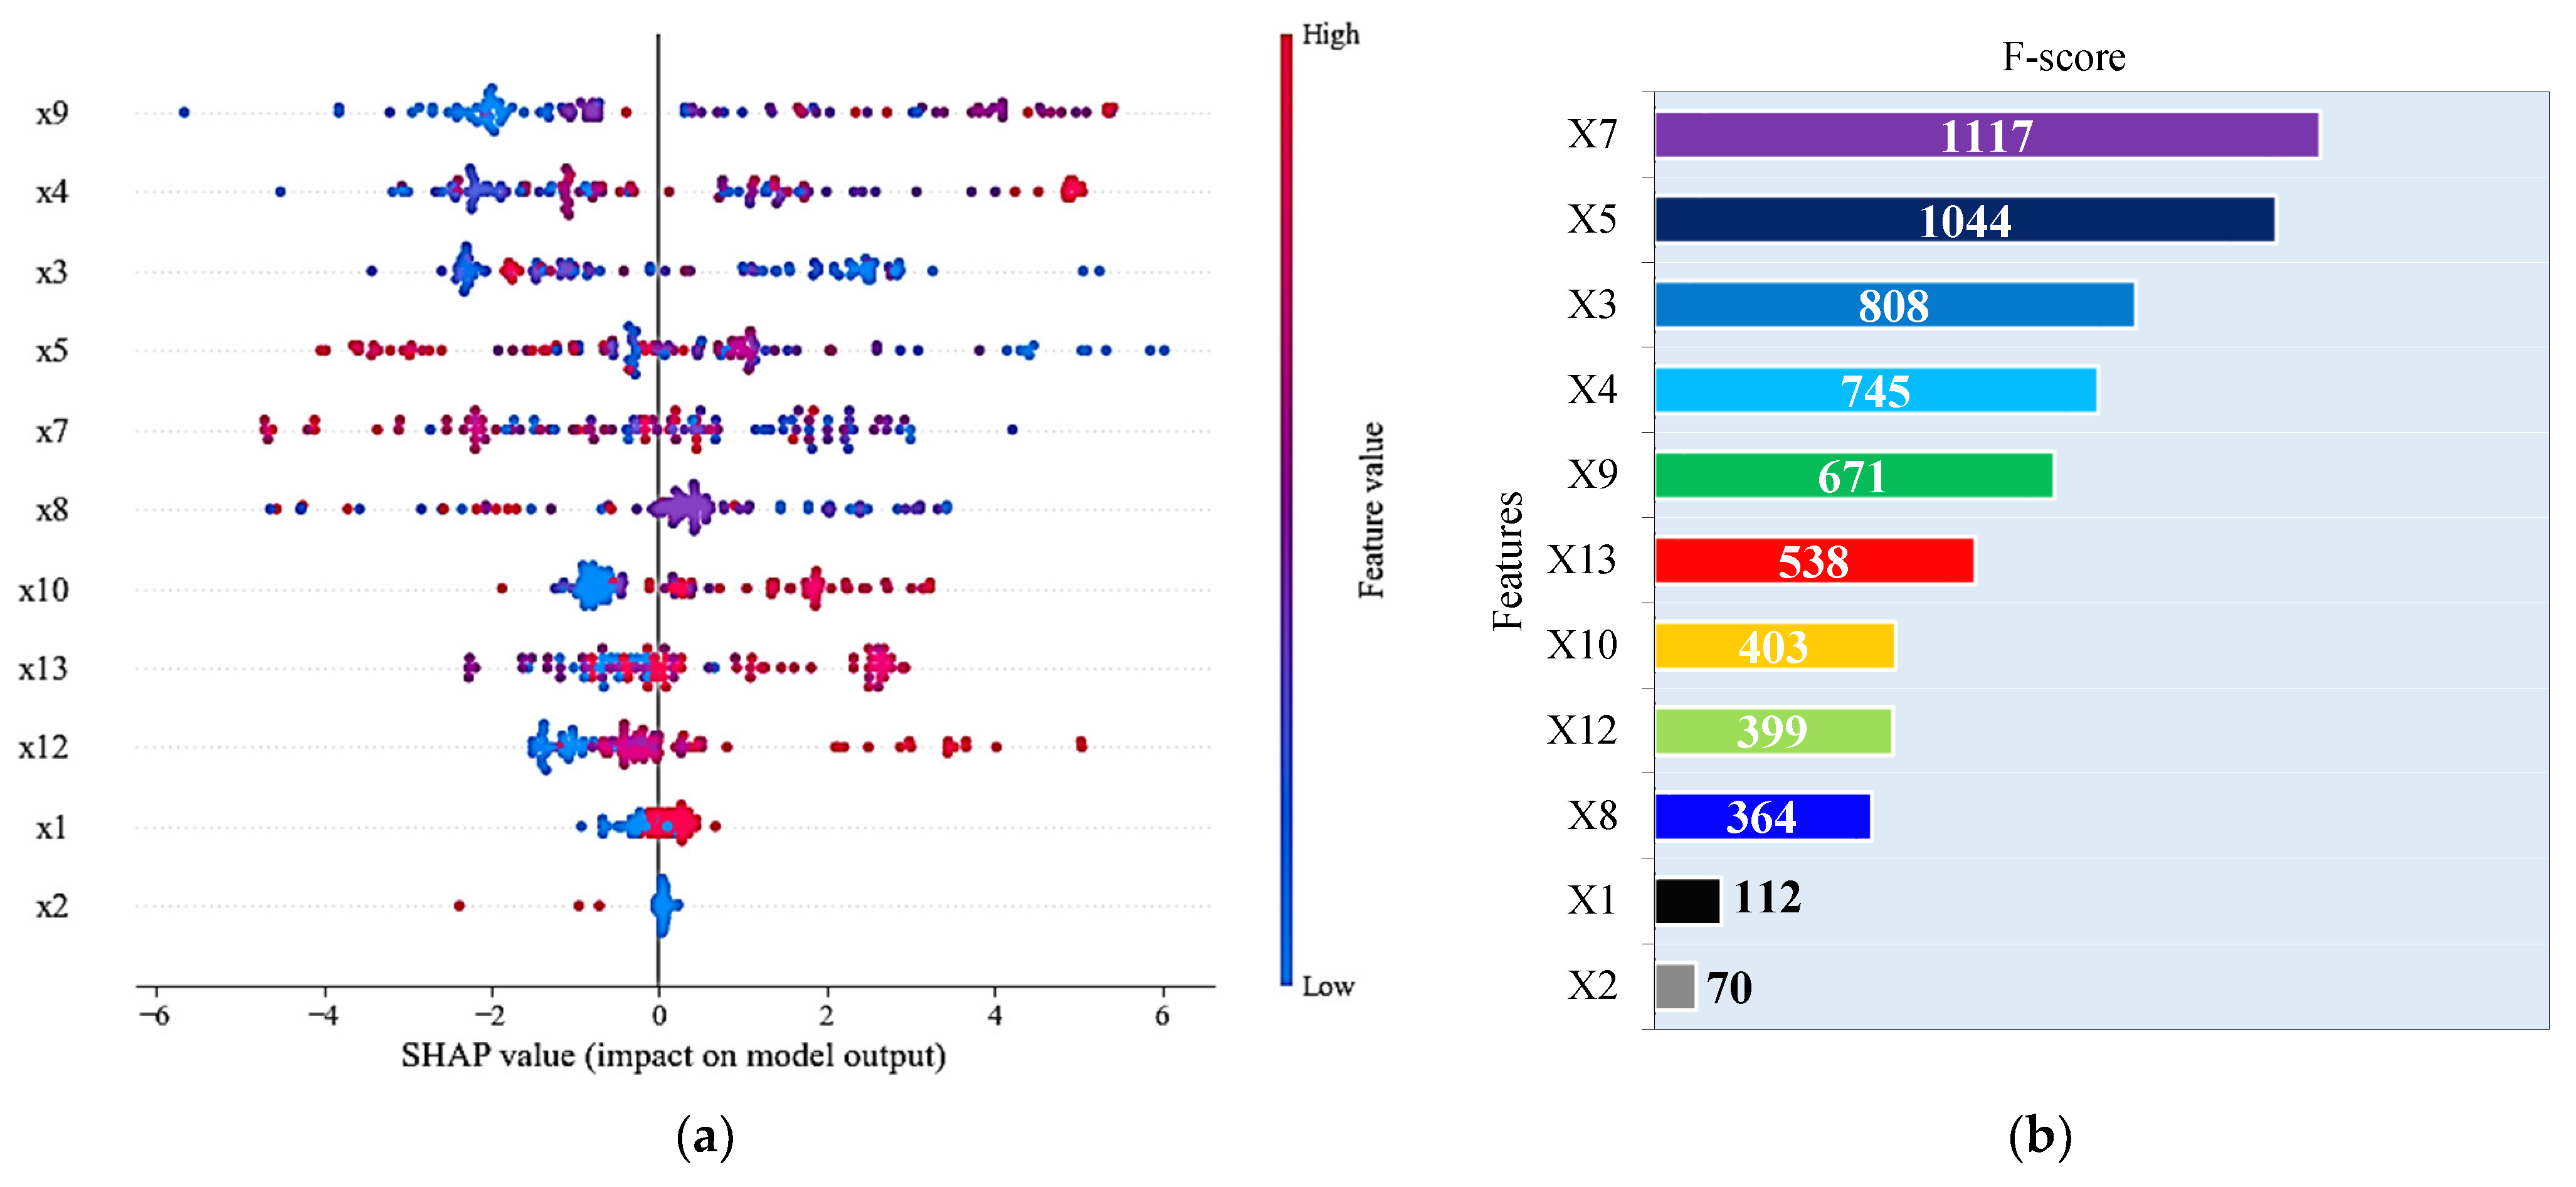
5.1. Feature Ranking
5.2. Partial Dependence Plots
5.3. Graphical User Interface Development
6. Conclusions, Implications, and Future Research
- The analysis, including Pearson correlations, Gini indices, and SHAP analyses, highlighted that the most significant factors influencing the CS of SFRC were the cement and HRWR contents, as well as the fiber tensile strength and water–binder ratio. Notably, increasing the proportion of water and coarse aggregates is likely to reduce the compressive strength of the concrete.
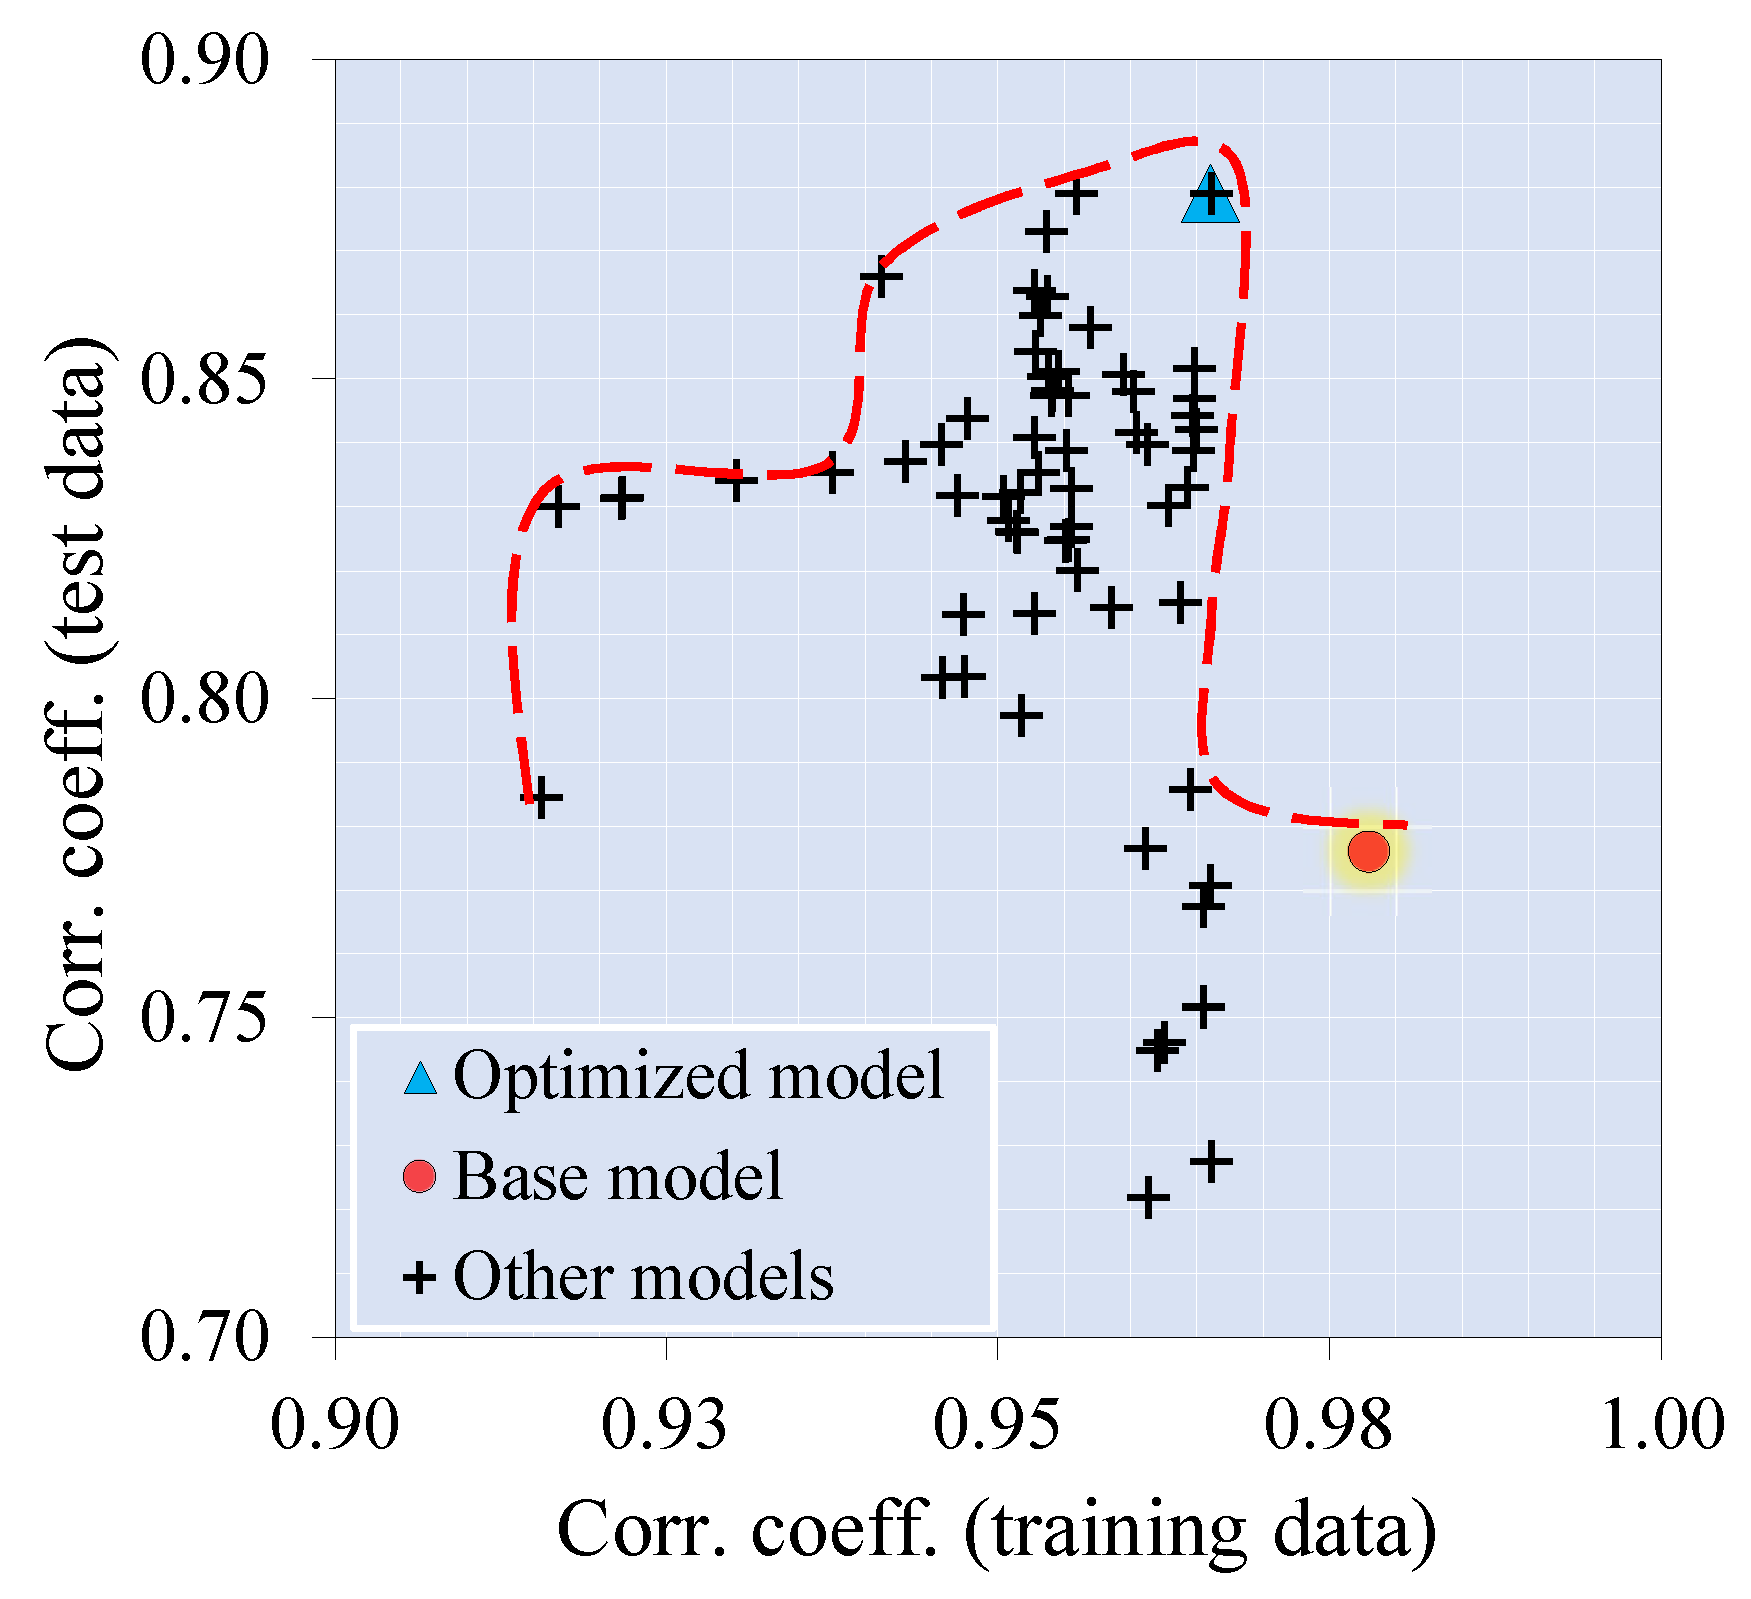
- We utilized the Pareto frontier multi-criterion method to develop an optimized version of the standard XG Boost model. Based on training and testing datasets, the optimized model demonstrated satisfactory predictive performance, achieving scores of 0.97 and 0.88, respectively.
- The developed ML model consistently exhibited superior predictive capability when tested against independent experimental data conducted by the authors, with average and COV values of the tested-predicted results at 0.99 and 6%, respectively.
- Through the application of PDPs, we determined that the optimal water and HRWR contents for achieving maximum CS are in the range of 100–150 kg/m3 and 10–20 kg/m3, respectively. Similarly, for coarse aggregates, ideal contents fall in the ranges of 900–1100 kg/m3. Additionally, the most effective fibrous combination exhibited a tensile strength of 1000 MPa, a diameter length of 40–50 mm, and a dosage of about 1.0%.
Author Contributions
Funding
Institutional Review Board Statement
Informed Consent Statement
Data Availability Statement
Acknowledgments
Conflicts of Interest
References
- Bennett, B.; Visintin, P.; Xie, T. Global Warming Potential of Recycled Aggregate Concrete with Supplementary Cementitious Materials. J. Build. Eng. 2022, 52, 104394. [Google Scholar] [CrossRef]
- Sepulveda, B.D.G.; Visintin, P.; Oehlers, D.J. Fatigue Bond-Slip Properties of Steel Reinforcing Bars Embedded in UHPFRC: Extraction and Development of an Accumulated Damage Law. Case Stud. Constr. Mater. 2022, 17, e01370. [Google Scholar] [CrossRef]
- Abbas, Y.M.; Fares, G.; Iqbal Khan, M. Depth-Dependent Flexural Behavior of Plain and Bar-Reinforced Ultra-High-Performance Hybrid Fiber-Reinforced Concrete—Analytical, Numerical, and Uncertainty Modeling. Structures 2023, 52, 723–741. [Google Scholar] [CrossRef]
- Abellan-Garcia, J.; Fernández, J.; Khan, M.I.; Abbas, Y.M.; Carrillo, J. Uniaxial Tensile Ductility Behavior of Ultrahigh-Performance Concrete Based on the Mixture Design—Partial Dependence Approach. Cem. Concr. Compos. 2023, 140, 105060. [Google Scholar] [CrossRef]
- Abbas, Y.M.; Iqbal Khan, M. Fiber–Matrix Interactions in Fiber-Reinforced Concrete: A Review. Arab. J. Sci. Eng. 2016, 41, 1183–1198. [Google Scholar] [CrossRef]
- Qin, Y.; Su, J.; Cao, J.; Liu, R. Investigation of Orientation Coefficient on Meso-Damage Evolution of Steel Fiber-Reinforced Cement Composites. Eng. Fract. Mech. 2023, 284, 109210. [Google Scholar] [CrossRef]
- Pakzad, S.S.; Roshan, N.; Ghalehnovi, M. Comparison of Various Machine Learning Algorithms Used for Compressive Strength Prediction of Steel Fiber-Reinforced Concrete. Sci. Rep. 2023, 13, 3646. [Google Scholar] [CrossRef]
- Wang, Y.; Jin, H.; Demartino, C.; Chen, W.; Yu, Y. Mechanical Properties of SFRC: Database Construction and Model Prediction. Case Stud. Constr. Mater. 2022, 17, e01484. [Google Scholar] [CrossRef]
- Khan, M.I.; Abbas, Y.M. Intelligent Data-Driven Compressive Strength Prediction and Optimization of Reactive Powder Concrete Using Multiple Ensemble-Based Machine Learning Approach. Constr. Build. Mater. 2023, 404, 133148. [Google Scholar] [CrossRef]
- Abbas, Y.M.; Fares, G.; Khan, M.I. Impact of Hot Weather Conditions on the Performance of Supplementary Cementitious Materials Concrete. Sustainability 2023, 15, 8393. [Google Scholar] [CrossRef]
- Abbas, Y.M.; Hussain, L.A.; Khan, M.I. Constitutive Compressive Stress–Strain Behavior of Hybrid Steel-PVA High-Performance Fiber-Reinforced Concrete. J. Mater. Civ. Eng. 2022, 34, 04021401. [Google Scholar] [CrossRef]
- Guerini, V.; Conforti, A.; Plizzari, G.; Kawashima, S. Influence of Steel and Macro-Synthetic Fibers on Concrete Properties. Fibers 2018, 6, 47. [Google Scholar] [CrossRef]
- Ortiz Navas, F.; Navarro-Gregori, J.; Leiva Herdocia, G.; Serna, P.; Cuenca, E. An Experimental Study on the Shear Behaviour of Reinforced Concrete Beams with Macro-Synthetic Fibres. Constr. Build. Mater. 2018, 169, 888–899. [Google Scholar] [CrossRef]
- Bajpai, A.; Wetzel, B.; Klingler, A.; Friedrich, K. Mechanical Properties and Fracture Behavior of High-performance Epoxy Nanocomposites Modified with Block Polymer and Core–Shell Rubber Particles. J. Appl. Polym. Sci. 2020, 137. [Google Scholar] [CrossRef]
- Mujalli, M.A.; Dirar, S.; Mushtaha, E.; Hussien, A.; Maksoud, A. Evaluation of the Tensile Characteristics and Bond Behaviour of Steel Fibre-Reinforced Concrete: An Overview. Fibers 2022, 10, 104. [Google Scholar] [CrossRef]
- Mpalaskas, A.C.; Matikas, T.E.; Aggelis, D.G.; Alver, N. Acoustic Emission for Evaluating the Reinforcement Effectiveness in Steel Fiber Reinforced Concrete. Appl. Sci. 2021, 11, 3850. [Google Scholar] [CrossRef]
- Hollý, I.; Bilčík, J. Effect of Chloride-Induced Steel Corrosion on Working Life of Concrete Structures. Solid State Phenom. 2018, 272, 226–231. [Google Scholar] [CrossRef]
- Abbas, Y.M.; Tuken, A.; Siddiqui, N.A. Improving the Structural Behavior of Shear-Deficient RC Deep Beams Using Steel Fibers: Experimental, Numerical and Probabilistic Approach. J. Build. Eng. 2022, 46, 103711. [Google Scholar] [CrossRef]
- Cucchiara, C.; La Mendola, L.; Papia, M. Effectiveness of Stirrups and Steel Fibres as Shear Reinforcement. Cem. Concr. Compos. 2004, 26, 777–786. [Google Scholar] [CrossRef]
- Tarawneh, A.; Almasabha, G.; Alawadi, R.; Tarawneh, M. Innovative and Reliable Model for Shear Strength of Steel Fibers Reinforced Concrete Beams. Structures 2021, 32, 1015–1025. [Google Scholar] [CrossRef]
- Lantsoght, E.O.L. How Do Steel Fibers Improve the Shear Capacity of Reinforced Concrete Beams without Stirrups? Compos. B Eng. 2019, 175, 107079. [Google Scholar] [CrossRef]
- Wang, X.H.; Jacobsen, S.; He, J.Y.; Zhang, Z.L.; Lee, S.F.; Lein, H.L. Application of Nanoindentation Testing to Study of the Interfacial Transition Zone in Steel Fiber Reinforced Mortar. Cem. Concr. Res. 2009, 39, 701–715. [Google Scholar] [CrossRef]
- Lu, J.; Liu, J.; Fan, X.; Wan, X.; Gao, J.; Zhang, J.; Li, P. Study on the Mechanical Properties and Microstructure of Fiber-Reinforced Concrete Subjected to Sulfate Erosion. Arab. J. Sci. Eng. 2022, 47, 13639–13653. [Google Scholar] [CrossRef]
- Guojie, X.; Chuanlin, W.; Zhang, J.; Zeping, L.; Zhang, T.; Zhang, Y. Influence of Steel Fiber Shape on the Performance of High-Performance Concrete. Acta Mater. Compos. Sin. 2021, 38, 4313–4324. [Google Scholar]
- Wu, X.; Ding, F.; Xiang, P.; Wang, Y.; Yu, Z.; Liu, C. Multiaxial Damage Ratio Strength Criteria for Fiber-Reinforced Concrete. J. Eng. Mech. 2022, 148, 04022029. [Google Scholar] [CrossRef]
- Frazão, C.; Camões, A.; Barros, J.; Gonçalves, D. Durability of Steel Fiber Reinforced Self-Compacting Concrete. Constr. Build. Mater. 2015, 80, 155–166. [Google Scholar] [CrossRef]
- Liu, C.; Hunag, X.; Wu, Y.-Y.; Deng, X.; Zheng, Z.; Yang, B. Studies on Mechanical Properties and Durability of Steel Fiber Reinforced Concrete Incorporating Graphene Oxide. Cem. Concr. Compos. 2022, 130, 104508. [Google Scholar] [CrossRef]
- Parvez, A.; Foster, S.J. Fatigue of Steel-Fibre-Reinforced Concrete Prestressed Railway Sleepers. Eng. Struct. 2017, 141, 241–250. [Google Scholar] [CrossRef]
- Jin, L.; Zhang, R.; Dou, G.; Du, X. Fire Resistance of Steel Fiber Reinforced Concrete Beams after Low-Velocity Impact Loading. Fire Saf. J. 2018, 98, 24–37. [Google Scholar] [CrossRef]
- Liang, X.; Wu, C. Investigation on Thermal Conductivity of Steel Fiber Reinforced Concrete Using Mesoscale Modeling. Int. J. Thermophys. 2018, 39, 142. [Google Scholar] [CrossRef]
- Qing, L.; Zhang, H.; Niu, C.; Mu, R.; Li, M. Preparation and Fracture Behavior of Annularly Aligned Steel Fiber Reinforced Cementitious Composite: Experiment and Simulation. J. Build. Eng. 2023, 67, 106019. [Google Scholar] [CrossRef]
- Zhang, J.; Liu, X.; Wu, Z.; Yu, H.; Fang, Q. Fracture Properties of Steel Fiber Reinforced Concrete: Size Effect Study via Mesoscale Modelling Approach. Eng. Fract. Mech. 2022, 260, 108193. [Google Scholar] [CrossRef]
- Yu, Y.; Zhao, X.-Y.; Xu, J.-J.; Wang, S.-C.; Xie, T.-Y. Evaluation of Shear Capacity of Steel Fiber Reinforced Concrete Beams without Stirrups Using Artificial Intelligence Models. Materials 2022, 15, 2407. [Google Scholar] [CrossRef] [PubMed]
- Voutetaki, M.E.; Naoum, M.C.; Papadopoulos, N.A.; Chalioris, C.E. Cracking Diagnosis in Fiber-Reinforced Concrete with Synthetic Fibers Using Piezoelectric Transducers. Fibers 2022, 10, 5. [Google Scholar] [CrossRef]
- Mei, H.; Haider, M.; Joseph, R.; Migot, A.; Giurgiutiu, V. Recent Advances in Piezoelectric Wafer Active Sensors for Structural Health Monitoring Applications. Sensors 2019, 19, 383. [Google Scholar] [CrossRef] [PubMed]
- Talakokula, V.; Bhalla, S.; Gupta, A. Monitoring Early Hydration of Reinforced Concrete Structures Using Structural Parameters Identified by Piezo Sensors via Electromechanical Impedance Technique. Mech. Syst. Signal Process. 2018, 99, 129–141. [Google Scholar] [CrossRef]
- Huo, L.; Cheng, H.; Kong, Q.; Chen, X. Bond-Slip Monitoring of Concrete Structures Using Smart Sensors—A Review. Sensors 2019, 19, 1231. [Google Scholar] [CrossRef]
- Perera, R.; Torres, L.; Ruiz, A.; Barris, C.; Baena, M. An EMI-Based Clustering for Structural Health Monitoring of NSM FRP Strengthening Systems. Sensors 2019, 19, 3775. [Google Scholar] [CrossRef]
- Abbass, W.; Khan, M.I.; Mourad, S. Evaluation of Mechanical Properties of Steel Fiber Reinforced Concrete with Different Strengths of Concrete. Constr. Build. Mater. 2018, 168, 556–569. [Google Scholar] [CrossRef]
- Bai, M.; Niu, D.T.; Jiang, L.; Miao, Y. Research on Improving the Mechanical Properties and Microstructure of Concrete with Steel Fiber. Chin. Bull. Chin. Ceram. Soc. 2013, 32, 2084–2089. [Google Scholar]
- Chang, H.; Shen, P.; Gu, F. Analysis of the Influence Law of Steel Fiber on Concrete Thermal Conductivity and Pressure Strength. Concrete 2021, 4, 67–69. [Google Scholar]
- Wang, Y. Steel Fiber Reinforced Concrete Durability in the Atmospheric Environmental Based on Multi-Factor Effects. Ph.D. Thesis, Xi’an University of Architecture and Technology, Xi’an, China, 2011. [Google Scholar]
- Açikgenç, M.; Ulaş, M.; Alyamaç, K.E. Using an Artificial Neural Network to Predict Mix Compositions of Steel Fiber-Reinforced Concrete. Arab. J. Sci. Eng. 2015, 40, 407–419. [Google Scholar] [CrossRef]
- Thai, H.-T. Machine Learning for Structural Engineering: A State-of-the-Art Review. Structures 2022, 38, 448–491. [Google Scholar] [CrossRef]
- Zheng, Y.; Liu, Y.; Wei, T.; Jiang, D.; Wang, M. Wind Turbine Blades Surface Crack-Detection Algorithm Based on Improved YOLO-v5 Model. J. Electron. Imaging 2023, 32, 033012. [Google Scholar] [CrossRef]
- Cardellicchio, A.; Ruggieri, S.; Nettis, A.; Renò, V.; Uva, G. Physical Interpretation of Machine Learning-Based Recognition of Defects for the Risk Management of Existing Bridge Heritage. Eng. Fail. Anal. 2023, 149, 107237. [Google Scholar] [CrossRef]
- Awolusi, T.F.; Oke, O.L.; Akinkurolere, O.O.; Sojobi, A.O.; Aluko, O.G. Performance Comparison of Neural Network Training Algorithms in the Modeling Properties of Steel Fiber Reinforced Concrete. Heliyon 2019, 5, e01115. [Google Scholar] [CrossRef]
- Karahan, O.; Tanyildizi, H.; Atis, C.D. An Artificial Neural Network Approach for Prediction of Long-Term Strength Properties of Steel Fiber Reinforced Concrete Containing Fly Ash. J. Zhejiang Univ. Sci. A 2008, 9, 1514–1523. [Google Scholar] [CrossRef]
- Rathakrishnan, V.; Bt. Beddu, S.; Ahmed, A.N. Predicting Compressive Strength of High-Performance Concrete with High Volume Ground Granulated Blast-Furnace Slag Replacement Using Boosting Machine Learning Algorithms. Sci. Rep. 2022, 12, 9539. [Google Scholar] [CrossRef]
- Friedman, J.; Hastie, T.; Tibshirani, R. Additive Logistic Regression: A Statistical View of Boosting (With Discussion and a Rejoinder by the Authors). Ann. Stat. 2000, 28, 337–407. [Google Scholar] [CrossRef]
- Chen, T.; Guestrin, C. Xgboost: A Scalable Tree Boosting System. In Proceedings of the 22nd Acm Sigkdd International Conference on Knowledge Discovery and Data Mining, San Francisco, CA, USA, 13–17 August 2016; pp. 785–794. [Google Scholar]
- Wikipedia Contributors XGBoost. Available online: https://en.wikipedia.org/wiki/XGBoost (accessed on 29 August 2022).
- Wikiedia Contributors Outlier. Available online: https://en.wikipedia.org/wiki/Outlier (accessed on 20 October 2023).
- Kivrak, M.; Guldogan, E.; Colak, C. Prediction of Death Status on the Course of Treatment in SARS-CoV-2 Patients with Deep Learning and Machine Learning Methods. Comput. Methods Programs Biomed. 2021, 201, 105951. [Google Scholar] [CrossRef]
- Xu, H.; Wang, H.; Yuan, C.; Zhai, Q.; Tian, X.; Wu, L.; Mi, Y. Identifying Diseases That Cause Psychological Trauma and Social Avoidance by GCN-Xgboost. BMC Bioinform. 2020, 21, 504. [Google Scholar] [CrossRef] [PubMed]
- Carmona, P.; Dwekat, A.; Mardawi, Z. No More Black Boxes! Explaining the Predictions of a Machine Learning XGBoost Classifier Algorithm in Business Failure. Res. Int. Bus. Financ. 2022, 61, 101649. [Google Scholar] [CrossRef]
- Rossum, G.V.; Drake, J.F. Python Reference Manual; Centrum voor Wiskunde en Informatica: Amsterdam, The Netherlands, 1995. [Google Scholar]
- Yalcin, M. Optimization and Performance Based Design of Steel Fiber Reinforced Concretes; Istanbul Technical University: Istanbul, Turkey, 1994. [Google Scholar]
- Nili, M.; Afroughsabet, V. Combined Effect of Silica Fume and Steel Fibers on the Impact Resistance and Mechanical Properties of Concrete. Int. J. Impact Eng. 2010, 37, 879–886. [Google Scholar] [CrossRef]
- Nguyen-Minh, L.; Rovňák, M.; Tran-Quoc, T.; Nguyenkim, K. Punching Shear Resistance of Steel Fiber Reinforced Concrete Flat Slabs. Procedia Eng. 2011, 14, 1830–1837. [Google Scholar] [CrossRef]
- Ibrahim, I.S.; Che Bakar, M.B. Effects on Mechanical Properties of Industrialised Steel Fibres Addition to Normal Weight Concrete. Procedia Eng. 2011, 14, 2616–2626. [Google Scholar] [CrossRef]
- Eren, Ö.; Marar, K. Effects of Limestone Crusher Dust and Steel Fibers on Concrete. Constr. Build. Mater. 2009, 23, 981–988. [Google Scholar] [CrossRef]
- Şahin, Y.; Köksal, F. The Influences of Matrix and Steel Fibre Tensile Strengths on the Fracture Energy of High-Strength Concrete. Constr. Build. Mater. 2011, 25, 1801–1806. [Google Scholar] [CrossRef]
- Buratti, N.; Mazzotti, C.; Savoia, M. Post-Cracking Behaviour of Steel and Macro-Synthetic Fibre-Reinforced Concretes. Constr. Build. Mater. 2011, 25, 2713–2722. [Google Scholar] [CrossRef]
- Lau, A.; Anson, M. Effect of High Temperatures on High Performance Steel Fibre Reinforced Concrete. Cem. Concr. Res. 2006, 36, 1698–1707. [Google Scholar] [CrossRef]
- Shakya, K.; Watanabe, K.; Matsumoto, K.; Niwa, J. Application of Steel Fibers in Beam–Column Joints of Rigid-Framed Railway Bridges to Reduce Longitudinal and Shear Rebars. Constr. Build. Mater. 2012, 27, 482–489. [Google Scholar] [CrossRef]
- Soulioti, D.V.; Barkoula, N.M.; Paipetis, A.; Matikas, T.E. Effects of Fibre Geometry and Volume Fraction on the Flexural Behaviour of Steel-Fibre Reinforced Concrete. Strain 2011, 47, e535–e541. [Google Scholar] [CrossRef]
- Ünal, O.; Demir, F.; Uygunoğlu, T. Fuzzy Logic Approach to Predict Stress–Strain Curves of Steel Fiber-Reinforced Concretes in Compression. Build. Environ. 2007, 42, 3589–3595. [Google Scholar] [CrossRef]
- Carmona, S.; Aguado, A.; Molins, C. Characterization of the Properties of Steel Fiber Reinforced Concrete by Means of the Generalized Barcelona Test. Constr. Build. Mater. 2013, 48, 592–600. [Google Scholar] [CrossRef]
- Cantin, R.; Pigeon, M. Deicer Salt Scaling Resistance of Steel-Fiber-Reinforced Concrete. Cem. Concr. Res. 1996, 26, 1639–1648. [Google Scholar] [CrossRef]
- Pigeon, M.; Cantin, R. Flexural Properties of Steel Fiber-Reinforced Concretes at Low Temperatures. Cem. Concr. Compos. 1998, 20, 365–375. [Google Scholar] [CrossRef]
- Zhang, Z.C. Experimental Study on Constitutive Relation of Steel Fiber Reinforced Concrete under Uniaxial Compresion. Master’s Thesis, Zhengzhou University, Zhengzhou, China, 2017. [Google Scholar]
- Chen, J.Y. The Study of the Effect of Aggregate Size and the Steel Fiber’s Length on the Fracture Property of SFRC. Master’s Thesis, Zhengzhou University, Zhengzhou, China, 2016. [Google Scholar]
- Li, C.C. Study on Mechanical Properties and Relationship of Steel Fiber Reinforced Concrete Cubic and Cylindrical Specimen. Master’s Thesis, Zhengzhou University, Zhengzhou, China, 2016. [Google Scholar]
- Yue, J.; Xia, Y.; Fang, H. Experimental Study on Fracture Mechanism and Tension Damage Constitutive Relationship of Steel Fiber Reinforced Concrete. China Civ. Eng. J. 2021, 54, 93–106. [Google Scholar]
- Yang, Y. Effect of Fiber Dosage and Bond Length on Pullout Mechanical Property Study. Master’s Thesis, Guangzhou University, Guangzhou, China, 2015. [Google Scholar]
- Zhang, L.J. Mixture Design and Performance Calculation Method of Steel Fiber Recycled Concrete. Ph.D. Thesis, Zhengzhou University, Zhengzhou, China, 2016. [Google Scholar]
- Liao, L. Study on the Optimisation of Steel Fiber Reinforced Concrete; Taiyuan Technology University: Taiyuan, China, 2011. [Google Scholar]
- Fan, C.Y. Study on Mechanical Properties of Hybrid Steel Fiber Reinforced Concrete; Zhengzhou University: Zhengzhou, China, 2017. [Google Scholar]
- Yang, W.W. Experimental Study on Mechanical Properties and Durability of Fiber Reinforced Concrete; Shandong University: Jinan, China, 2012. [Google Scholar]
- Raja Rajeshwari, B.; Sivakumar, M.V.N. Influence of Coarse Aggregate Properties on Specific Fracture Energy of Steel Fiber Reinforced Self Compacting Concrete. Adv. Concr. Constr. 2020, 9, 173–181. [Google Scholar]
- Gao, C. Experimental Research on Mechanical Properties of Concrete and Reinfroced Oncrete after High Temperature; Yangzhou University: Yangzhou, China, 2013. [Google Scholar]
- Cheng, H.Q. Experimental Research on Adherence Property of Fresh Fiber Reinforced Concrete to Old Concrete. Ph.D. Thesis, Zhengzhou University, Zhengzhou, China, 2007. [Google Scholar]
- Liu, J. Study on the Relationship between Pressure and Tensile Properties of Steel Fiber Reinforced Recycled Concrete. Master’s Thesis, Zhengzhou University, Zhengzhou, China, 2016. [Google Scholar]
- Ma, Z.Y. An Experimental Study on the Properties of Steel Fiber Reinforced Concrete at Early Ages. Master’s Thesis, Beijing Technology University, Beijing, China, 2003. [Google Scholar]
- Li, Q.; Fang, Y.; Chen, Y.; Wu, Q.; Lin, G.; Pang, Z. Experimental Study on Mechanical Properties of Concrete with Adding Steel Fiber at Early Age. Concrete 2020, 6, 102–105. [Google Scholar]
- Zhu, T.Y. The Mechanical Properties of Steel Fiber-Reinforced Concrete at Low Fiber Content. Master’s Thesis, Zhengzhou University, Zhengzhou, China, 2011. [Google Scholar]
- Niu, L.L.; Zhang, S.P.; Wei, Y.X. Effect of Fiber Dosage on the Mechanical Property of SFRC. China Concr. Cem. Prod. 2019, 3. [Google Scholar]
- Peng, H.X. Experimental Research of Steel Fiber Reinforced Concrete on Speed-Repairing the Airport Pavement. Master’s Thesis, Beijing Technology University, Beijing, China, 2002. [Google Scholar]
- Gul, M.; Bashir, A.; Naqash, J.A. Study of Modulus of Elasticity of Steel Fiber Reinforced Concrete. Int. J. Eng. Adv. Technol. 2014, 3, 304–309. [Google Scholar]
- Minelli, F.; Conforti, A.; Cuenca, E.; Plizzari, G. Are Steel Fibres Able to Mitigate or Eliminate Size Effect in Shear? Mater. Struct. 2014, 47, 459–473. [Google Scholar] [CrossRef]
- Conforti, A.; Minelli, F.; Plizzari, G.A. Wide-Shallow Beams with and without Steel Fibres: A Peculiar Behaviour in Shear and Flexure. Compos. B Eng. 2013, 51, 282–290. [Google Scholar] [CrossRef]
- Cuenca, E. On Shear Behavior of Structural Elements Made of Steel Fiber Reinforced Concrete; Springer International Publishing: Cham, Switzerland, 2015; ISBN 978-3-319-13685-1. [Google Scholar]
- Characterization and Modelling of SFRC Elements; Universitat Politècnica de Catalunya: Barcelona, Spain, 2013.
- Facconi, L.; Minelli, F. Behavior of Lightly Reinforced Fiber Reinforced Concrete Panels under Pure Shear Loading. Eng. Struct. 2020, 202, 109879. [Google Scholar] [CrossRef]
- Conforti, A.; Zerbino, R.; Plizzari, G.A. Influence of Steel, Glass and Polymer Fibers on the Cracking Behavior of Reinforced Concrete Beams under Flexure. Struct. Concr. 2019, 20, 133–143. [Google Scholar] [CrossRef]
- Tiberti, G.; Minelli, F.; Plizzari, G. Cracking Behavior in Reinforced Concrete Members with Steel Fibers: A Comprehensive Experimental Study. Cem. Concr. Res. 2015, 68, 24–34. [Google Scholar] [CrossRef]
- Committee, A. 318 Building Code Requirements for Structural Concrete (ACI 318-19) and Commentary; American Concrete Institute: Farmington Hills, MI, USA, 2022. [Google Scholar]
- Wu, B.; Yu, Y.; Chen, Z.; Zhao, X. Shape Effect on Compressive Mechanical Properties of Compound Concrete Containing Demolished Concrete Lumps. Constr. Build. Mater. 2018, 187, 50–64. [Google Scholar] [CrossRef]
- Aggarwal, C.C. An Introduction to Outlier Analysis. In Outlier Analysis; Springer International Publishing: Cham, Switzerland, 2017; pp. 1–34. [Google Scholar]
- Atkinson, A.; Riani, M. Robust Diagnostic Regression Analysis; Springer: New York, NY, USA, 2000; ISBN 978-1-4612-7027-0. [Google Scholar]
- Pimentel, M.A.F.; Clifton, D.A.; Clifton, L.; Tarassenko, L. A Review of Novelty Detection. Signal Process. 2014, 99, 215–249. [Google Scholar] [CrossRef]
- Zimek, A.; Schubert, E.; Kriegel, H. A Survey on Unsupervised Outlier Detection in High-dimensional Numerical Data. Stat. Anal. Data Min. ASA Data Sci. J. 2012, 5, 363–387. [Google Scholar] [CrossRef]
- Khan, M.I.; Abbas, Y.M. Robust Extreme Gradient Boosting Regression Model for Compressive Strength Prediction of Blast Furnace Slag and Fly Ash Concrete. Mater. Today Commun. 2023, 35, 105793. [Google Scholar] [CrossRef]
- Wikipedia Contributors Pearson Correlation Coefficient. Available online: https://en.wikipedia.org/wiki/Pearson_correlation_coefficient (accessed on 20 October 2023).
- Ayan, E.; Saatçioğlu, Ö.; Turanli, L. Parameter Optimization on Compressive Strength of Steel Fiber Reinforced High Strength Concrete. Constr. Build. Mater. 2011, 25, 2837–2844. [Google Scholar] [CrossRef]
- Yu, J.; Zhang, B.; Chen, W.; He, J. Experimental and Multi-Scale Numerical Investigation of Ultra-High Performance Fiber Reinforced Concrete (UHPFRC) with Different Coarse Aggregate Content and Fiber Volume Fraction. Constr. Build. Mater. 2020, 260, 120444. [Google Scholar] [CrossRef]
- Pareto, V. Cours d’économie Politique; Librairie Droz: Geneva, Switzerland, 1964. [Google Scholar]
- ASTM C150/C150M-12; Standard Specification for Portland Cement. ASTM International: West Conshohocken, PA, USA, 2012; 9p.
- ASTM C143/C143M-12; Standard Test Method for Slump of Hydraulic-Cement Concrete. ASTM International: West Conshohocken, PA, USA, 2012; 4p.
- ASTM C39/C39M-14a; Standard Test Method for Compressive Strength of Cylindrical Concrete Specimens. ASTM International: West Conshohocken, PA, USA, 2014; 7p.
- Hastie, T.; Friedman, J.; Tibshirani, R. The Elements of Statistical Learning: Data Mining, Inference, and Prediction; Springer: New York, NY, USA, 2001; ISBN 978-1-4899-0519-2. [Google Scholar]
- Gong, J.; Chu, S.; Mehta, R.K.; McGaughey, A.J.H. XGBoost Model for Electrocaloric Temperature Change Prediction in Ceramics. NPJ Comput. Mater. 2022, 8, 140. [Google Scholar] [CrossRef]
- Abid, A.; Abdalla, A.; Abid, A.; Khan, D.; Alfozan, A.; Zou, J. Gradio: Hassle-Free Sharing and Testing of Ml Models in the Wild. arXiv 2019, arXiv:1906.02569. [Google Scholar]


| Fiber Type | Hooked | Mil-Cut | Crimped |
|---|---|---|---|
| 1 | 0 | 0 | |
| 0 | 1 | 0 |
| Variable | Unit | Description | Variable | Unit | Description |
|---|---|---|---|---|---|
| kg/m3 | Water content | kg/m3 | HRWR content | ||
| Cement content | MPa | Tensile strength of the fiber | |||
| –– | Water–binder ratio | mm | Diameter of the fiber | ||
| kg/m3 | Fine aggregate content | %, vol. | Dosage of the fiber | ||
| Coarse aggregate content | mm | Length of the fiber | |||
| mm | Maximum aggregate size | MPa | 28d CS of the SFRC |
| Ref. | Data- Sets | ||||||||||||||
|---|---|---|---|---|---|---|---|---|---|---|---|---|---|---|---|
| [58] | 17 | 1 | 0 | 180–192.5 | 280–400 | 0.5|0.6|0.7 | 713.8–762.6 | 1027.2–1097.4 | 31.5 | 3.4–6.6 | –– | 0.19–0.64 | 0.55–0.9 | 30–60 | 29.7–46.7 |
| [59] | 12 | 1 | 0 | 162–177 | 354–450 | 0.4|0.5 | 893–920 | 858–887 | 19 | 2.3–6.5 | 1050 | 0–1 | 0.75 | 60 | 31.5–53.3 |
| [60] | 4 | 1 | 0 | 181.2 | 453 | 0.4 | 624 | 1242 | 22 | 1 | 1100 | 0–0.8 | 0.75 | 60 | 21.7–25.3 |
| [61] | 5 | 1 | 0 | 230.2 | 338 | 0.7 | 1049.2 | 760 | 10 | 0.7 | –– | 0–1.25 | 0.75 | 60 | 25.6–28.1 |
| [62] | 40 | 1 | 0 | 175 | 350 | 0.5 | 952.2 | 1321.2–1398.8 | 20 | 4.5 | 1100–1250 | 0–1.5 | 0–1.5 | 50–60 | 17.9–40.8 |
| [63] | 14 | 1 | 0 | 178–179 | 325–396 | 0.4|0.6 | 842–891 | 913–965 | 19 | 0.9–1.4 | 1050–2000 | 0–1 | 0.71–0.75 | 60 | 47.2–61.1 |
| [64] | 2 | 1 | 0 | 175.6 | 351 | 0.5 | 914.8 | 994.7 | 22 | 2.7 | –– | 0.26–0.45 | 1 | 50 | 33.3–33.4 |
| [65] | 5 | 1 | 0 | 205–398 | 311–458 | 0.6|0.7 | 408–665 | 1156–1407 | 20 | 3.1–7.3 | 1700 | 0–1 | 0.4 | 25 | 31.2–88.0 |
| [66] | 2 | 1 | 0 | 169.8–177.6 | 283–296 | 0.6 | 705–838 | 968–1071 | 10 | 2.8–3.3 | –– | 1–1.5 | 0.62 | 30 | 23.3–30.0 |
| [67] | 7 | 1 | 0 | 220 | 440 | 0.5 | 1193–1225 | 356–366 | 10 | 3–4 | –– | 0–1.5 | 0.75 | 25–31 | 35.1–43.8 |
| [68] | 8 | 1 | 0 | 191.2–191.6 | 324 | 0.6 | 1052.8–1064.2 | 750.0–758.3 | 22 | 3.2 | 1200 | 0.19–0.76 | 0.5–0.75 | 30–60 | 34.0–48.0 |
| [69] | 2 | 1 | 0 | 185 | 410 | 0.5 | 915 | 866 | 20 | 2–4 | 1100 | 0.5–1.0 | 1 | 50 | 50.0–52.0 |
| [70] | 10 | 0|1 | 0 | 150–168 | 341–429 | 0.3|0.4|0.5 | 800 | 975 | 14 | 2.8–11 | –– | 0.51 | 1 | 54–60 | 40.9–67.6 |
| [71] | 18 | 1 | 0 | 123–167 | 325–439 | 0.6 | 741–885 | 846–998 | 14 | 0.5–11.4 | –– | 0.48–0.75 | 1 | 54–60 | 38.2–69.6 |
| [41] | 6 | 1 | 0 | 195 | 342 | 0.3|0.5|0.6 | 701 | 1143 | 20 | 10.3 | –– | 0–1.5 | 0.75 | 30 | 24.6–30.6 |
| [72] | 23 | 1 | 0 | 164–185 | 308.3–529.1 | 0.3|0.6 | 639.3–763.9 | 928.6–1232.7 | 20 | 0–5.8 | 600–1000 | 0-2 | 0.55–0.75 | 35 | 26.7–65.4 |
| [73] | 32 | 1 | 0 | 172–195 | 336–521 | 0.6 | 652–750 | 1080–1145 | 10–40 | 0–5.2 | 1100 | 0-1 | 0.75 | 30–60 | 25.8–67.4 |
| [74] | 21 | 0|1 | 0 | 166 | 286 | 0.4 | 739 | 1170–1259 | 20 | 0–0.6 | 600 | 0–2 | 0.75 | 30–40 | 28.0–33.0 |
| [40] | 5 | 0 | 0 | 165 | 367 | 0.3|0.4|0.5 | 702–765 | 1053–1146 | 16 | 2.2 | 380 | 0–2 | 0.5 | 30 | 26.8–31.0 |
| [75] | 12 | 1 | 0 | 195–200 | 415–651 | 0.4|0.7 | 527–610 | 1022–1182 | 20 | 0 | 1000 | 0–1.5 | 0.75 | 32 | 30.9–58.5 |
| [76] | 6 | 1 | 0 | 185 | 268–524 | 0.4|0.5|0.6 | 488–725 | 1056–1185 | 31.5 | 0 | 1000 | 0–0.63 | 1 | 50 | 16.0–34.4 |
| [77] | 22 | 0|1 | 0|1 | 172–196 | 321–475 | 0.4|0.5 | 622.8–886.0 | 960–1171 | 20 | 0–4.5 | –– | 0–2 | 0.75–0.94 | 32.3–62 | 26.6–43.6 |
| [78] | 6 | 1 | 0 | 156–165 | 312–381 | 0.6 | 817–1200 | 700–1214 | 20 | 2.2–5.3 | 1000 | 0.38–0.77 | 1 | 50 | 63.9–67.5 |
| [79] | 13 | 0|1 | 0 | 264 | 480 | 0.4 | 716.5–769.1 | 895.1–989.5 | 20 | 0 | 380–500 | 0–2 | 0.9–1.2 | 30.2–32.3 | 27.7–34.3 |
| [80] | 4 | 1 | 0 | 175 | 461 | 0.4 | 512 | 1252 | 10 | 0 | 600 | 0–1.5 | 1.0 | 35 | 28.5–31.4 |
| [81] | 2 | 1 | 0 | 160 | 400 | 0.4|0.6 | 750 | 1140 | 20 | 8 | 1700 | 0–0.5 | 0.5 | 30 | 42.7–45.1 |
| [82] | 2 | 1 | 0 | 230 | 535 | 0.5 | 556 | 1079 | 16 | 0 | 1345 | 0–1.0 | 0.6 | 30 | 36.5–41.1 |
| [42] | 2 | 0 | 0 | 165 | 300–471 | 0.4 | 690–760 | 1038–1140 | 20 | 1.8–2.8 | 380 | 1 | 0.5 | 30 | 23.8–39.0 |
| [83] | 18 | 0 | 1 | 195–228 | 361–475 | 0.4 | 630–875 | 715–1180 | 20 | 0 | 380 | 0–2 | 0.94 | 32.2 | 28.1–34.1 |
| [84] | 2 | 1 | 0 | 166 | 415 | 0.4 | 838.6 | 1024.9 | 20 | 0 | 1345 | 0–1 | 0.55 | 35 | 40.8–42.6 |
| [85] | 5 | 0 | 1 | 161 | 460 | 0.4 | 1150 | 1048.8 | 20 | 18.4 | 808.6 | 0–1 | 0.8 | 32 | 30.0–40.6 |
| [86] | 4 | 0 | 1 | 215.5 | 480 | 0.4 | 825 | 880 | 25 | 8 | –– | 0–0.51 | 0.5 | 38 | 40.6–49.3 |
| [87] | 16 | 0|1 | 0|1 | 160–200 | 258–513 | 0.4|0.5|0.6 | 540–868 | 1012–1283 | 20 | 0 | 500–1325 | 0–0.7 | 0.55–1.15 | 32–50 | 27.0–47.0 |
| [88] | 5 | 1 | 0 | 172 | 400 | 0.4 | 730 | 1046–1100 | 15 | 0 | –– | 0 | 0.8 | 32 | 27.7–37.0 |
| [89] | 10 | 0 | 0 | 161.0–167.7 | 453.3–460.0 | 0.4 | 699.2 | 1594.2 | 20 | 18.1–18.4 | 808.6 | 0–1.6 | 0.8 | 32–40 | 43.5–56.0 |
| [90] | 28 | 1 | 0 | 161.7 | 437 | 0.4 | 756 | 1210 | 20 | 1.3–6.1 | –– | 0–1.5 | 0.7 | 35–50 | 31.8–50.3 |
| [91] | 3 | 1 | 0 | 168.1 | 410 | 0.4 | 1073 | 645 | 16 | 4.1–5.7 | 1100 | 0–1 | 0.8 | 50 | 32.1–38.7 |
| [92] | 3 | 1 | 0 | 167.7 | 390 | 0.4 | 1075 | 758 | 16 | 2.3–3.1 | 1100 | 0–1.45 | 0.8 | 50 | 36.9–40.5 |
| [93] | 9 | 1 | 0 | 198–205 | 440–460 | 0.4|0.5 | 924–985 | 721–846 | 12 | 11.1–12.8 | 1225 | 0.76 | 0.62 | 40 | 52.4–70.0 |
| [94] | 5 | 1 | 0 | 165 | 300 | 0.6 | 1128.8 | 806.3 | 16 | 2.5 | 1050–1100 | 0–0.5 | 0.55–0.75 | 35–60 | 17.6–29.2 |
| [95] | 6 | 1 | 0 | 190 | 380 | 0.6 | 1082.0 | 742.0 | 12 | 0.0–2.4 | 2200 | 0–0.63 | 0.35 | 30 | 21.6–43.92 |
| [96] | 3 | 1 | 0 | 169.1 | 412.4 | 0.4 | 927.8 | 890.7 | 12 | 0.0 | 1100 | 0–0.63 | 1 | 50 | 40.1–41.6 |
| [97] | 3 | 1 | 0 | 188.0 | 400.0 | 0.5 | 610.0 | 1132.0 | 10 | 3.3 | 1270 | 0–1 | 0.62 | 30 | 36.4–40.5 |
| Tot. | 422 | 0|1 | 0|1 | 123–398 | 258–651 | 0.3–0.7 | 408–1225 | 356.0–1594.2 | 10–40 | 0.0–18.4 | 380–2200 | 0–2 | 0.1–1.2 | 25–62 | 16–88 |
| Specimen Type | Conversion Factor | Source | Note |
|---|---|---|---|
| Cubic | 0.80 | ACI 318 [98] | Below 60 MPa strength |
| Cubic | 0.90 | ACI 318 [98] | Above 60 MPa strength |
| Prismatic | 0.96 | Wu et al. [99] | –– |
| Variable | Mean | StDev | Minimum | Q1 | Median | Q3 | Maximum |
|---|---|---|---|---|---|---|---|
| 0.8012 | 0.3997 | 0.0000 | 1.0000 | 1.0000 | 1.0000 | 1.0000 | |
| 0.0865 | 0.2814 | 0.0000 | 0.0000 | 0.0000 | 0.0000 | 1.0000 | |
| 181.19 | 23.62 | 123.00 | 165.00 | 175.00 | 192.50 | 264.00 | |
| 394.97 | 74.01 | 258.00 | 342.00 | 392.00 | 450.00 | 651.00 | |
| 0.472 | 9.23 | 0.285 | 0.390 | 0.4800 | 0.550 | 0.690 | |
| 804.05 | 152.58 | 488.00 | 713.00 | 756.00 | 911.00 | 1225.00 | |
| 1067.6 | 210.6 | 356.0 | 945.0 | 1088.6 | 1206.3 | 1594.2 | |
| 19.542 | 5.218 | 10.000 | 19.000 | 20.000 | 20.000 | 40.000 | |
| 3.451 | 4.131 | 0.000 | 0.000 | 2.750 | 4.963 | 18.400 | |
| 989.4 | 378.5 | 380.0 | 600.0 | 1050.0 | 1200.0 | 2200.0 | |
| 0.7246 | 0.5377 | 0.0000 | 0.3840 | 0.5780 | 1.0000 | 2.0000 | |
| 0.7553 | 0.1970 | 0.1000 | 0.7000 | 0.7500 | 0.9000 | 1.2150 | |
| 44.015 | 12.178 | 25.000 | 32.300 | 40.000 | 60.000 | 62.000 | |
| 39.677 | 11.034 | 16.000 | 31.800 | 37.418 | 45.358 | 70.000 |
| Hyperparameter | Role | Range | Default Value (Model-0) | Optimized Value (Model-1) |
|---|---|---|---|---|
| max_depth | Tree maximum depth: modifying this parameter to higher values results in a more intricate model, increasing the risk of overfitting. | 0– | 6 | 52 |
| n_estimators | This hyperparameter dictates the quantity of boosting iterations or trees incorporated within the ensemble. | 1– | 100 | 325 |
| learning_rate | Step-size shrinkage employed during updates is intended to mitigate overfitting. | 0–1 | 0 | 0.2 |
| colsample_bytree | The subsample ratio of columns determines the proportion of features used when constructing each tree. | 0–1 | 1 | 0.1 |
| subsample | Subsample ratio of training instance (e.g., 0.5 indicates 50% of data used prior to growing trees). | >0–1 | 1 | 0.5 |
| reg_alpha | L1 regularization: increasing its value makes the model more conservative. | –– | 0 | 0.01 |
| reg_lambda | L2 regularization: increasing its value makes the model more conservative. | –– | 1 | 10 |
| gamma | Regularization parameter for tree pruning that specifies the minimum loss reduction required to make a split. | 0– | 0 | 0.1 |
| Performance Indicator | Model-0 | Model-1 | ||
|---|---|---|---|---|
| Training Set | Testing Set | Training Set | Testing Set | |
| 0.742 | 3.541 | 1.239 | 2.797 | |
| 2.576 | 28.413 | 4.008 | 16.997 | |
| 1.605 | 5.330 | 2.002 | 3.933 | |
| 0.978 | 0.776 | 0.966 | 0.879 | |
| Oxide Composition (%) | L.O.I. (%) | Specific Gravity | Fineness (m2/kg) | ||||||
|---|---|---|---|---|---|---|---|---|---|
| SiO2 | Al2O3 | Fe2O3 | CaO | MgO | Na2Oeq | SO3 | |||
| 20.20 | 5.49 | 4.12 | 65.43 | 0.71 | 0.26 | 2.61 | 1.38 | 3.14 | 373 |
| Fiber | Length (mm) | Diameter (mm) | Aspect Ratio | Young’s Modulus (GPa) | Tensile Strength (MPa) | |
|---|---|---|---|---|---|---|
| Shape | ID | |||||
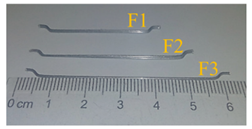 | F1 | 40 | 0.62 | 65 | 210 | 1250 |
| F2 | 50 | 0.62 | 80 | |||
| F3 | 60 | 0.75 | 80 | |||
| Model’s Input Variables | |||||||||||||||||
|---|---|---|---|---|---|---|---|---|---|---|---|---|---|---|---|---|---|
| No. | ID | ||||||||||||||||
| 1 | H-F1-0.5 | 1 | 0 | 157.5 | 450 | 0.35 | 716 | 1053 | 10 | 0.68 | 1250 | 0.62 | 0.5 | 65 | 69.4 | 74.1 | 0.937 |
| 2 | N-F1-0.5 | 1 | 0 | 157.5 | 350 | 0.45 | 798 | 1078 | 10 | 0.42 | 1250 | 0.62 | 0.5 | 65 | 60.7 | 56.3 | 1.078 |
| 3 | H-F1-1.0 | 1 | 0 | 157.5 | 450 | 0.35 | 716 | 1053 | 10 | 0.68 | 1250 | 0.62 | 1.0 | 65 | 72.3 | 65.8 | 1.099 |
| 4 | N-F1-1.0 | 1 | 0 | 157.5 | 350 | 0.45 | 798 | 1078 | 10 | 0.42 | 1250 | 0.62 | 1.0 | 65 | 64.1 | 61.8 | 1.037 |
| 5 | H-F1-1.5 | 1 | 0 | 157.5 | 450 | 0.35 | 716 | 1053 | 10 | 0.68 | 1250 | 0.62 | 1.5 | 65 | 75.9 | 79.7 | 0.952 |
| 6 | N-F1-1.5 | 1 | 0 | 157.5 | 350 | 0.45 | 798 | 1078 | 10 | 0.42 | 1250 | 0.62 | 1.5 | 65 | 62.3 | 59.1 | 1.054 |
| 7 | H-F2-0.5 | 1 | 0 | 157.5 | 450 | 0.35 | 716 | 1053 | 10 | 0.68 | 1250 | 0.62 | 0.5 | 80 | 73.8 | 71.7 | 1.029 |
| 8 | N-F2-0.5 | 1 | 0 | 157.5 | 350 | 0.45 | 798 | 1078 | 10 | 0.42 | 1250 | 0.62 | 0.5 | 80 | 55.8 | 60.4 | 0.924 |
| 9 | H-F2-1.0 | 1 | 0 | 157.5 | 450 | 0.35 | 716 | 1053 | 10 | 0.68 | 1250 | 0.62 | 1.0 | 80 | 76.4 | 81.2 | 0.941 |
| 10 | N-F2-1.0 | 1 | 0 | 157.5 | 350 | 0.45 | 798 | 1078 | 10 | 0.42 | 1250 | 0.62 | 1.0 | 80 | 62.3 | 61.1 | 1.020 |
| 11 | H-F2-1.5 | 1 | 0 | 157.5 | 450 | 0.35 | 716 | 1053 | 10 | 0.68 | 1250 | 0.62 | 1.5 | 80 | 77.3 | 80.3 | 0.963 |
| 12 | N-F2-1.5 | 1 | 0 | 157.5 | 350 | 0.45 | 798 | 1078 | 10 | 0.42 | 1250 | 0.62 | 1.5 | 80 | 64.2 | 69.6 | 0.922 |
| 13 | H-F3-0.5 | 1 | 0 | 157.5 | 450 | 0.35 | 716 | 1053 | 10 | 0.68 | 1250 | 0.75 | 0.5 | 80 | 68.0 | 63.2 | 1.076 |
| 14 | N-F3-0.5 | 1 | 0 | 157.5 | 350 | 0.45 | 798 | 1078 | 10 | 0.42 | 1250 | 0.75 | 0.5 | 80 | 58.9 | 60.7 | 0.970 |
| 15 | H-F3-1.0 | 1 | 0 | 157.5 | 450 | 0.35 | 716 | 1053 | 10 | 0.68 | 1250 | 0.75 | 1.0 | 80 | 70.6 | 68.9 | 1.025 |
| 16 | N-F3-1.0 | 1 | 0 | 157.5 | 350 | 0.45 | 798 | 1078 | 10 | 0.42 | 1250 | 0.75 | 1.0 | 80 | 59.7 | 61.8 | 0.966 |
| 17 | H-F3-1.5 | 1 | 0 | 157.5 | 450 | 0.35 | 716 | 1053 | 10 | 0.68 | 1250 | 0.75 | 1.5 | 80 | 78.6 | 83.4 | 0.942 |
| 18 | N-F3-1.5 | 1 | 0 | 157.5 | 350 | 0.45 | 798 | 1078 | 10 | 0.42 | 1250 | 0.75 | 1.5 | 80 | 66.2 | 68.6 | 0.965 |
| 19 | H-CTRL | 1 | 0 | 157.5 | 450 | 0.35 | 716 | 1053 | 10 | 0.68 | –– | –– | –– | –– | 61.7 | 59.8 | 1.032 |
| 20 | N-CTRL | 1 | 0 | 157.5 | 350 | 0.45 | 798 | 1078 | 10 | 0.42 | –– | –– | –– | –– | 52.4 | 57.2 | 0.916 |
| 0.992 | |||||||||||||||||
| 0.058 | |||||||||||||||||
| CV | 0.059 | ||||||||||||||||
Disclaimer/Publisher’s Note: The statements, opinions and data contained in all publications are solely those of the individual author(s) and contributor(s) and not of MDPI and/or the editor(s). MDPI and/or the editor(s) disclaim responsibility for any injury to people or property resulting from any ideas, methods, instructions or products referred to in the content. |
© 2023 by the authors. Licensee MDPI, Basel, Switzerland. This article is an open access article distributed under the terms and conditions of the Creative Commons Attribution (CC BY) license (https://creativecommons.org/licenses/by/4.0/).
Share and Cite
Abbas, Y.M.; Khan, M.I. Robust Machine Learning Framework for Modeling the Compressive Strength of SFRC: Database Compilation, Predictive Analysis, and Empirical Verification. Materials 2023, 16, 7178. https://doi.org/10.3390/ma16227178
Abbas YM, Khan MI. Robust Machine Learning Framework for Modeling the Compressive Strength of SFRC: Database Compilation, Predictive Analysis, and Empirical Verification. Materials. 2023; 16(22):7178. https://doi.org/10.3390/ma16227178
Chicago/Turabian StyleAbbas, Yassir M., and Mohammad Iqbal Khan. 2023. "Robust Machine Learning Framework for Modeling the Compressive Strength of SFRC: Database Compilation, Predictive Analysis, and Empirical Verification" Materials 16, no. 22: 7178. https://doi.org/10.3390/ma16227178
APA StyleAbbas, Y. M., & Khan, M. I. (2023). Robust Machine Learning Framework for Modeling the Compressive Strength of SFRC: Database Compilation, Predictive Analysis, and Empirical Verification. Materials, 16(22), 7178. https://doi.org/10.3390/ma16227178