Article

Peculiarity of the Structure and Luminescence of Glasses in La2S3-Ga2S3-GeS2:Pr3+ System

Institute of Chemistry, St. Petersburg State University, 198504 St. Petersburg, Russia
*
Author to whom correspondence should be addressed.
Materials 2023, 16(22), 7094; https://doi.org/10.3390/ma16227094
Submission received: 29 August 2023 / Revised: 29 October 2023 / Accepted: 7 November 2023 / Published: 9 November 2023
(This article belongs to the Special Issue Structure, Properties, and Applications of Optical Glass and Fiber)

Abstract

:
The effect of modifying the composition of a glass matrix based on the Ga2S3-GeS2:Pr3+ system due to the addition of La2S3 on the structure and the optical and luminescent properties of these glasses has been studied. It has been shown that the addition of La2S3 leads to changes in the nearest structural environment of Ga, Ge, and S and increases the degree of ionicity of the bonds of the Pr3+ ion. Despite the existence of a large glass formation region in the Ga2S3-GeS2-La2S3 system and the structural and chemical similarity of La and Pr, La2S3 does not promote a more uniform distribution of Pr3+ ions in the glass matrix, and thus does not reduce the concentration quenching of the luminescence of Pr3+ ions. However, the addition of La2S3 increases the probability of emission of Pr3+ ions and decreases the radiative lifetime. Additionally, it was shown that, when studying the structure and luminescent properties of glasses with La, it is necessary to take into account a significant concentration of rare earth traces (Pr and Nd).

1. Introduction

Chalcogenide glasses (ChGs) possess a number of properties that make them attractive as a matrix for rare earth ions (REIs) to create luminescent materials for the near- and mid-IR spectral region. These properties include low phonon energy, high refractive index, and transparency across a wide spectral range. Furthermore, by adjusting the composition, glasses can be selected that exhibit optimal values of glass transition temperature and crystallization stability. Recently, interest in ChGs doped with REIs has resurged due to the development of active optical fibers based on them for the mid-IR region of the spectrum [1]. The demand for such fibers stems from the possibility of overlapping the region of characteristic vibrations of the organic groups, which makes it possible to create portable gas sensors based on such fibers as well as to use them in biological and medical diagnostics [2,3,4].
It is believed that RE elements are relatively well soluble in ChGs [5,6]. However, this pertains solely to obtaining a material in a glassy state, and not to the degree of uniformity in the distribution of REIs within the glass matrix. To prevent nonradiative relaxation of an excited REI due to energy transfer to another REI, the latter ion must be located beyond the second coordination sphere. With a uniform distribution of REIs in the glass matrix, this condition is satisfied by an REI concentration of ≤6 at.% [7]. At the same time, in reality, concentration quenching transpires at concentrations less than 1 at.% REI, indicating the uneven distribution of REIs in the glass matrix and the formation of regions enriched with REIs.
To enhance the solubility of REIs in chalcogenide glasses, several strategies were employed. First of all, glasses containing Ga2S3 were used as a matrix. Ga in chalcogenide glasses forms GaS4 tetrahedral complex structural units, which compensate for the REI charge and contribute to its more uniform distribution [8,9]. Second, La2S3 forms a large region of glass formation with Ga2S3 and GeS2 [5]. Along the La2S3-GeS2 quasi-binary section, up to 50 mol.% La2S3 can be incorporated, and along the La2S3-Ga2S3 section, the range spans from 25 to 50 mol.% La2S3. Based on this premise, it was a priori believed that significant amounts of other RE elements should homogeneously dissolve in glasses with a high content of La2S3 because they should isomorphically replace the positions of the lanthanum atoms [10,11]. From this point of view, Pr is the most suitable RE element because it is the nearest element to La in the lanthanide series and its ionic radius should be closest to the ionic radius of La at the same coordination number. With an increase in the atomic number of an RE element, the ionic radius should decrease due to the compression effect [12].
At the same time, during the investigation of the luminescent properties of REIs in chalcogenide glasses containing lanthanum, the most effective concentrations of RE elements—excluding lanthanum—did not exceed, for example, 0.08 at.% Dy [13], 1.2 at.% Er [14], and 0.04 at.% Nd [15].
In this regard, the following question arises: Do ions of other lanthanides in chalcogenide glass containing La really occupy structural positions equivalent to La? Such an arrangement would contribute to their dissolution in the glass matrix and consequently lead to a reduction in the concentration quenching of their luminescence.
To solve this issue, a Ga2S3-GeS2 quasi-binary system was chosen as the basic glass-forming system. Pr was chosen as the RE element. This choice was due to its structural and chemical similarity to La. Furthermore, the Pr3+ ion has a number of practical advantages. In chalcogenide glass doped with Pr3+ ions, a broad luminescence band is observed in the region from 2000 to 2700 nm [16], which overlaps the fourth transparency window of biological tissues (2100–2300 nm). This spectral window is well suited for studying collagen-containing tissues [17,18]. Also, broadband luminescence in the mid-IR region of the spectrum from 3.5 to 5.2 μm makes it possible to create gas optical sensors for CO2, CO, and N2O [19,20].
The objective of this work was to study the effect of modifying the composition of the glass matrix based on the Ga2S3-GeS2 quasi-binary system by adding La2S3 on the concentration quenching of the luminescence of Pr3+ ions, as well as to reveal the features of the luminescence and structure of these glasses. The relatively high refractive index, transparency in the IR range, and small radiative lifetime REIs in these glasses allow us to consider them as optically active materials for fiber optics in the near- and mid-IR range.
As a result of the study, the influence of La2S3 on the structure and properties of glasses of the Ga2S3-GeS2 system was studied. It is shown that the introduction of La2S3 leads to some changes in the nearest structural environment of Ga, Ge, and S. Furthermore, the addition of La2S3 increases the degree of ionicity of the bond between the Pr3+ ion and sulfur. In terms of its influence on the luminescence properties of Pr3+ ions, La2S3 does not help to reduce the concentration quenching of the luminescence of Pr3+ ions in these glasses. Nevertheless, it increases the probability of emission and reduces the radiative lifetime. Apparently, the positions occupied by the La3+ and Pr3+ ions in the glass structure are not equivalent. Moreover, the study highlighted the importance of considering the significant concentration of rare earth impurity elements (Pr and Nd) when studying the structure and luminescent properties of glasses with La.

2. Materials and Methods

2.1. Materials

The compositions for synthesis and research were chosen as follows. First, the fraction of La2S3 was varied while keeping the ratio of Ga2S3 and GeS2 constant. Second, the ratio of Ga2S3 and GeS2 was varied at a constant fraction of La2S3. This choice of compositions makes it possible to trace the influence of each of the components on the properties under investigation. The chemical composition of the synthesized glasses used for introducing Pr is given in Table 1.
Synthesis was carried out by fusing pure components (Sigma-Aldrich, Saint Louis, MO, USA) in quartz ampoules, which were evacuated to high vacuum and sealed. The furnace constantly wobbled during the synthesis. Heating was conducted in several stages due to the high pressure of the sulfur vapor at the initial stages of synthesis. To prevent interaction of La with the walls of the quartz ampoule at high temperatures, the inside of the ampoule was coated with glass graphite (see Supplementary Materials). The maximum synthesis temperature was 1050 °C. All glasses were obtained by quenching the ampoules with a melt in an air environment. The prepared glassy matrixes were used as a host for the further preparation of glasses containing various concentrations of Pr3+ ions. Synthesis of glasses containing Pr was carried out using a similar procedure, but in one stage.
The composition of the synthesized samples was checked using EDX analysis (EDX 800P, Shimadzu, Kyoto, Japan).

2.2. Methods

To measure the properties of the samples, plane-parallel plates with a thickness of about 2 mm were obtained by grinding and polishing the synthesized glasses. The exact thickness values of these samples were measured using a high-precision digital snap gage.
The density of the obtained glasses was measured with hydrostatic weighing in toluene. The refractive index n was determined by observing the change in the position of the focal plane of the lens when a plane-parallel sample was placed between the focus and the lens. In such cases, the refractive index can be calculated using the following equation: n = (1 − Δx/d)−1, where d is the thickness of the sample and Δx is the difference in the positions of the focal plane without and with the sample. These measurements were carried out at a wavelength of 1.2 μm using an infrared IR microscope (GOI, St. Petersburg, Russia).
The absence of crystalline inclusions in the samples was controlled with X-ray diffraction using a D2 Phaser diffractometer (Bruker, Billerica, MA, USA) with the following parameters: CuKα1+2 X-ray tube radiation, sample rotation speed 20 rpm, diffraction angle interval 2 theta = 7–60°, scanning step of 0.02°.
Measurements of the optical absorption spectra within the spectral range of 0.5 to 3.2 µm were carried out using a UV-3600 spectrometer (Shimadzu, Kyoto, Japan), while spectra spanning the range from 2.5 to 25 µm were taken on a Tensor 27 spectrophotometer (Bruker, USA). The instrument ranges overlapped to ensure comprehensive data coverage.
The Raman spectra of glassy samples were measured using a Senterra Raman spectrometer (Bruker, USA) coupled with an Olympus BX-52 optical microscope (Olympus Optical, Tokyo, Japan). These measurements were taken at room temperature. A laser with a wavelength of 785 nm served as the excitation source. The laser power was 1 mW to prevent any potential sample heating.
Luminescence spectra were measured using a Fluorolog-3 spectrofluorometer (Horiba Jobin Yvon, Osaka, Japan). The pump laser beam was directed at the sample surface at an angle of approximately 90 degrees. The signal-collecting optical fiber was positioned at an angle of approximately 45 degrees to this surface at a distance of approximately 2 cm from the surface. In this geometry, the reflected beam of the pump laser did not enter into the light guide. To determine the most effective excitation wavelength, the luminescence excitation spectrum was measured at a wavelength of 1040 nm. Subsequently, the determined value of the pump wavelength (607 nm) was used to excite luminescence.
The calculation of radiative lifetime, transition probability, and branching coefficients in accordance with the Judd–Ofelt theory from the optical absorption spectra was carried out using the methodology outlined in [21]. The matrix elements for these calculations were sourced from [22].

3. Results and Discussion

All the samples, including the matrixes themselves and the samples containing praseodymium ions, were obtained in the glassy state by cooling the ampoules with the melt in air. The absence of crystalline inclusions in the glass samples was controlled with X-ray diffraction (Figure S1A in Supplementary Materials). An example of a photo image of the synthesized glasses is shown in Figure S1B.

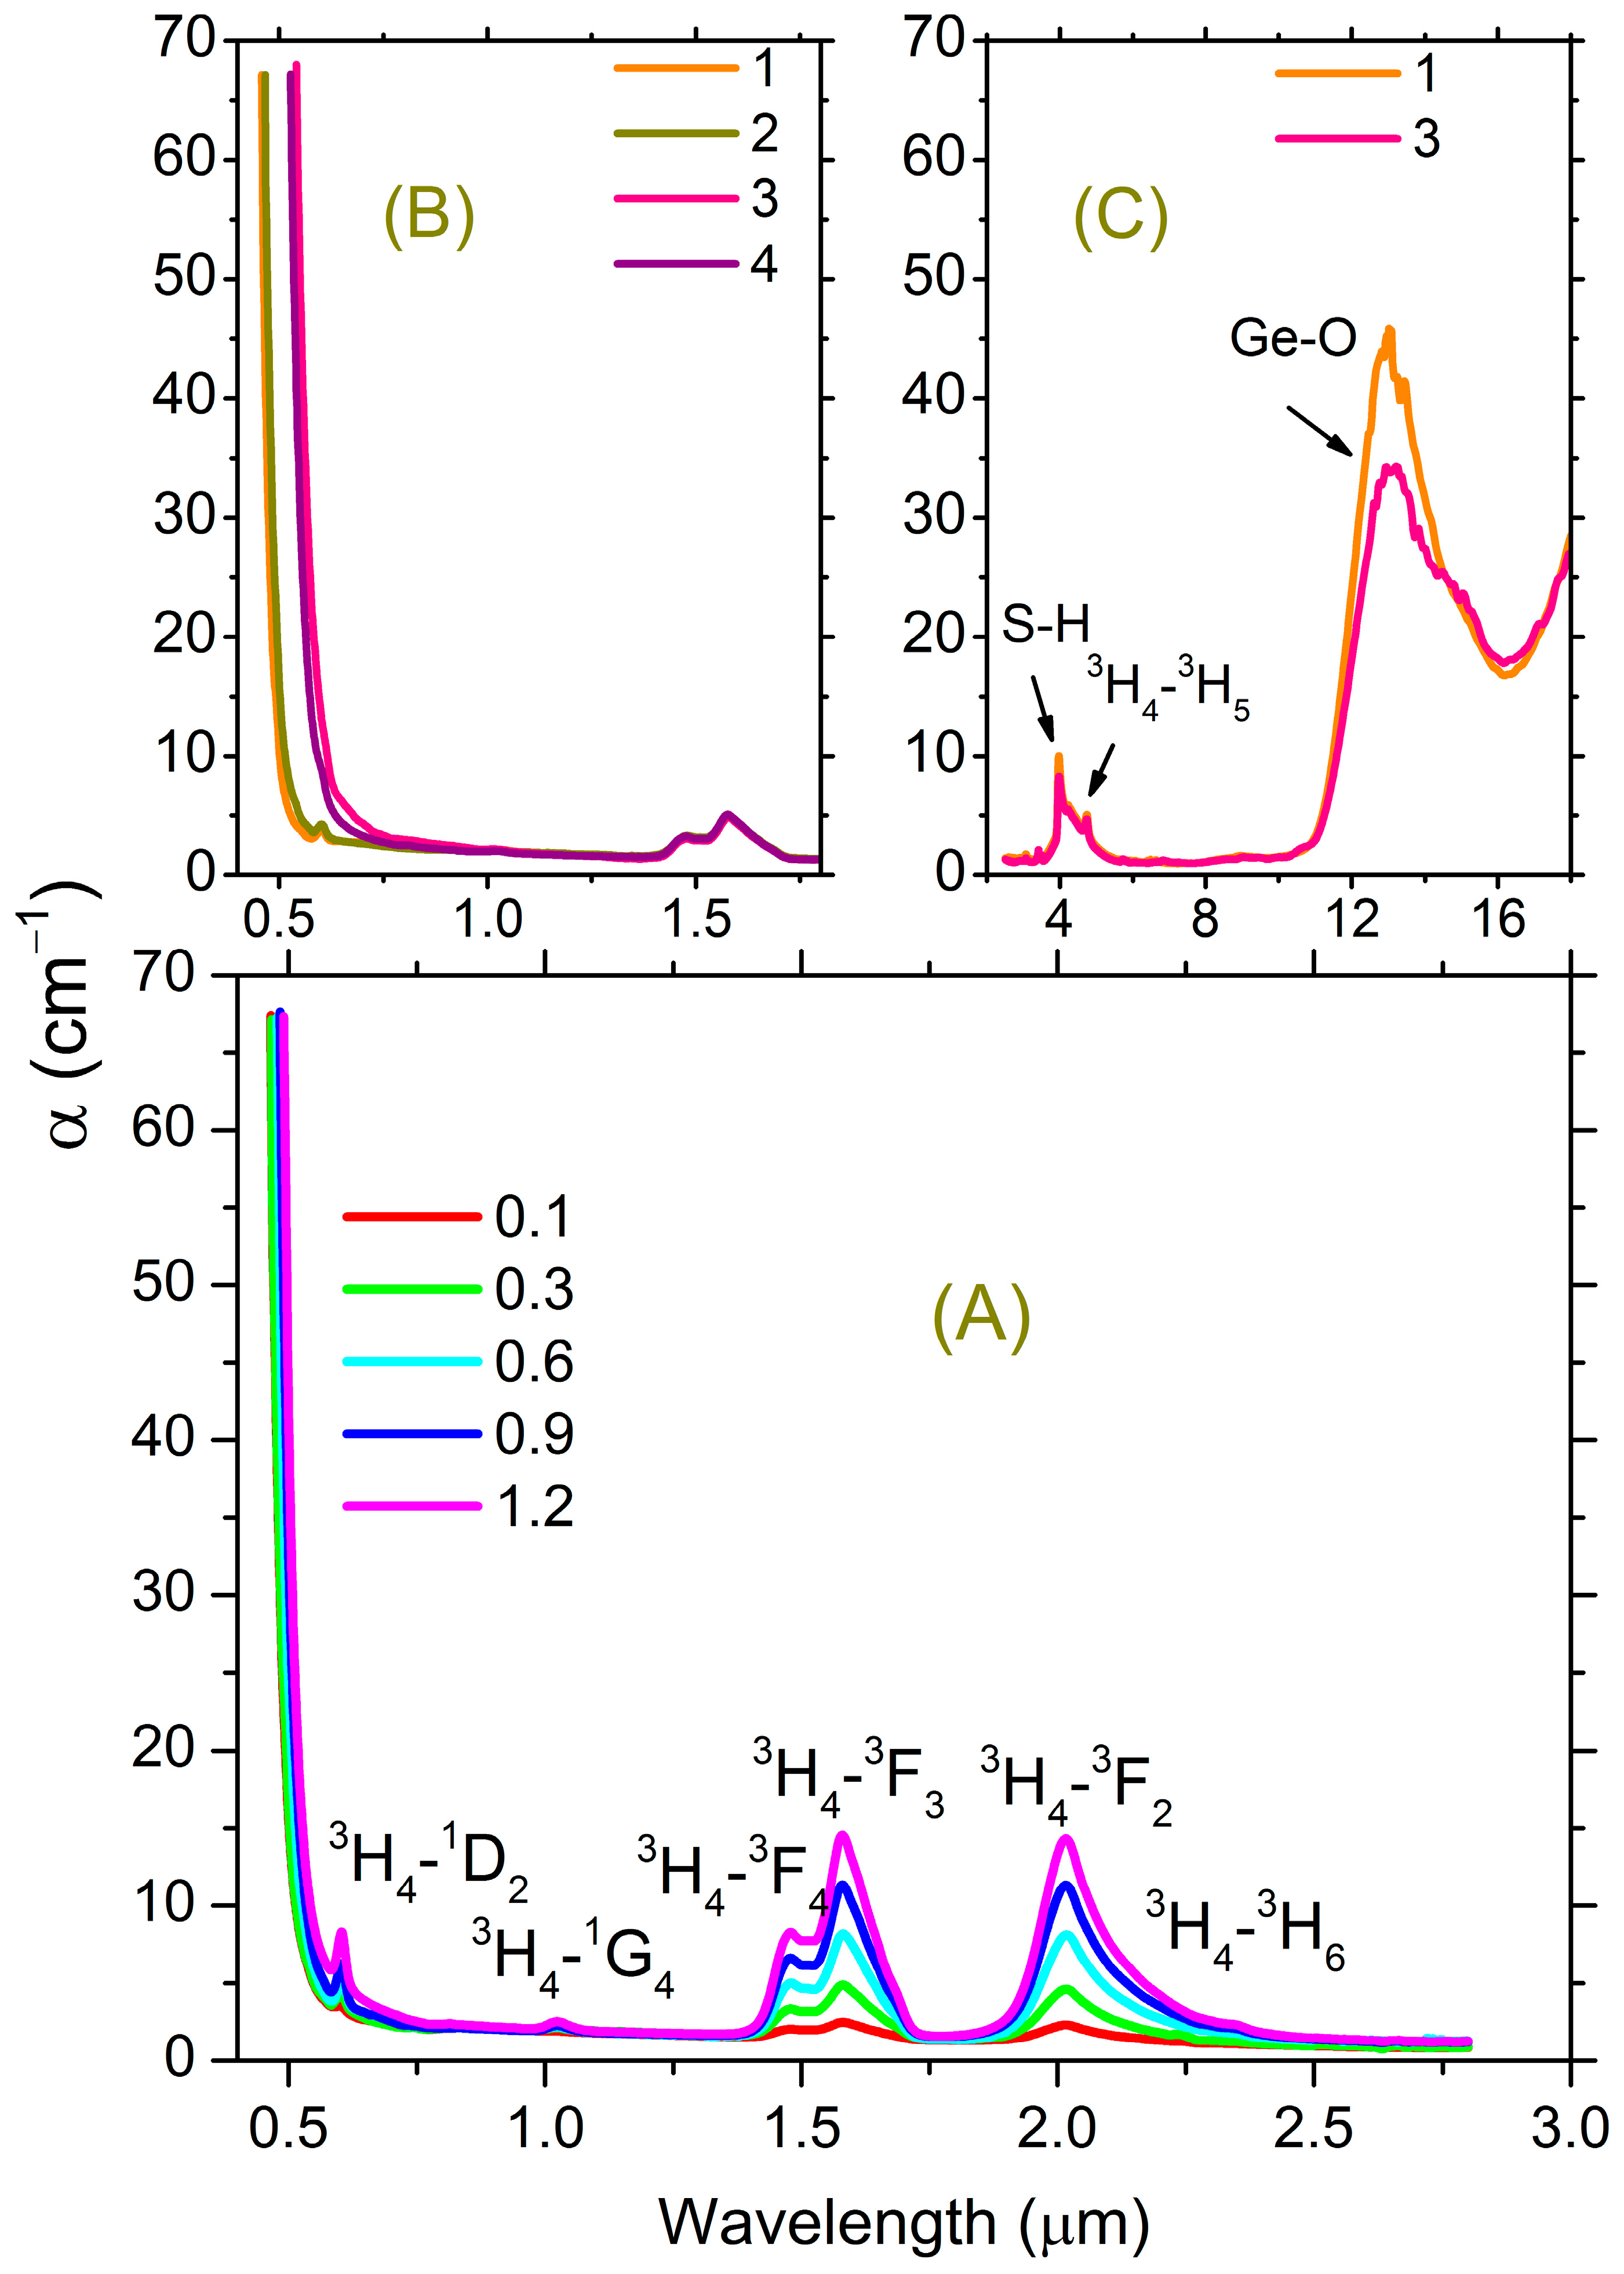
3.1. Optical Absorption Spectroscopy

The introduction of Pr into the studied glasses leads to an insignificant, monotonic shift of the fundamental absorption edge toward the longer wavelength region of the spectrum. Figure 1A shows the absorption spectra of glass composition 1 with varying Pr content.
The edge shifts by approximately 2.3 nm with an increase in concentration of 0.1 at.%. The band used to excite the luminescence is located in the region of the weak absorption tail. Similarly, the introduction of La2S3 into the glasses while maintaining a constant concentration of Pr also leads to a shift of the absorption edge toward the longer-wavelength region of the spectrum (Figure 1B). Therefore, the introduction of 10 mol.% LaS1.5 (~3.5 at.% La) leads to a shift of the short-wavelength absorption edge by ~85 nm, corresponding on average to ~2.4 nm per 0.1 at.% increase in La concentration. Thus, the degree of influence of the Pr and La additives on the spectral position of the fundamental absorption edge of the studied glasses is approximately the same.
This bias has two components. These are the metal-to-metal bonds discussed in the Raman section and the difference in band gap values of the corresponding sulfides. For La2S3 in the thin film state, Eg = 2.5 eV [23]. The band gap is much larger for GeS2 and Ga2S3. For Ga2S3, the band gap varies from 2.74 to 3.30 eV according to various references [24,25,26]. In the case of GeS2, Eg ranges from 3.1 to 3.25 eV [27,28].
In the IR region of the spectrum, the introduction of La2S3 into glasses has practically no effect on the absorption spectrum of the glass (Figure 1C). The position of the phonon absorption edge in the spectrum is determined by the presence of Ge-O impurity bonds. Absorption on impurity S-H groups is also observed, which partially overlaps the broadband absorption due to the 3H4-3H5 transition of the Pr3+ ion (Figure 1C).
The spectral position of the absorption bands for REIs depends, among other factors, on the interaction of the absorbing ion with the surrounding atoms, namely, on the strength of the local electric field on the lanthanide ion, on the degree of ionicity of the realized bonds, and on the coordination number. Thus, in chalcogenide glasses containing REIs, a spectral shift of the REI absorption bands is observed with a change in the degree of bond ionicity upon replacement of a chalcogen in a series of group 6 elements [7]. In this context, it should be taken into account that the coordination number for REIs is determined by the ratio of the cation and anion radii—Pr and S, in this case. Consequently, the coordination number of Pr should not depend on the composition of the glassy matrix in the studied systems. The shift in the spectral position of the absorption bands should thus be attributed to changes in the degree of ionicity of the bonds realized by Pr3+ ions. If we construct the spectral position of the Pr3+ absorption band in dependence on the composition of the glassy matrix in the studied glasses (Figure 2), then regularities are visible.
Upon adding La2S3 to the glasses, the degree of ionicity of the bonds of the Pr3+ ion increases. The ratio of Ge to Ga has a weak influence on the spectral position of the absorption band of the Pr3+ ion, and consequently, on the degree of ionicity of the bond between the Pr3+ ion and sulfur. An increase in the degree of ionicity of praseodymium–sulfur bonds should correlate with an increase in the electronegativity of metal atoms in the second coordination sphere. Pauling electronegativity is as follows: Ge = 2.0, Ga = 1.8, La = 1.1, and Pr = 1.1. Apparently, the mechanism of influence of La is different.

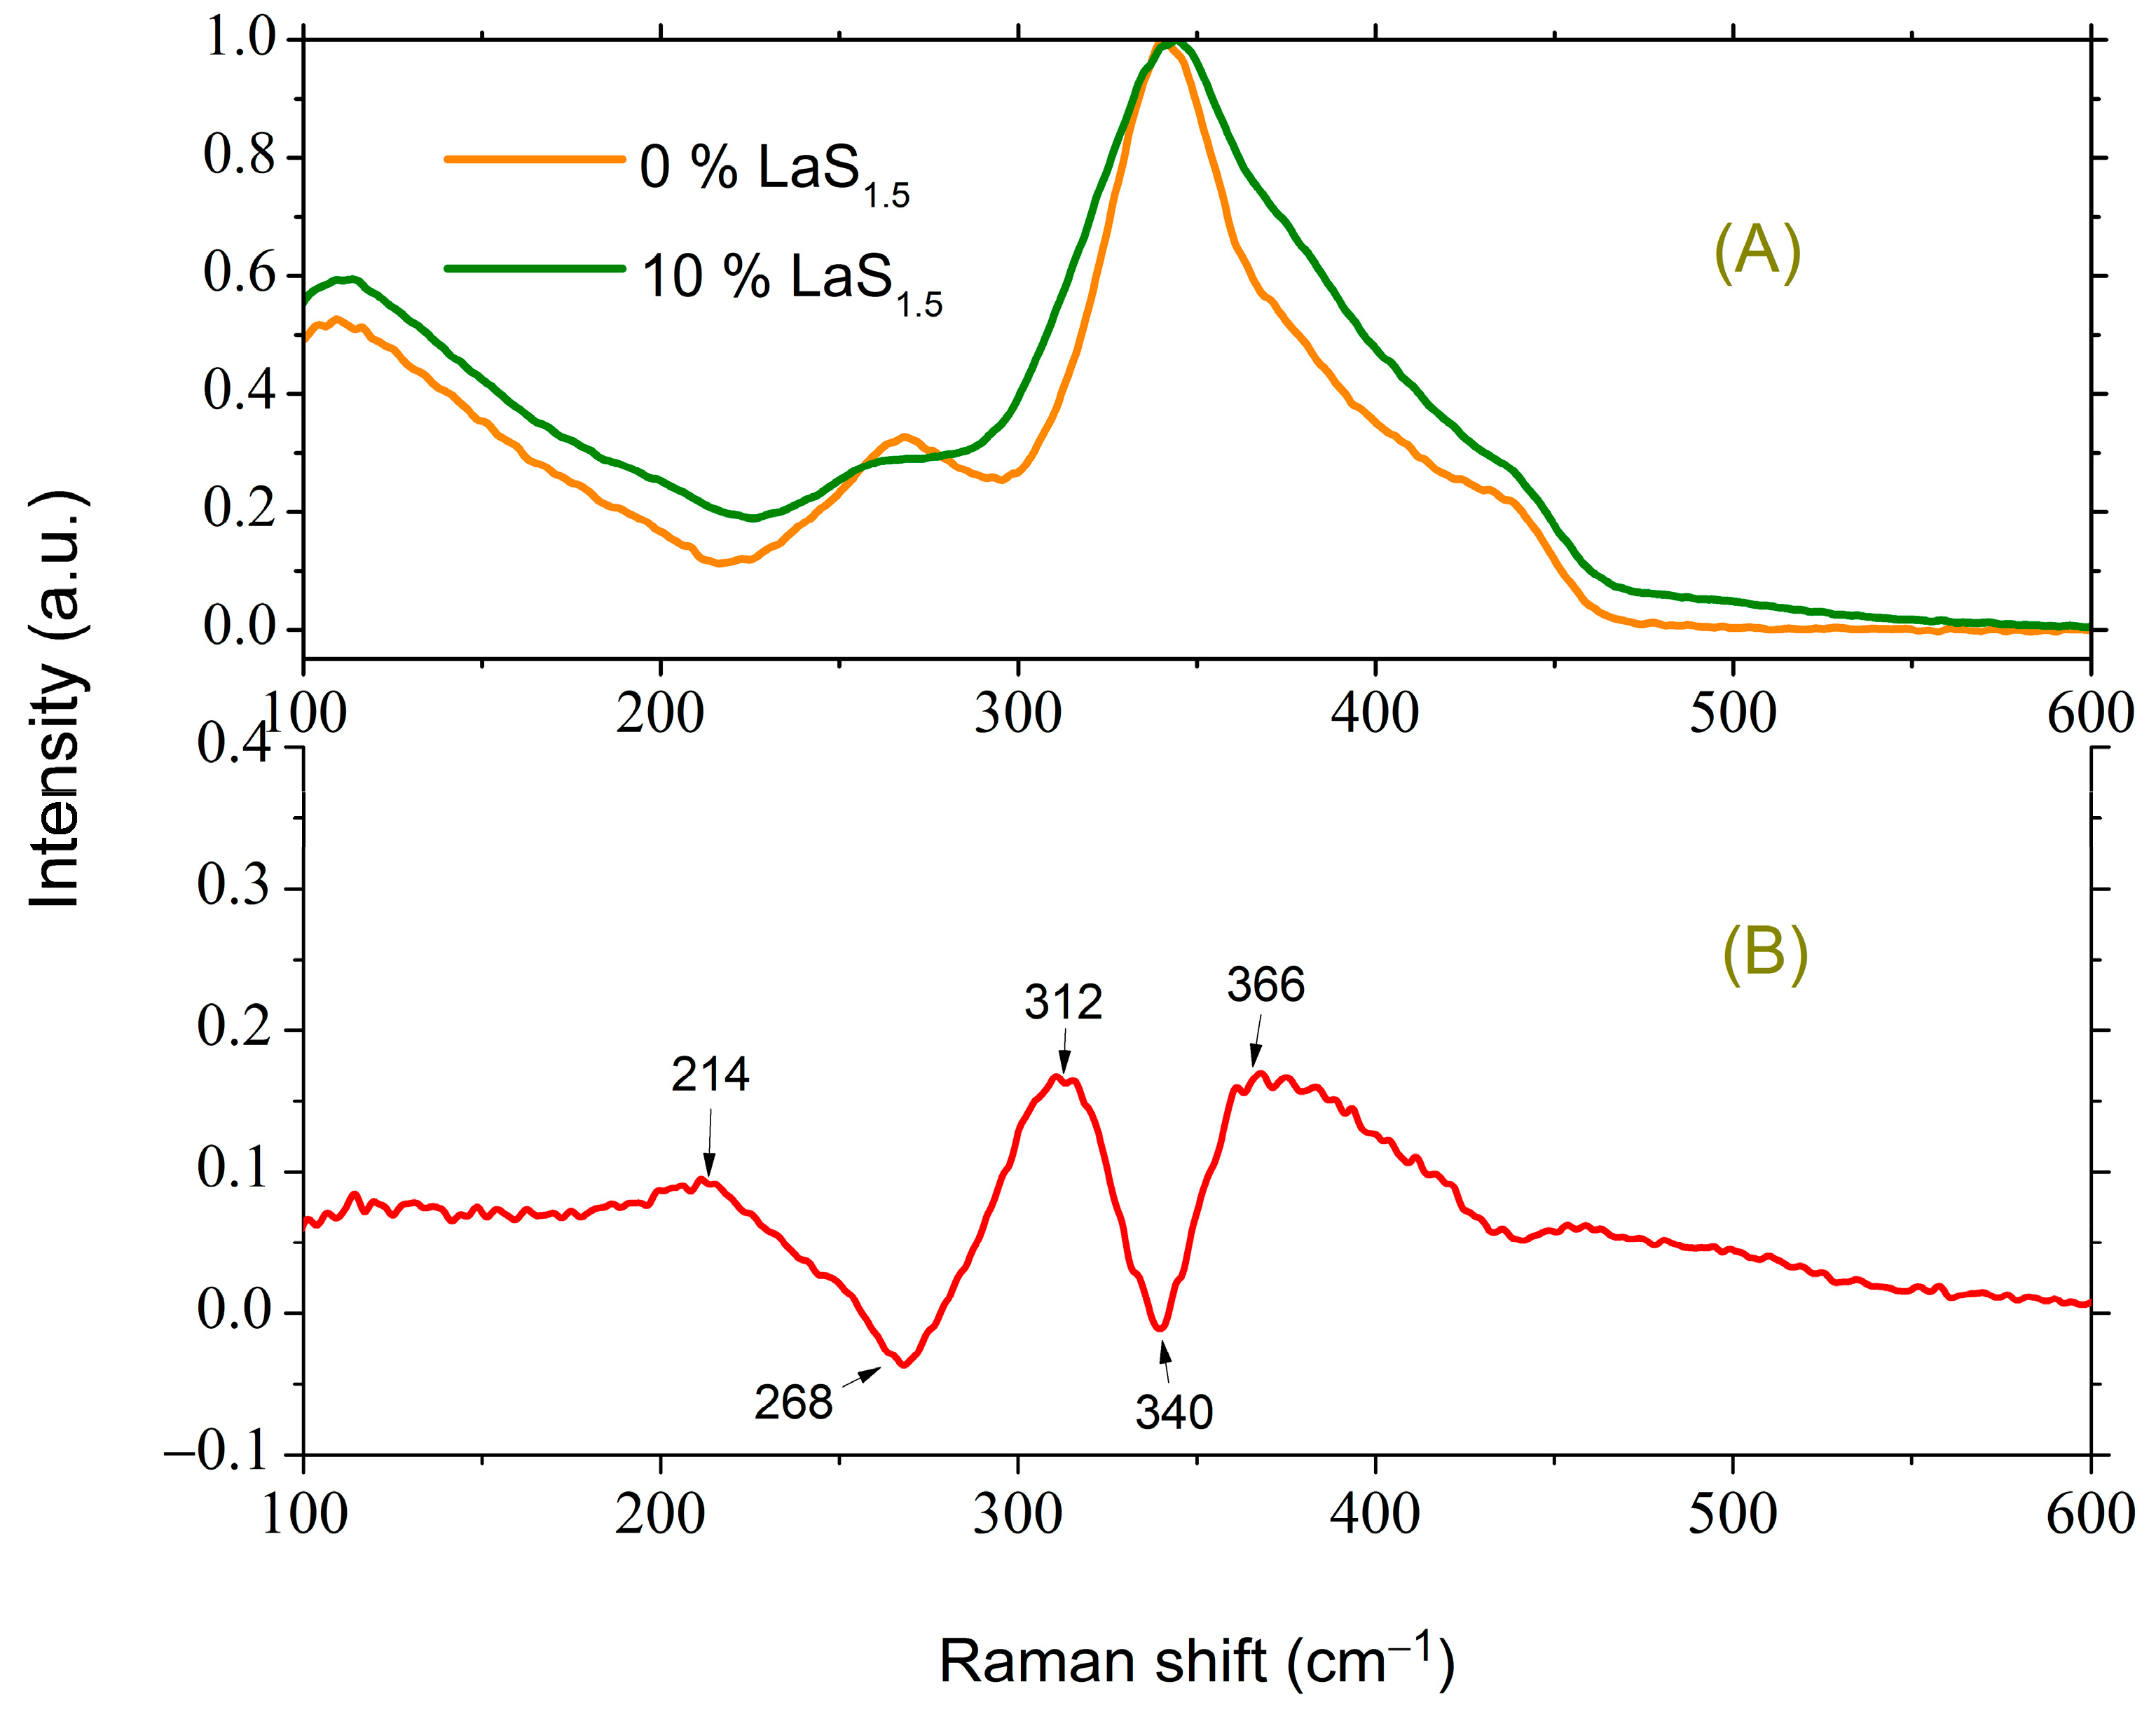
3.2. The Structure of the Studied Glasses according to Raman Spectroscopy Data

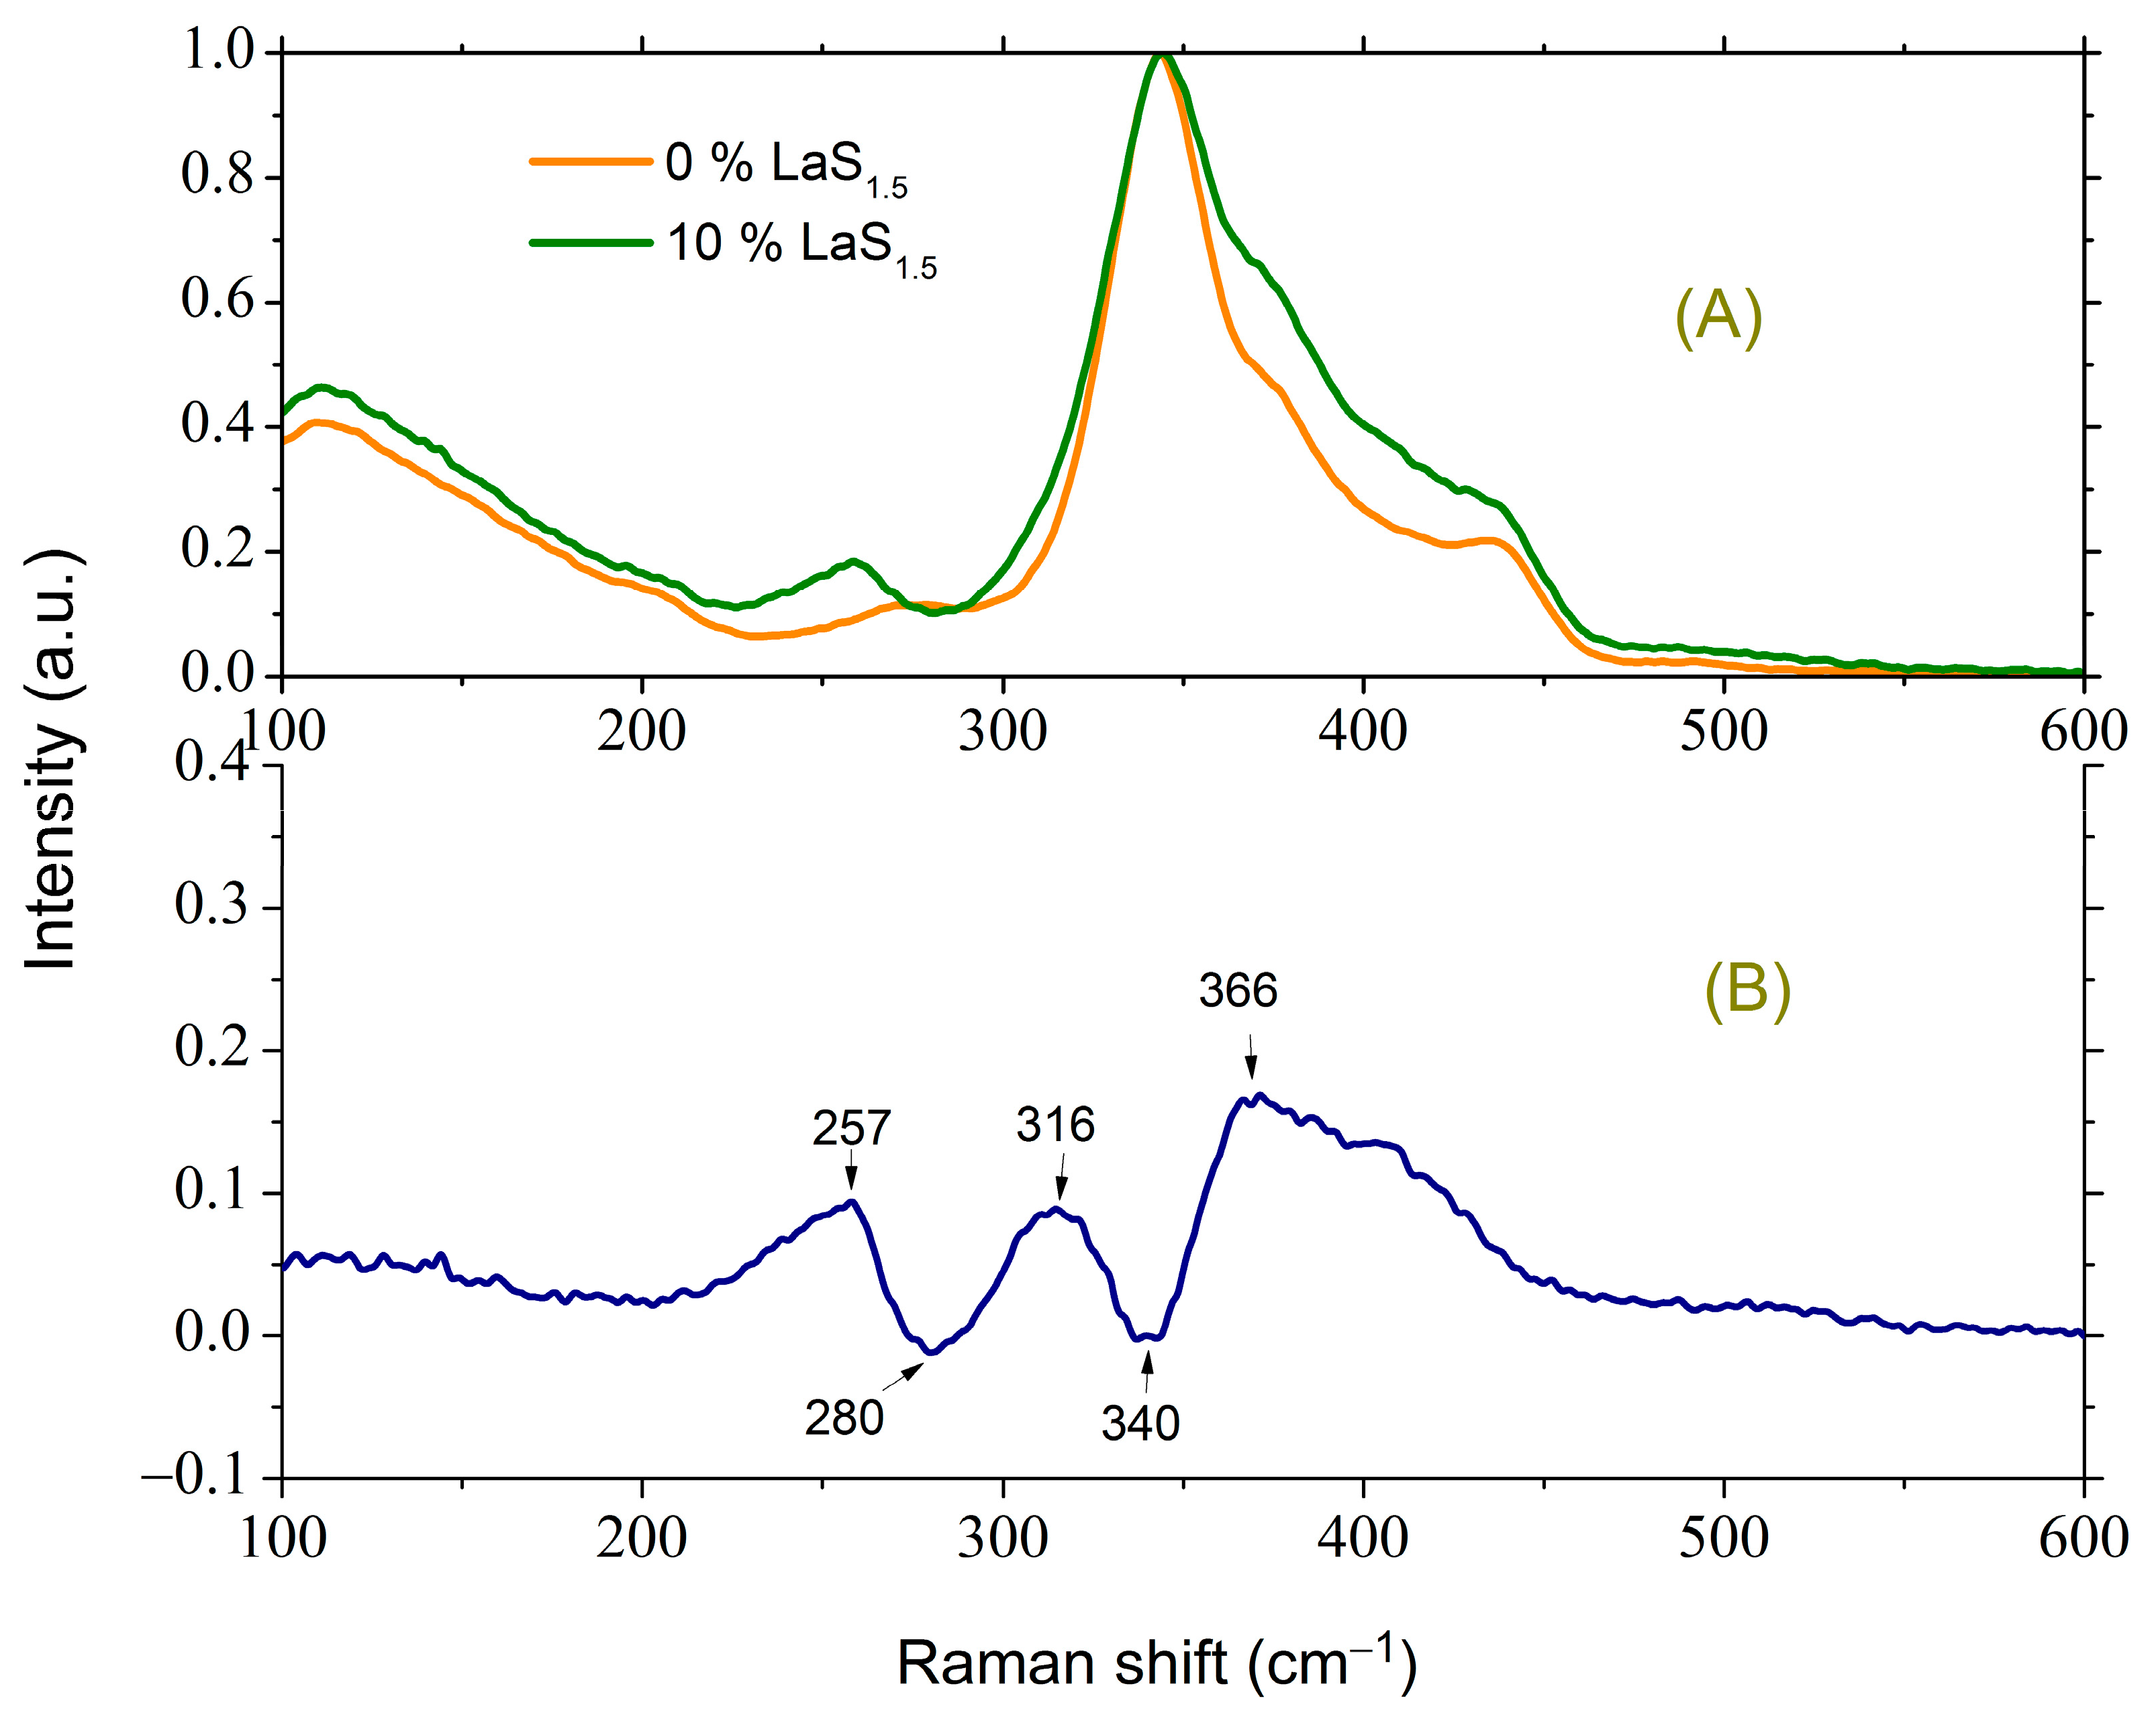
3.2.1. Initial Glasses of the Ga2S3-GeS2 System and the Influence of the La2S3 Addition

The Raman spectra of the initial glass of composition 1 and after the introduction of 10 mol.% LaS1.5 (composition 3) are shown in Figure 3A.
For enhanced clarity, the changes occurring in the spectrum of glass with the introduction of 10 mol.% LaS1.5 are presented as the difference spectrum in Figure 3B. This difference spectrum is obtained as the spectrum of the glass of composition 3 normalized to the most intense peak (344 cm−1) minus the normalized spectrum of the glass of composition 1. The peak at 342–344 cm−1 corresponds to the fully symmetric vibration of the GeS4/2 tetrahedron [29,30,31].
For glass containing 10 mol.% LaS1.5, excess scattering is observed in the regions of 257, 316, and 366 cm−1. In the latter case, a broad asymmetric peak is present. The peak at 257 cm−1 corresponds to vibrations of the S3/2Ge-GeS3/2 bonds [32,33], while in the initial glass without La2S3, the peak due to metal–metal bonds is located at 272 cm−1, indicative of Ga-Ga vibrations in a similar structural unit [8,31,34]. Hence, it can be inferred that the introduction of La2S3 induces a redistribution of S between tetrahedra based on Ge and Ga, favoring the latter. This conclusion aligns with the increase in scattering observed at 316 cm−1 because the peak in the region of 320 cm−1 can be attributed to vibrations of GaS4/2 tetrahedra [8,34,35] or vibrations of three tetrahedra connected by a common vertex [31]. As for the broad asymmetric peak from 350 to 450 cm−1, the calculation shows that this range can contain one of the modes due to vibrations of three Ga-based tetrahedra connected by a common vertex [31]. These results indicate both an increase in the fraction of GaS4 tetrahedra and an increase in the fraction of three-coordinated sulfur. Moreover, based on references [9,36,37], the band at 375 cm−1 arises from vibrations of GeS4 and/or GaS4 tetrahedra containing at least one non-bridging sulfur. With the addition of La2S3, the features characteristic of GeS2 in the spectrum in the region of 370 and 433 cm−1, corresponding to the vibrations of GeS4/2 tetrahedra connected by edges [30,31], become less pronounced (Figure 3A), suggesting a decrease in the proportion of such structural units.
When La2S3 is introduced into glass containing a larger proportion of Ga2S3 (composition 4), the changes in the Raman spectrum that occur are somewhat different. Figure 4A displays the Raman spectra of the initial glass of composition 4 and the glass after introducing 10 mol.% LaS1.5 (composition 5).
Figure 4B presents the difference spectrum, which is obtained by normalizing the spectrum of glass of composition 5 to the most intense peak (342 cm−1) and then subtracting the normalized spectrum of glass of composition 4.
The main difference between this spectrum and the spectrum presented in Figure 3 is observed at shift values less than 280 cm−1. In the initial glass (composition 4), the peak associated with metal–metal bonds is in the region of 267 cm−1 (Figure 4A). This indicates that if in the cases of composition 1 the metal–metal peak is mainly due to Ga-Ga bonds, as indicated above, then in the cases of composition 4 there is an additional contribution from Ge-Ge bonds and/or Ge-Ga bonds. Upon introducing 10 mol.% LaS1.5, the peak shifts to the region of frequencies corresponding to Ge-Ge bond vibrations (261 cm−1) as in the case of glass of composition 1. However, in this case, the intensity of this peak not only does not increase, but even decreases, resulting in a dip in the region of 268 cm−1 in the difference spectrum. This decrease may be related to the relatively lower content of GeS2 in the glass. A decrease in the intensity of the peak due to metal–metal bonds was also observed in [10] upon transition from the glass composition 80GeS2-20Ga2S3 to the composition 80GeS2-15Ga2S3-05La2S3. A slight increase in scattering around 214 cm−1 could be tentatively attributed to the vibrations of the La-S bonds (typically around 220 cm−1 [9,38]). In the case of glass 3, the contribution from the La-S bonds seems to overlap with the contribution from the Ge-Ge bonds, as evidenced by the asymmetry of the peak with a maximum at 257 cm−1 (see Figure 3).
Summarizing the above, it should be concluded that the introduction of La2S3 leads to an increase in the relative content of GaS4 tetrahedra, a decrease in the proportion of Ga-Ga bonds, an increase in the proportion of three-coordinated and non-bridging sulfur, and a decrease in the proportion of edge-connected GeS4 tetrahedra.

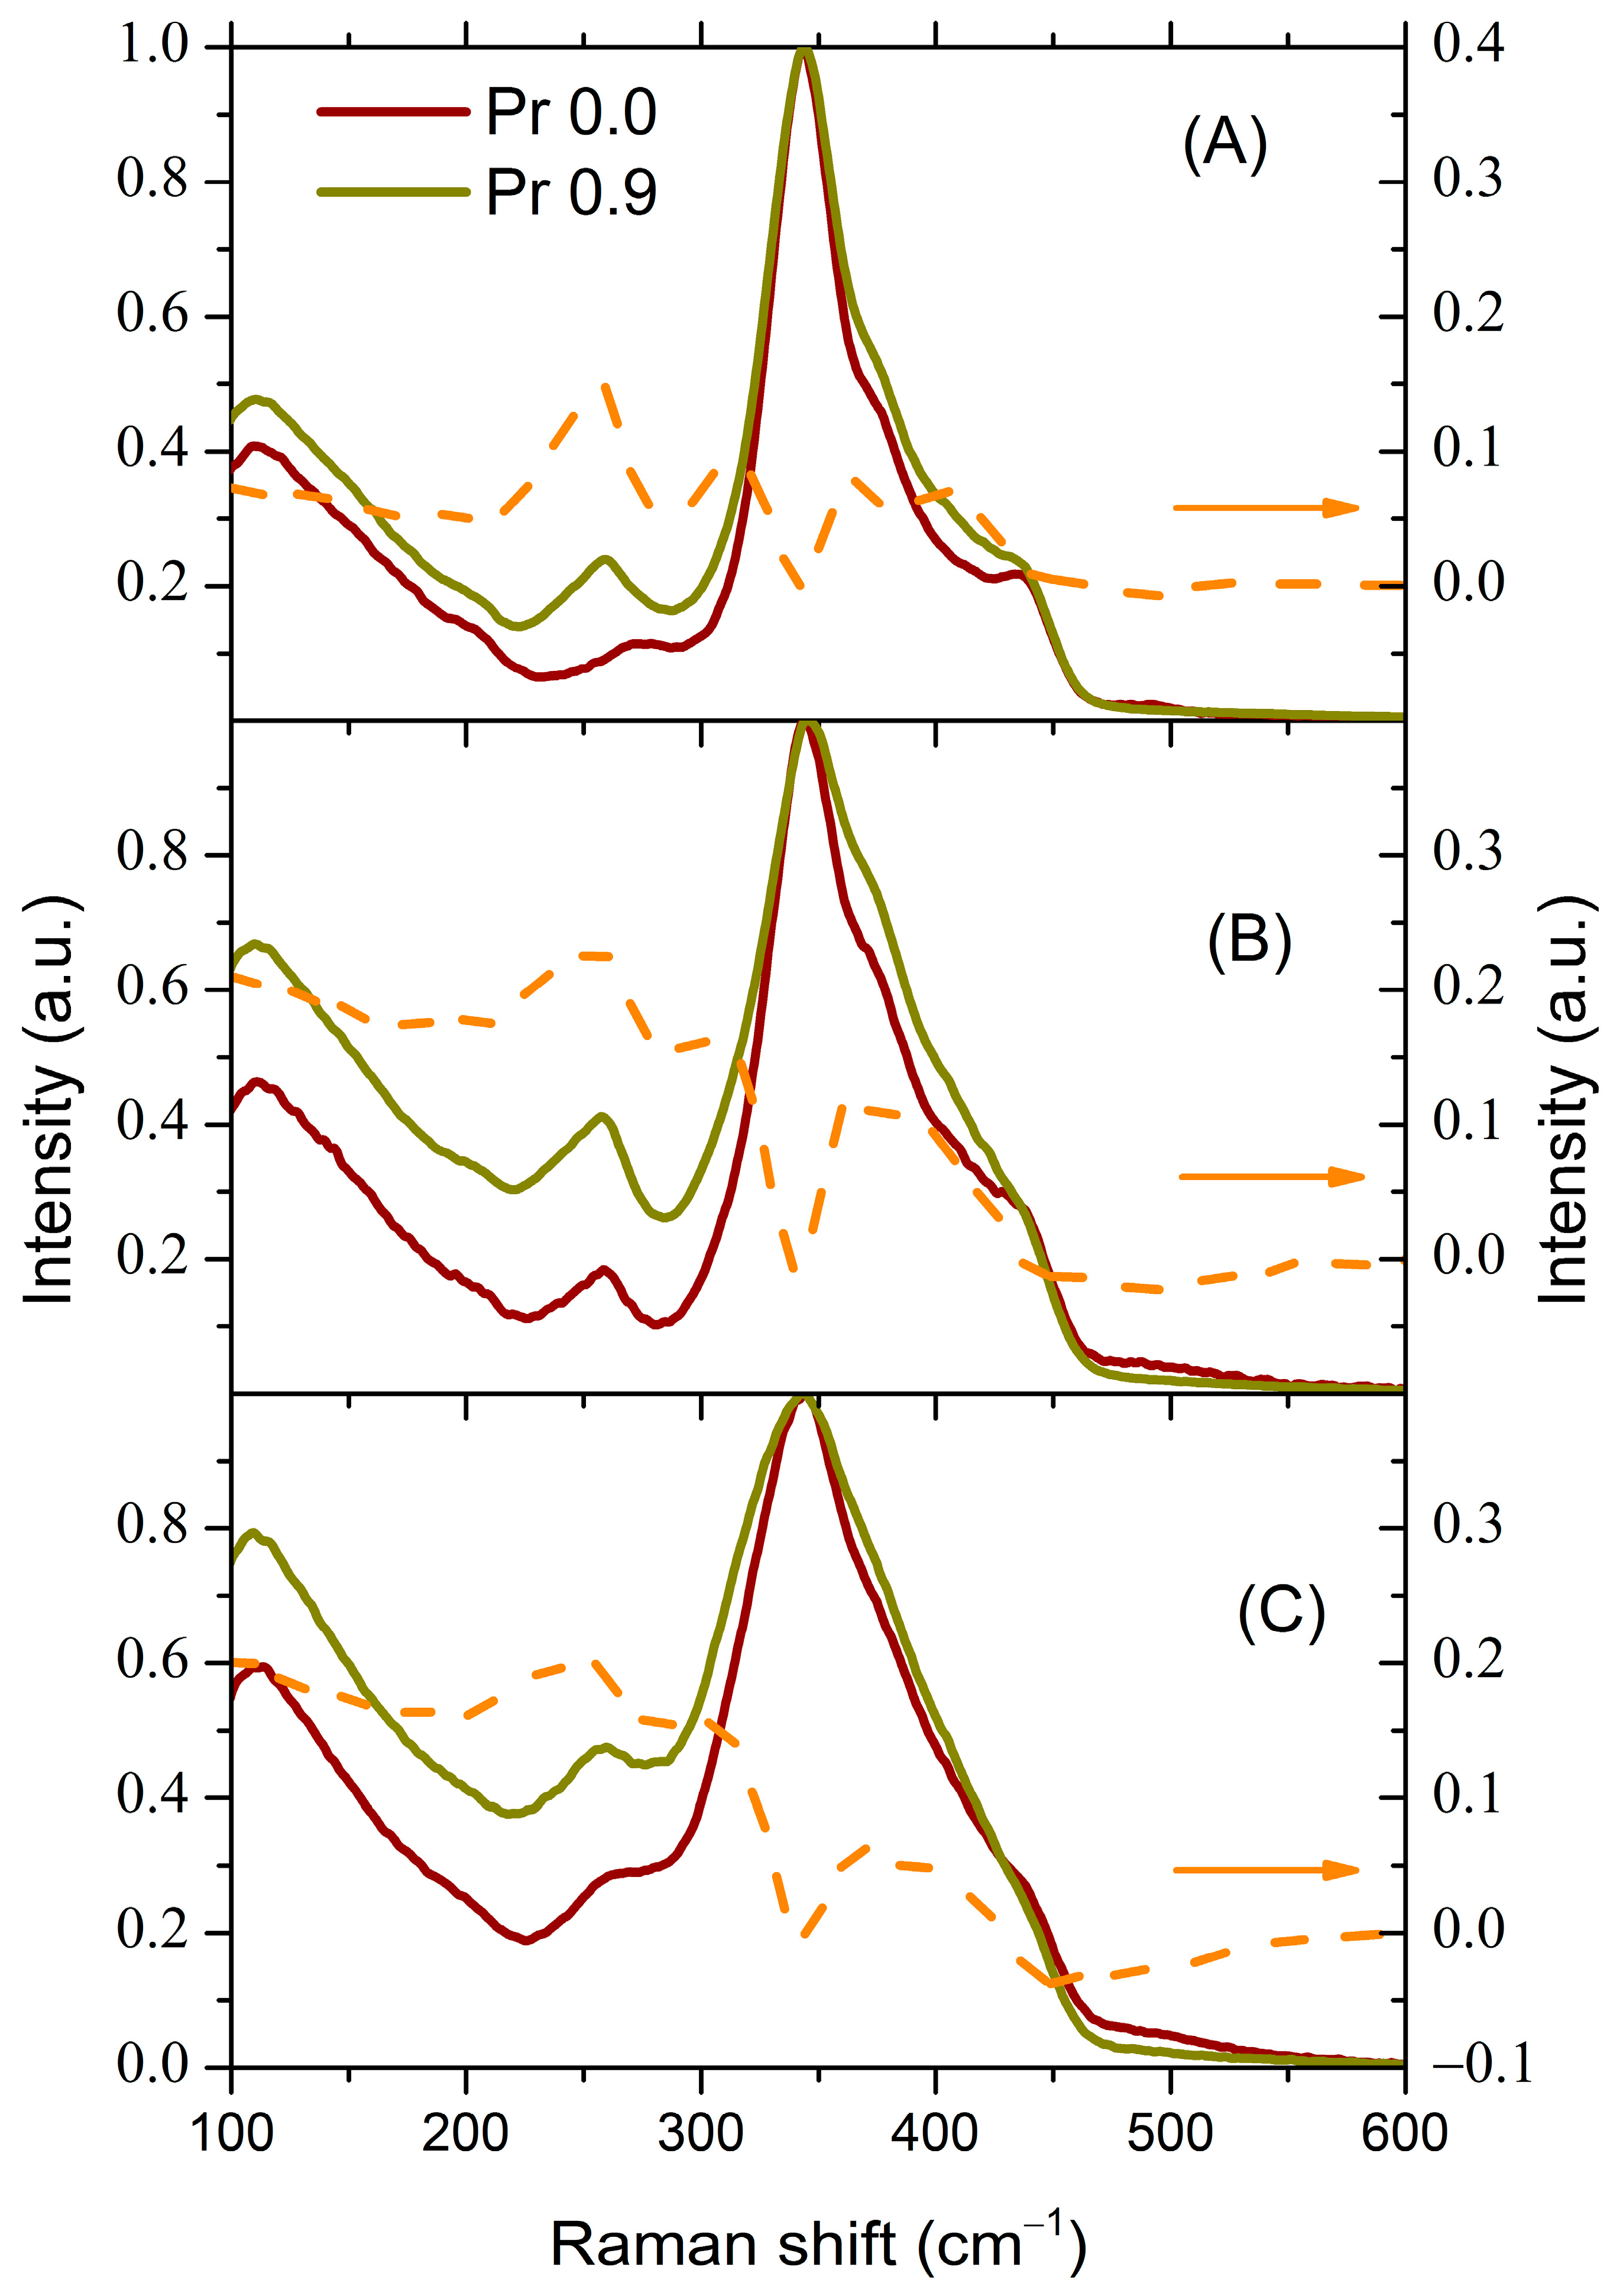
3.2.2. Influence of the Introduction of Pr on the Structure of Glasses according to Raman Spectroscopy Data

Upon introducing Pr into glass of composition 1, the same main changes are observed in the Raman spectrum (Figure 5A) as when La is added (Figure 3A).
Despite the proximity of Pr and La in the lanthanide series, the effect of Pr on the glass structure is much stronger. The impact of introducing less than a percent of Pr is comparable to that of adding 10 mol.% LaS1.5. It can be assumed that Pr coordinates Ga-based structural units around itself much more efficiently.
The introduction of Pr into glasses containing 10 mol.% LaS1.5 (compositions 3 and 5) does not lead to a significant change in the spectral position of the peak due to metal–metal bonds (Figure 5B,C), but only results in a slight increase in its intensity.
The main change is a substantial increase in intensity within the low-frequency region. This increase in intensity is apparently due to the increase in the intensity of the Boson peak, a feature characteristic of the amorphous state [39]. It was suggested in [40] that, upon introducing REIs into glasses, the Boson peak is influenced by the average distance between REIs surrounded by non-bridging anions—in this case, non-bridging sulfur. Note that the introduction of 0.9 at.% Pr in glasses containing 10 mol.% LaS1.5 leads to a significant increase in the scattering intensity in the low-frequency region (Figure 5B,C). This effect is much more pronounced compared with the introduction of La into the original glass (Figure 4A). This may indicate that the positions occupied by La3+ and Pr3+ ions in the glass structure are non-equivalent. The introduction of Pr3+ ions appears to lead to a more substantial formation of non-bridging sulfur.

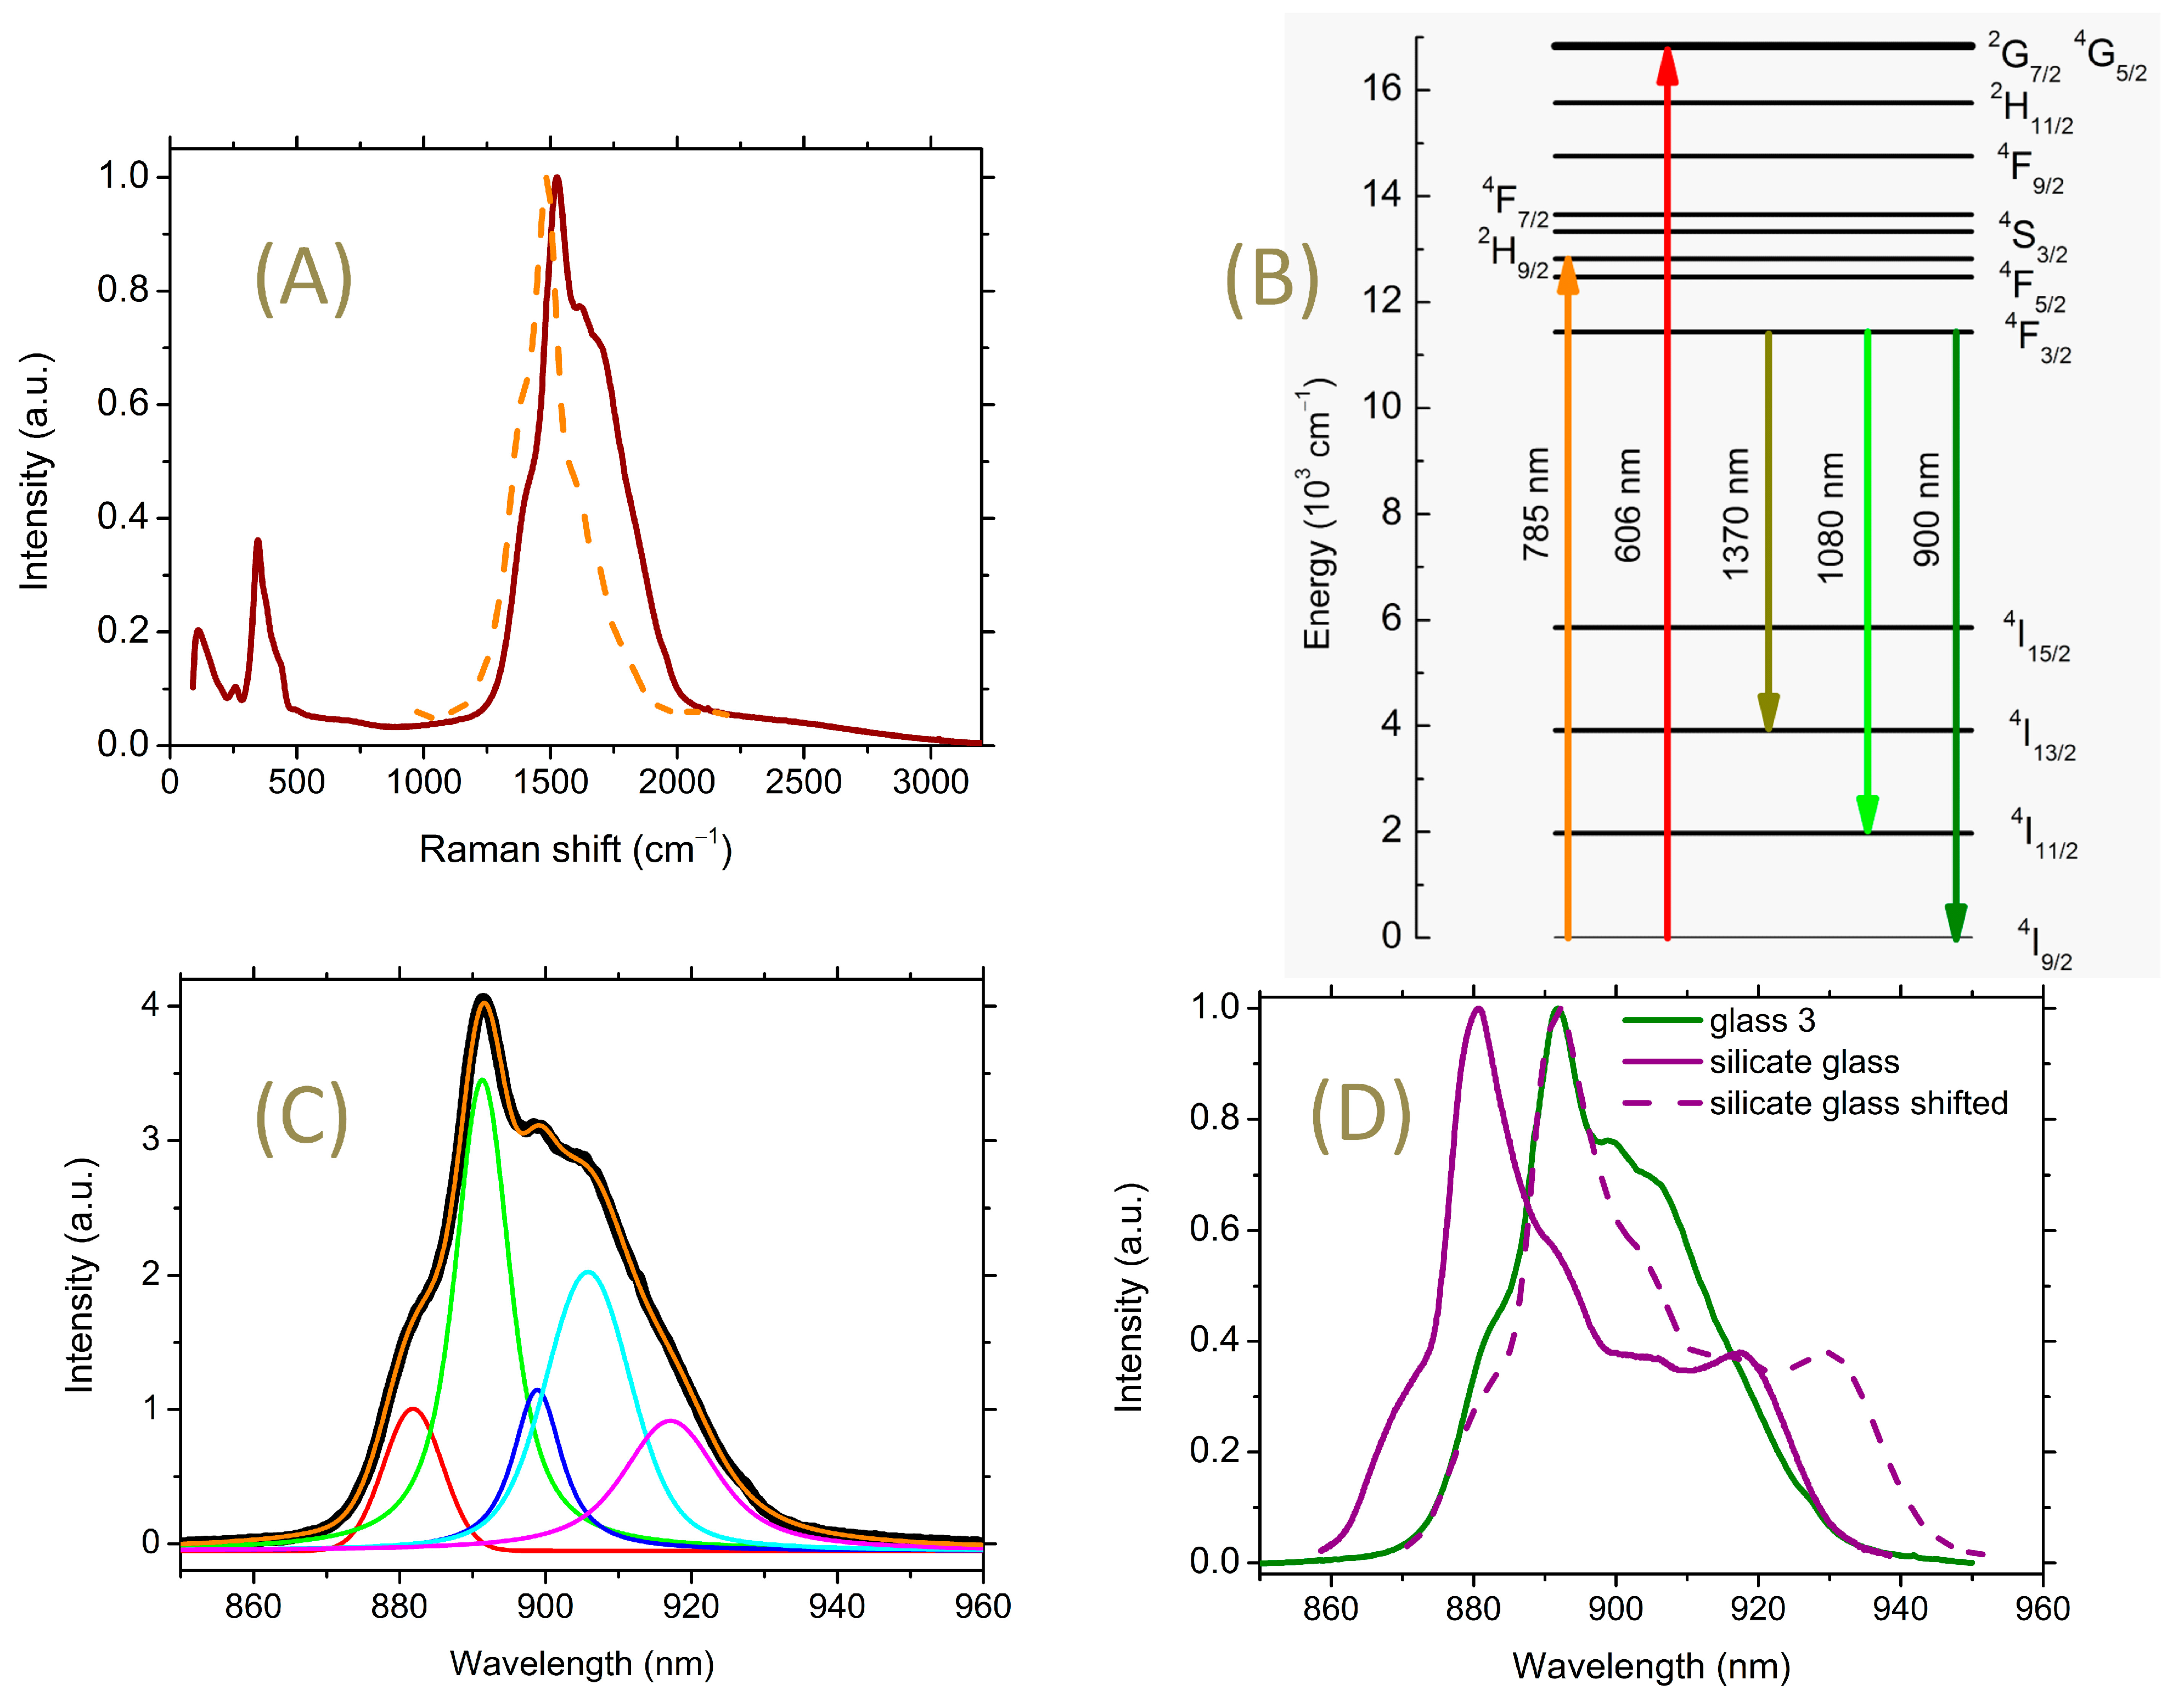
3.2.3. Peculiarities of the Raman Spectra in the High-Frequency Region

When measuring the Raman spectrum of glasses containing La2S3 across a wide spectral range, an exceptionally strong signal is observed in the region from 1250 to 2000 cm−1 in addition to the Raman spectrum itself (Figure 6A). This signal cannot be explained through the Raman effect.
This phenomenon can be explained by the challenge in separating rare earth elements from one another. For instance, chemically pure Pr (PN 263176 Sigma-Aldrich, Saint Louis, MO, USA) contains 4143.8 ppm Nd. Similarly, chemically pure La contains traces of Pr and Nd. Additionally, the use of 785 nm for recording Raman spectra can lead to the excitation of Nd3+ ions to the 2H9/2 level. This is followed by the radiative transition 4F3/2-4I9/2 with a wavelength in the region of 900 nm (Figure 6B), which corresponds to the observed Raman shift of 1627 cm−1 at an excitation wavelength of 785 nm.
Furthermore, if we compare the spectral position and shape of the observed signal and the absorption spectrum of Nd3+ ions in glass (Figure 6A), we see that they are very similar. Hence, it can be argued that the mentioned feature in the Raman spectra is due to the luminescence of impurity Nd3+ ions. Subsequently, these spectra will be referred to as luminescence spectra.
It is noteworthy that these luminescence spectra show Stark splitting. The Coulomb field and the overlap of 4f electrons of the REI shell with the ligand shells result in the splitting of the REI levels in glasses as well as in crystals. In glasses, due to the disordered structure, the transitions between sublevels are usually broadened, which leads to their overlap and smearing. This broadening complicates the isolation of individual transitions between sublevels.
The 4F3/2-4I9/2 transition cannot be attributed to hypersensitive transitions, for which the condition ΔS = 0, ΔL ≤ 2, and ΔJ ≤ 2 must be satisfied [41]. However, in the case under study, nevertheless, a certain fine structure is observed. Considering that the Stark splitting is associated with the features of the REI structural surrounding, this allows for some assumptions about the features of this environment.
Figure 6. (A) The solid brown line is Raman spectrum of glass composition 3; the dashed orange line is absorption spectrum of glass composition 36.7GaS1.5-63.3GeS2 containing 0.1 at.% Nd recalculated for the dependence on Raman shift. (B) Diagram of Nd3+ ion levels. The arrows indicate the pump and observed luminescence wavelengths used in this work. (C) Luminescence spectrum of Nd3+ in glass composition 3 obtained from a part of the Raman spectrum (A) and the result of its approximation by 5 peaks. (D) Solid lines are Nd3+ luminescence spectra corresponding to the 4F3/2-4I9/2 transition in silicate glass [42] and glass of composition 3. The dotted line indicates the spectrum of silicate glass shifted along the abscissa axis by 11 nm to the long-wavelength region of the spectrum.
Materials 16 07094 g006
According to published data, the Nd3+ 4F3/2 level in silicate glasses splits into two sublevels, while the 4I9/2 ground state splits into five sublevels [42,43]. Thus, the 4F3/2-4I9/2 transition could potentially consist of 10 sub-transitions. For the studied glasses, the corresponding luminescence spectrum is well approximated by at least five peaks (Figure 6C). Assuming that the inhomogeneous broadening for all sub-transitions should be approximately the same in magnitude, we should anticipate at least eight transitions.
Figure 6D shows the Nd3+ luminescence spectrum corresponding to this transition in silicate glass [42] and glass of composition 3. The character of the spectra for both glasses is similar in the high-frequency region. This is especially evident when the peak maxima coincide due to the spectral shift of one spectrum relative to the other by 11 nm along the abscissa axis (Figure 6D). The main difference lies in the absence of luminescence for the chalcogenide glass within the spectral range of ~930–940 nm. This range corresponds to sub-transitions with the lowest energy. Apparently, transitions with the lowest energy from the lower 4F3/2 sublevel to the upper 4I9/2 sublevels are less typical for chalcogenide glass. This difference could arise from the features of the environment of the Nd3+ ion in chalcogenide glass as well as potential channels of nonradiative relaxation. For example, the energy of a possible cross-relaxation transition 4I13/2-4F9/2 is approximately around 10,800 cm−1.
The similarity of the luminescence spectra may indicate the closeness of the coordination values of the Nd3+ ion in the silicate and chalcogenide glasses. Various sources suggest that REIs in silicate glasses have coordination numbers ranging from 6 to 8 [43,44,45]. Concerning chalcogenide glasses, a study of the (La2S3)0.07(Ga2S3)0.33(GeS2)0.60 system via X-ray and neutron diffraction led to the assumption that La has a coordination of 8 [46]. However, according to another source, rare earth elements in chalcogenide glasses realize a coordination of 6 [7]. Thus, for chalcogenide glasses we have the same interval of uncertainty of the REI coordination value from 6 to 8, although formally, according to Polling, the coordination of REI in oxide glass should be higher than in sulfide glass (see Supplementary Materials).
Such a large shift in the spectral position of the 4F3/2-4I9/2 Nd3+ luminescent transition in chalcogenide glass compared with silicate (11 nm) is due to the large nephelauxetic effect. This phenomenon means that the increased degree of covalence of the Nd-S bond compared with the Nd-O bond leads to a decrease in the Coulomb interelectron interaction in the 4f shell and thus lowers the energy of the excited levels.
When fractions of a percentage of Pr are introduced into the studied glasses, the luminescence intensity of the impurity Nd3+ ions drops sharply. This can be seen for the glass of composition 5 with the addition of Pr (Figure 7A).
Such a drop can be caused by the hetero-ionic cross-relaxation process 4F3/2-4I9/2 (Nd3+) → 3H6-1D2 (Pr3+). In addition, it seems that Nd3+ and Pr3+ ions form joint regions of their increased concentration.
This effect becomes even more pronounced as the relative content of Ga2S3 decreases in the glass composition. Taking into account that GaS4/2 complex structural units contribute to the dissolution of REIs in the chalcogenide glass matrix, it can be concluded that the introduction of Pr increases the degree of inhomogeneity of the REI distribution.
Furthermore, with the introduction of Pr, there is a barely noticeable trend toward a reduction in the relative intensity of low-energy sub-transitions and an increase in higher-energy sub-transitions (as shown in Figure 7B). This trend may indicate a change in the structural environment of Nd3+ ions, apparently due to the appearance of Pr3+ ions in the second or third coordination spheres. This interpretation aligns with the decrease in the luminescence intensity due to concentration quenching (see Figure 7A).

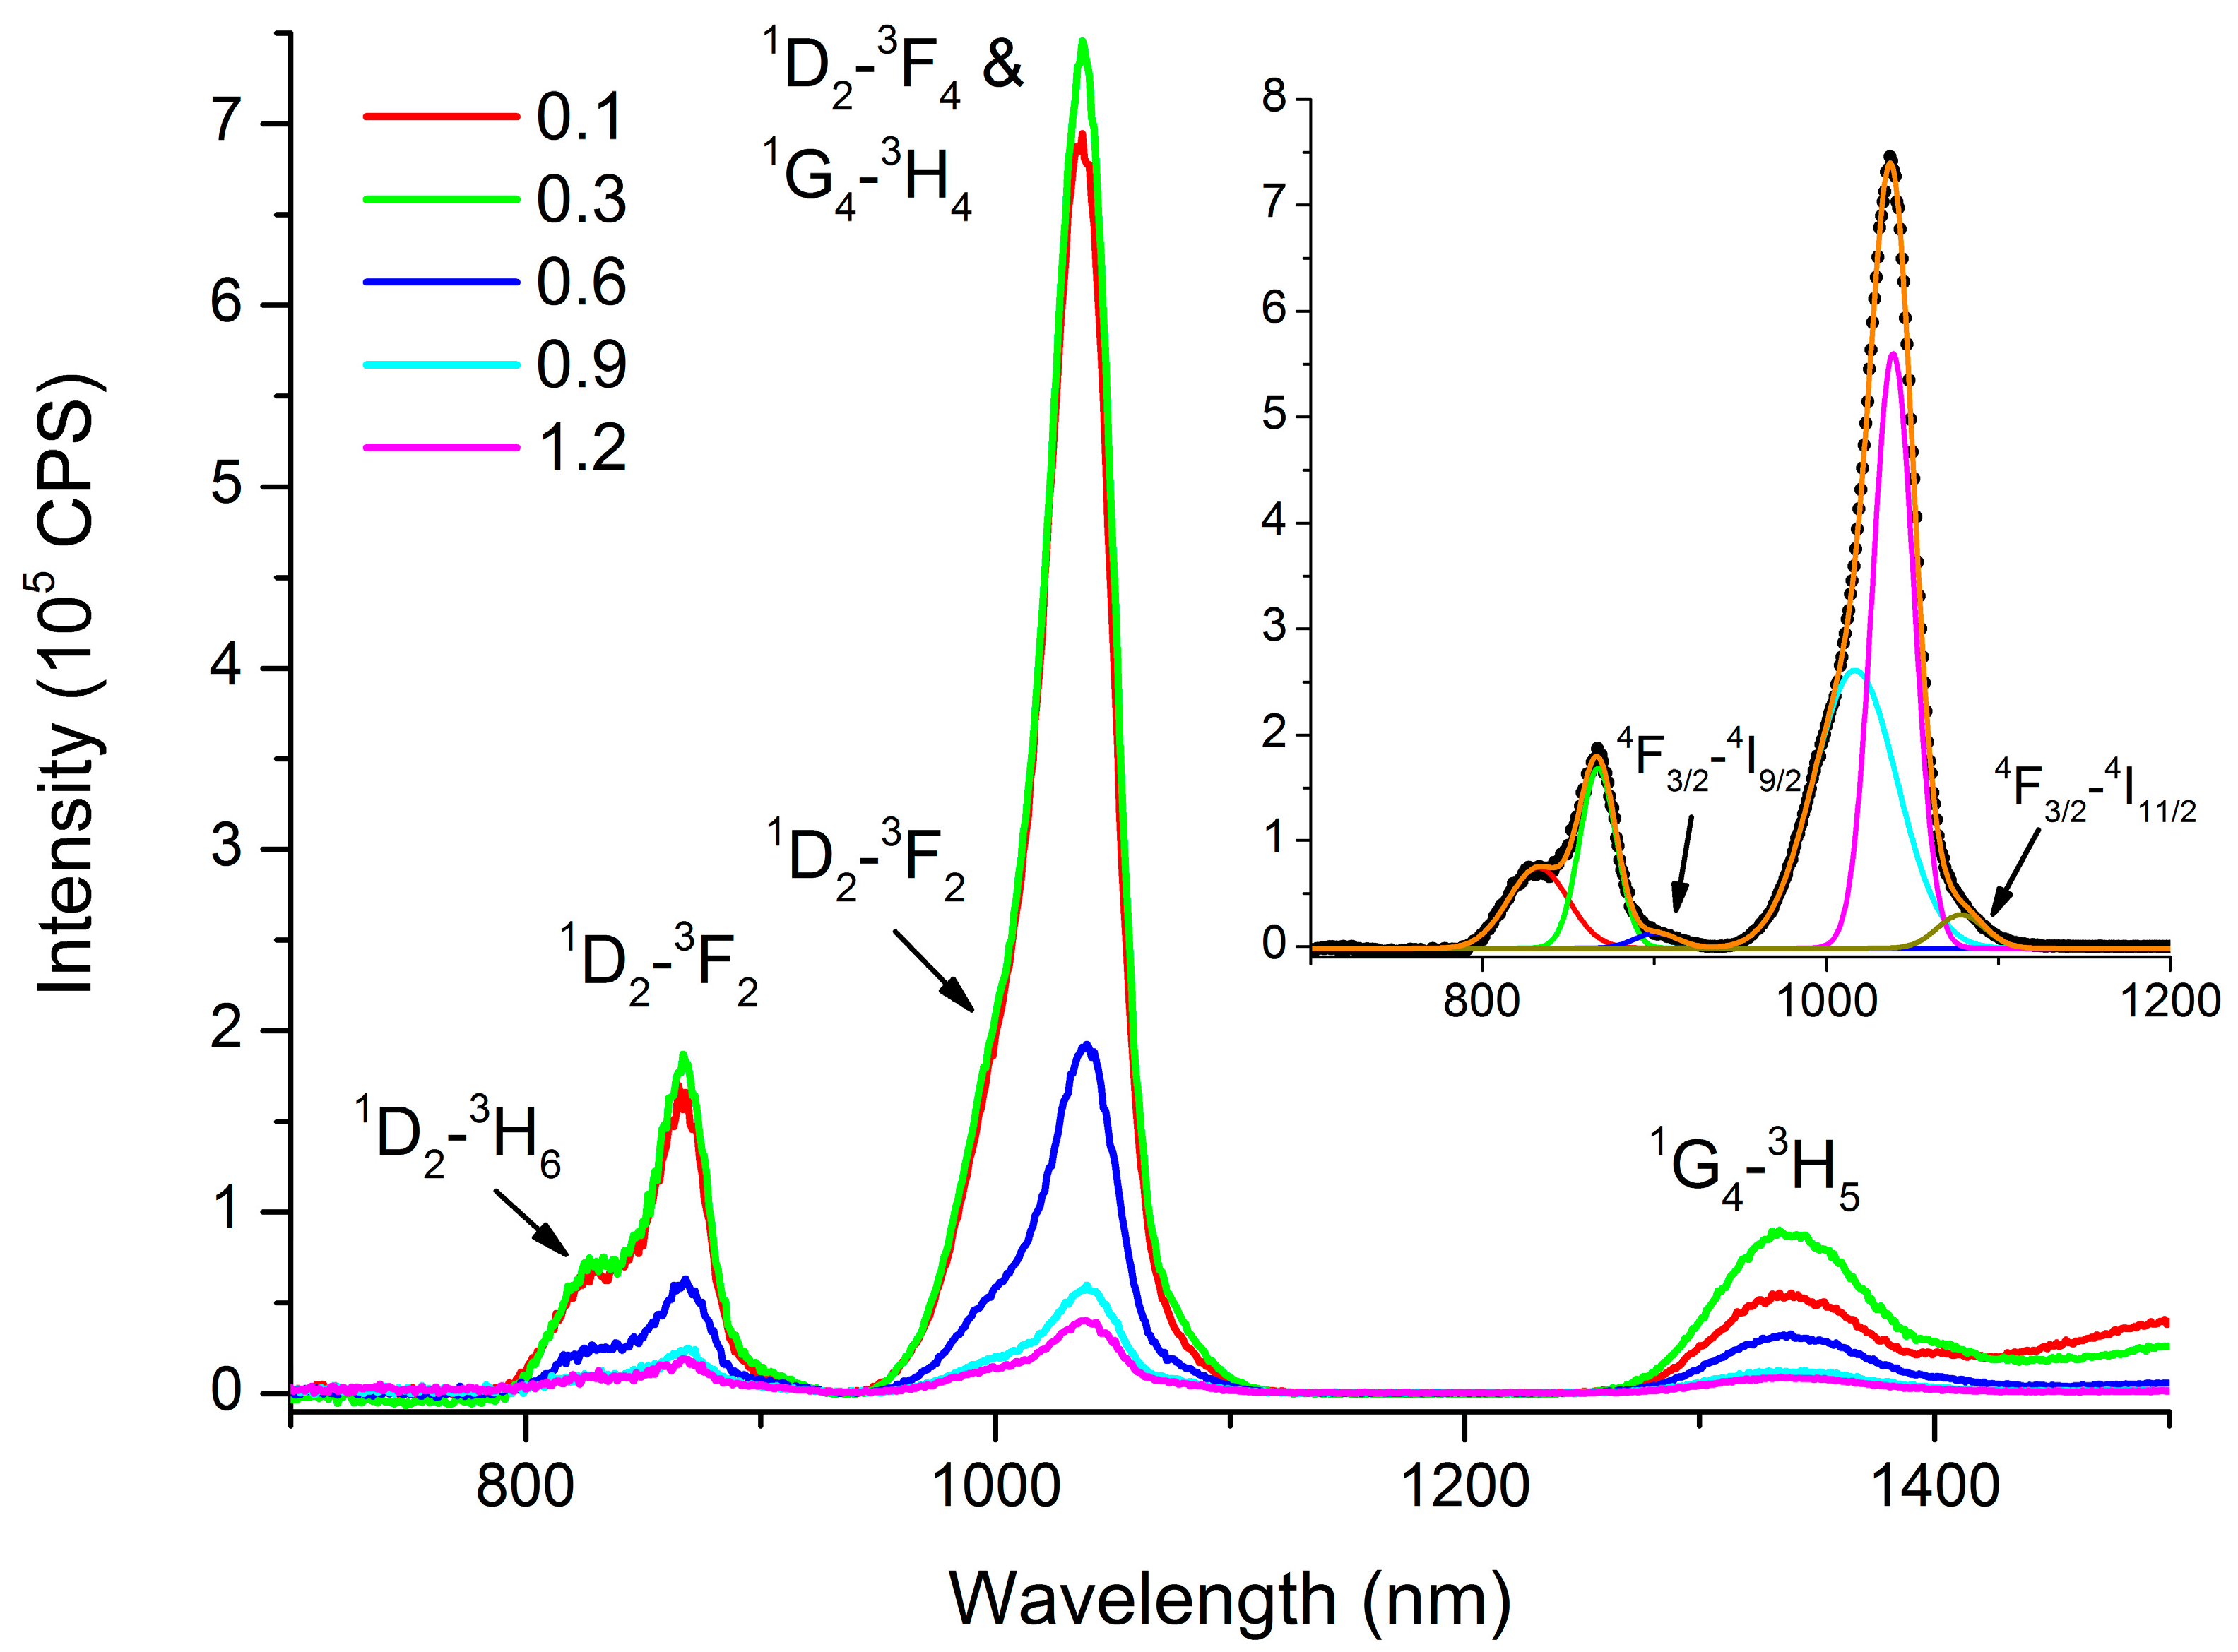
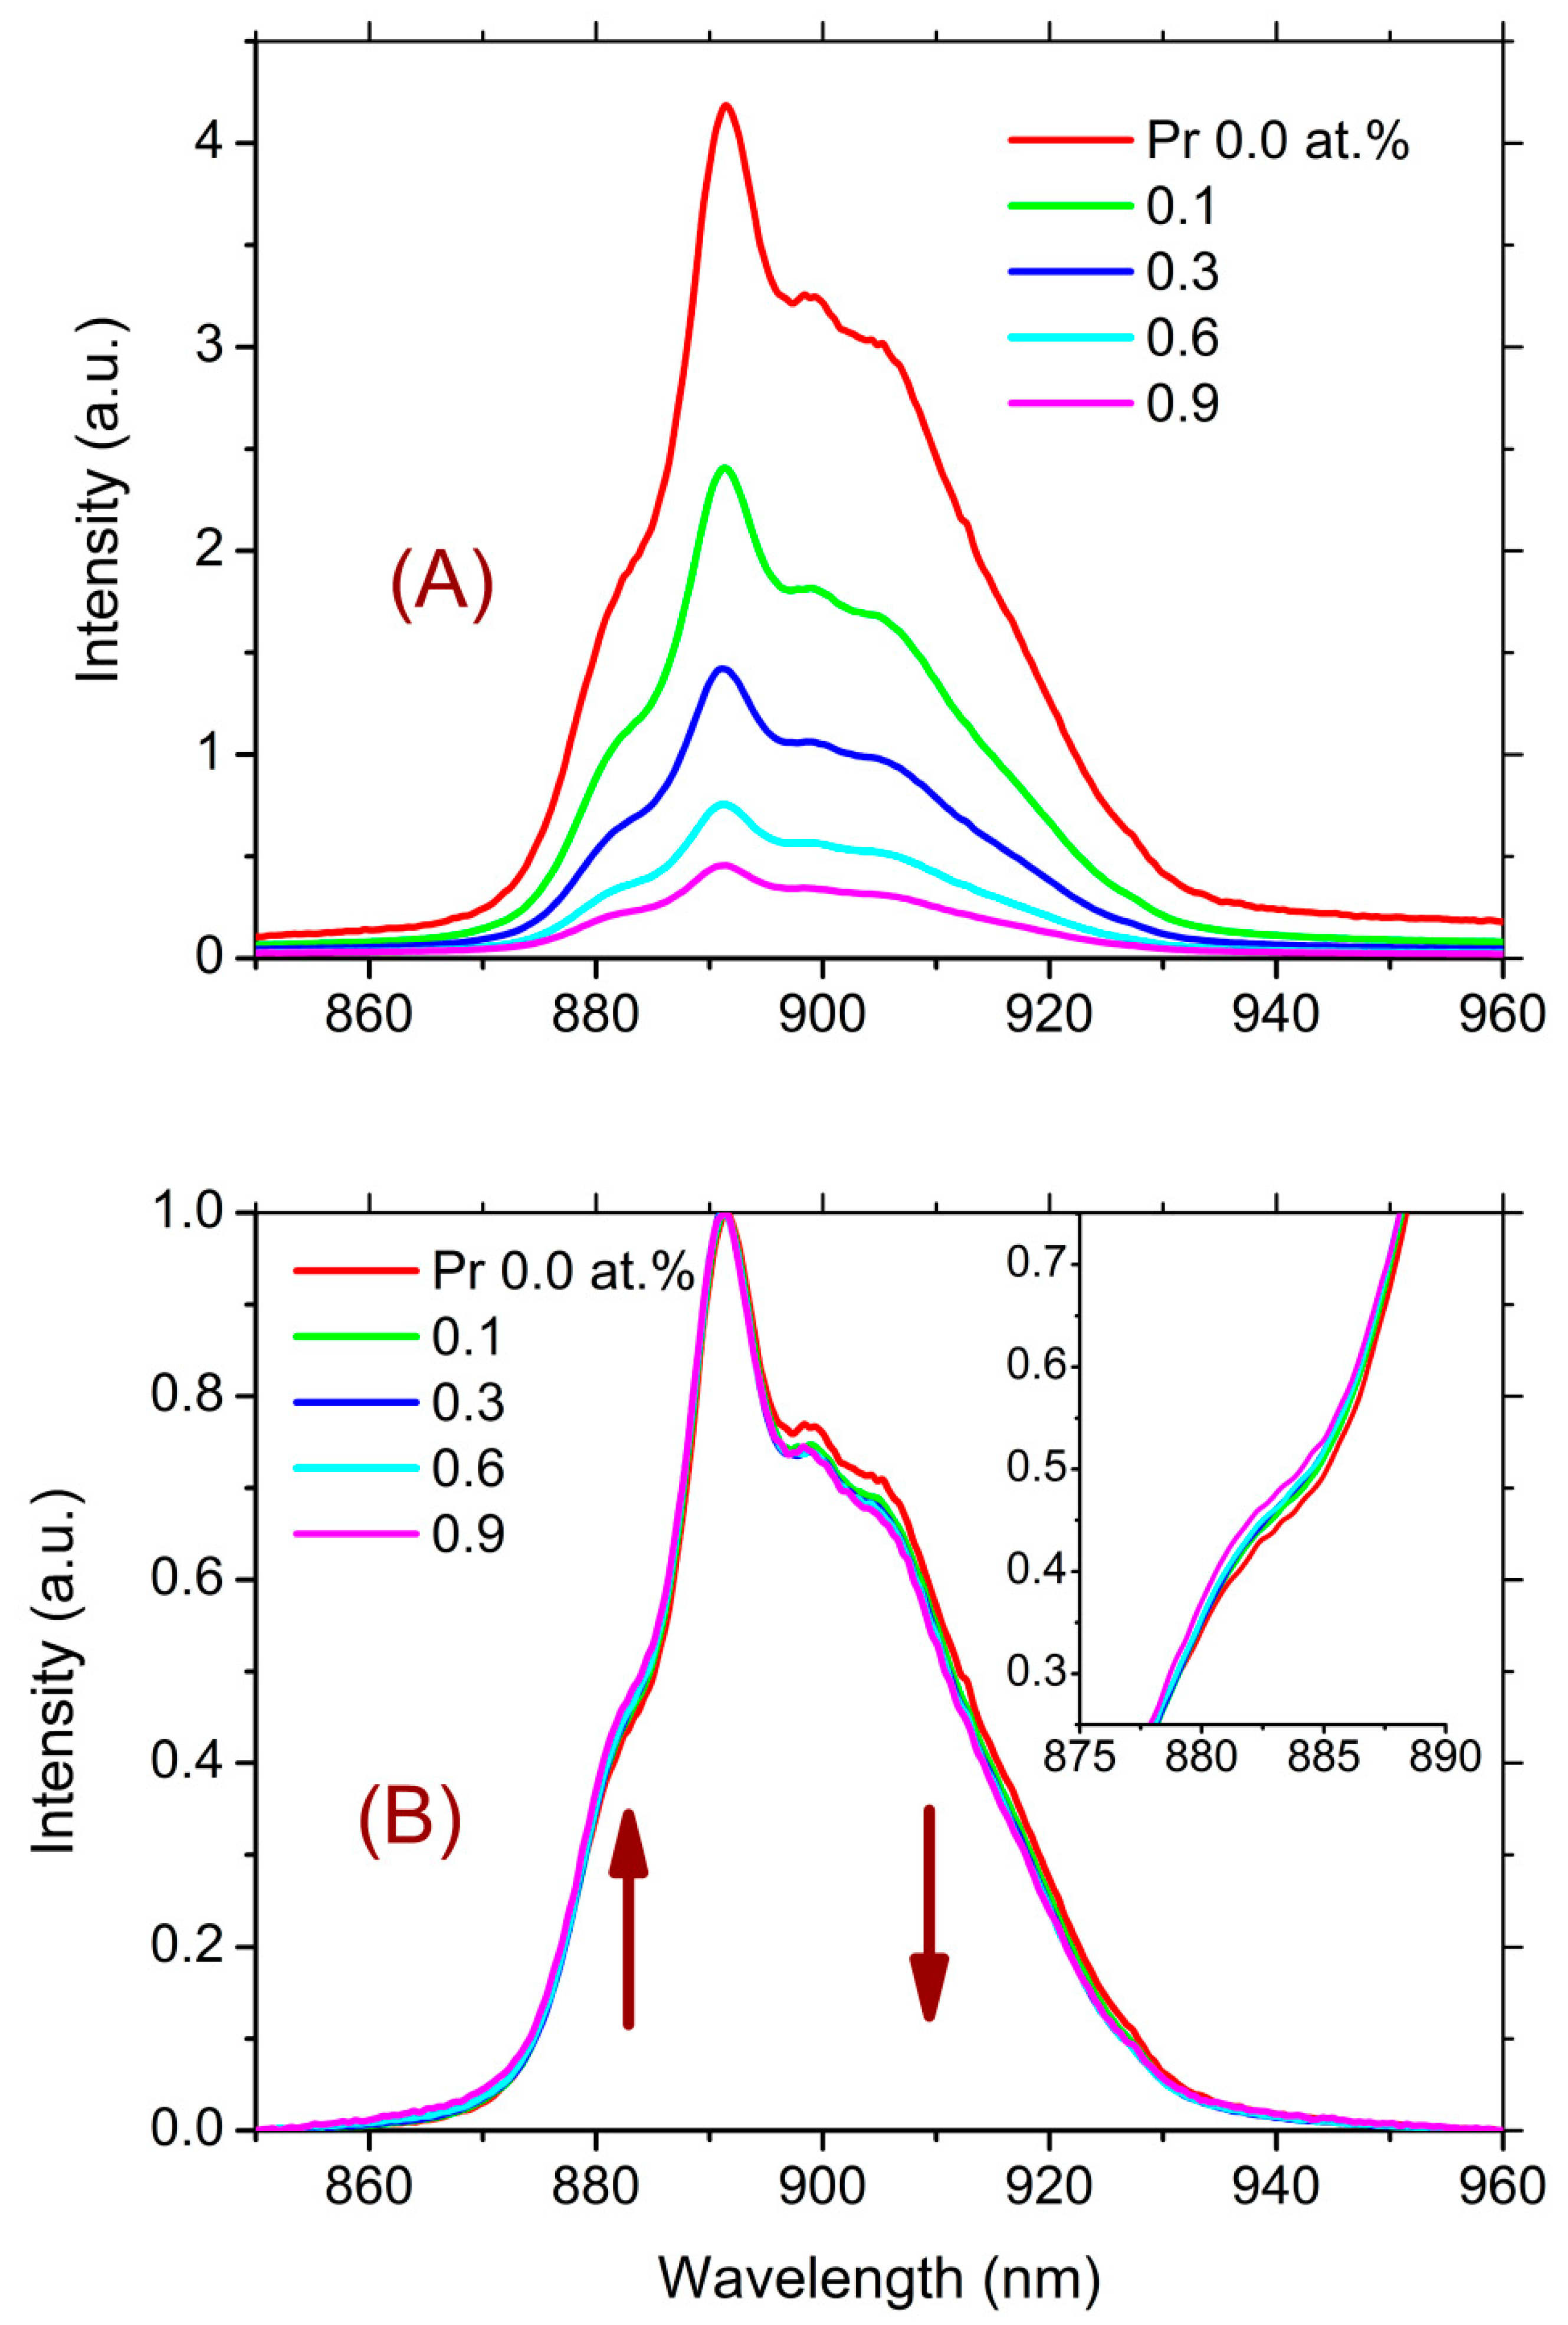
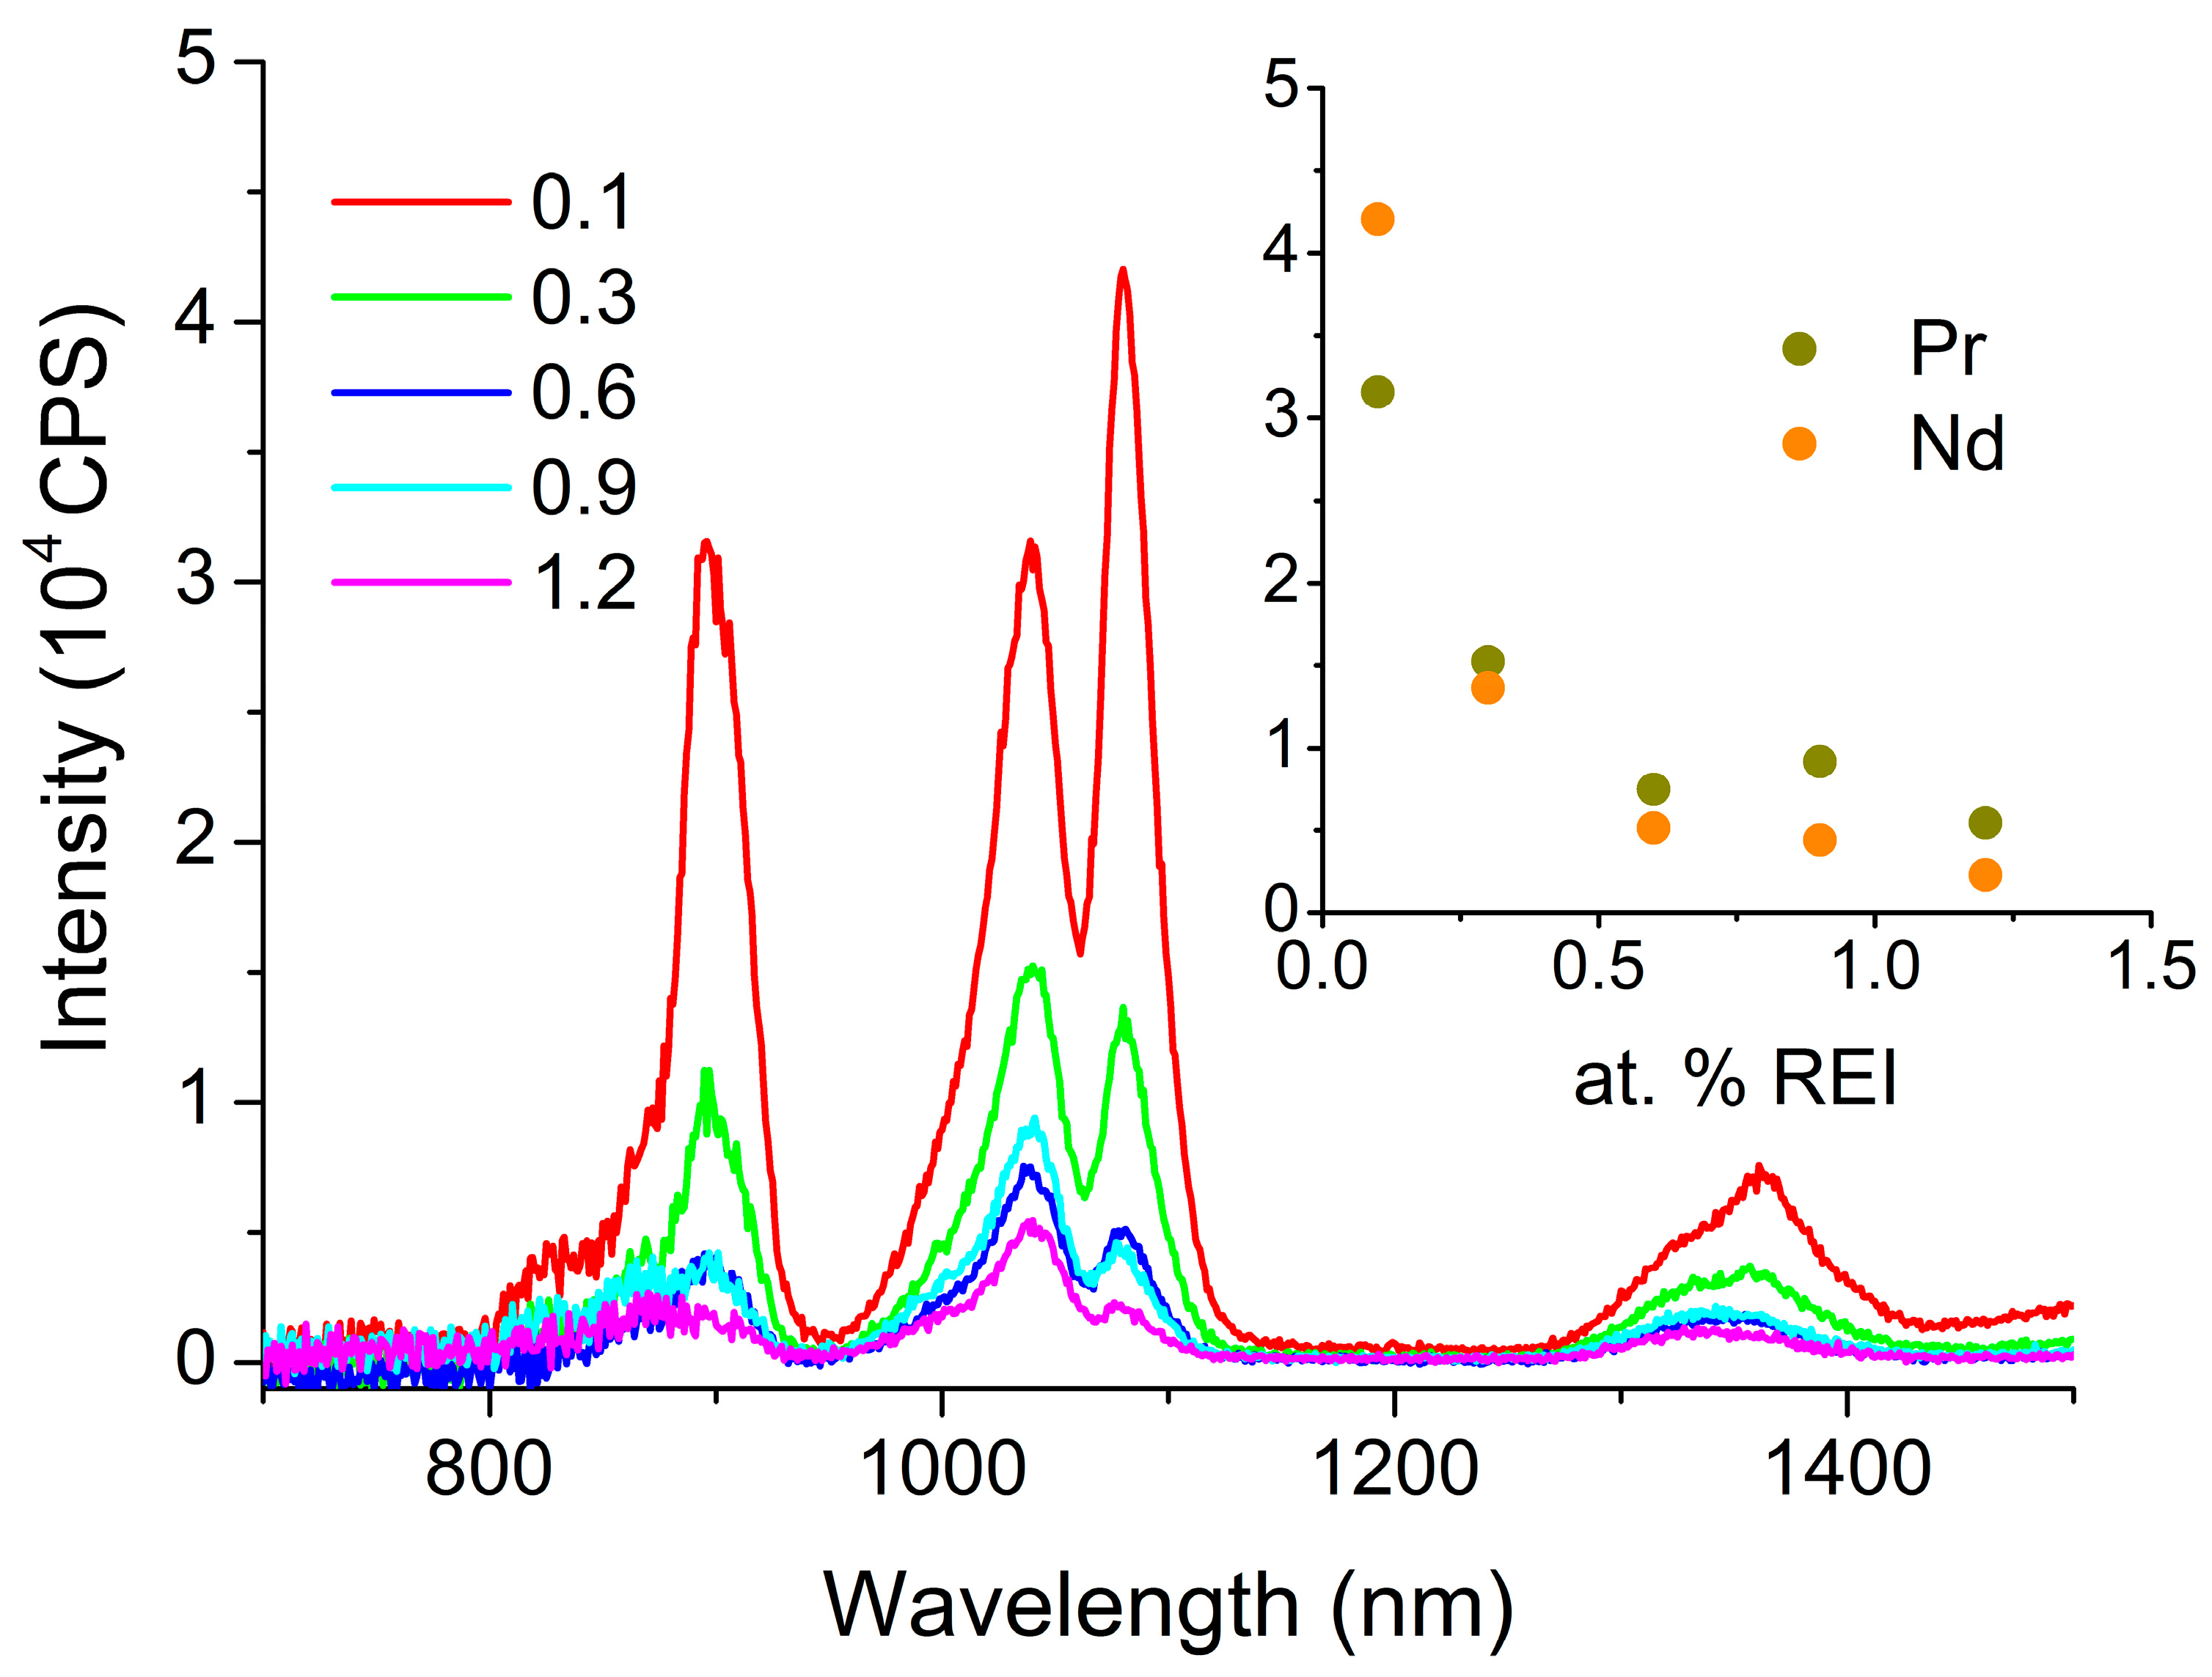
3.3. Luminescent Properties

For glass of composition 1, the maximum luminescence intensity is observed for a composition containing 0.3 at.% Pr under the used excitation and measuring conditions (Figure 8).
As concentrations increase beyond this threshold, luminescence intensity diminishes due to concentration quenching. At Pr concentrations above 0.3 at.%, the interaction between Pr3+ ions interconnected via sulfur becomes more prominent, facilitating energy exchange.
It is noteworthy that, in addition to the luminescence bands of the Pr3+ ions, there are luminescence bands of Nd3+ ions corresponding to the 4F3/2-4I3/2 and 4F3/2-4I9/2 transitions. This can be seen from the result of fitting the luminescence spectrum shown in the inset of Figure 8. First, as indicated in Section 3.2.3, it is challenging to completely separate RE elements from each other. Pure Pr and La contain significant traces of Nd. Second, upon excitation by radiation with a wavelength of 607 nm, both the transition of Pr3+ ions to the excited level 1D2 and the transition of Nd3+ ions to the excited levels 2G7/2 and 4G5/2 occur. This is especially evident when La (10 mol.% LaS1.5) is added to the glass composition, which, as noted above, initially contains an Nd impurity (Figure 9).
From the data presented in Figure 9, three key observations emerge. Firstly, concentration quenching is observed even at the minimum studied concentration, 0.1 at.% Pr. Secondly, at a Pr concentration of 0.1 at.%, the luminescence intensity of Nd3+ ions surpasses that of Pr3+ ions, despite the difference in concentrations. Thirdly, the luminescence intensity of Nd3+ ions decreases with increasing concentrations of Pr3+ ions faster than the luminescence intensity of the Pr3+ ions themselves.
Despite the fact that La and Pr are neighbors in the lanthanide group, the addition of La to the glass composition not only does not reduce the concentration quenching, but even increases it. This may indicate that Pr and Nd do not isomorphically replace La in the glass network. Instead, regions enriched with both Pr and Nd are formed. This leads to energy exchange between the Pr and Nd ions, among other effects.
The significantly higher luminescence intensity of Nd ions compared with Pr ions, despite their disparate concentrations, can be due to two reasons. First, when a Nd ion is excited to the 2G7/2 and 4G5/2 double levels, it rapidly undergoes nonradiative relaxation through a series of closely spaced levels to the 4F3/2 luminescent level. This 4F3/2 level possesses a considerably lower energy than the tails of the glassy matrix band stemming from defect states. Conversely, in the case of Pr, the 1D2 level is separated from the underlying level by a significant energy gap. As a result, ions may relinquish energy to the glass network because this energy level resides at the band’s edge in the region of weak absorption (see Figure 1). Secondly, due to the use of pump radiation with a wavelength of 607 nm, which is at least partially absorbed by the glassy matrix, local heating is induced. Consequently, an elevation in temperature can lead to an increase in luminescence quenching for Pr, while this effect is not observed for Nd [47].
The faster drop in the Nd luminescence intensity compared with that of Pr with increasing Pr concentration (as shown in Figure 9) can apparently be due to the fact that the energy of the 4F3/2 luminescent level of the Nd ion is slightly higher than that of the 1G4 Pr luminescent level. With increasing Pr concentrations, Nd ions can nonradiatively transfer energy to Pr ions, inducing an inversion of their relative luminescence intensities.
An increase in the relative content of Ga at the same content of La (glass composition 5) does not change the nature of the dependences presented in Figure 9 (see Figure S2).

3.4. Parameters of the Judd–Ofelt Theory for Synthesized Glasses

For the Pr3+ ion, the 4fN−15d band is low in energy and close to the 3P2, 3P1, 1I6, and 3P0 levels [48]. It contradicts the assumptions in the Judd–Ofelt theory, according to which the 4fN−15d configuration should be degenerate in energy and have a significant difference in energy from the 4fN configuration [49,50]. To reconcile this discrepancy, numerous alternative approaches have been suggested [51,52,53]. Nevertheless, if we consider levels with energies lower than that of the 3P0 level (even lower than 1D2), the standard method remains adequately accurate for the precise prediction of Judd–Ofelt parameters [54]. Moreover, it is worth noting that all observed and utilized absorption bands stem from electronic transitions [55], rendering the magnetic dipole component negligible.
For the calculation, the measured values of density and refractive index (see Table S1) and data from the optical absorption spectra (spectral position of optical transitions and their corresponding integrated cross-sections of optical absorption) were used. The matrix elements for the calculations were referenced from [22]. The calculation results are shown in Table 2 and Table 3. The resulting branching ratios are presented in Table S2. The root-mean-square deviation (RMS) between the theoretical and experimental values of the line strengths was about 0.23 × 10⁻²⁰ cm2. It indicates a good level of calculation accuracy.
The obtained values of the parameters Ω2, Ω4, and Ω6 are consistent with the reference data for the Ge25Ga5S70 composition (Ω2 = 12.8, Ω4 = 4.3, Ω6 = 7.7) [56].
The value of the parameter Ω2 is related to the degree of covalence of the REI bonds and the symmetry of its environment [55,57,58]. According to the acquired data, the addition of La2S3 to the glasses results in a reduction in covalence (or increased symmetry). Alterations in the Ga2S3 content relative to GeS2, while maintaining a constant La2S3 content, display minimal influence on the Ωi parameters (where I = 2, 4, 6). The highest calculated radiation probability is observed for the 1G4-3H5 transition, corresponding to a wavelength of 1.336 μm (one of the wavelengths of communication lines). Among the studied glass compositions, the highest radiation probability and the lowest radiation lifetime are observed for the composition with the highest content of La2S3 and Ga2S3 (composition 5). The increase in emission probability with increasing La content in the glasses is mainly due to the increase in the refractive index (see Table S1). This observation aligns with the correlation between the Ω46 ratio and stimulated emissivity [58]. In the case of composition 5, the Ω46 ratio attains its maximum value.

4. Conclusions

The incorporation of La2S3 into Ga2S3-GeS2 glasses leads to structural changes, including a reduction in the proportion of Ga-Ga bonds (resulting in an increase in the relative content of GaS4/2 tetrahedra), an increase in three-coordinated sulfur and non-bridging sulfur, and a decrease in the fraction of GeS4/2 tetrahedra linked by edges.
The introduction of Pr into glasses leads to a greater increase in the concentration of non-bridging sulfur compared with the addition of La. This difference suggests that the places occupied by La3+ and Pr3+ ions in the glass structure are not equivalent.
Optical absorption spectroscopy data and Judd–Ofelt theory calculations indicate that the ionicity of the Pr3+ ions’ bonds increases upon the addition of La2S3 to the glasses.
When studying the structure and luminescent properties of La-containing glasses, it is necessary to take into account a significant concentration of traces of RE elements (Pr and Nd). At low Pr concentrations (≤0.1 at.%), the luminescence intensity of impurity Nd3+ ions upon excitation at a wavelength of 607 nm is even higher than that of the added Pr3+ ions despite the difference in concentrations. This phenomenon is a result of the energy level distribution of REIs and the spectral position of the fundamental absorption edge of glass. However, when fractions of a percent of Pr are introduced into the studied glasses, the luminescence intensity of impurity Nd3+ ions drops sharply. This effect can be caused by the hetero-ionic cross-relaxation process 4F3/2-4I9/2 (Nd3+) → 3H6-1D2 (Pr3+). In addition, the Nd3+ and Pr3+ ions apparently form joint regions of their increased concentration in the glass.
Despite the fact that La2S3 with Ga2S3 and GeS2 forms a large region of glass formation, La2S3 does not contribute to a decrease in the concentration quenching of the luminescence of the Pr3+ ions in these glasses. At the same time, if concentration quenching is not taken into account, then, according to Judd–Ofelt theory calculations, among the studied glass compositions, the highest radiation probability and the shortest radiative lifetime are observed for the composition with the highest content of La2S3 and Ga2S3.
Without taking into account concentration quenching, calculations according to the Judd–Ofelt theory show that among the studied glass compositions, the highest radiation probability and the shortest radiation lifetime are observed for the composition with the highest content of La2S3 and Ga2S3.
Thus, when developing luminescent materials based on chalcogenide glasses containing La, the following points must be taken into account. Despite the widely cited opinion that the presence of La in glasses promotes the dissolution of other RE elements in them, our findings suggest otherwise. La does not reduce the heterogeneity of the distribution of RE elements in the glass matrix and therefore does not increase the threshold for concentration quenching of luminescence. However, its presence in the glass enhances luminescence intensity. Additionally, the introduction of significant amounts of La introduces traces of Pr and Nd, the presence of which must be taken into account when studying and interpreting luminescent properties.

Supplementary Materials

The following supporting information can be downloaded at: https://www.mdpi.com/article/10.3390/ma16227094/s1.

Author Contributions

Conceptualization, A.T.; methodology, A.T.; validation, A.T.; formal analysis, A.T.; investigation, A.T. and E.S.; resources, A.T.; data curation, A.T.; writing—original draft preparation, A.T.; writing—review and editing, A.T.; visualization, A.T.; supervision, A.T.; project administration, A.T.; funding acquisition, A.T. All authors have read and agreed to the published version of the manuscript.

Funding

This work was supported by the Russian Science Foundation under grant No. 22-23-00074, https://rscf.ru/en/project/22-23-00074/, accessed on 29 January 2021.

Institutional Review Board Statement

Not applicable.

Informed Consent Statement

Not applicable.

Data Availability Statement

Data are contained within the article.

Acknowledgments

The part measurements were carried out in the resource centers of St. Petersburg State University: “Centre for Optical and Laser Materials Research”, “Centre for X-ray Diffraction Studies”, and “Chemical Analysis Materials Research Centre”.

Conflicts of Interest

The authors declare no conflict of interest.

References

  1. Guo, H.; Cui, J.; Xu, C.; Xu, Y.; Farrell, G. Mid-Infrared Spectral Properties of Rare Earth Ion Doped Chalcogenide Glasses and Fibers. In Mid-Infrared Fluoride and Chalcogenide Glasses and Fibers. Progress in Optical Science and Photonics; Springer: Singapore, 2022; Volume 18. [Google Scholar] [CrossRef]
  2. Jahromi, K.E.; Pan, Q.; Høgstedt, L.; Friis, S.M.M.; Khodabakhsh, A.; Moselund, P.M.; Harren, F.J.M. Mid-infrared supercontinuum-based upconversion detection for trace gas sensing. Opt. Express 2019, 27, 24469–24480. [Google Scholar] [CrossRef] [PubMed]
  3. Bensaid, S.; Kachenoura, A.; Costet, N.; Bensalah, K.; Tariel, H.; Senhadji, L. Noninvasive detection of bladder cancer using mid-infrared spectra classification. Expert Syst. Appl. 2017, 89, 333–342. [Google Scholar] [CrossRef]
  4. Lucas, P.; Coleman, G.J.; Jiang, S.B.; Luo, T.; Yang, Z.Y. Chalcogenide glass fibers: Optical window tailoring and suitability for bio-chemical sensing. Opt. Mater. 2015, 47, 530–536. [Google Scholar] [CrossRef]
  5. Kumta, P.N.; Risbud, S.H. Rare-earth chalcogenides—An emerging class of optical materials. J. Mater. Sci. 1994, 29, 1135–1158. [Google Scholar] [CrossRef]
  6. Shaw, L.B.; Cole, B.; Thielen, P.A.; Sanghera, J.S.; Aggarwal, I.D. Mid-wave IR and long-wave IR laser potential of rare-earth doped chalcogenide glass fiber. IEEE J. Quant. Electron. 2001, 48, 1127–1137. [Google Scholar] [CrossRef]
  7. Tver’yanovich, Y.S.; Tverjanovich, A. Rare-earth doped chalcogenide glasses. In Semiconducting Chalcogenide Glass; Fairman, R., Ushkov, B., Eds.; Elsevier Science: Amsterdam, The Netherlands, 2004; pp. 169–207. [Google Scholar]
  8. Tverjanovich, A.; Tveryanovich, Y.S.; Loheider, S. Raman spectra of gallium sulfide based glasses. J. Non-Cryst. Solids 1996, 208, 49–55. [Google Scholar] [CrossRef]
  9. Heo, J.; Yoon, J.M.; Ryou, S.Y. Raman Spectroscopic Analysis on the Solubility Mechanism of La3+ in GeS2-Ga2S3 Glasses. J. Non-Cryst. Solids 1998, 238, 115–123. [Google Scholar] [CrossRef]
  10. Li, L.; Jiao, Q.; Lin, C.; Dai, S.; Nie, Q. Structural characterization and compositional dependence of the optical properties of Ge-Ga-La-S chalcohalide glass system. Opt. Mater. 2018, 78, 295–301. [Google Scholar] [CrossRef]
  11. Higuchi, H.; Kanno, R.; Kawamoto, Y.; Takahashi, M.; Kadono, K. Physicochemical properties and structure of Ga2S3–GeS2–La2S3–Ln2S3 glasses (Ln=yttrium or lanthanoids). Phys. Chem. Glasses 1999, 40, 49–53. [Google Scholar]
  12. Wang, J.; Brocklesby, W.S.; Lincoln, J.R.; Townsend, J.E.; Payne, D.N. Local structures of rare-earth ions in glasses: The ‘crystal-chemistry’ approach. J. Non-Cryst. Solids 1993, 163, 261–267. [Google Scholar] [CrossRef]
  13. Yang, A.; Sun, M.; Ren, H.; Lin, H.; Feng, X.; Yang, Z. Dy3+-doped Ga2S3-Sb2S3-La2S3 chalcogenide glass for mid-infrared fiber laser medium. J. Lumin. 2021, 237, 118169. [Google Scholar] [CrossRef]
  14. Kityk, I.V.; Halyan, V.V.; Yukhymchuk, V.O.; Strelchuk, V.V.; Ivashchenko, I.A.; Zhydachevskyy, Y.; Suchocki, A.; Olekseyuk, I.D.; Kevshyn, A.H.; Piasecki, M. NIR and visible luminescence features of erbium doped Ga2S3-La2S3 glasses. J. Non-Cryst. Solids 2018, 498, 380–385. [Google Scholar] [CrossRef]
  15. Lima, S.M.; Sampaio, J.A.; Catunda, T.; de Camargo, A.S.S.; Nunes, L.A.O.; Baesso, M.L.; Hewak, D.W. Spectroscopy, thermal and optical properties of Nd3+-doped chalcogenide glasses. J. Non-Cryst. Solids 2001, 284, 274–281. [Google Scholar] [CrossRef]
  16. Churbanov, M.F.; Denker, B.I.; Galagan, B.I.; Koltashev, V.V.; Plotnichenko, V.G.; Sverchkov, S.E.; Sukhanov, M.V.; Velmuzhov, A.P. Peculiarities of 1.6-7.5 µm Pr3+ luminescence in Ge36Ga5Se59 glass. Opt. Mater. Express 2019, 9, 4154–4164. [Google Scholar] [CrossRef]
  17. Shi, L.; Sordillo, L.A.; Rodriguez-Contreras, A.; Alfano, R. Transmission in near-infrared optical windows for deep brain imaging. J. Biophotonics 2016, 9, 38–43. [Google Scholar] [CrossRef]
  18. Sordillo, D.C.; Sordillo, L.A.; Sordillo, P.P.; Alfano, R.R. Fourth Near-Infrared Optical Window for Assessment of Bone and other Tissues. SPIE 2016, 9689, 499–506. [Google Scholar] [CrossRef]
  19. Li, M.; Xu, Y.; Jia, X.; Yang, L.; Long, N.; Liu, Z.; Dai, S. Mid-infrared emission properties of Pr3+-doped Ge–Sb–Se–Ga–I chalcogenide glasses. Opt. Mater. Express 2018, 8, 992–1000. [Google Scholar] [CrossRef]
  20. Nazabal, V.; Adam, J.-L. Infrared luminescence of chalcogenide glasses doped with rare earth ions and their potential applications. Opt. Mater. X 2022, 15, 100168. [Google Scholar] [CrossRef]
  21. Walsh, B.M. Judd-Ofelt Theory: Principles and Practices. In Advances in Spectroscopy for Lasers and Sensing; Di Bartolo, B., Forte, O., Eds.; Springer: Dordrecht, The Netherlands, 2006; pp. 403–433. [Google Scholar] [CrossRef]
  22. Weber, M.J. Spontaneous emission probabilities and quantum efficiencies for excited states of Pr3+ in LaF3. J. Chem. Phys. 1968, 48, 4774–4780. [Google Scholar]
  23. Bagde, G.D.; Londhe, C.T.; Bagde, A.G. Morphological Studies on Spray Deposited Lanthanum Sulphide (La2S3) Thin Films. Key Eng. Mater. 2016, 705, 283–288. [Google Scholar] [CrossRef]
  24. Ho, C.-H.; Chen, H.-H. Optically decomposed near-band edge structure and excitonic transitions in Ga2S3. Sci. Rep. 2014, 4, 6143. [Google Scholar] [CrossRef] [PubMed]
  25. Kokh, K.A.; Huang, Z.-M.; Huang, J.-G.; Gao, Y.-Q.; Uralbekov, B.; Panomarev, J.; Lapin, I.N.; Svetlichnyi, V.A.; Lanskii, G.V.; Andreev, Y.M. Study of Ga2S3 crystals grown from melt and PbCl2 flux. Mater. Res. Bull. 2016, 84, 462–467. [Google Scholar] [CrossRef]
  26. Caraman, I.; Evtodiev, S.; Untila, D.; Palachi, L.; Susu, O.; Evtodiev, I.; Kantser, V. Optical and photoelectric properties of planar structures obtained by thermal annealing of Ga2S3 plates in Zn vapors. Phys. Status Solidi A 2017, 214, 1700808. [Google Scholar] [CrossRef]
  27. Bletskan, D.I.; Kabatsiy, V.N.; Frolova, V.V. Peculiarities of the Absorption Edge and Photoconductivity Spectra of (GeS2)x(Bi2S3)1-x Glasses. Chalcogenide Lett. 2007, 4, 119–126. [Google Scholar]
  28. Onari, S.; Taniyama, M.; Kiyomoto, S.; Makino, T.; Matsuishi, K. Optical Properties of the Amorphous Semiconductor (GeS2)1-x(Bi2S3)x System under High Pressure. Phys. Status Solidi B 1999, 211, 263–267. [Google Scholar] [CrossRef]
  29. Lucovsky, G.; Galeener, F.L.; Keezer, R.C.; Geils, R.H.; Six, H.A. Structural interpretation of the infrared and Raman spectra of glasses in the alloy system Ge1−xSx. Phys. Rev. B 1974, 10, 5134–5146. [Google Scholar] [CrossRef]
  30. Holomb, R.; Johansson, P.; Mitsa, V.; Rosola, I. Local structure of technologically modified g-GeS2: Resonant Raman and absorption edge spectroscopy combined with ab initio calculations. Philos. Mag. 2005, 85, 2947–2960. [Google Scholar] [CrossRef]
  31. Masselin, P.; Le Coq, D.; Cuisset, A.; Bychkov, E. Spatially resolved Raman analysis of laser induced refractive index variation in chalcogenide glass. Opt. Mater. Express 2012, 2, 1768–1775. [Google Scholar] [CrossRef]
  32. Jackson, K.; Briley, A.; Grossman, S.; Porezag, D.V.; Pederson, M.R. Raman-active modes of a-GeSe2 and a-GeS2: A first-principles study. Phys. Rev. B 1999, 60, R14985–R14989. [Google Scholar] [CrossRef]
  33. Lucovsky, G.; Nemanich, R.J.; Galeener, F.L. Amorphous and Liquid Semiconductors: Proceedings of the 7th International Conference on Amorphous and Liquid Semiconductors, Edinburgh, Scotland, 1977; Spear, W.E., Stevenson, G.G., Eds.; University of Edinburgh: Edinburgh, Scotland, 1977; pp. 130–134. [Google Scholar]
  34. Tverjanovich, A.; Tveryanovich, Y.S.; Shahbazova, C. Structure and Luminescent Properties of Glasses in the GeS2–Ga2S3–Sb2S3:Pr3+ System. Materials 2023, 16, 4672. [Google Scholar] [CrossRef]
  35. Ishibashi, T.; Takebe, H.; Morinaga, K. Glass forming region and structure of vitreous RS-Ga2S3 (R = Ca, Sr, Ba). J. Ceram. Soc. Jpn. 2003, 111, 308–311. [Google Scholar] [CrossRef]
  36. Julien, C.; Barnier, S.; Massot, M.; Chbani, N.; Cai, X.; Loireau-Lozac’h, A.M.; Guittard, M. Raman and infrared spectroscopic studies of Ge-Ga-Ag- sulphide glasses. Mater. Sci. Eng. B 1994, 22, 191–200. [Google Scholar] [CrossRef]
  37. Koudelka, L.; Pisárčik, M.; Baidakova, O.L. The effect of MnS- and MnCl2-doping on the structure of GeS2-Ga2S3 glasses. J. Mater. Sci. Lett. 1989, 8, 1161–1162. [Google Scholar] [CrossRef]
  38. Lucazeau, G.; Barnier, S.; Loireau-Lozac’h, A.M. Vibrational spectra, electronic transitions and short order structure of rare earth-gallium sulphide glasses. Spec. Acta Part A 1978, 34, 21–27. [Google Scholar] [CrossRef]
  39. Viras, F.; King, T.A. The universality of low frequency Raman scattering from amorphous solids. J. Non-Cryst. Solids 1990, 119, 65–74. [Google Scholar] [CrossRef]
  40. Tikhomirov, V.K.; Jha, A.; Perakis, A.; Sarantopoulou, E.; Naftaly, M.; Krasteva, V.; Li, R.; Seddon, A.B. An interpretation of the Boson peak in rare-earth ion doped glasses. J. Non-Cryst. Solids 1999, 256, 89–94. [Google Scholar] [CrossRef]
  41. Judd, B.R. Ionic transitions hypersensitive to environment. J. Chem. Phys. 1979, 70, 4830–4833. [Google Scholar] [CrossRef]
  42. Mann, M.M.; DeShazer, L.G. Energy Levels and Spectral Broadening of Neodymium Ions in Laser Glass. J. Appl. Phys. 1970, 41, 2951. [Google Scholar] [CrossRef]
  43. Robinson, C.C. Evidence of Sixfold Coordination of Nd3+ in Barium Rubidium Silicate Glass. J. Chem. Phys. 1971, 54, 3572. [Google Scholar] [CrossRef]
  44. Ponader, C.W.; Brown, G.E., Jr. Rare earth elements in silicate glass melt systems: I. Effects of composition on the coordination environments of La, Gd, and Yb. Geochim. Cosmochim. Acta 1989, 53, 2893–2903. [Google Scholar] [CrossRef]
  45. Quintas, A.; Majérus, O.; Lenoir, M.; Caurant, D.; Klementiev, K.; Webb, A. Effect of alkali and alkaline-earth cations on the neodymium environment in a rare-earth rich aluminoborosilicate glass. J. Non-Cryst. Solids 2008, 354, 98–104. [Google Scholar] [CrossRef]
  46. Drewitt, J.W.E.; Salmon, P.S.; Zeidler, A.; Benmore, C.J.; Hannon, A.C. Structure of rare-earth chalcogenide glasses by neutron and x-ray diffraction. J. Phys. Condens. Matter. 2017, 29, 225703. [Google Scholar] [CrossRef] [PubMed]
  47. Quimby, R.S.; Aitken, B.G. Anomalous temperature quenching of fluorescence in Pr3+ doped sulfide glass. J. Appl. Phys. 1997, 82, 3992–3996. [Google Scholar] [CrossRef]
  48. Sattayaporn, S.; Loiseau, P.; Aka, G.; Klimin, S.; Boldyrev, K.; Mavrin, B. Fine spectroscopy and Judd-Ofelt analysis of Pr3+ doped Sr0.7La0.3Mg0.3Al11.7O19 (Pr:ASL). J. Lumin. 2020, 219, 116895. [Google Scholar] [CrossRef]
  49. Judd, B.R. Optical absorption intensities of rare-earth ions. Phys. Rev. 1962, 127, 750–761. [Google Scholar] [CrossRef]
  50. Ofelt, G.S. Intensities of crystal spectra of rare-earth ions. J. Chem. Phys. 1962, 37, 511–520. [Google Scholar] [CrossRef]
  51. Quimby, R.S.; Miniscalco, W.J. Modified Judd-Ofelt technique and application to optical transitions in Pr3+-doped glass. J. Appl. Phys. 1994, 75, 613–615. [Google Scholar] [CrossRef]
  52. Goldner, P.; Auzel, F. Application of standard and modified Judd-Ofelt theories to a praseodymium-doped fluorozirconate glass. J. Appl. Phys. 1996, 79, 7972–7977. [Google Scholar] [CrossRef]
  53. Dunina, E.; Kornienko, A.; Fomicheva, L. Modified theory of f-f transition intensities and crystal field for systems with anomalously strong configuration interaction. Cent. Eur. J. Phys. 2008, 6, 407–414. [Google Scholar] [CrossRef]
  54. Olivier, M.; Doualan, J.-L.; Nazabal, V.; Camy, P.; Adam, J.-L. Spectroscopic study and Judd–Ofelt analysis of Pr3+-doped Zr-Ba-La-Al glasses in visible spectral range. J. Opt. Soc. Am. B 2013, 30, 2032–2042. [Google Scholar] [CrossRef]
  55. Zhang, F.; Bi, Z.; Huang, A.; Xiao, Z. Luminescence and Judd–Ofelt analysis of the Pr3+ doped fluorotellurite glass. J. Lumin. 2015, 160, 85–89. [Google Scholar] [CrossRef]
  56. Wei, K.; Machewirth, D.P.; Wenzel, J.; Snitzer, E.; Sigel, G.H., Jr. Pr3+-doped Ge-Ga-S glasses for 1.3 optical fiber amplifiers. J. Non-Cryst. Solids 1995, 182, 257–261. [Google Scholar] [CrossRef]
  57. Hehlen, M.P.; Brik, M.G.; Kramer, K.W. 50th anniversary of the Judd–Ofelt theory: An experimentalist’s view of the formalism and its application. J. Lumin. 2013, 136, 221–239. [Google Scholar] [CrossRef]
  58. Bhatia, B.; Parihar, V.; Singh, S.; Verma, A.S. Spectroscopic Properties of Pr3+ in Lithium Bismuth Borate Glasses. Am. J. Condens. Matter Phys. 2013, 3, 80–88. [Google Scholar]
Figure 1. (A) Absorption spectra of glass composition 1 with Pr content from 0.1 to 1.2 at.%. (B) Absorption spectra of glasses of the studied compositions containing 0.3 at.% Pr. (C) Absorption spectra of glasses of compositions 1 and 3 containing 1.2 at.% Pr in the IR range.
Materials 16 07094 g001
Figure 2. Spectral position of the absorption band of the Pr3+ ion due to the transition 3H4-3F3, depending on the composition of the glass.
Materials 16 07094 g002
Figure 3. (A) Raman spectra of glasses of composition 1 and 3. (B) The difference between the normalized Raman spectra of glasses of composition 3 and 1.
Materials 16 07094 g003
Figure 4. (A) The normalized Raman spectra of glasses of compositions 4 and 5. (B) The difference between the normalized Raman spectra of glasses of compositions 5 and 4.
Materials 16 07094 g004
Figure 5. Raman spectra of glasses containing 0.9 at.% Pr. (A) Glass of composition 1; (B) glass of composition 3; (C) glass of composition 5. The dashed orange curve shows the corresponding differences in the Raman spectra of these glasses: the Raman spectrum of the glass containing 0.9 at.% Pr minus the spectrum of the original glass.
Materials 16 07094 g005
Figure 7. (A) Luminescence spectra of Nd3+ impurity ions in glass of composition 5 with different Pr content. (B) Luminescence spectra of Nd3+ impurity ions in glass of composition 5 at different Pr contents normalized to the peak intensity in the region of 891 nm. The arrows indicate the direction of intensity change with increasing Pr content. The inset shows the region of the spectrum on an enlarged scale.
Materials 16 07094 g007
Figure 8. Luminescence spectrum of glass of composition 1 containing 0.1, 0.3, 0.6, 0.9, and 1.2 at.% Pr. The inset shows the result of spectrum fitting for the glass containing 0.3 at.% Pr. Dots are the experimental data.
Materials 16 07094 g008
Figure 9. Luminescence spectrum of glass of composition 3 containing 0.1, 0.3, 0.6, 0.9, and 1.2 at.% Pr. The inset shows the dependence of the peak intensity at 1040 nm (Pr3+) and 1080 nm (Nd3+) on the added Pr concentration.
Materials 16 07094 g009
Table 1. Compositions of the synthesized glassy matrixes.
No
Composition
GaS1.5
(mol.%)
GeS2
(mol.%)
LaS1.5
(mol.%)
125.0075.000.00
224.2572.753.00
322.5067.5010.00
447.0053.000.00
542.3047.7010.00
Table 2. Judd–Ofelt parameters for glasses of compositions 1–5 with Pr3+ ions.
No
Composition
Ω2
(10−20 cm2)
Ω4
(10−20 cm2)
Ω6
(10−20 cm2)
Radiative Lifetime from 1G4, ms
114.285.197.230.411
310.686.286.430.366
510.536.106.000.334
Table 3. Calculated transition probabilities in the studied glasses. Numbers 1–5 indicate the number of composition.
TransitionTransition Probabilities, s−1
135
1G4-3F488.9101.1108.5
1G4-3F313.815.416.6
1G4-3F210.514.315.8
1G4-3H6798.7855.4960.5
1G4-3H51356.01554.11685.4
1G4-3H4166.0193.8209.8
Disclaimer/Publisher’s Note: The statements, opinions and data contained in all publications are solely those of the individual author(s) and contributor(s) and not of MDPI and/or the editor(s). MDPI and/or the editor(s) disclaim responsibility for any injury to people or property resulting from any ideas, methods, instructions or products referred to in the content.

