
Assessment of the Specimen Size Effect on the Fracture Energy of Macro-Synthetic-Fiber-Reinforced Concrete


Abstract
1. Introduction
- The experimental model of variations in concrete fracture energy considers thickness, width, and macro-synthetic fiber content.
- The effect of specimen size on the fracture energy of concrete specimens is explained.
- The effect of fibers on the stress intensity factor of concrete specimens with three different thicknesses and widths is described.
2. Materials and Methods
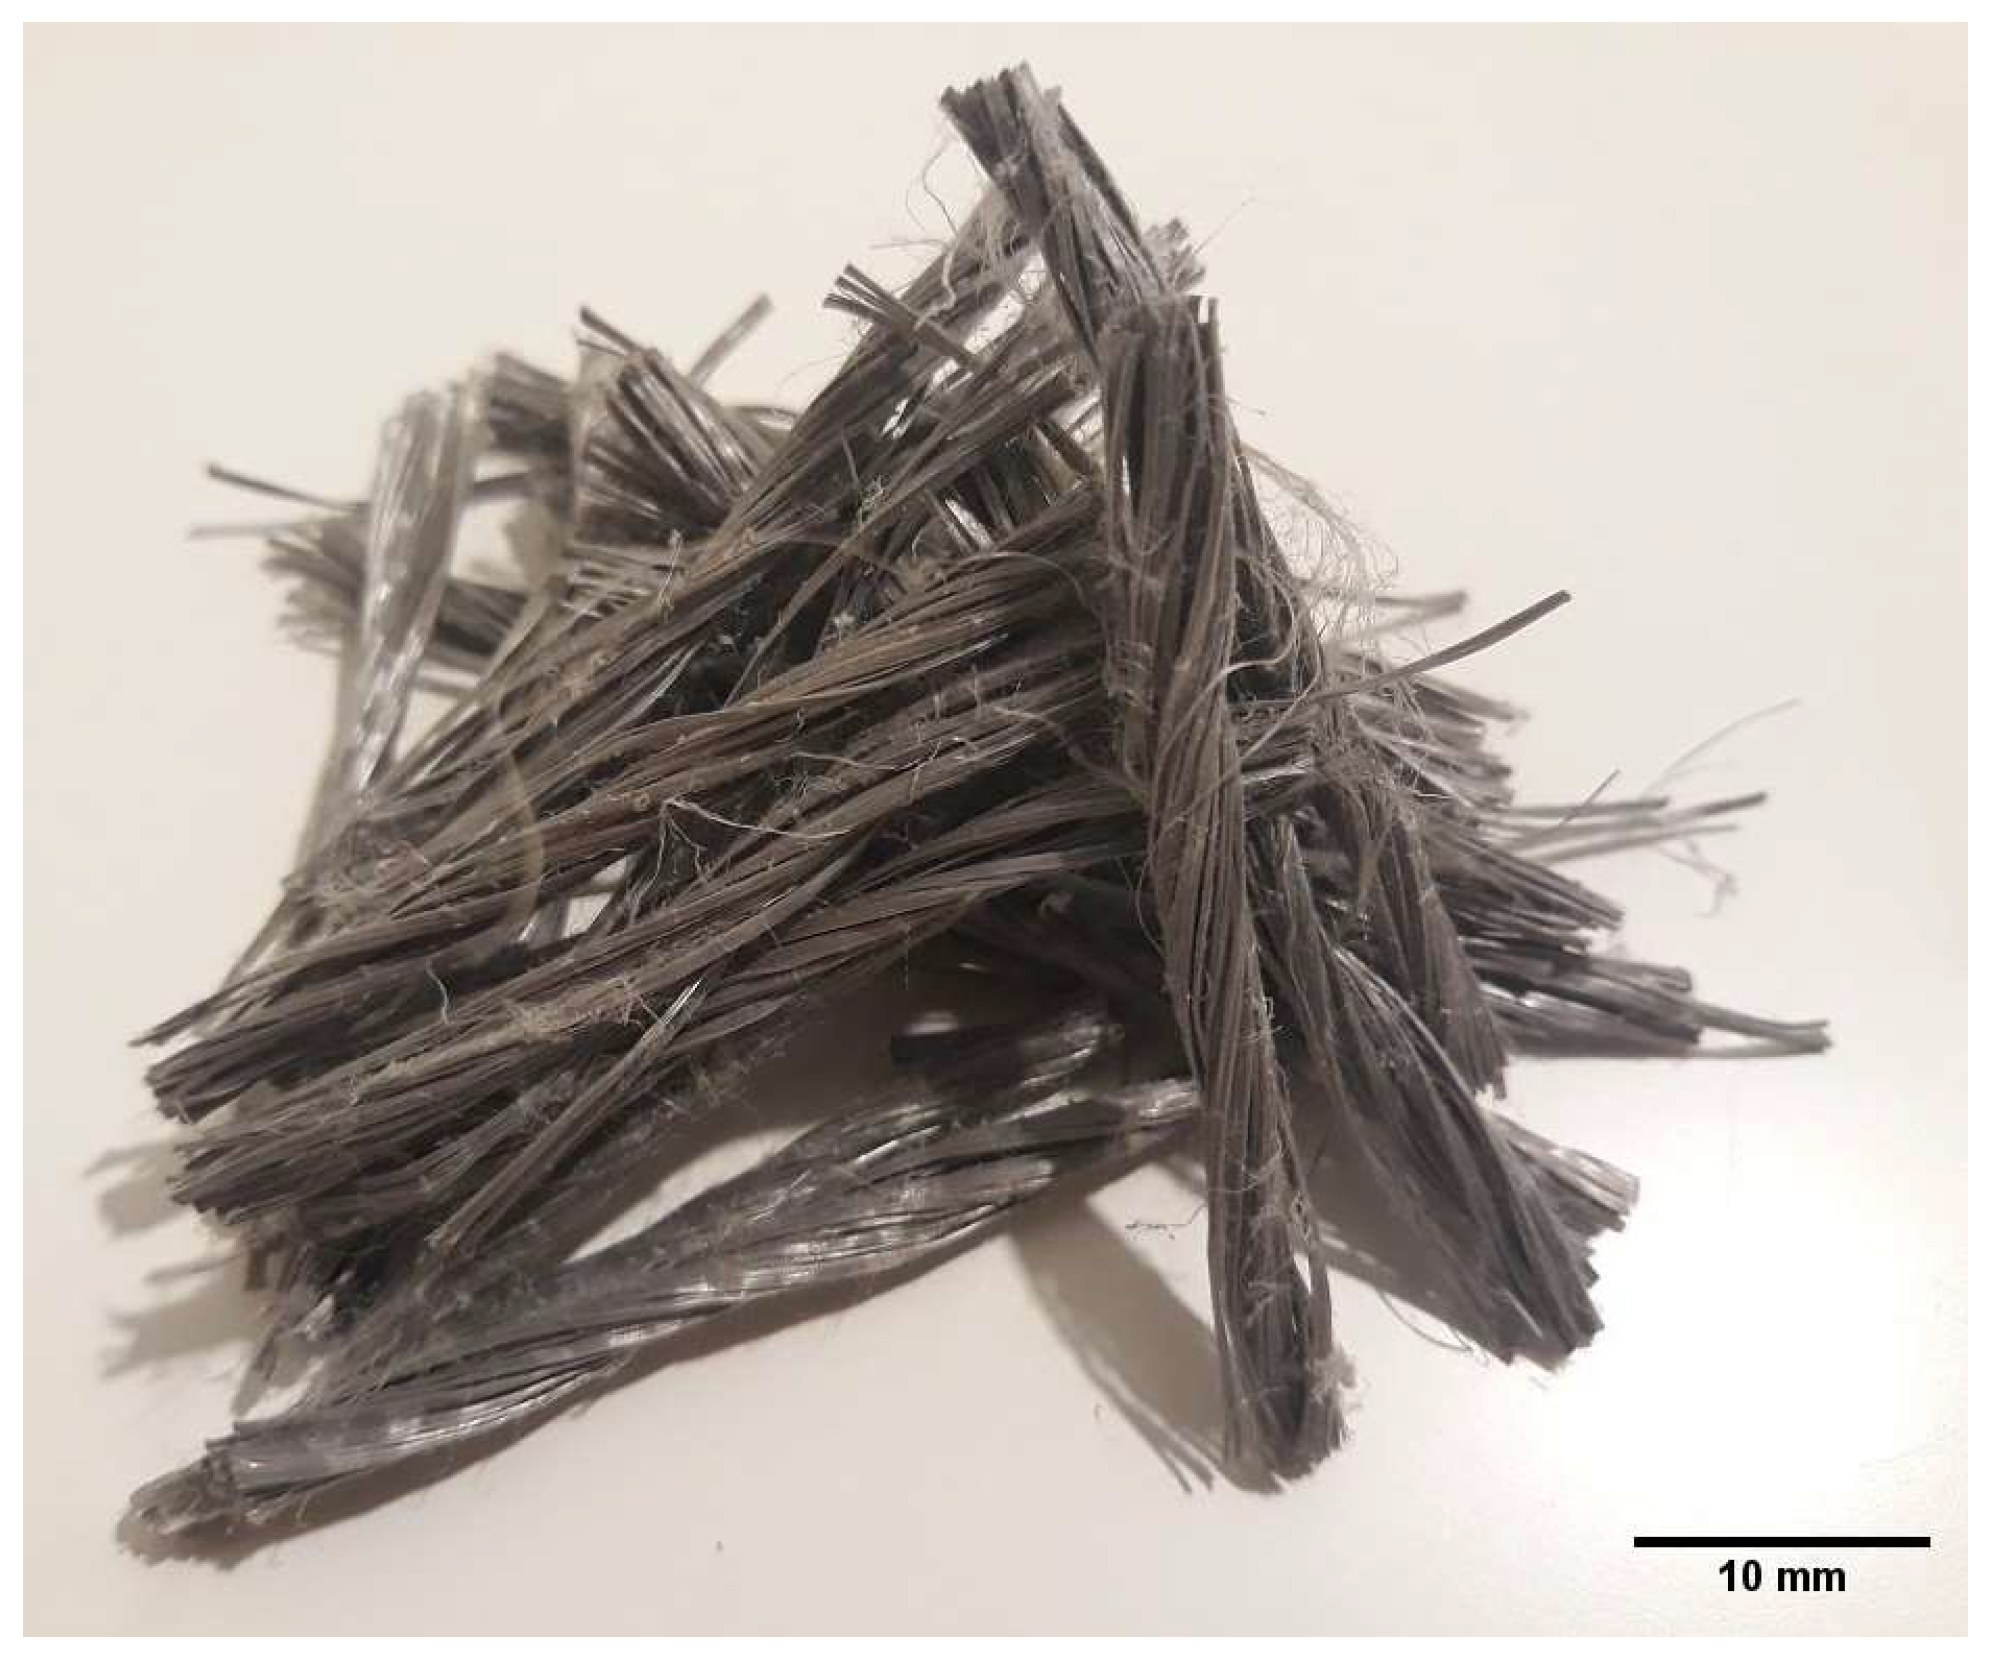
2.1. Test Variables
2.2. Specimen Preparation
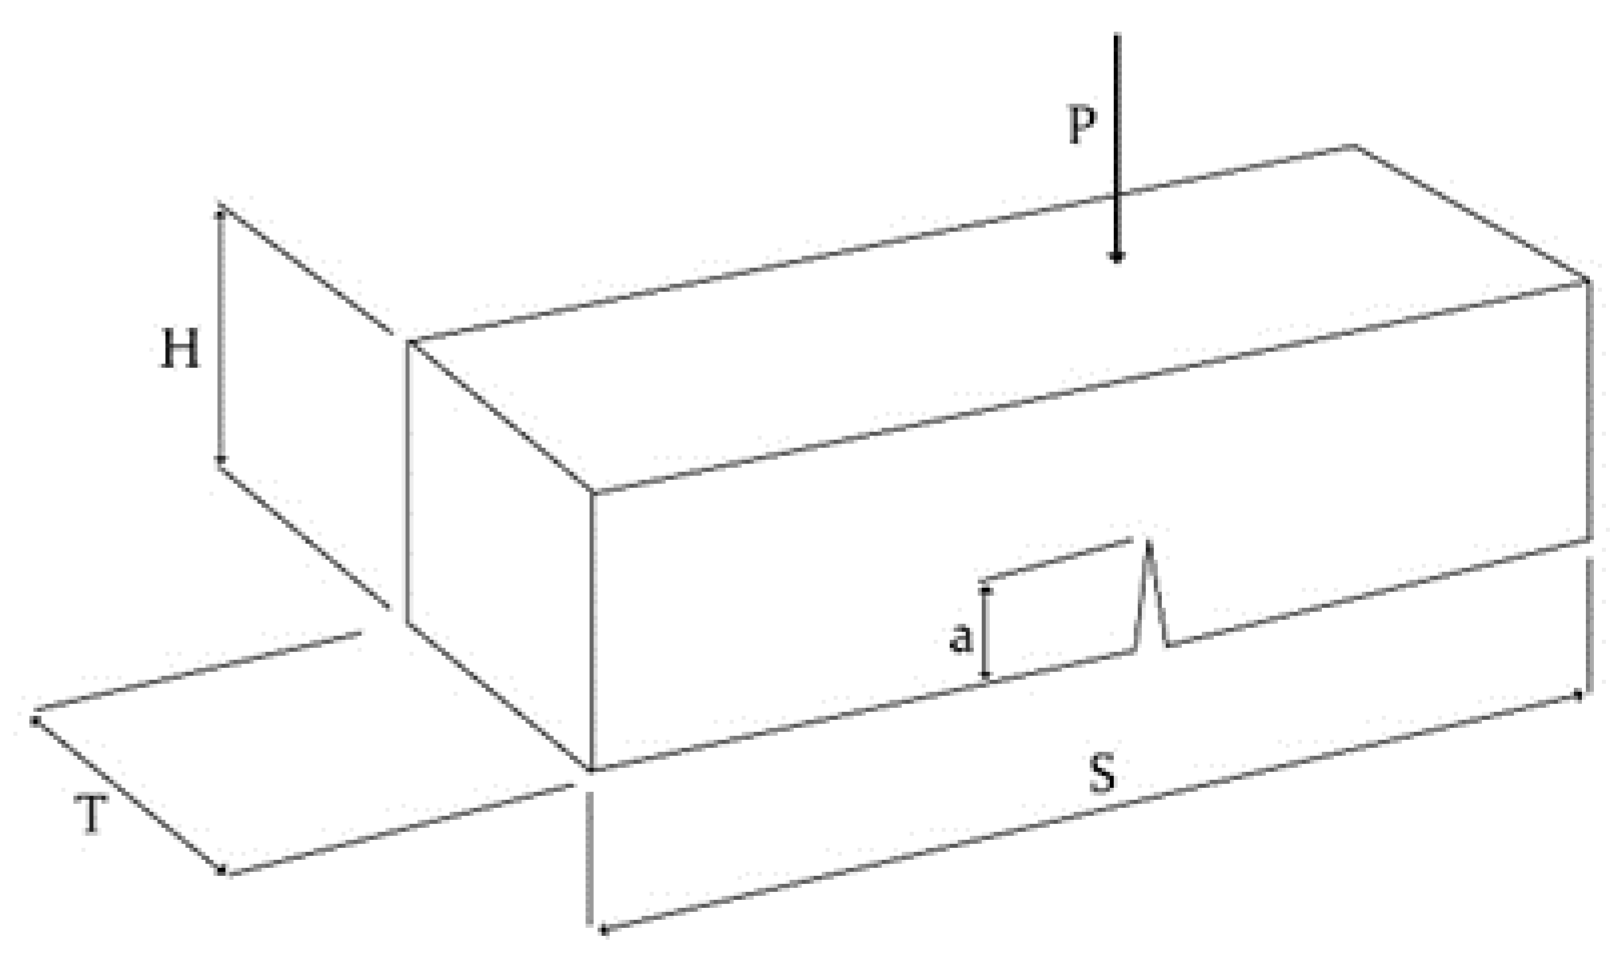
2.3. Fracture Energy Tests
- GF—the fracture energy (N/mm2),
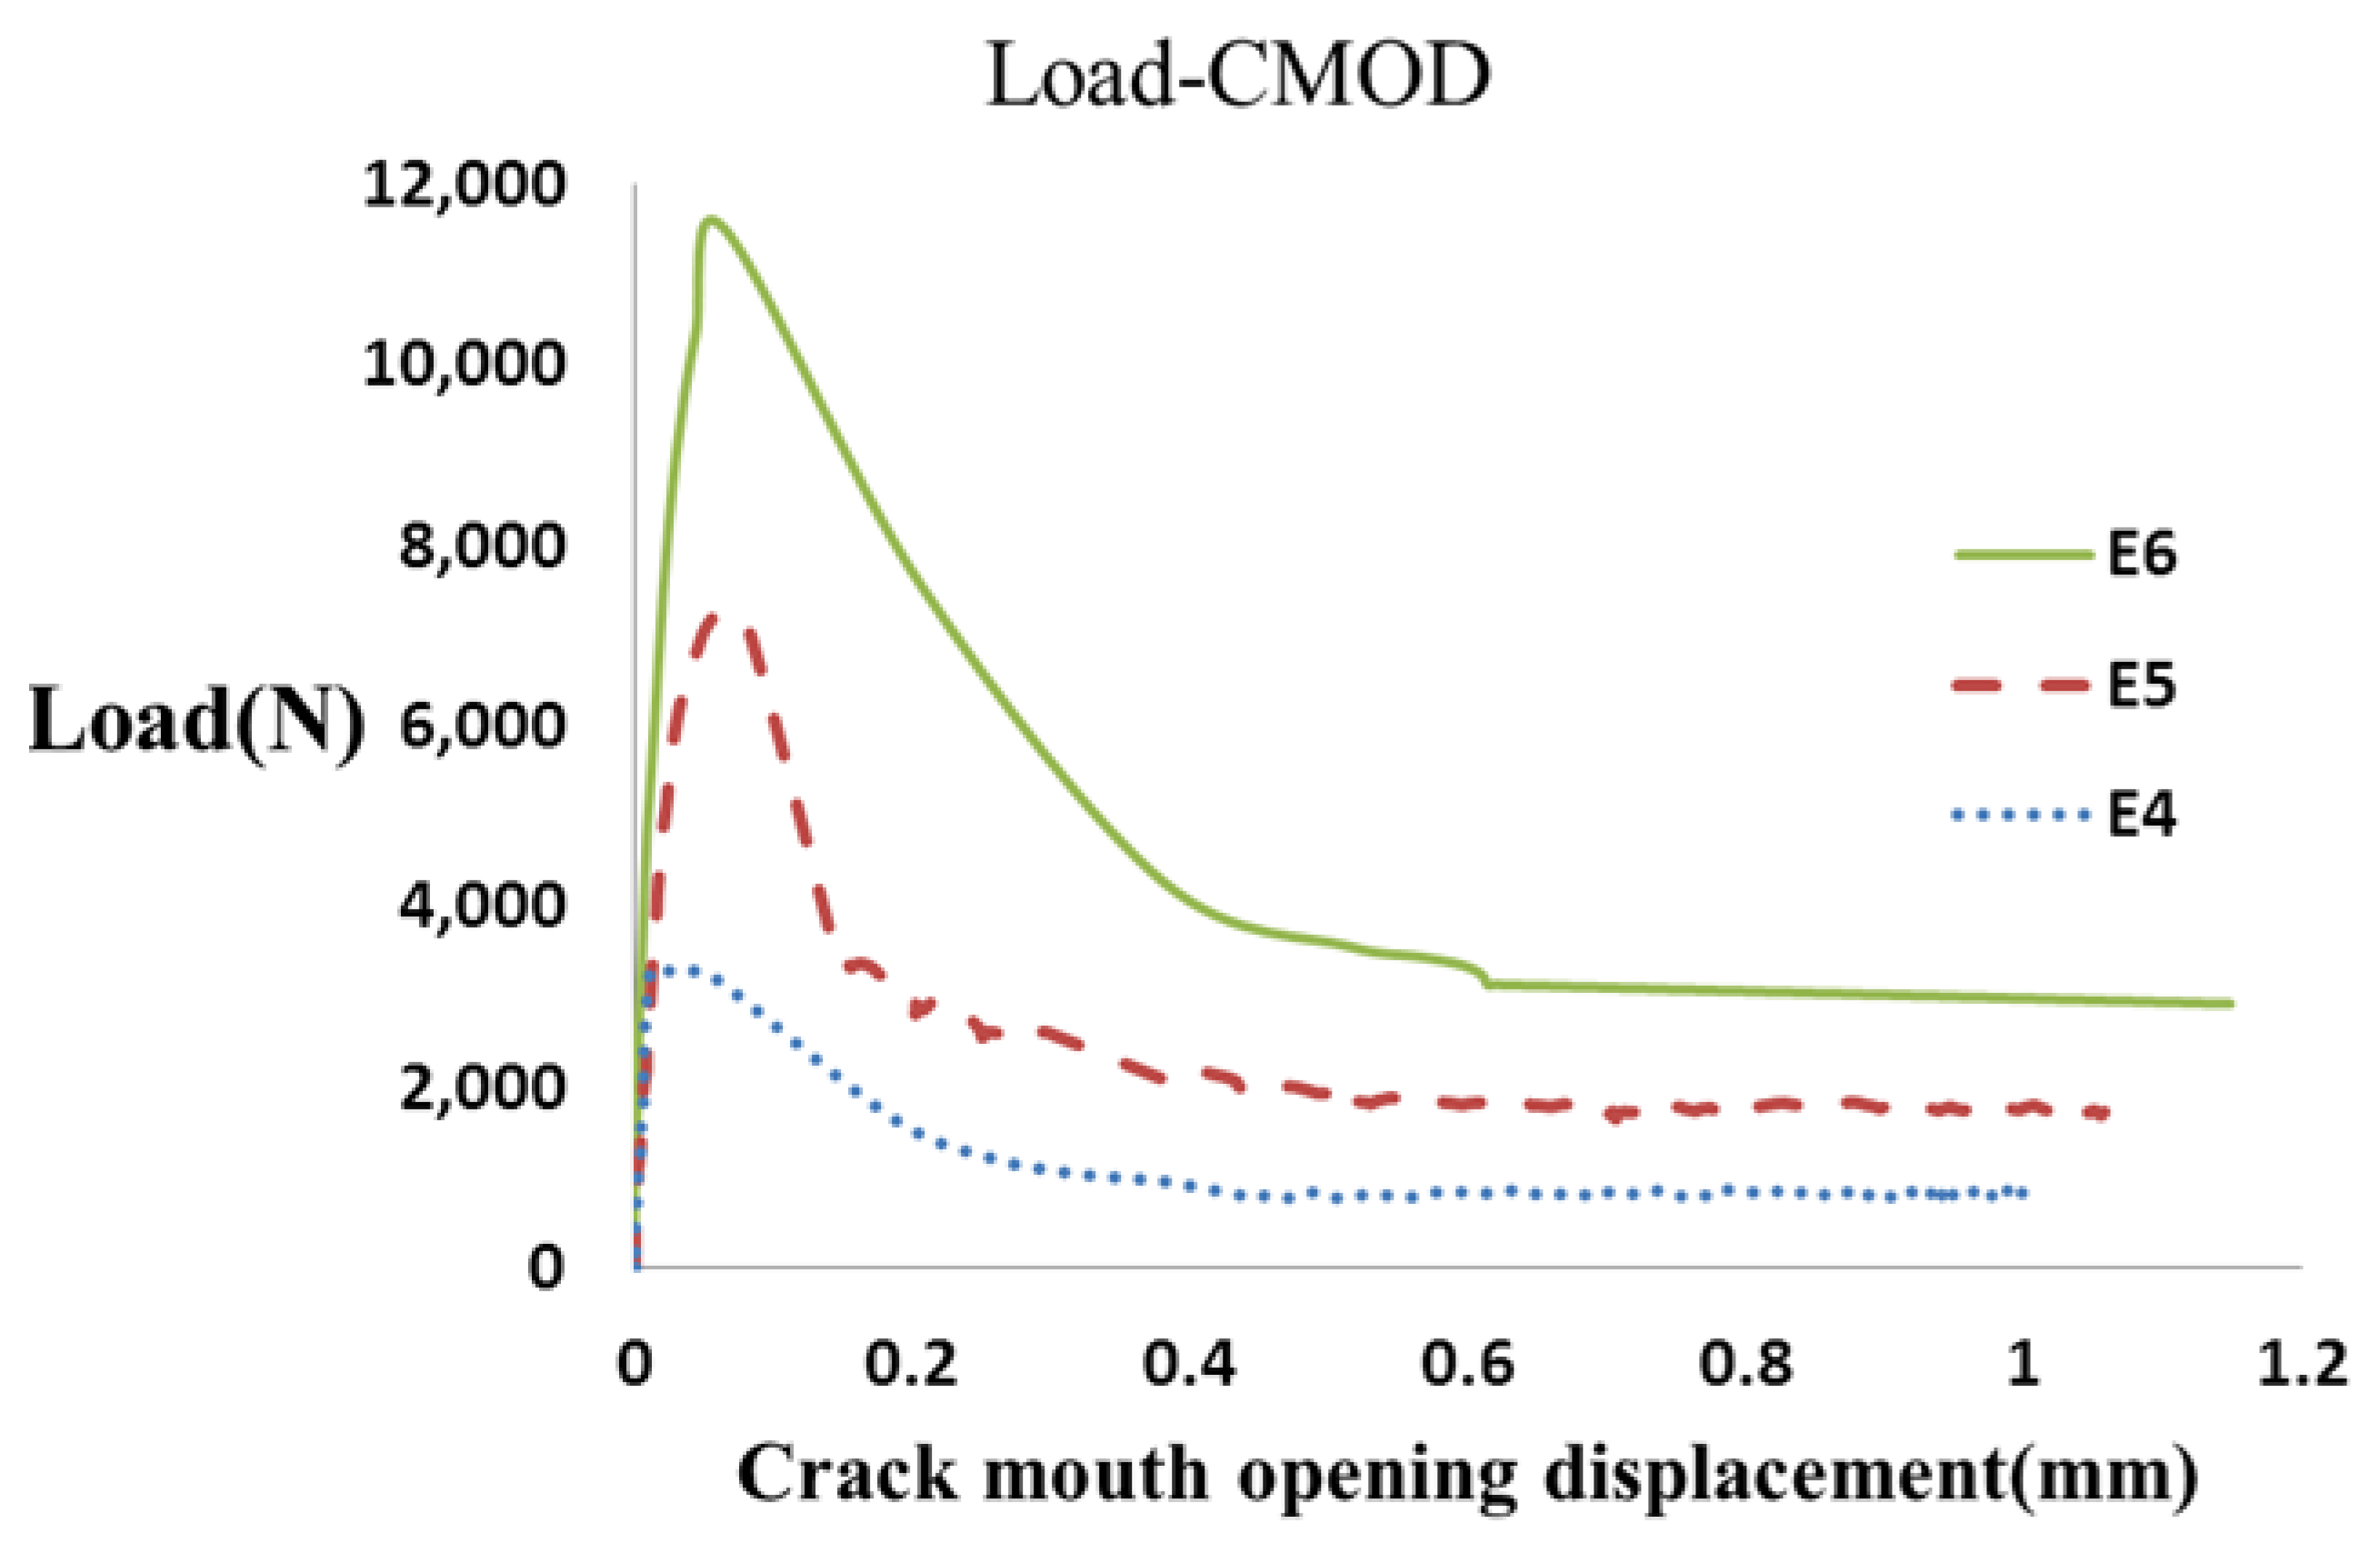
- W0—the area below the CMOD curve up to rupture of the specimen (Nmm),
- W1—the work done by the deadweight of the specimen and loading jig (a piece between the testing machine and the specimen; Nmm),
- Alig—the area of the broken ligament (b × h; mm2),
- m1—the mass of the specimen (kg),
- S—the loading span (mm),
- L—the total length of the specimen (mm),
- m2—the mass of the jig not attached to the testing machine but placed on the specimen.
2.4. Critical Stress Intensity Factor
3. Results and Discussion
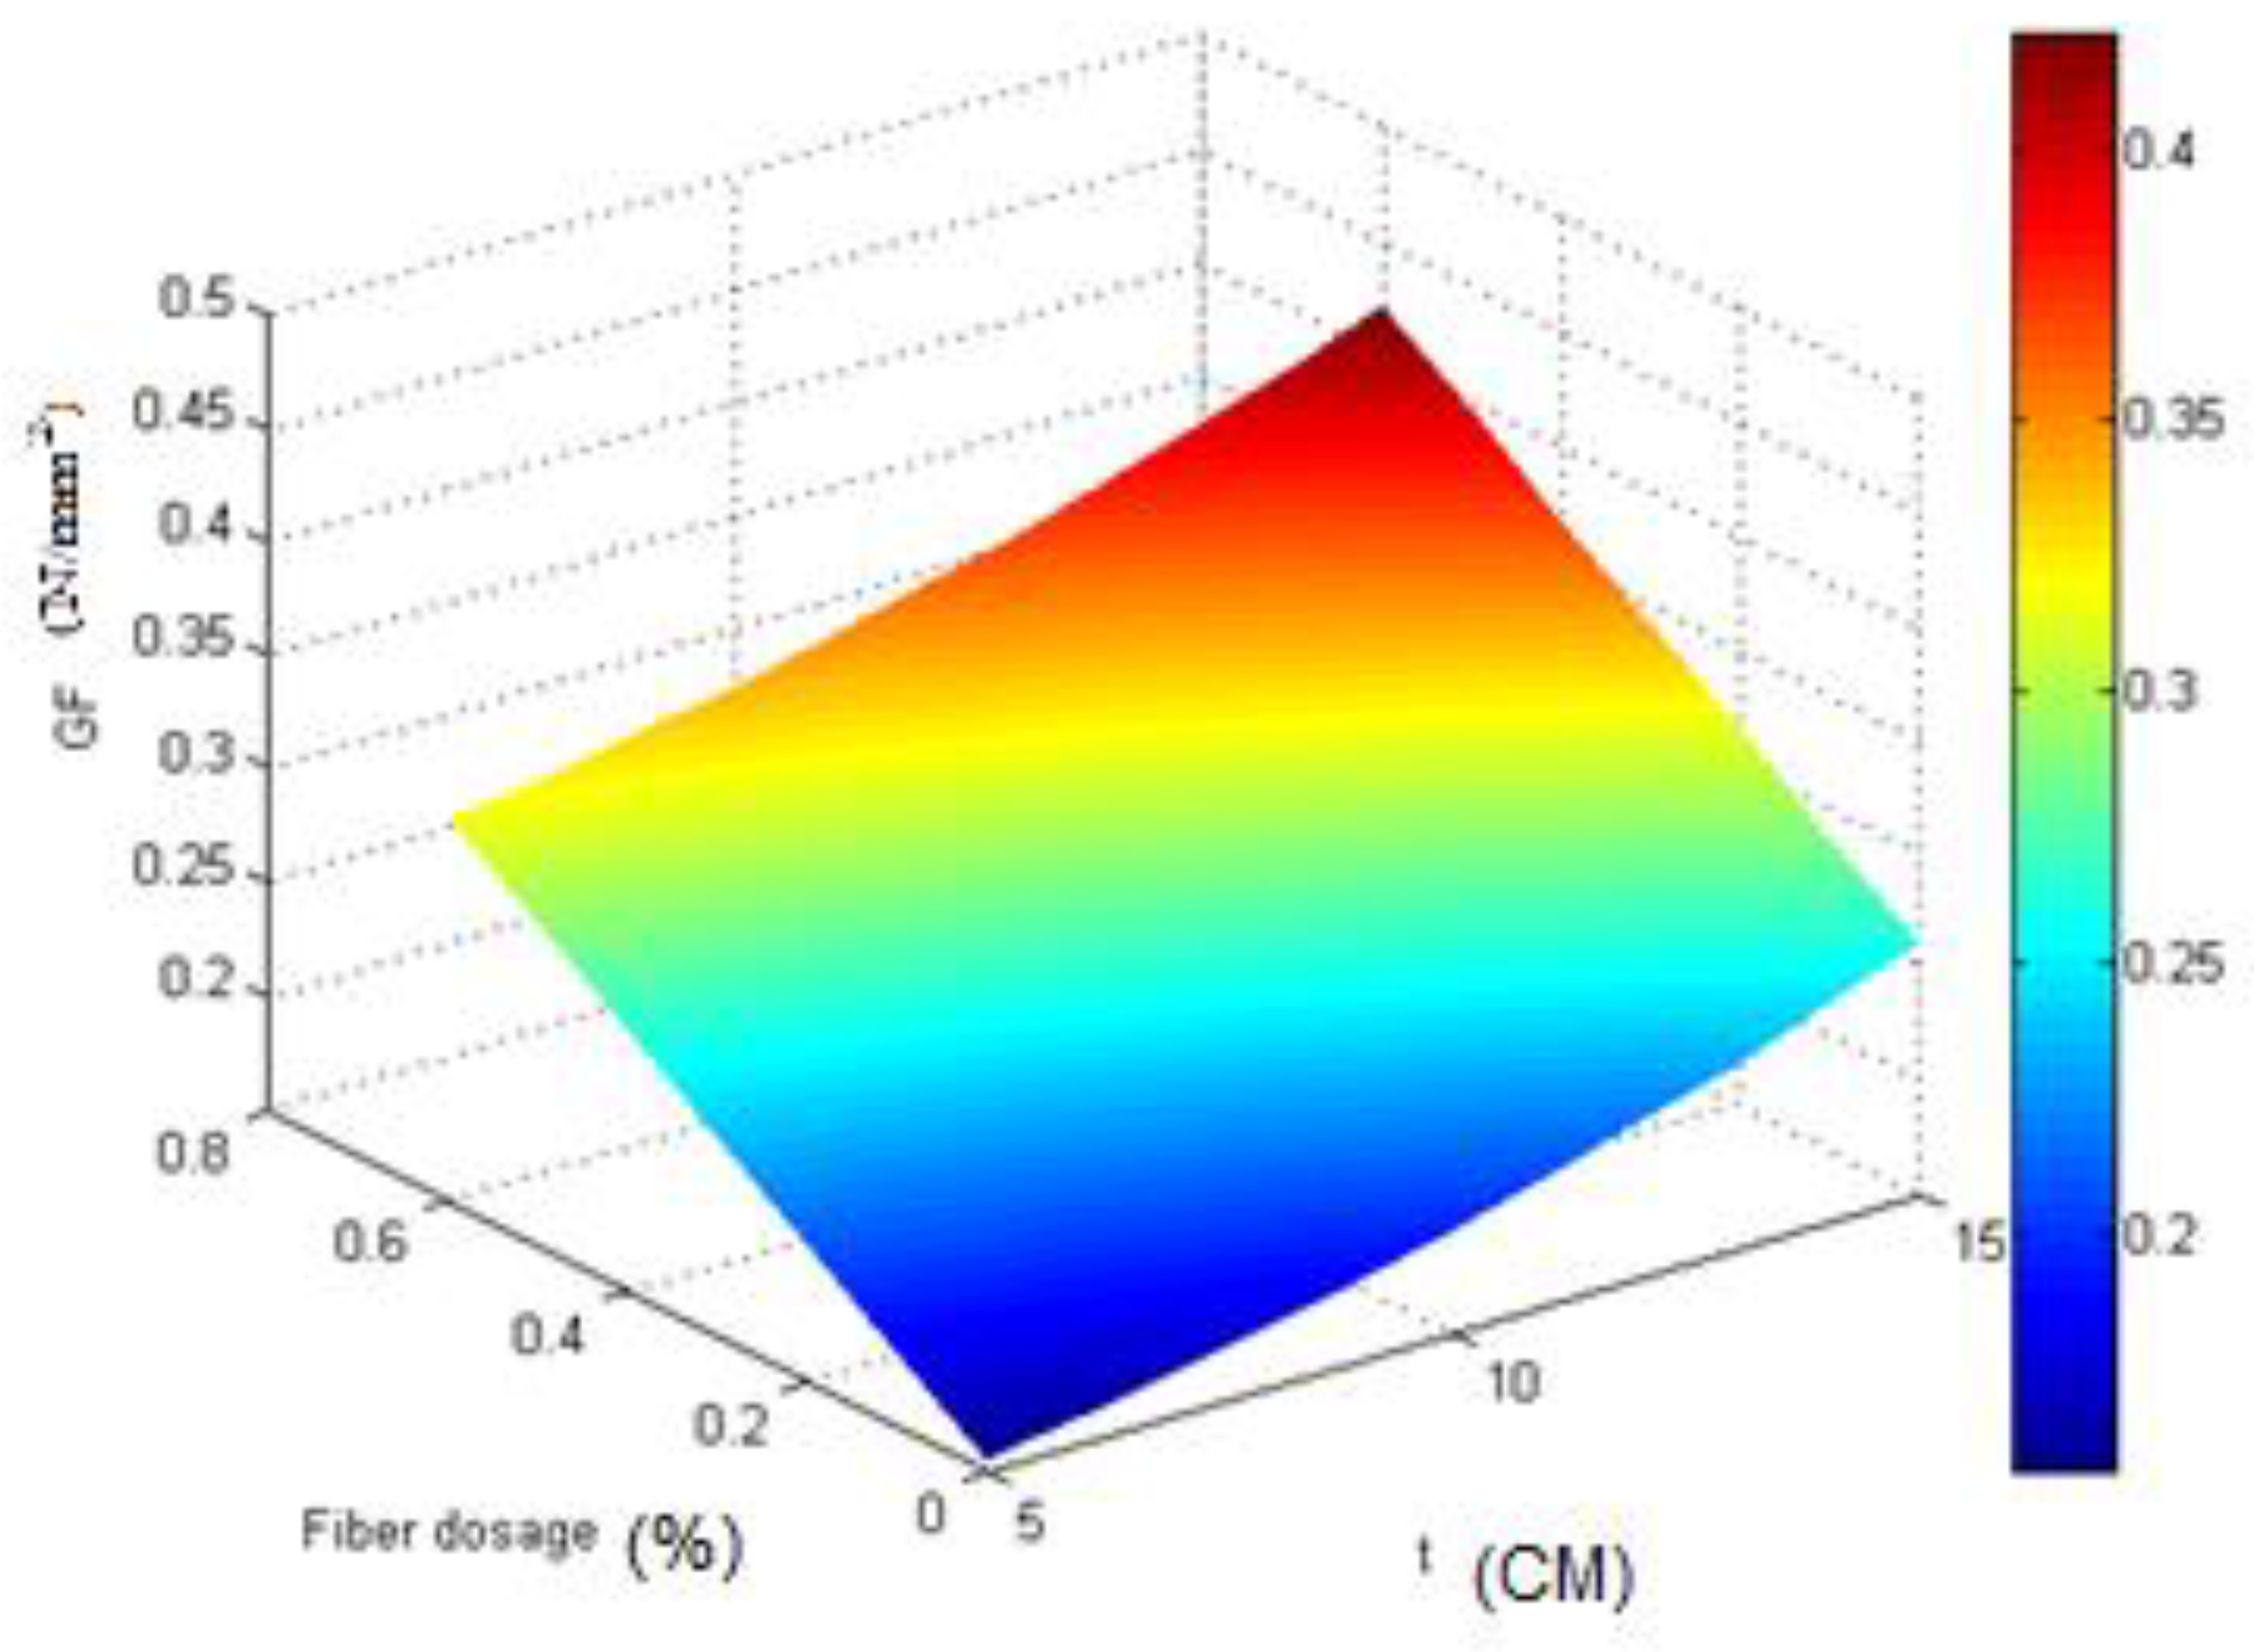
3.1. Fracture Energy
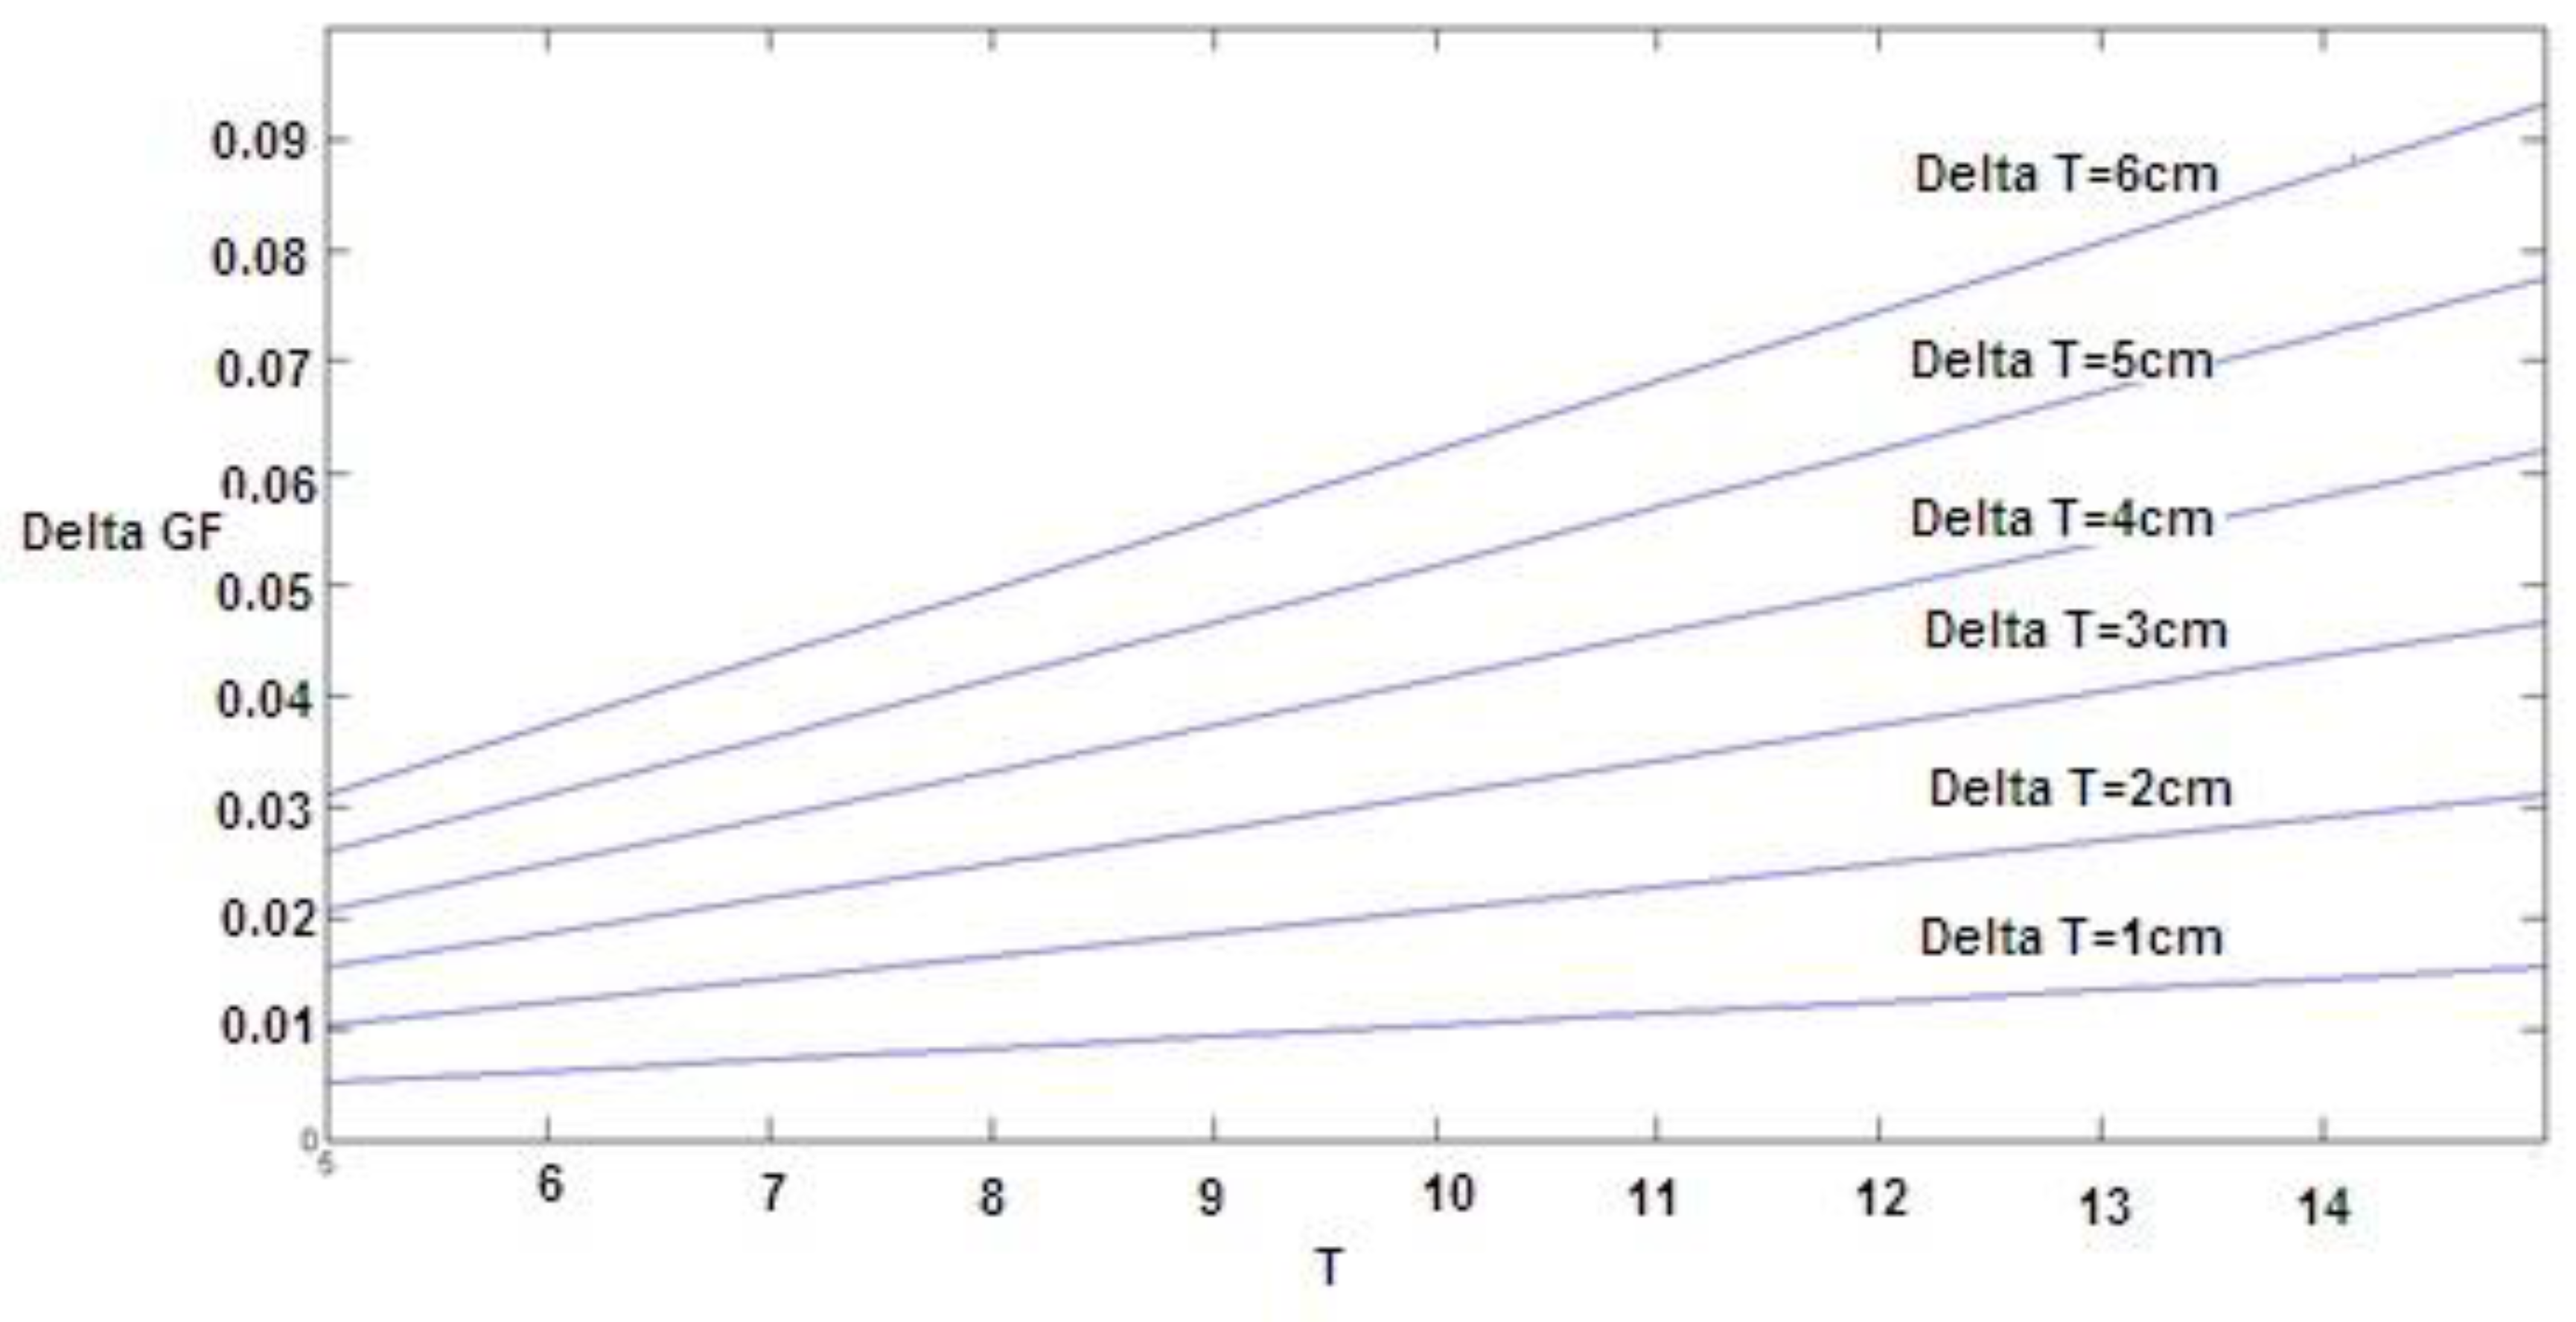
- GF—fracture energy (N/mm2)
- H—thickness of concrete specimens (CM)
- Fiberdosage—fiber volume fraction (%) are regression coefficients.
3.2. Critical Stress Intensity Factor
3.3. Assessment of Ruptured Cross Section and Fibers
4. Conclusions
- The experimental model of the effect of specimen size was presented by testing specimens with three different thicknesses and widths for normal and fiber-reinforced concrete.
- The results in Table 7 indicate that adding fibers and increasing the thickness will increase the critical stress intensity factor up to 52.14%.
- The results in Table 8 indicate that adding fibers and increasing the width will increase the critical stress intensity factor up to 13.05%.
Author Contributions
Funding
Conflicts of Interest
References
- Zongjin, L.J.H. Advanced Concrete Technology; John Wiley & Sons: Hoboken, NJ, USA, 2011. [Google Scholar]
- Lee, M.G.; Wang, W.C.; Wang, Y.C.; Hsieh, Y.C.; Lin, Y.C. Mechanical Properties of High-Strength Pervious Concrete with Steel Fiber or Glass Fiber. Buildings 2022, 12, 620. [Google Scholar] [CrossRef]
- Abd Elmoaty, A.E.M.; Morsy, A.M.; Harraz, A.B. Effect of Fiber Type and Volume Fraction on Fiber Reinforced Concrete and Engineered Cementitious Composite Mechanical Properties. Buildings 2022, 12, 2108. [Google Scholar] [CrossRef]
- Li, L.; Li, B.; Wang, Z.; Zhang, Z.; Alselwi, O. Effects of Hybrid PVA–Steel Fibers on the Mechanical Performance of High-Ductility Cementitious Composites. Buildings 2022, 12, 1934. [Google Scholar] [CrossRef]
- Daneshfar, M.; Hassani, A.; Aliha, M.R.; Berto, F. Investigating Flexural Performance of Fiber-Reinforced Concrete with Different Contents and Types of Macrosynthetic Fiber. Strength Mater. 2022, 54, 650–661. [Google Scholar] [CrossRef]
- Ahmad, J.; Burduhos-Nergis, D.D.; Arbili, M.M.; Alogla, S.M.; Majdi, A.; Deifalla, A.F.J.B. A Review on Failure Modes and Cracking Behaviors of Polypropylene Fibers Reinforced Concrete. Buildings 2022, 12, 1951. [Google Scholar] [CrossRef]
- Wang, Z.; Gou, J.; Gao, D. Experimental study on the fracture parameters of concrete. Materials 2020, 14, 129. [Google Scholar] [CrossRef]
- Pakravan, H.; Latifi, M.; Jamshidi, M.J.C. Hybrid short fiber reinforcement system in concrete: A review. Constr. Build. Mater. 2017, 142, 280–294. [Google Scholar] [CrossRef]
- Bordelon, A.; Roesler, J.R. Fiber-reinforced concrete pavement design and material requirements. In Proceedings of the 8th International Conference on the Bearing Capacity of Roads, Railways and Airfields (BCR2A’09), Urbana, IL, USA, 29 June–2 July 2009; pp. 717–727. [Google Scholar]
- Chari, K.B.; Research, I. Investigation on Mode–I Fracture Parameters Using Steel Fibers in High Strength Concrete. Int. J. Sci. Eng. Res. 2015, 3, 2347–3878. [Google Scholar]
- Gustafsson, J.; Noghabai, K. Steel fibers as shear reinforcement in high strength concrete beams. Nord. Concr. Res. Publ. 1999, 22, 35–52. [Google Scholar]
- Kreiger, E.L. A Model to Describe the Mode I Fracture of Steel Fiber Reinforced Ultra-High Performance Concrete. Master’s Thesis, Michigan Technological University, Houghton, MI, USA, 2012. [Google Scholar]
- Rao, G.A.; Rao, A.S. Toughness indices of fiber reinforced concrete subjected to mode II loading. Proc. Fract. Mech. Concr. Struct. 2010, 112–117. [Google Scholar]
- Valdez Aguilar, J.; Juárez-Alvarado, C.A.; Mendoza-Rangel, J.M.; Terán-Torres, B.T.J.M. Effect of the notch-to-depth ratio on the post-cracking behavior of steel-fiber-reinforced concrete. Materials 2021, 14, 445. [Google Scholar] [CrossRef]
- Blazy, J.; Drobiec, Ł.; Wolka, P.J.M. Flexural tensile strength of concrete with synthetic fibers. Materials 2021, 14, 4428. [Google Scholar] [CrossRef]
- Daneshfar, M.; Hassani, A.; Aliha, M.R.M.; Berto, F. Evaluating mechanical properties of macro-synthetic fiber-reinforced concrete with various types and contents. Strength Mater. 2017, 49, 618–626. [Google Scholar] [CrossRef]
- Fallah, S.; Nematzadeh, M. Mechanical properties and durability of high-strength concrete containing macro-polymeric and polypropylene fibers with nano-silica and silica fume. Constr. Build. Mater. 2017, 132, 170–187. [Google Scholar] [CrossRef]
- Lee, J.-H.; Cho, B.; Choi, E.J.C. Flexural capacity of fiber reinforced concrete with a consideration of concrete strength and fiber content. Constr. Build. Mater. 2017, 138, 222–231. [Google Scholar] [CrossRef]
- Alberti, M.G.; Enfedaque, A.; Gálvez, J.C. Fibre reinforced concrete with a combination of polyolefin and steel-hooked fibres. Compos. Struct. 2017, 171, 317–325. [Google Scholar] [CrossRef]
- Hesami, S.; Hikouei, I.S.; Emadi, S.A.A. Mechanical behavior of self-compacting concrete pavements incorporating recycled tire rubber crumb and reinforced with polypropylene fiber. J. Clean. Prod. 2016, 133, 228–234. [Google Scholar] [CrossRef]
- Saidani, M.; Saraireh, D.; Gerges, M.J.E.S. Behaviour of different types of fibre reinforced concrete without admixture. Eng. Struct. 2016, 113, 328–334. [Google Scholar] [CrossRef]
- Afroughsabet, V.; Ozbakkaloglu, T.J.C. Mechanical and durability properties of high-strength concrete containing steel and polypropylene fibers. Constr. Build. Mater. 2015, 94, 73–82. [Google Scholar] [CrossRef]
- Yew, M.K.; Mahmud, H.B.; Ang, B.C.; Yew, M.C.J.C. Influence of different types of polypropylene fibre on the mechanical properties of high-strength oil palm shell lightweight concrete. Constr. Build. Mater. 2015, 90, 36–43. [Google Scholar] [CrossRef]
- Karadelis, J.N.; Lin, Y. Flexural strengths and fibre efficiency of steel-fibre-reinforced, roller-compacted, polymer modified concrete. Constr. Build. Mater. 2015, 93, 498–505. [Google Scholar] [CrossRef]
- Hesami, S.; Ahmadi, S.; Nematzadeh, M.J.C. Effects of rice husk ash and fiber on mechanical properties of pervious concrete pavement. Constr. Build. Mater. 2014, 53, 680–691. [Google Scholar] [CrossRef]
- Pająk, M.; Ponikiewski, T.J.C. Flexural behavior of self-compacting concrete reinforced with different types of steel fibers. Constr. Build. Mater. 2013, 47, 397–408. [Google Scholar] [CrossRef]
- Singh, S.; Singh, A.; Bajaj, V. Strength and flexural toughness of concrete reinforced with steel-polypropylene hybrid fibres. Asian J. Civ. Eng. 2010, 11, 495–507. [Google Scholar]
- Silva, F.J.; Thaumaturgo, C. Fibre reinforcement and fracture response in geopolymeric mortars. Fatigue Fract. Eng. Mater. Struct. 2003, 26, 167–172. [Google Scholar] [CrossRef]
- ACI 211.1-91; Standard Practice for Selecting Proportions for Normal. Heavyweight, and Mass Concrete. American Concrete Institute: Farmington Hills, MI, USA, 2009.
- D7508/D7508M-10; Standard Specification for Polyolefin Chopped Strands for Use in Concrete. ASTM International: West Conshohocken, PA, USA, 2015.
- JCI-S-001e2003; Japan Concrete Institute Standard. Method of Test for Fracture Energy of Concrete by Use of Notched Beam. Japan Concrete Institute: Tokyo, Japan, 2003.
- Zhu, X.K.; Joyce, J.A. Review of fracture toughness (G, K, J, CTOD, CTOA) testing and standardization. Eng. Fract. Mech. 2012, 85, 1–46. [Google Scholar] [CrossRef]


| Authors | Year | Fiber Properties | Concrete Type | Compressive Strength | Splitting Tensile Strength | Flexural Strength | Energy Absorption | ||
|---|---|---|---|---|---|---|---|---|---|
| Type | Length (mm) | Fiber Volume Fraction (%) | |||||||
| Valdez et al. [14] | 2021 | Steel fibers | 50 | 0.25, 0.5 | Normal concrete | - | - | - | ↑ |
| Blazy et al. [15] | 2021 | Polypropylene | 48, 54 | 0.22, 0.33 | Normal concrete | - | - | 5.55–13.5% ↑ | - |
| Daneshfar et al. [16] | 2017 | Polypropylene | 38 | 0.2, 0.4, 0.6 | Normal concrete | 4.57–26.32% ↓ | 0.84–34.29% ↑ | 19.6–81.69% ↑ | - |
| Fallah and Nematzadeh [17] | 2017 | Polypropylene | 39 | 0.25, 0.75, 1.25 | High-strength concrete | 8% ↑, 3% ↑, 4% ↓ | 8, 9, 27% ↑ | - | - |
| Lee et al. [18] | 2017 | Steel fibers | 20, 30, 40 | 0.25, 0.375, 0.5 | Normal concrete | - | - | At least 20.8% ↑ | ↑ |
| Alberti et al. [19] | 2017 | Steel fibers (hooked) | 35 | 0.33 | Self-compacting concrete | ↓ | ↑ | ↑ | ↑ |
| Polypropylene | 60 | 0.5 | |||||||
| Hesami et al. [20] | 2016 | Polypropylene | 60 | 0.10, 0.12 | Self-compacting concrete | 2% ↑, 5% ↓ | 19, 27% ↑ | 26, 33% | - |
| Saidani et al. [21] | 2016 | Steel fibers | 50 | 4% (by cement volume) | Normal concrete | 2% ↓ | 98% ↑ | - | - |
| Polypropylene | 50 | 4% (by cement volume) | 5% ↓ | 65%↑ | - | - | |||
| Afroughsabet and Ozbakkaloglu [22] | 2015 | Hooked-end steel | 60 | 0.25, 0.5, 0.45, 1 | High-strength concrete | 12, 14, 15, 19% ↑ | 15, 22, 38, 57% ↑ | 14, 28, 36, 61% ↑ | - |
| Yew et al. [23] | 2015 | Polypropylene (twisted bundle) | 54 | 0.25, 0.375, 0.5 | Lightweight concrete | 5, 11, 15% ↑ | 8, 24, 33% ↑ | 29, 31, 40%↑ | - |
| 30 | 0.25, 0.375, 0.5 | 3, 10, 14% ↑ | 10, 19, 27% ↑ | 18, 22, 30%↑ | - | ||||
| Polypropylene (straight) | 20 | 0.25, 0.375, 0.5 | 4, 10, 14% ↑ | 13, 14, 21%↑ | 6, 10, 20%↑ | - | |||
| Karadelis and Yougui [24] | 2015 | Steel | 50 | 1.5 | Roller-compacted concrete | N.S | - | 24%↑ | - |
| Hesami et al. [25] | 2014 | Steel | 36 | 0.5 | Previous concrete | 24% ↑ | 33%↑ | 19%↑ | - |
| PPS | 54 | 0.3 | 28% ↑ | 37%↑ | 21%↑ | - | |||
| Glass | 12 | 0.2 | 32% ↑ | 28%↑ | 17%↑ | - | |||
| Pajak and Ponikiewski [26] | 2013 | Hooked-end steel | 30 | 0.5, 1, 1.5 | Self-compacting concrete | 34, 32, 20% ↑ | - | 55, 151, 339% ↑ | - |
| Singh et al. [27] | 2010 | Steel fibers (corrugated) | 35 | 1 | Normal concrete | 18% ↑ | - | 80%↑ | ↑ |
| Polypropylene (fibrillated) | 60 | ||||||||
| Silva and Thaumaturgo [28] | 2002 | Wollastonite | 20 | 2, 3, 5 | Geopolymer concrete | - | - | - | 80% ↑ |
| Specimen No. | Shape of Fiber | Fiber Volume Fraction (%) | Specimen Size (mm) | Notch Length (mm) | Notch Width (mm) |
|---|---|---|---|---|---|
| E1 | Twisted | 0.4, 0.6 | 80 × 120 × 450 | 30 | 2 |
| E2 | Twisted | 0.4, 0.6 | 100 × 120 × 450 | 30 | 2 |
| E3 | Twisted | 0.4, 0.6 | 150 × 120 × 450 | 30 | 2 |
| E4 | Twisted | 0.4, 0.6 | 100 × 50 × 350 | 30 | 2 |
| E5 | Twisted | 0.4, 0.6 | 100 × 100 × 350 | 30 | 2 |
| E6 | Twisted | 0.4, 0.6 | 100 × 150 × 350 | 30 | 2 |
| N1 | - | 0 | 80 × 120 × 450 | 30 | 2 |
| N2 | - | 0 | 100 × 120 × 450 | 30 | 2 |
| N3 | - | 0 | 150 × 120 × 450 | 30 | 2 |
| N4 | - | 0 | 100 × 50 × 350 | 30 | 2 |
| N5 | - | 0 | 100 × 100 × 350 | 30 | 2 |
| N6 | - | 0 | 100 × 150 × 350 | 30 | 2 |
| DF | SS | MS | F-Value | p-Value | |
|---|---|---|---|---|---|
| Total | 8 | 0.06862 | 0.008578 | - | - |
| Model | 2 | 0.06757 | 0.033786 | 192.98 | 0.0000 |
| Residual error | 6 | 0.00105 | 0.000175 | - | - |
| R2 | 0.985 | - | - | - | - |
| Adjusted R2 | 0.980 | - | - | - | - |
| Independent Variable | Regression Coefficient | p-Value | t-Value | Standard Error | Standardized Coefficients |
|---|---|---|---|---|---|
| Constant | 0.01781 | 0.159 | 1.61 | 0.0000639 | - |
| H2 | 0.00122 | 0 | 19.02 | 0.0012159 | 0.9607599 |
| Fiber dosage | 0.0869 | 0.003 | 4.92 | 0.011086 | 0.2482591 |
| Total | DF | SS | MS | F-Value | p-Value |
|---|---|---|---|---|---|
| Model | 8 | 0.0584 | 0.007302 | - | - |
| Residual error | 2 | 0.0569 | 0.028428 | 109.12 | 0 |
| R2 | 6 | 0.0016 | 0.00026 | ||
| Adjusted R2 | 0.9732 | - | - | - | - |
| 0.9643 | - | - | - | - |
| Independent Variable | Regression Coefficient | p-Value | t-Value | Standard Error | Standardized Coefficients |
|---|---|---|---|---|---|
| Constant | 0.1438929 | 0 | 12.23 | 0.0117701 | - |
| T2 | 0.0005169 | 0 | 7.93 | 0.0003574 | 0.5293087 |
| Fiber dosage | 0.2588928 | 0 | 12.47 | 0.2161148 | 0.8325113 |
| Specimen | PAVE (N) | a (mm) | H (mm) | a/H | T (mm) | K (MPa × √m) | Percentage Change w.r.t Plane Concrete (%) |
|---|---|---|---|---|---|---|---|
| N1 | 2080 | 30 | 80 | 0.375 | 120 | 17.48972 | 0 |
| N2 | 5082.9 | 30 | 100 | 0.3 | 120 | 25.15605 | 0 |
| N3 | 13,211.2 | 30 | 150 | 0.2 | 120 | 27.3126 | 0 |
| E1-0.4 | 2880.1 | 30 | 80 | 0.375 | 120 | 24.21737 | 38.46 |
| E2-0.4 | 6701.5 | 30 | 100 | 0.3 | 120 | 33.16676 | 31.84 |
| E3-0.4 | 16,821.1 | 30 | 150 | 0.2 | 120 | 34.77565 | 27.32 |
| E1-0.6 | 3164.6 | 30 | 80 | 0.375 | 120 | 26.60959 | 52.14 |
| E2-0.6 | 7704.7 | 30 | 100 | 0.3 | 120 | 38.13175 | 51.58 |
| E3-0.6 | 19,099.6 | 30 | 150 | 0.2 | 120 | 39.48618 | 44.57 |
| Specimen | PAVE (N) | a (mm) | H(mm) | a/H | T (mm) | K (MPa × √m) | Percentage Change w.r.t Plane Concrete (%) |
|---|---|---|---|---|---|---|---|
| N4 | 3318.9 | 30 | 100 | 0.3 | 50 | 30.32 | 0 |
| N5 | 7240.6 | 30 | 100 | 0.3 | 100 | 33.08 | 0 |
| N6 | 11,505.8 | 30 | 100 | 0.3 | 150 | 35.04 | 0 |
| E4-0.4 | 3587.3 | 30 | 100 | 0.3 | 50 | 32.78 | 8.09 |
| E5-0.4 | 7774.1 | 30 | 100 | 0.3 | 100 | 35.52 | 7.37 |
| E6-0.4 | 12,400 | 30 | 100 | 0.3 | 150 | 37.77 | 7.77 |
| E4-0.6 | 3752.1 | 30 | 100 | 0.3 | 50 | 34.28 | 13.05 |
| E5-0.6 | 8101.4 | 30 | 100 | 0.3 | 100 | 37.01 | 11.88 |
| E6-0.6 | 12,691.8 | 30 | 100 | 0.3 | 150 | 38.65 | 10.3 |
Disclaimer/Publisher’s Note: The statements, opinions and data contained in all publications are solely those of the individual author(s) and contributor(s) and not of MDPI and/or the editor(s). MDPI and/or the editor(s) disclaim responsibility for any injury to people or property resulting from any ideas, methods, instructions or products referred to in the content. |
© 2023 by the authors. Licensee MDPI, Basel, Switzerland. This article is an open access article distributed under the terms and conditions of the Creative Commons Attribution (CC BY) license (https://creativecommons.org/licenses/by/4.0/).
Share and Cite
Daneshfar, M.; Hassani, A.; Aliha, M.R.M.; Sadowski, T. Assessment of the Specimen Size Effect on the Fracture Energy of Macro-Synthetic-Fiber-Reinforced Concrete. Materials 2023, 16, 673. https://doi.org/10.3390/ma16020673
Daneshfar M, Hassani A, Aliha MRM, Sadowski T. Assessment of the Specimen Size Effect on the Fracture Energy of Macro-Synthetic-Fiber-Reinforced Concrete. Materials. 2023; 16(2):673. https://doi.org/10.3390/ma16020673
Chicago/Turabian StyleDaneshfar, Mohammad, Abolfazl Hassani, Mohammad Reza Mohammad Aliha, and Tomasz Sadowski. 2023. "Assessment of the Specimen Size Effect on the Fracture Energy of Macro-Synthetic-Fiber-Reinforced Concrete" Materials 16, no. 2: 673. https://doi.org/10.3390/ma16020673
APA StyleDaneshfar, M., Hassani, A., Aliha, M. R. M., & Sadowski, T. (2023). Assessment of the Specimen Size Effect on the Fracture Energy of Macro-Synthetic-Fiber-Reinforced Concrete. Materials, 16(2), 673. https://doi.org/10.3390/ma16020673