
Influence of Rheological and Morphological Characteristics of Polyhydroxybutyrate on Its Meltblown Process Behavior


Abstract
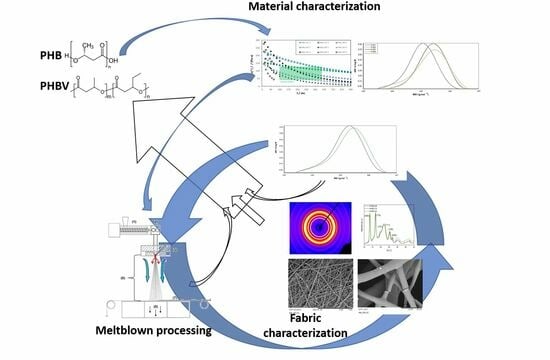
1. Introduction
2. Materials and Methods
2.1. Materials
2.2. Meltblow Set-Up
- Polymer throughput;
- Process temperature (melt);
- Process temperature (air);
- Air throughput;
- Die–collector distance (DCD);
- Collector speed.
2.3. Nonwoven Production
2.4. Determination of the Moisture Content
2.5. Polymer Characterization
2.6. Nonwoven Testing
2.7. Characterization of Degradation
3. Results
3.1. Raw Material Characterization
3.1.1. Thermal Properties
3.1.2. Molecular Characteristics
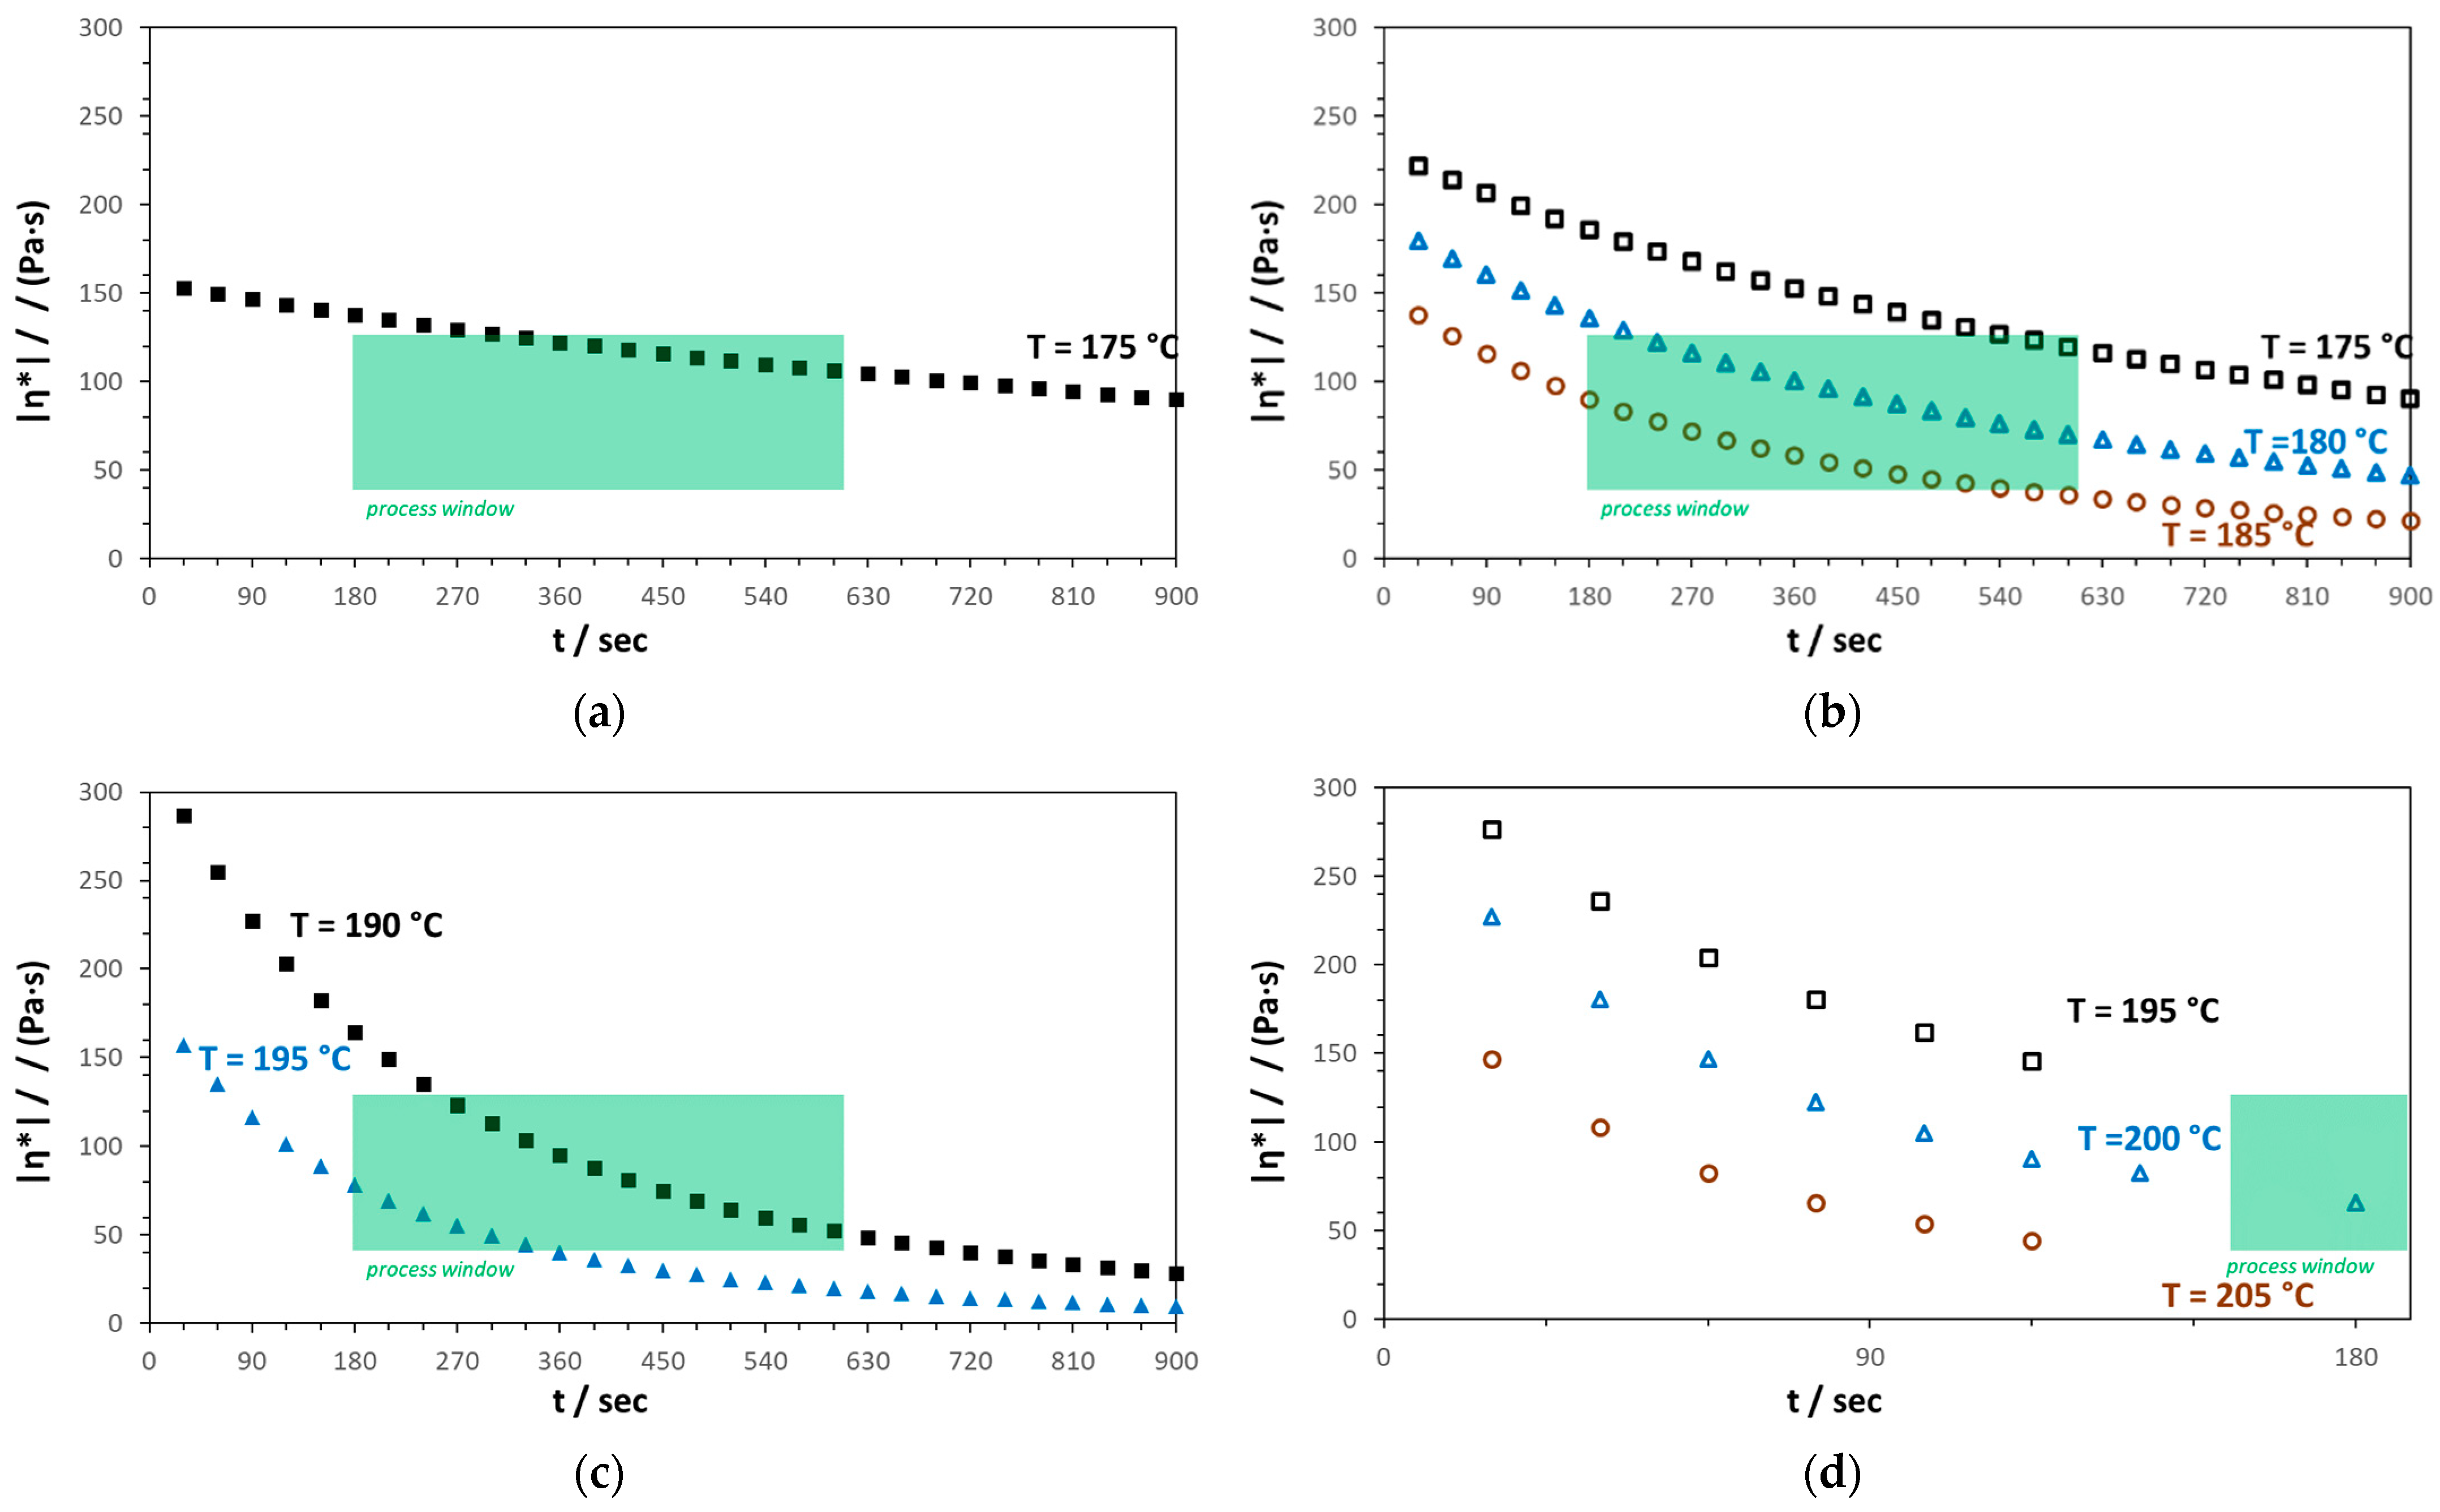
3.1.3. Rheological Behavior
3.2. Examination of Meltblown Processability
3.2.1. PHB1
3.2.2. PHB2
3.2.3. PHB3
3.2.4. PHBV
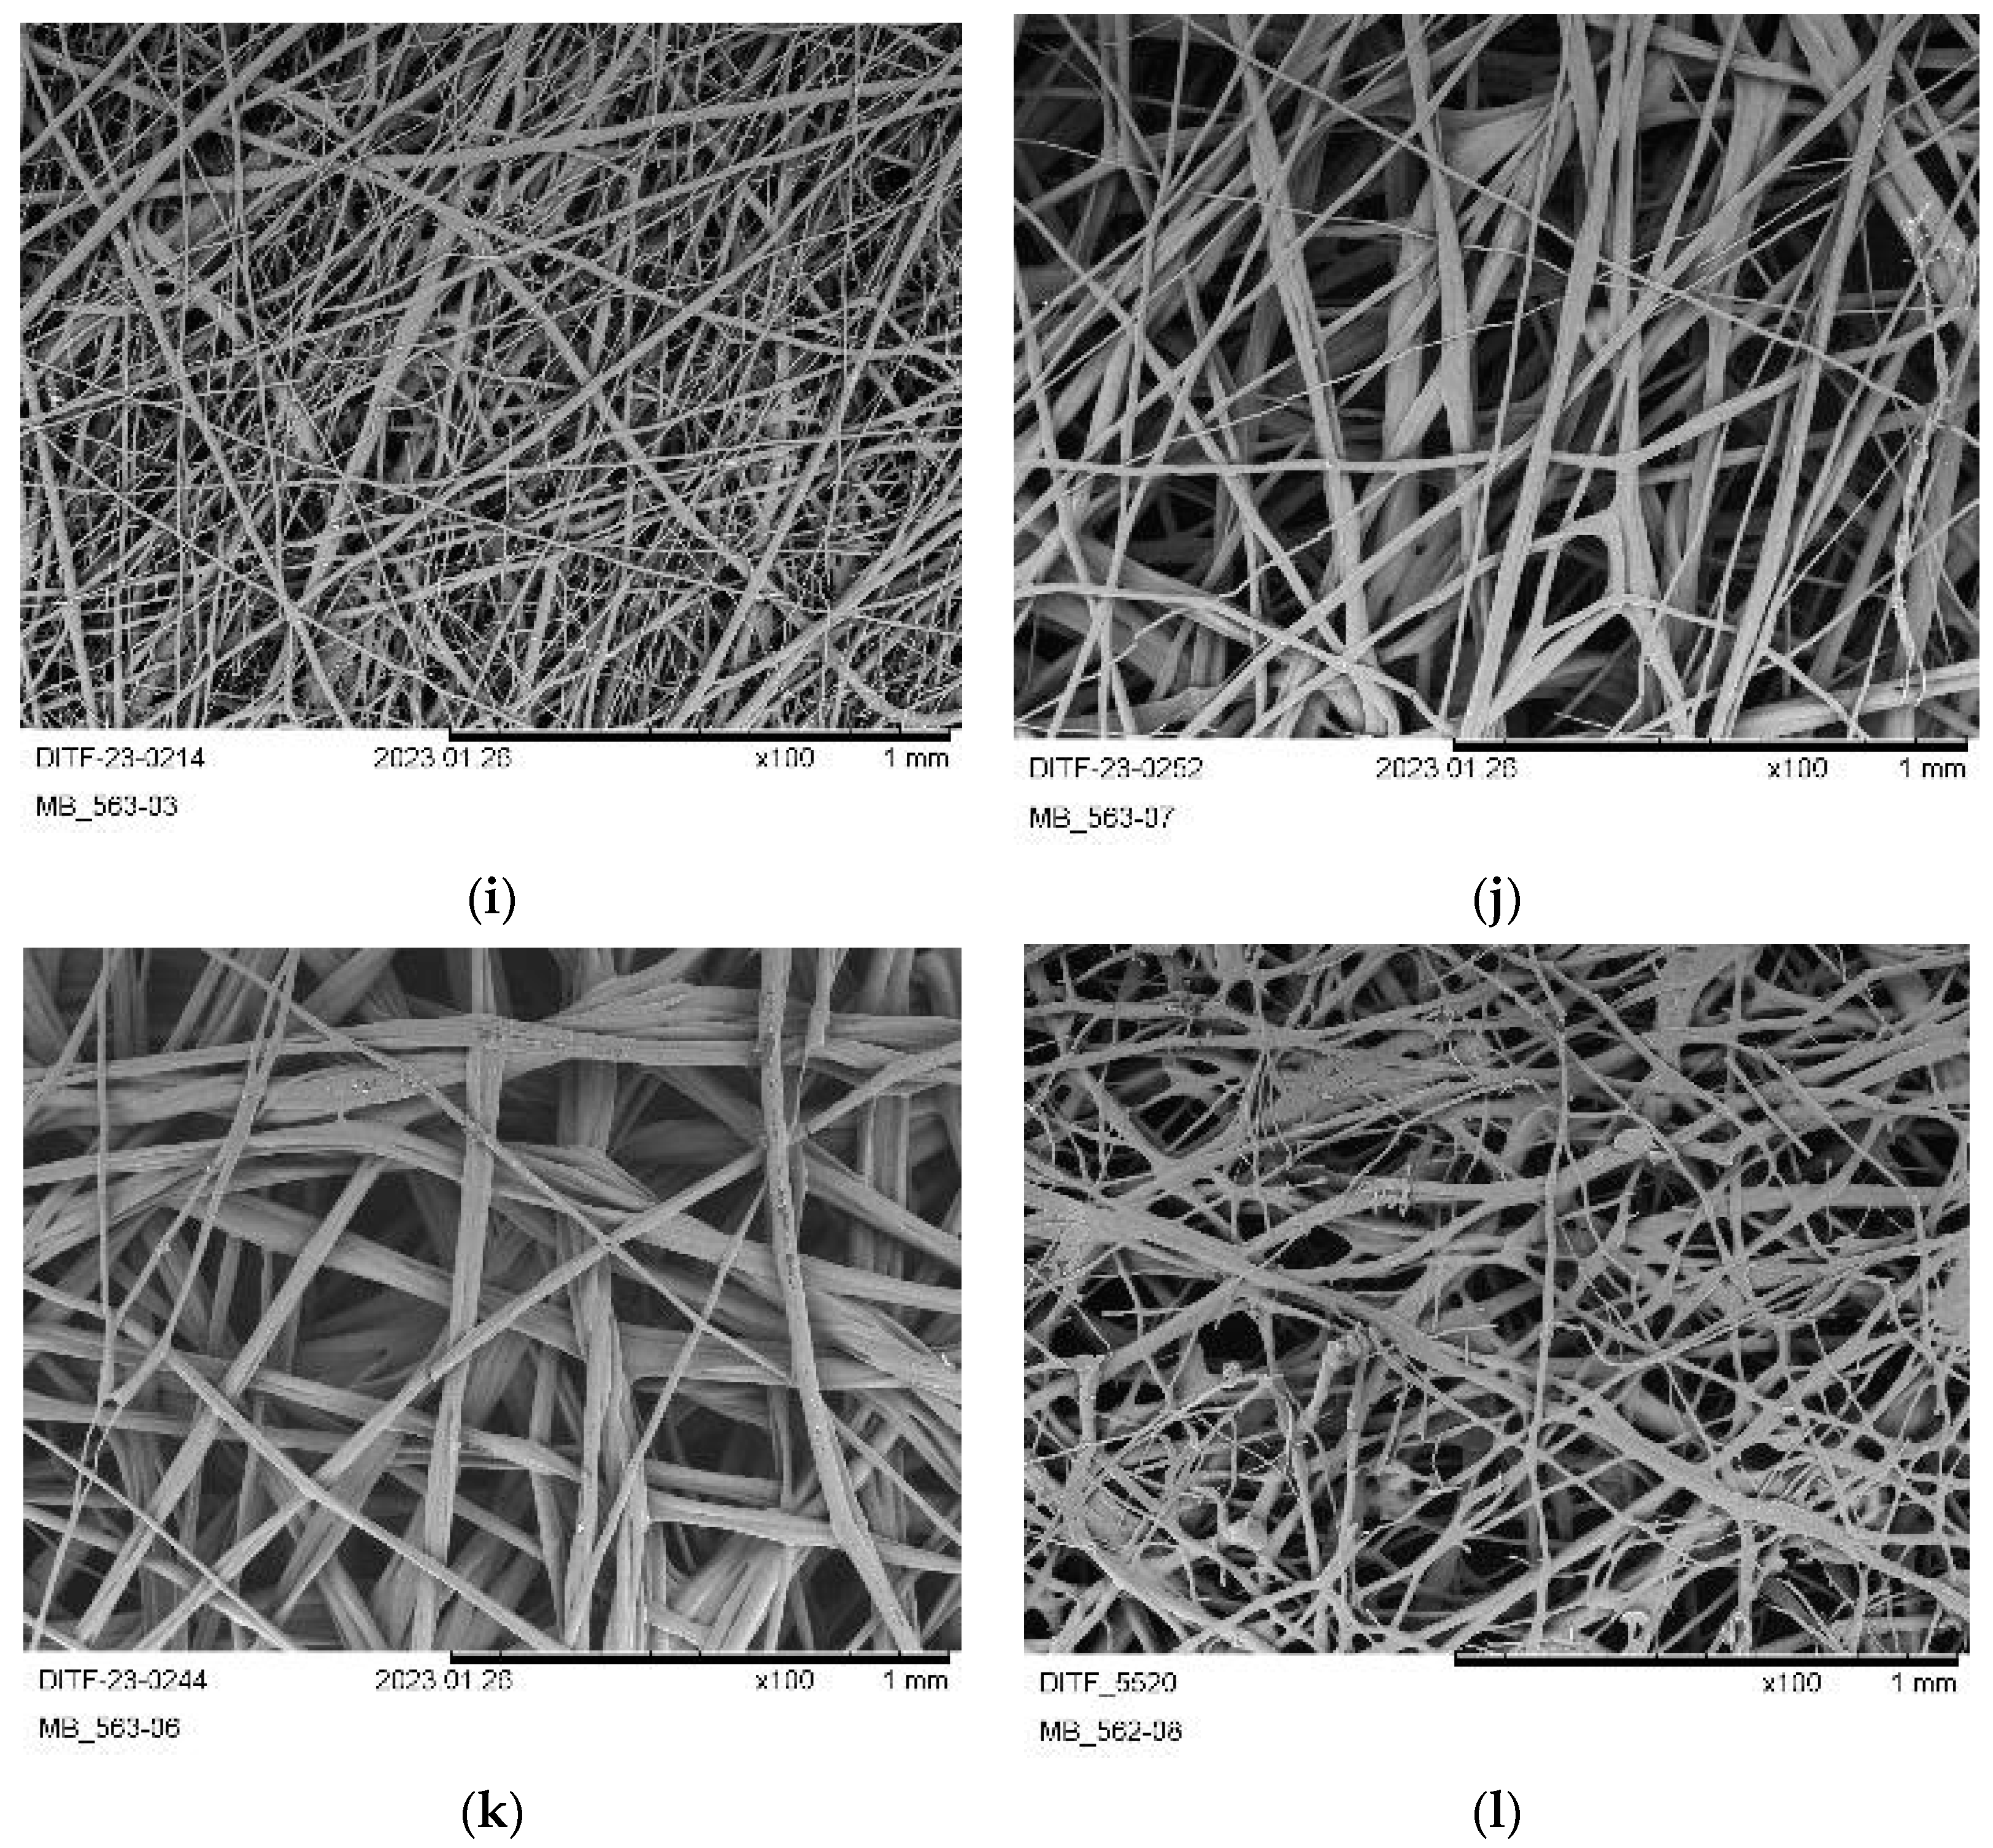
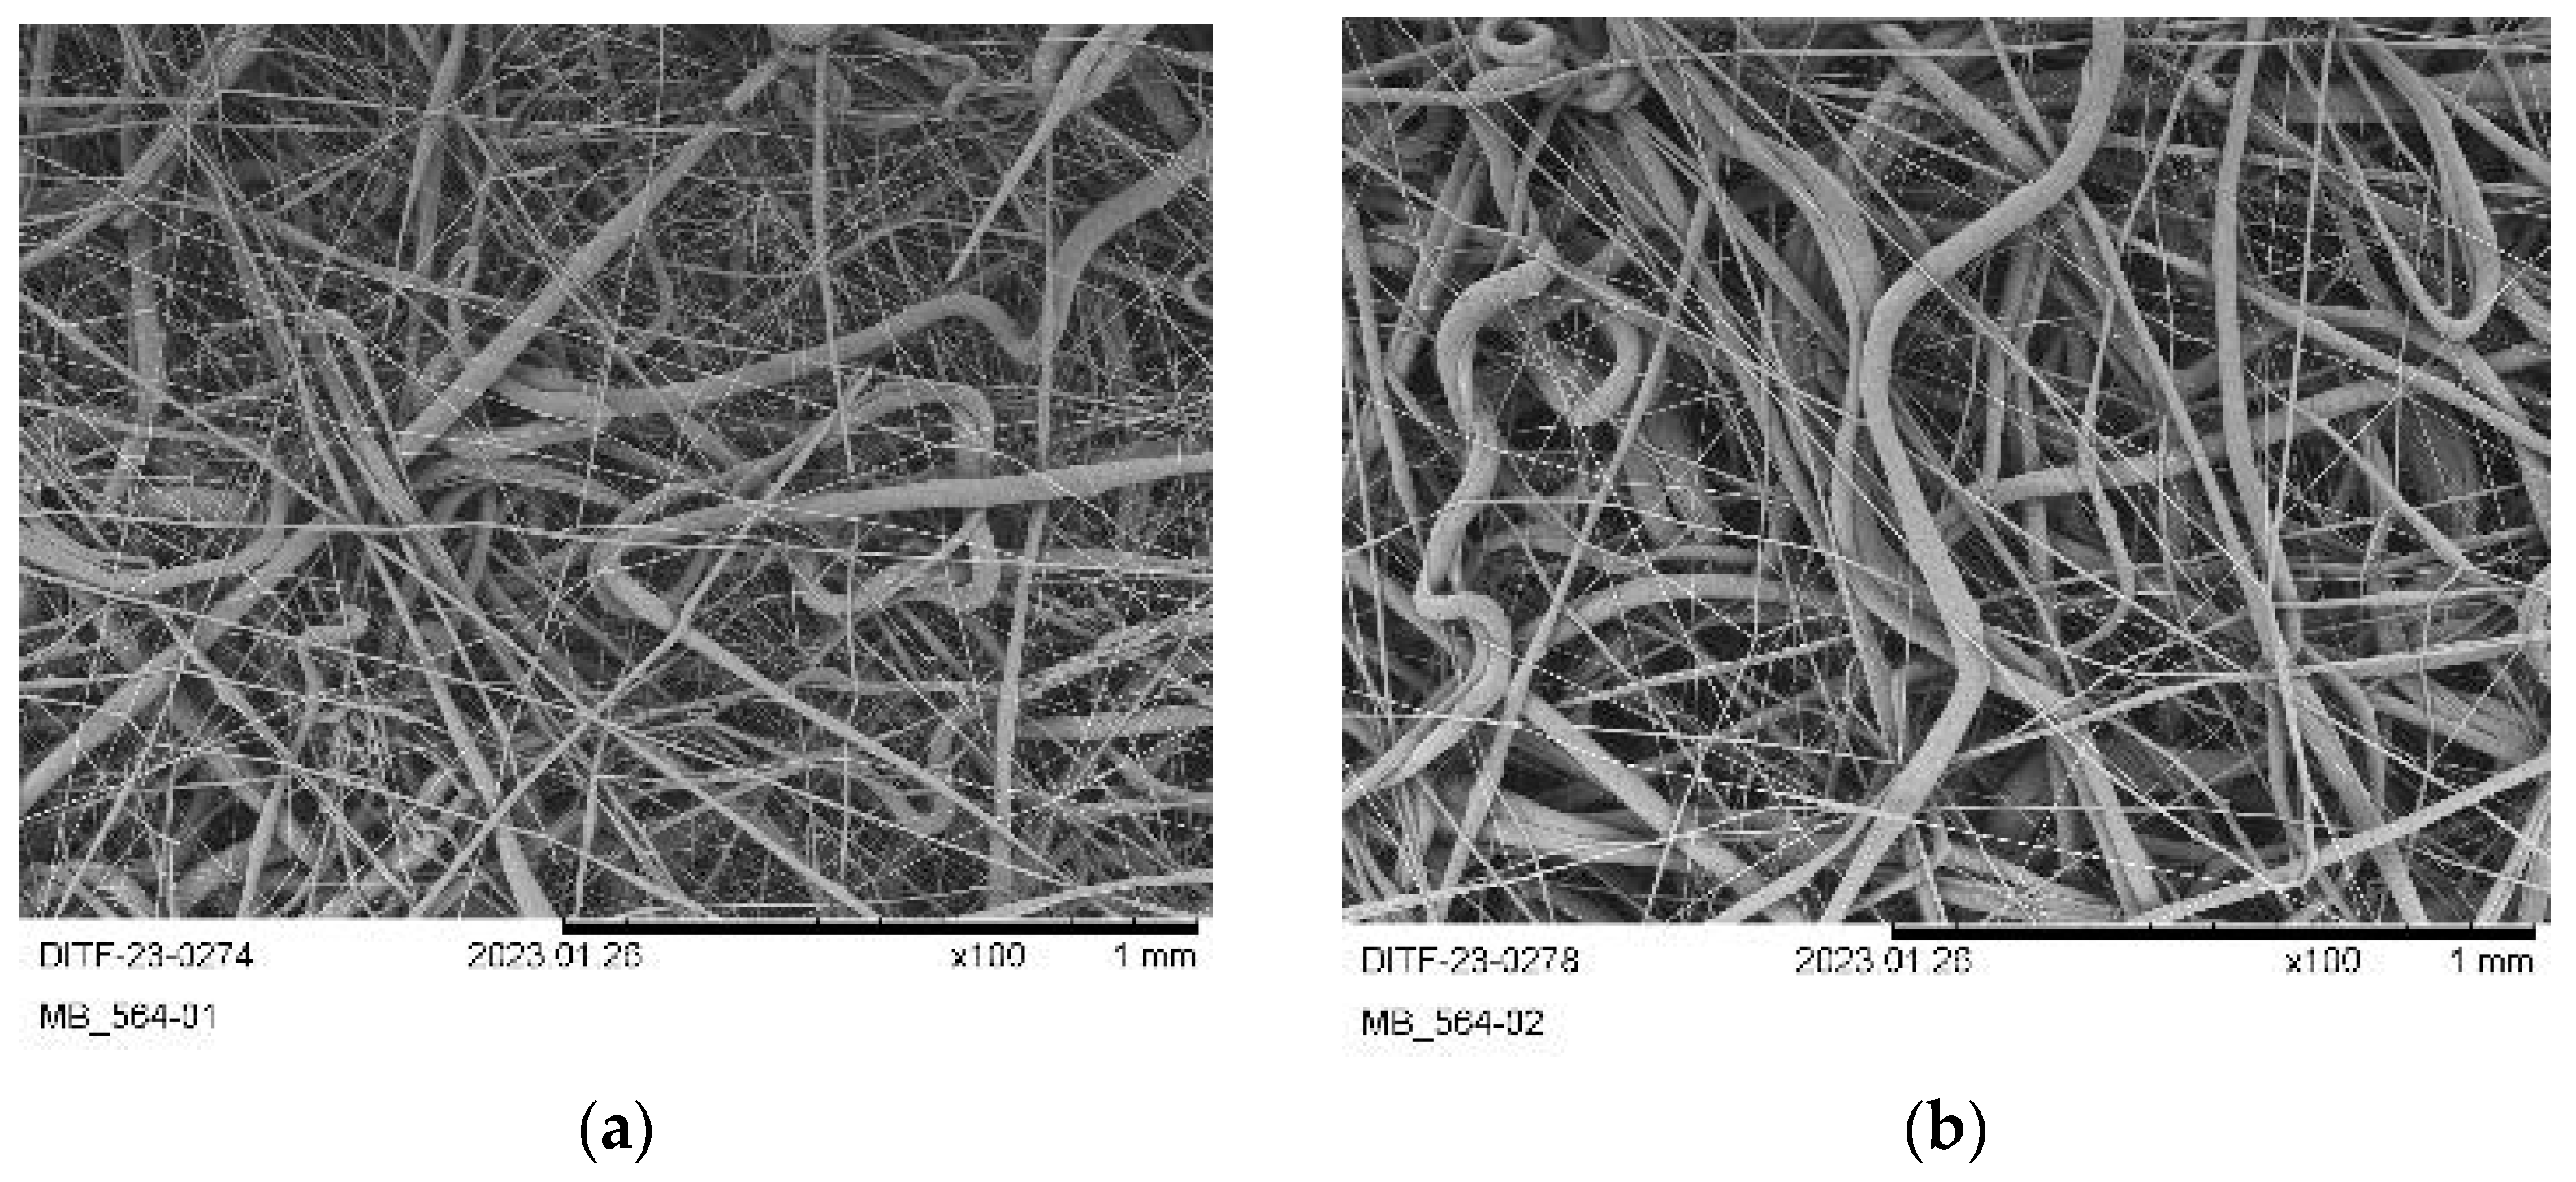
3.3. Nonwoven Characterization
3.4. Evaluation of Degradation in the Meltblown Process
4. Discussion and Conclusions
Author Contributions
Funding
Institutional Review Board Statement
Informed Consent Statement
Data Availability Statement
Acknowledgments
Conflicts of Interest
Appendix A. Raw Material Characteristics

| Sample: | PHB1 | PHB2 | PHB3 | PHBV |
|---|---|---|---|---|
| T (1% mass loss)/°C: | 207.1 | 172.1 | 266.0 | 261.5 |
| T (10% mass loss)/°C: | 276.2 | 237.0 | 282.9 | 284.8 |
| T (50% mass loss)/°C: | 291.4 | 288.4 | 295.1 | 285.6 |
| T (90% mass loss)/°C: | 302.5 | 315.7 | 302.8 | 292.1 |
| T (100% mass loss)/°C: | - | 452.1 | 466.7 | 296.4 |
| Mass loss (200 °C)/%: | 0.8 | 3.2 | 0.3 | <0.2 |
| Tg/°C: | - * | - * | - * | - * |
| Tm,p/°C: | 167.8 | 166.2 | 176.2 | 173.7 |
| Tm, m/°C: | 156.7 | 146.4 | 167.0 | 161.2 |
| ΔHm/(J·g−1): | 36.5 | 54.9 | 85.8 | 81.1 |
| χc/% | 25 | 38 | 59 | 56 |
Appendix B. Evaluation of Degradation in the Meltblown Process

References
- Vert, M.; Doi, Y.; Hellwich, K.-H.; Hess, M.; Hodge, P.; Kubisa, P.; Rinaudo, M.; Schué, F. Terminology for biorelated polymers and applications (IUPAC Recommendations 2012). Pure Appl. Chem. 2012, 84, 377–410. [Google Scholar] [CrossRef]
- Reddy, C.S.K.; Ghai, R.; Kalia, V.C. Polyhydroxyalkanoates: An overview. Bioresour. Technol. 2003, 87, 137–146. [Google Scholar] [CrossRef] [PubMed]
- Varsha, Y.M.; Savitha, R. Overview on Polyhydroxyalkanoates: A Promising Biopol. J. Microbial. Biochem. Technol. 2011, 3, 99–105. [Google Scholar]
- Sudesh, K.; Abe, H.; Doi, Y. Synthesis, structure and properties of polyhydroxyalkanoates: Biological polyesters. Prog. Polym. Sci. 2000, 25, 1503–1555. [Google Scholar] [CrossRef]
- Mottin, A.C.; Ayres, E.; Oréfice, R.L.; Câmara, J.J.D. What changes in poly(3-hydroxybutyrate)(PHB) when processed as electrospun nanofibers or thermo-compression molded film? Mater. Res. 2016, 19, 57–66. [Google Scholar] [CrossRef]
- Madison, L.L.; Huisman, G.W. Metabolic engineering of poly(3-hydroxyalkanoates): From DNA to plastic. Microbiol. Mol. Biol. Rev. 1999, 63, 21–53. [Google Scholar] [CrossRef]
- Możejko-Ciesielska, J.; Kiewisz, R. Bacterial polyhydroxyalkanoates: Still fabulous? Microbiol. Res. 2016, 192, 271–282. [Google Scholar] [CrossRef]
- Verlinden, R.A.; Hill, D.J.; Kenward, M.A.; Williams, C.D.; Radecka, I. Bacterial synthesis of biodegradable polyhydroxyalkanoates. J. Appl. Microbiol. 2007, 102, 1437–1449. [Google Scholar] [CrossRef]
- Hufenus, R.; Reifler, F.A.; Maniura-Weber, K.; Spierings, A.; Zinn, M. Biodegradable bicomponent fibers from renewable sources: Melt-spinning of poly(lactic acid) and poly[(3-hydroxybutyrate)-co-(3-hydroxyvalerate)]. Macromol. Mater. Eng. 2012, 297, 75–84. [Google Scholar] [CrossRef]
- Schmack, G.; Jehnichen, D.; Vogel, R.; Tändler, B. Biodegradable fibers of poly(3-hydroxybutyrate) produced by high-speed melt spinning and spin drawing. J. Polym. Sci. B Polym. Phys. 2000, 38, 2841–2850. [Google Scholar] [CrossRef]
- Zinn, M.; Hany, R. Tailored material properties of polyhydroxyalkanoates through biosynthesis and chemical modification. Adv. Eng. Mater. 2005, 7, 408–411. [Google Scholar] [CrossRef]
- Boopathy, R. Factors limiting bioremediation technologies. Bioresour. Technol. 2000, 74, 63–67. [Google Scholar] [CrossRef]
- Lee, S.Y. Plastic bacteria? Progress and prospects for polyhydroxyalkanoate production in bacteria. Trends Biotechnol. 1996, 14, 431–438. [Google Scholar] [CrossRef]
- Vogel, R.; Tändler, B.; Voigt, D.; Jehnichen, D.; Häußler, L.; Peitzsch, L.; Brünig, H. Melt spinning of bacterial aliphatic polyester using reactive extrusion for improvement of crystallization. Melt spinning of bacterial aliphatic polyester using reactive extrusion for improvement of crystallization. Macromol. Biosci. 2007, 7, 820–848. [Google Scholar] [CrossRef] [PubMed]
- Environment Australia, M. Biodegradable Plastics—Developments and Environmental Impacts NOLAN-ITU Pty Ltd. 2002. Available online: http://biblioteca.anipac.mx/wp-content/uploads/2016/09/0065_Environment_Australia_Biodegradable_Plastics-%E2%80%93Developments_and_Environmental_Impacts.pdf (accessed on 21 August 2023).
- Freier, T.; Kunze, C.; Nischan, C.; Kramer, S.; Sternberg, K.; Sass, M.; Hopt, U.T.; Schmitz, K.P. In vitro and in vivo degradation studies for development of a biodegradable patch based on poly(3-hydroxybutyrate). Biomaterials 2002, 23, 2649. [Google Scholar] [CrossRef] [PubMed]
- Koch, M.; Forchhammer, K. Polyhydroxybutyrate: A useful product of chlorotic cyanobacteria. Microb. Physiol. 2021, 31, 67–77. [Google Scholar] [CrossRef]
- Sudesh, K.; Taguchi, K.; Doi, Y. Can cyanobacteria be a potential PHA producer? Riken Rev. 2001, 42, 75–76. [Google Scholar]
- Sudesh, K.; Taguchi, K.; Doi, Y. Effect of increased PHA synthase activity on polyhydroxyalkanoates biosynthesis in Synechocystis sp. PCC6803. Int. J. Biol. Macromol. 2002, 30, 97–104. [Google Scholar] [CrossRef]
- McCormick, K.; Kautto, N. The bioeconomy in Europe: An overview. Sustainability 2013, 5, 2589–2608. [Google Scholar] [CrossRef]
- Lemoigne, M. Produits de deshydratation et de polymersation de la acideoxybutyrique. Bull. Soc. Chim. Biol. 1926, 8, 770–782. [Google Scholar]
- Luzier, W. Materials Derived from Biomass Biodegradable Materials. Proc. Natl. Acad. Sci. USA 1992, 89, 839–843. [Google Scholar] [CrossRef] [PubMed]
- Hufenus, R.; Reifler, F.A.; Hänggi, U.J. On the Way to High-Strength Poly(3-hydroxybutyrate)(PHB) Fibers. Available online: https://www.researchgate.net/profile/Rudolf-Hufenus/publication/280942779_On_the_Way_to_High-Strength_Poly3-hydroxybutyrate_PHB_Fibers/links/55cdb88108aeeaab209b58e9/On-the-Way-to-High-Strength-Poly3-hydroxybutyrate-PHB-Fibers.pdf (accessed on 21 August 2023).
- Qin, Q.; Takarada, W.; Kikutani, T. Fiber structure development of PHBH through stress-induced crystallization in high-speed melt spinning process. J. Fiber Sci. Technol. 2017, 73, 49–60. [Google Scholar] [CrossRef]
- Sójka-Ledakowicz, J.; Łatwińska, M.; Kudzin, M.; Klepacz-Smółka, A. A study on obtaining nonwovens using polyhydroxyalkanoates and the melt-blown technique. e-Polymers 2014, 14, 373–380. [Google Scholar] [CrossRef]
- Miyao, Y.; Takarada, W.; Kikutani, T. Improvement of mechanical properties of biodegradable PHBH fibers through high-speed melt spinning process equipped with a liquid isothermal bath. AIP Conf. Proc. 2020, 2289, 020038. [Google Scholar]
- Puppi, D.; Pecorini, G.; Chiellini, F. Biomedical processing of polyhydroxyalkanoates. Bioengineering 2019, 6, 108. [Google Scholar] [CrossRef] [PubMed]
- Lee, C.H.; Sapuan, S.M.; Ilyas, R.A.; Lee, S.H.; Khalina, A. Development and Processing of PLA, PHA, and Other Biopolymers. In Advanced Processing, Properties, and Applications of Starch and Other Bio-Based Polymers ; Al-Oqla, F.M., Sapuan, S.M., Eds.; Elsevier: Amsterdam, The Netherlands, 2020; pp. 47–63. [Google Scholar]
- Van der Walle, G.A.; De Koning, G.J.; Weusthuis, R.A.; Eggink, G. Properties, modifications and applications of biopolyesters. In Biopolyesters; Babel, W., Steinbüchel, A., Eds.; Springer: Berlin/Heidelberg, Germany, 2001; Volume 71, pp. 263–293. [Google Scholar]
- Kurusu, R.S.; Siliki, C.A.; David, E.; Demarquette, N.R.; Gauthier, C.; Chenal, J.M. Incorporation of plasticizers in sugarcane-based poly(3-hydroxybutyrate)(PHB): Changes in microstructure and properties through ageing and annealing. Ind. Crops Prod. 2015, 72, 166–174. [Google Scholar] [CrossRef]
- Xiang, H.; Chen, Z.; Zheng, N.; Zhang, X.; Zhu, L.; Zhou, Z.; Zhu, M. Melt-spun microbial poly(3-hydroxybutyrate-co-3-hydroxyvalerate) fibers with enhanced toughness: Synergistic effect of heterogeneous nucleation, long-chain branching and drawing process. Int. J. Biol. Macromol. 2019, 122, 1136–1143. [Google Scholar] [CrossRef]
- Rodriguez-Contreras, A.R. Recent advances in the use of polyhydroyalkanoates in biomedicine. Bioengineering 2019, 6, 82. [Google Scholar] [CrossRef]
- Van de Velde, K.; Kiekens, P. Biopolymers: Overview of several properties and consequences on their applications. Polym. Test. 2002, 21, 433–444. [Google Scholar] [CrossRef]
- Marcano, A.; Bou Haidar, N.; Marais, S.; Valleton, J.-M.; Duncan, A.C. Designing Biodegradable PHA-Based 3D Scaffolds with Antibiofilm Properties for Wound Dressings: Optimization of the Microstructure/Nanostructure. ACS Biomater. Sci. Eng. 2017, 3, 3654–3661. [Google Scholar] [CrossRef]
- Shishatskaya, E.I.; Nikolaeva, E.D.; Vinogradova, O.N.; Volova, T.G. Experimental wound dressings of degradable PHA for skin defect repair. J. Mater. Sci. Mater. Med. 2016, 27, 165. [Google Scholar] [CrossRef] [PubMed]
- Grigore, M.E.; Grigorescu, R.M.; Iancu, L.; Ion, R.-M.; Zaharia, C.; Andrei, E.R. Methods of synthesis, properties and biomedical applications of polyhydroxyalkanoates: A review. J. Biomater. Sci. Polym. Ed. 2019, 30, 695–712. [Google Scholar] [CrossRef] [PubMed]
- Singh, A.K.; Srivastava, J.K.; Chandel, A.K.; Sharma, L.; Mallick, N.; Singh, S.P. Biomedical applications of microbially engineered polyhydroxyalkanoates: An insight into recent advances, bottlenecks, and solutions. Appl. Microbiol. Biotechnol. 2019, 103, 2007–2032. [Google Scholar] [CrossRef]
- Marchessault, R.H. Tender morsels for bacteria: Recent development in microbial polyester. Trends. Polym. Sci. 1996, 4, 163–168. [Google Scholar]
- Nigmatullin, R.; Thomas, P.; Lukasiewicz, B.; Puthussery, H.; Roy, I. Polyhydroxyalkanoates, a family of natural polymers, and their applications in drug delivery. J. Chem. Technol. Biotechnol. 2015, 90, 1209–1221. [Google Scholar] [CrossRef]
- Saxena, A.; Tiwari, A. Polyhydroxyalkonates: Green Plastics of the Future. Int. J. Biomed. Adv. Res. 2011, 2, 356–367. [Google Scholar] [CrossRef]
- Hinüber, C.; Häussler, L.; Vogel, R.; Brünig, H.; Werner, C. Hollow poly(3-hydroxybutyrate) fibers produced by melt spinning. Macromol. Mater. Eng. 2010, 295, 585–594. [Google Scholar] [CrossRef]
- Tanaka, T.; Fujita, M.; Takeuchi, A.; Suzuki, Y.; Uesugi, K.; Ito, K.; Fujisawa, T.; Doi, Y.; Iwata, T. Formation of highly ordered structure in poly[(r)-3-hydroxybutyrate-co-(r)-3-hydroxyvalerate] high-strength fibers. Macromolecules 2006, 39, 2940–2946. [Google Scholar] [CrossRef]
- Vogel, R.; Voigt, D.; Tändler, B.; Gohs, U.; Häussler, L. Melt Spinning of Poly(3-hydroxybutyrate) for Tissue Engineering Using Electron-Beam-Irradiated Poly(3-hydroxybutyrate) as Nucleation Agent. Macromol. Biosci. 2008, 8, 426–431. [Google Scholar] [CrossRef]
- Iwata, T. Strong fibers and films of microbial polyesters. Macromol. Biosci. 2005, 5, 689–701. [Google Scholar] [CrossRef]
- Iwata, T.; Aoyagi, Y.; Fujita, M.; Yamane, H.; Doi, Y.; Suzuki, Y.; Takeuchi, A.; Uesugi, K. Processing of a strong biodegradable poly[(R)-3-hydroxybutyrate] fiber and a new fiber structure revealed by micro-beam X-ray diffraction with synchrotron radiation. Macromol. Rapid Commun. 2004, 25, 1100–1104. [Google Scholar] [CrossRef]
- Tanaka, T.; Yabe, T.; Teramachi, S.; Iwata, T. Mechanical properties and enzymatic degradation of poly[(R)-3-hydroxybutyrate] fibers stretched after isothermal crystallization near Tg. Polym. Degrad. Stab. 2007, 92, 1016–1024. [Google Scholar] [CrossRef]
- Berezina, N. Enhancing the 3-hydroxyvalerate component in bioplastic PHBV production by Cupriavidus necator. Biotechnol. J. 2012, 7, 2304–2309. [Google Scholar] [CrossRef] [PubMed]
- Köse, G.T.; Kenar, H.; Hasırcı, N.; Hasırcı, V. Macroporous poly(3-hydroxybutyrate-co-3-hydroxyvalerate) matrices for bone tissue engineering. Biomaterials 2003, 24, 1949–1958. [Google Scholar] [CrossRef] [PubMed]
- Chiellini, E.; Solaro, R. Biodegradable polymeric materials. Adv. Mater. 1996, 8, 305–313. [Google Scholar] [CrossRef]
- Hammond, T.; Liggat, J.J. Degradable Polymers—Principles and Applications; Scott, G., Gilead, D., Eds.; Springer Science + Business Media: Dordrecht, The Netherlands, 1995; pp. 88–111. [Google Scholar]
- El-Hadi, A.; Schnabel, R.; Straube, E.; Müller, G.; Henning, S. Correlation between degree of crystallinity, morphology, glass temperature, mechanical properties and biodegradation of poly (3-hydroxyalkanoate) PHAs and their blends. Polym. Test. 2002, 21, 665–674. [Google Scholar] [CrossRef]
- Pietrosanto, A.; Scarfato, P.; Di Maio, L.; Incarnato, L. Development of PLA/PHB blown films with improved performance for food packaging applications. Chemical. Eng. Trans. 2021, 87, 91–96. [Google Scholar]
- Arrieta, M.P.; Samper, M.D.; Aldas, M.; López, J. On the use of PLA-PHB blends for sustainable food packaging applications. Materials 2017, 10, 1008. [Google Scholar] [CrossRef]
- Höhnemann, T.; Schnebele, J.; Arne, W.; Windschiegl, I. Nanoval Technology—An Intermediate Process between Meltblown and Spunbond. Materials 2023, 16, 2932. [Google Scholar] [CrossRef]
- Dutton, K.C. Overview and analysis of the meltblown process and parameters. J. Text. Appar. Technol. Manag. 2009, 6, 1–24. [Google Scholar]
- Bhat, G.S.; Malkan, S.R. Polymer-laid web formation. In Handbook of Nonwovens; Russel, S.J., Ed.; Woodhead Publishing Sawston: Cambridge, UK, 2007; pp. 143–200. [Google Scholar]
- Windschiegl, I.; Dauner, M. Final Report, AiF; FF Energie; Deutsche Institute für Textil-und Faserforschung: Denkendorf, Germany, 2020. [Google Scholar]
- Rieger, C. Entwicklung eines Herstellungsverfahrens für Hochtemperaturstabile Meltblow-Vliesstoffe aus Polyethylenterephtalat und deren Charakterisierung. Ph.D. Thesis, Universität of Stuttgart, Stuttgart, Germany, 2017. [Google Scholar]
- Fourné, F. Synthetic Fibers—Mashines and Equipment Manufacture, Properties, 3rd ed.; Carl Hanser Verlag: Munich, Germany, 1999. [Google Scholar]
- Müller, D.H.; Krobjilowski, A. Meltblown fabrics from biodegradable polymers. Int. Nonwovens J. 2001, 1, 1558925001os-1000106. [Google Scholar] [CrossRef]
- Jafari, M.; Shim, E.; Joijode, A. Fabrication of Poly(lactic acid) filter media via the meltblowing process and their filtration performances: A comparative study with polypropylene meltblown. Sep. Purif. Technol. 2021, 260, 118185. [Google Scholar] [CrossRef]
- Hammonds, R.L.; Gazzola, W.H.; Benson, R.S. Physical and thermal characterization of polylactic acid meltblown nonwovens. J. Appl. Polym. Sci. 2014, 131(15), 40593. [Google Scholar] [CrossRef]
- Gazzola, W.H.; Benson, R.S.; Carver, W. Meltblown Polylactic Acid Nanowebs as a Tissue Engineering Scaffold. Ann. Plast. Surg. 2019, 83, 716–721. [Google Scholar] [CrossRef] [PubMed]
- Jafari, M. Structure and Filtration Properties of PLA Meltblown Air Filters. Ph.D. Thesis, North Carolina State University, Foxhall, Raleigh, NC, USA, 2017. [Google Scholar]
- Messiry, M.E.; Bhat, G.; Eloufy, A.; Latif, S.A.; Ayman, Y. Acoustical absorptive properties of meltblown nonwovens for textile machinery. Text. Res. J. 2021, 91, 1341–1353. [Google Scholar] [CrossRef]
- Feng, S.; Jiao, X.N. The application of PLA resin on nonwovens production. Adv. Mater. Res. 2011, 332, 1239–1242. [Google Scholar] [CrossRef]
- Kann, Y.; Whitehouse, R.S. Production of Nonwoven Materials from Polyhydroxyalkanoate. U.S. Patent US2011025639A, 20 October 2011. [Google Scholar]
- Telles. Mirel™ F1006 Injection Molding Grade PHA Bioplastic. Available online: https://www.matweb.com/search/datasheettext.aspx?matguid=f72aa356284d4d59bb2caf02ab4b103f (accessed on 4 May 2023).
- TianAn-Biopolymer. ENMAT™ Thermoplastics Resin Y3000P—Technical Data Sheet & Processing (17.02.2021). Available online: https://pharadox.com/media/ipyp2l1t/tds_y3000p.pdf (accessed on 4 May 2023).
- TianAn-Biopolymer. ENMAT™ Thermoplastics Resin Y1000P—Technical Data Sheet & Processing Guide (17.02.2021). Available online: https://pharadox.com/media/n5mb5yi0/tds_y1000p.pdf (accessed on 20 August 2023).
- Biomer. Mechanical Data. Available online: https://www.biomer.de/MechDatE.html (accessed on 10 February 2023).
- Laycock, B.; Halley, P.; Pratt, S.; Werker, A.; Lant, P. The chemomechanical properties of microbial polyhydroxyalkanoates. Prog. Polym. Sci. 2014, 39, 536–583. [Google Scholar] [CrossRef]
- MAVIfiber2d (Fraunhofer ITWM, 2022). Available online: https://www.itwm.fraunhofer.de/de/abteilungen/bv/produkte-und-leistungen/mavi/mavifiber2d.html (accessed on 30 November 2022).
- Altendorf, H.; Dida, S.; Batt, T. Automatische Bestimmung von Faserradienverteilungen. In Forum Bildverarbeitung; Kitson, R.E., Ed.; Scientific Publishing: Regensburg, Germany, 2010. [Google Scholar]
- Easwaran, P.; Lehmann, M.J.; Wirjadi, O.; Prill, T.; Didas, S.; Redenbach, C. Automatic Fiber Thickness Measurement in SEM Images Validated Using Synthetic Data. Chemical Eng. Technol. 2016, 39, 395–402. [Google Scholar] [CrossRef]
- Aoyagi, Y.; Yamashita, K.; Doi, Y. Thermal degradation of poly[(R)-3-hydroxybutyrate], poly[ε-caprolactone], and poly[(S)-lactide]. Polym. Degrad. Stab. 2002, 76, 53–59. [Google Scholar] [CrossRef]
- Erceg, M.; Kovacic, T.; Klaric, I. Thermal degradation of poly(3-hydroxybutyrate) plasticized with acetyl tributyl citrate. Polym. Degrad. Stab. 2005, 90, 313–318. [Google Scholar] [CrossRef]
- Kawalec, M.; Adamus, G.; Kurcok, P.; Kowalczuk, M.; Foltran, I.; Focarete, M.L.; Scandola, M. Carboxylate-induced degradation of poly(3-hydroxybutyrate)s. Biomacromolecules 2007, 8, 1053–1058. [Google Scholar] [CrossRef] [PubMed]
- Bordes, P.; Hablot, E.; Pollet, E.; Avérous, L. Effect of clay organomodifiers on degradation of polyhydroxyalkanoates. Polym. Degrad. Stab. 2009, 94, 789–796. [Google Scholar] [CrossRef]
- Carrasco, F.; Dionisi, D.; Martinelli, A.; Majone, M. Thermal stability of poly-hydroxyalkanoates. J. Appl. Polym. Sci. 2006, 100, 2111–2112. [Google Scholar] [CrossRef]
- Li, S.-D.; Yu, P.H.; Cheung, M.K. Thermogravimetric analysis of poly(3-hydrox-ybutyrate) and poly(3-hydroxybutyrate-co-3-hydroxyvalerate). J. Appl. Polym. Sci. 2001, 80, 2237–2244. [Google Scholar] [CrossRef]
- He, J.-D.; Cheung, M.K.; Yu, P.H.; Chen, G.-Q. Thermal analyses of poly(3-hydrox-ybutyrate), poly(3-hydroxybutyrate-co-3-hydroxyvalerate), and poly(3-hydroxybutyrate-co-3-hydroxyhexanoate). J. Appl. Polym. Sci. 2001, 82, 90–98. [Google Scholar] [CrossRef]
- Fabri, D.; Guan, J.; Cesàro, A. Crystallisation and melting behaviour of poly (3-hydroxybutyrate) in dilute solution: Towards an understanding of physical gels. Thermochim. Acta 1998, 32, 3–16. [Google Scholar] [CrossRef]
- Bezerra, E.B.; Leite, A.M.; Araújo, E.M.; Mélo, T.J. Preparation and characterization of membranes obtained from polymer blends of polyamide. Polímeros 2014, 24, 381–387. [Google Scholar] [CrossRef]
- Parker, J.P.; Lindenmeyer, P.H. On the crystal structure of nylon 6. J. Appl. Polym. Sci. 1977, 21, 821–837. [Google Scholar] [CrossRef]
- Höhnemann, T. Generation of Monofilaments with Defined Cross-Sectional Shape from Polymer Melt-Correlation of Die Layout, Polymer Morphology and Process Parameters with the Bending Behavior; Friedrich-Alexander-Universität Erlangen-Nürnberg (FAU): Erlangen, Germany, 2022. [Google Scholar]
- Awaja, F.; Daver, F.; Kosior, E.; Cser, F. The effect of chain extension on the thermal behaviour and crystallinity of reactive extruded recycled PET. J. Therm. Anal. Calorim. 2004, 3, 864–884. [Google Scholar] [CrossRef]
- Karayannidis, G.P.; Psalida, E.A. Chain extension of recycled poly(ethyleneterephtalate) with 2,2′-(1,4-phenylene)bis(2-oxzoline). J. Appl. Polym. Sci. 2000, 77, 2206–2211. [Google Scholar] [CrossRef]
- Cser, F.; Rasoul, F.; Kosior, E. Modulated differential scanning calorimetry. J. Therm. Anal. 1997, 50, 727–744. [Google Scholar] [CrossRef]
- Stein, R.S.; Misra, A. Morphological studies on polybutylene terephtalate. J. Polym. Sci. A-2 Polym. Phys. 1980, 18, 327–342. [Google Scholar] [CrossRef]


| Material: | PHB-1 | PHB-2 | PHB-3 | PHBV |
|---|---|---|---|---|
| ηt0 (175 °C)/(Pa·s): | 153 | 222 | 697 | 12,700 |
| ηto (180 °C)/(Pa·s): | 129 | 137 | 484 | 434 |
| G′t0 (180 °C)/Pa: | 93 | 250 | 761 | 684 |
| G″t0 (180 °C)/Pa: | 1114 | 1354 | 4180 | 4287 |
| MFI/(g·10 min−1) 1: | 334 | 385 | 88 | 74 |
| Material: | PHB-1 | PHB-2 | PHB-3 | PHBV |
|---|---|---|---|---|
| Tproc/°C: | 175 | (175) 180 | (185) 190 | (195) 200 |
| ηto (Tproc)/(Pa·s): | 153 | 179 | 287 | 227 |
| η300s (Tproc)/(Pa·s): | 127 | 110 | 113 | 49 |
| G′t0 (Tproc)/Pa: | 142 | 400 | 275 | 199 |
| G″t0 (Tproc)/Pa: | 1580 | 1753 | 2856 | 2262 |
| Trial | Tmelt/ °C | Tair/°C | Throughput/(g·ho−1·min−1) | Die-Pressure/Bar | DCD/mm | Air Volume Flow/(Nm3·h−1) | Processable | Limitation(s) |
|---|---|---|---|---|---|---|---|---|
| PHB1-01 | 175 | 180 | 0.109 | 18.0 | 500 | 220 | yes | Post-crystallization Fabrics not manageable due to crumbling disintegration |
| PHB1-02 | 175 | 180 | 0.077 | 12,6 | 500 | 220 | yes | |
| PHB1-03 | 185 | 180 | 0.077 | 7.7 | 500 | 220 | yes | |
| PHB1-04 | 185 | 180 | 0.109 | 12.9 | 500 | 220 | Yes | |
| PHB2-01 | 175 | 180 | 0.077 | 25.4 | 350 | 325 | yes | - |
| PHB2-02 | 175 | 180 | 0.077 | 25.0 | 350 | 220 | yes | fibers flow together |
| PHB2-03 | 175 | 180 | 0.039 | 6.0 | 350 | 220 | yes | fibers flow together |
| PHB2-04 | 175 | 180 | 0.039 | 6.0 | 350 | 325 | limited | fabric glues to belt |
| PHB2-05 | 180 | 185 | 0.077 | 20.8 | 500 | 220 | yes | shot formation |
| PHB2-06 | 180 | 175 | 0.077 | 21.7 | 500 | 220 | Yes | - |
| PHB2-07 | 180 | 175 | 0.077 | 21.8 | 500 | 325 | Yes | - |
| PHB2-08 | 180 | 175 | 0.039 | 8.4 | 500 | 220 | Yes | - |
| PHB2-09 | 180 | 170 | 0.077 | 31.0 | 500 | 220 | Yes | - |
| PHB2-10 | 180 | 165 | 0.077 | 27.4 | 500 | 220 | Yes | - |
| PHB2-11 | 185 | 180 | 0.077 | 22.5 | 500 | 220 | limited | Shot formation and gluing to conveyor |
| PHB3-01 | 185 | 180 | 0.039 | 35.0 | 500 | 325 | yes | - |
| PHB3-02 | 185 | 180 | 0.039 | 38.7 | 500 | 220 | limited | Adhesions at the die/shots |
| PHB3-03 | 190 | 185 | 0.051 | 36.6 | 500 | 325 | yes | shots |
| PHBV-01 | 195 | 190 | 0.051 | 41.6 | 500 | 325 | yes | - |
| PHBV-02 | 200 | 195 | 0.051 | 26.4 | 500 | 325 | yes | - |
| Sample | Base Weight/ | Thickness/ | Fiber Diameter | Air Permeability | Tenacity | Elongation 1 | Modulus | ||
|---|---|---|---|---|---|---|---|---|---|
| (g·m2) | CV/ % | µm | Median/µm | Mean/µm | /(l·m−2·h−1) | MD/CD /(N·mm2) | MD/CD /% | MD/CD /(N·mm2) | |
| PHB1-01 | - 2 | - 2 | - 2 | 9.7 | 11.4 | - 2 | - 2 | - 2 | - 2 |
| PHB1-02 | - 2 | - 2 | - 2 | 11.2 | 12.3 | - 2 | - 2 | - 2 | - 2 |
| PHB1-03 | - 2 | - 2 | - 2 | 10.4 | 10.9 | - 2 | - 2 | - 2 | - 2 |
| PHB1-04 | - 2 | - 2 | - 2 | 13.2 | 12.0 | - 2 | - 2 | - 2 | - 2 |
| PHB2-01 | 87 | 22 | 252 ± 57 | 5.2 | 7.7 | 1710 ± 300 | 1.3 ± 0.2/0.5 ± 0.1 | 3 ± 1/3 ± 1 | 85 ± 13/27± 6 |
| PHB2-02 | 91 | 16 | 360 ± 79 | 7.1 | 12.3 | 5910 ± 570 | 0.6 ± 0.1/0.3 ± 0.1 | 2 ± 1/2 ± 0 | 35 ± 3/25 ± 6 |
| PHB2-03 | 86 | 11 | 451 ± 73 | 11.2 | 16.0 | 7760 ± 960 | 0.5 ± 0.1/0.3 ± 0.1 | 2 ± 0/2 ± 0 | 30 ± 2/28 ± 4 |
| PHB2-04 | 88 | 13 | 290 ± 42 | 7.0 | 9.7 | 2200 ± 330 | 1.2 ± 0.1/0.6 ± 0 | 3 ± 1/3 ± 0 | 74 ± 8/32 ± 4 |
| PHB2-05 | 105 | 16 | 331 ± 31 | 5.0 | 8.5 | 2860 ± 370 | 0.4 ± 0.1/0.3 ± 0 | 2 ± 1/2 ± 3 | 28 ± 4/25 ± 2 |
| PHB2-06 | 94 | 14 | 346 ± 43 | 13.7 | 16.2 | 4640 ± 880 | 0.7 ± 0.1/0.5 ± 0.1 | 3 ± 1/3 ± 1 | 39 ± 7/28 ± 4 |
| PHB2-07 | 99 | 16 | 299 ± 40 | 7.3 | 12.7 | 1550 ± 430 | 1.4 ± 0/0.7 ± 0.2 | 3 ± 0/3 ± 1 | 76 ± 5/38 ± 7 |
| PHB2-08 | 93 | 11 | 235 ± 19 | 4.6 | 7.0 | 680 ± 100 | 1.6 ± 0.1/0.9 ± 0.1 | 4 ± 1/5 ± 1 | 92 ± 4/47 ± 2 |
| PHB2-09 | 98 | 17 | 349 ± 41 | 17.1 | 19.6 | 4660 ± 1090 | 0.6 ± 0.2/0.4 ± 0.1 | 3 ± 0/3 ± 1 | 26 ± 4/28 ± 2 |
| PHB2-10 | 96 | 14 | 374 ± 60 | 14.4 | 20.5 | 5730 ± 1400 | 0.8 ± 0.2/0.4 ± 0.1 | 3 ±1/3 ± 1 | 40 ± 6/24 ± 4 |
| PHB2-11 | 80 | 9 | 194 ± 24 | 9.4 | 13.4 | 1500 ± 70 | 1.2 ± 0.2/0.5 ± 0.1 | 2 ± 0/2 ± 1 | 71 ± 15/35 ± 7 |
| PHB3-01 | 98 | 14 | 406 ± 32 | 2.6 | 5.0 | 1620 ± 180 | 1.0 ± 0/0.7 ± 0.1 | 1 ± 0/2 ± 1 | 96 ± 7/41 ± 5 |
| PHB3-02 | 100 | 14 | 476 ± 80 | 4.7 | 10.1 | 2670 ± 20 | 0.9 ± 0.1/0.7 ± 0.1 | 1 ± 0/2 ± 0 | 82 ± 11/44 ± 1 |
| PHB3-03 | 95 | 15 | 409 ± 28 | 4.0 | 7.5 | 2160 ± 350 | 0.8 ± 0.1/0.6 ± 0.2 | 2 ± 1/2 ± 1 | 67 ± 3/45 ± 23 |
| PHBV-01 | 126 | 14 | 661 ± 114 | 3.4 | 5.6 | 2800 ± 110 | 0.5 ± 0.1/0.5 ± 0.1 | 1 ± 1/2 ± 1 | 40 ± 6/40 ± 2 |
| PHBV-02 | 120 | 8 | 566 ± 79 | 3.5 | 4.8 | 2030 ± 340 | 0.8 ± 0.1/0.3 ± 0 | 1 ± 0/1 ± 1 | 61 ± 5/31 ± 5 |
| Material: | PHB-2 | PHB-3 | PHBV |
|---|---|---|---|
| Virgin granule: | |||
| Mn/(g·mol−1): | 78,300 | 113,300 | 131,800 |
| Mw/(g·mol−1): | 666,600 | 499,500 | 489,700 |
| ∅/-: | 8.51 | 4.41 | 4.78 |
| MFI (190 °C, 2.16 kg): | 385 | 88 | 74 |
| Meltblown material: | |||
| Mn/(g·mol−1): | 65,500 | 58,600 | 66,500 |
| Mw/(g·mol−1): | 402,300 | 203,500 | 236,200 |
| ∅/-: | 6.14 | 3.47 | 3.55 |
| MFI (190 °C, 2.16 kg): | >600 1 | 222 | 201 |
| MFI (185 °C, 2.16 kg): | 482 | - | - |
Disclaimer/Publisher’s Note: The statements, opinions and data contained in all publications are solely those of the individual author(s) and contributor(s) and not of MDPI and/or the editor(s). MDPI and/or the editor(s) disclaim responsibility for any injury to people or property resulting from any ideas, methods, instructions or products referred to in the content. |
© 2023 by the authors. Licensee MDPI, Basel, Switzerland. This article is an open access article distributed under the terms and conditions of the Creative Commons Attribution (CC BY) license (https://creativecommons.org/licenses/by/4.0/).
Share and Cite
Höhnemann, T.; Windschiegl, I. Influence of Rheological and Morphological Characteristics of Polyhydroxybutyrate on Its Meltblown Process Behavior. Materials 2023, 16, 6525. https://doi.org/10.3390/ma16196525
Höhnemann T, Windschiegl I. Influence of Rheological and Morphological Characteristics of Polyhydroxybutyrate on Its Meltblown Process Behavior. Materials. 2023; 16(19):6525. https://doi.org/10.3390/ma16196525
Chicago/Turabian StyleHöhnemann, Tim, and Ingo Windschiegl. 2023. "Influence of Rheological and Morphological Characteristics of Polyhydroxybutyrate on Its Meltblown Process Behavior" Materials 16, no. 19: 6525. https://doi.org/10.3390/ma16196525
APA StyleHöhnemann, T., & Windschiegl, I. (2023). Influence of Rheological and Morphological Characteristics of Polyhydroxybutyrate on Its Meltblown Process Behavior. Materials, 16(19), 6525. https://doi.org/10.3390/ma16196525